 Wouter Oomens
 Joseph H. R. Maes
 Fred Hasselman
 Jos I. M. Egger
- 1Centre of Excellence for Neuropsychiatry, Vincent van Gogh Institute for Psychiatry, Venray, Netherlands
- 2Donders Institute for Brain, Cognition and Behavior, Radboud University, Nijmegen, Netherlands
- 3Learning and Plasticity, Behavioral Science Institute, Radboud University, Nijmegen, Netherlands
- 4School of Pedagogical and Educational Science, Radboud University, Nijmegen, Netherlands
The concept of executive functions plays a prominent role in contemporary experimental and clinical studies on cognition. One paradigm used in this framework is the random number generation (RNG) task, the execution of which demands aspects of executive functioning, specifically inhibition and working memory. Data from the RNG task are best seen as a series of successive events. However, traditional RNG measures that are used to quantify executive functioning are mostly summary statistics referring to deviations from mathematical randomness. In the current study, we explore the utility of recurrence quantification analysis (RQA), a non-linear method that keeps the entire sequence intact, as a better way to describe executive functioning compared to traditional measures. To this aim, 242 first- and second-year students completed a non-paced RNG task. Principal component analysis of their data showed that traditional and RQA measures convey more or less the same information. However, RQA measures do so more parsimoniously and have a better interpretation.
Introduction
In experimental and clinical studies on cognition, the concept of “executive functions” plays a dominant role [see e.g., Jurado and Rosselli (2007), for an overview]. Executive functioning is generally used as an umbrella term to refer to a set of higher-order cognitive processes that allow an individual to exert control over lower cognitive processes. However, discussions about the exact nature of these higher-order processes and their neural correlates are ongoing (e.g., Gilbert and Burgess, 2008; McCabe et al., 2010; Packwood et al., 2011; Tsuchida and Fellows, 2013; Anastas et al., 2014).
One task that has seen some use in the investigation of executive functioning is the random number generation (RNG) task. In this task, participants are instructed to generate a random sequence of letters or digits. Executive functioning can be assessed using this task by measuring departures from randomness. Specifically, the observed order in human-generated sequences is often attributed to imperfections of the central executive and working memory (Baddeley, 1966; Brugger, 1997; Baddeley et al., 1998), in particular to the inability to inhibit stereotyped (i.e., repetitive) behavior and to monitor and update recent responses (Towse and Neil, 1998; Miyake et al., 2000; Friedman and Miyake, 2004). This inability to be random is operationalized using a series of randomization measures that capture different types of order (Evans, 1978; Towse and Neil, 1998). These measures typically align into three factors: inhibition of prepotent responses, working memory updating, and output inhibition (Towse and Neil, 1998; Peters et al., 2007; Maes et al., 2011). Both inhibition and updating refer to sequential processes and, therefore, these factor labels imply that the selection of the next number in a human-generated sequence is inherently contextual, i.e., it is a function of previously selected numbers (Brugger, 1997; Schulz et al., 2012). For example, neither inhibition nor updating can exist in a vacuum of only a single “behavior” (in the case of RNG, a single digit). A participant can only inhibit a digit, or a sequence of digits, when the same digit or sequence has been used before. Accordingly, the entire sequence can be seen as a time series of human executive behavior.
However, contrary to the assumption of a determinate change process being at least partly responsible for generating the trial series of “random” numbers, most of these randomization measures calculated from the series are state-based summary statistics referring to the deviation of independent event occurrence from stochastic randomness. Therefore, all the information about potential non-random state-propagation rules involved in number selection is lost (Gilden, 2001). For example, an often used measure of randomness is RNG (Evans, 1978; Towse and Neil, 1998). RNG describes the difference between the observed distribution of digrams, regardless of the order in which these digrams occur, compared to an uniform distribution of digrams. The same method applies to most other randomization measures. Schulz et al. (2012) demonstrated the importance of time-evolutionary information in RNG by predicting one participant’s number selection based on the sequence of another participant, and these predictions became more precise when longer sequences were used. This corresponds with growing evidence that variability in behavioral data is not mere random fluctuation (Gilden, 2001; Van Orden et al., 2003) but an essential constituent of the understanding of human (executive) behavior (Riley and Turvey, 2002). Hence, RNG may be best analyzed by non-linear methods that require no assumptions about the nature of the data in question, but quantify the characteristics of any temporal pattern in the sequence of numbers (Shockley, 2005; Webber and Zbilut, 2005).
Recurrence plots (RPs) and recurrence quantification analysis (RQA) are such non-linear approaches to time series analysis that exploit the dynamical organization of the entire time series (Webber and Zbilut, 1996, 2005). RPs display easily interpretable information about pattern recurrences on different time scales (Eckman et al., 1987), while RQA is an objective quantification of those recurrent patterns that can be associated with properties of non-linear dynamical systems (Webber and Zbilut, 1994; Marwan et al., 2007). In the current study, we use auto-RPs, which are a visual representation of a time series compared to itself. This visual representation is created by plotting the time series x on both axes in an N × N square matrix, where N is the length of the time series and x(i) is the ith measure in the time series. In case of random number sequences, a dot is placed at (i, j), whenever x(j) has the same number as x(i). Hence, dots are placed at the same moment in time, alongside the diagonal i = j, and at every moment later in time when the same number recurs. Due to the auto-recurrent nature, these RPs are symmetrical regarding the diagonal i = j and both planes contain the same information (see Figure 1). Using RQA, this information is described by the following variables: recurrence rate, determinism, longest diagonal line length, entropy, laminarity, and trapping time. Recurrence rate quantifies the amount of recurrent points or dots (excluding the diagonal), expressed as a percentage. In other words, recurrence rate is the proportion dots to non-dots in the RP. These recurrent points can be either scattered across the RP or clustered in diagonal and vertical line structures. Determinism measures the proportion of recurrent points forming diagonal line structures and quantifies the amount of repetitive patterns. Shorter diagonal line structures equal unstable patterns (more chaotic patterns) indicated by the longest diagonal line length. Shannon information entropy is based on a histogram of all diagonal line lengths present in the data and is an index of the complexity of the deterministic structure of the time series (Pellecchia and Shockley, 2005; Webber and Zbilut, 2005). Finally, laminarity measures the proportion of recurrent points forming vertical line structures, whereas trapping time is the average length of vertical line structures (Marwan et al., 2002). These vertical line structures are indicative of patterns that are trapped in one state (repeating the same behavior over and over), while trapping time quantifies the stability of these trapped states.
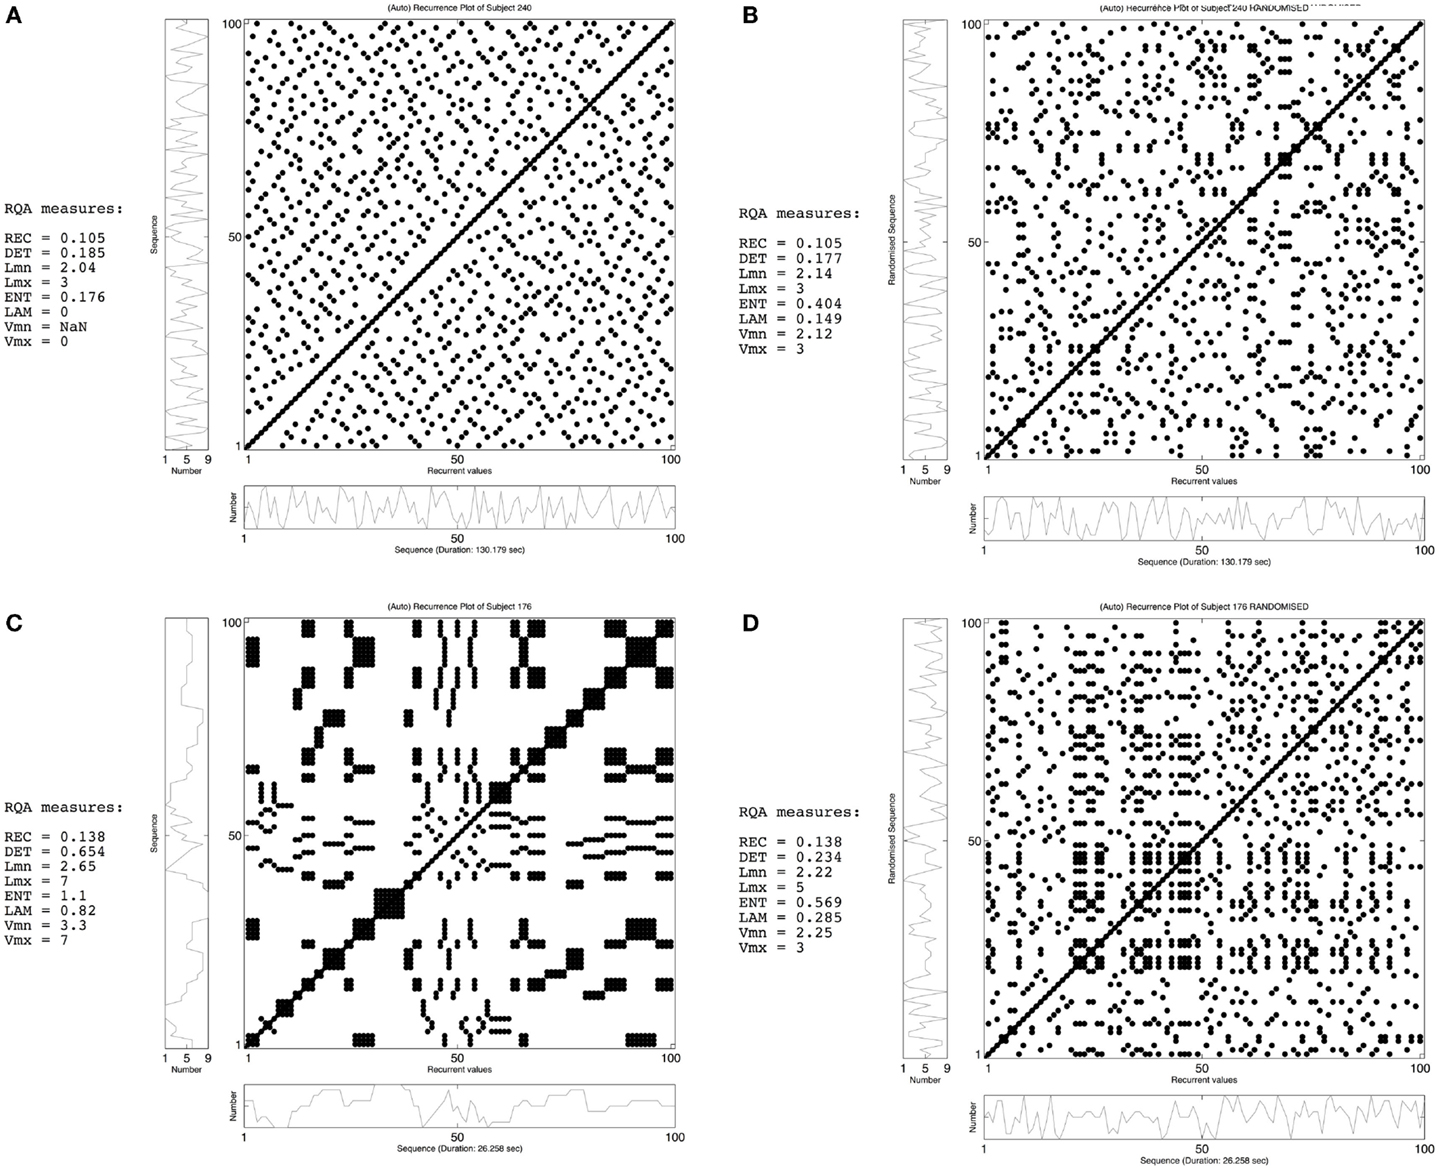
Figure 1. Recurrence plots (RPs) of the RNG task of participant 240 (upper row) and participant 176 (bottom row). The left-side panels (A,C) display the observed time-series of both participants, while the right-side panels (B,D) show a randomized version of the same sequence. The RQA measures demonstrate the effect of randomizing the temporal order of the time-series: for both participants the recurrence rate is the same, but the formation of line structures differs from the observed sequence to the randomized version (see main text for a more detailed explanation on the interpretation of RPs and RQA).
Figure 1 shows two examples of how temporal sequences are quantified using RPs and RQA. The left-side panels display the observed time series of two participants, while the right-side panels show shuffled versions of both time series. The upper left panel (Figure 1A) displays a time series with dots scattered across the entire surface of the RP and only a few of these dots form diagonal and vertical line structures. This minimal amount of line structures equals the absence of (complex) repetitive behavior, which is reflected by a low value for determinism and laminarity and a short diagonal line length. On the other hand, the lower left RP (Figure 1C) displays a highly clustered and, therefore deterministic time series, reflected in both the formation of diagonal and vertical line structures and a high value for determinism and laminarity. The lower right RP (Figure 1D) is a randomly shuffled version of the same time series. By shuffling the time series, most line structures disappear, which is quantified by a drop in determinism and laminarity. Furthermore, this drop in determinism is indicative of the disappearance of long-range correlations and, therefore, the importance of keeping time series intact. Although this does not absolutely refute the use of conventional measures, it does point toward the use of non-linear methods and, hence, RQA as the better method.
Combined, these RQA measures expose the dynamical processes inherent to the construct under study. RQA has been applied successfully in the field of postural control (Riley et al., 1998; Pellecchia and Shockley, 2005), eye movement coordination (Richardson et al., 2007; Dale et al., 2010), motor control (Wijnants et al., 2009), problem solving cognition (Stephen et al., 2009), and treatment efficacy for aggressive children (Lichtwarck-Aschoff et al., 2012).
The goal of the current study was to explore the utility of RQA in quantifying number sequences generated in the framework of RNG tasks. In a typical RNG procedure, responses of participants are paced using a metronome. However, recent research demonstrated a coupling of behavior between the metronome and several human systems, resulting in a change of long-range correlations within time series (Coey et al., 2014; Marmelat et al., 2014; Rigoli et al., 2014). For the current study, this coupling would imply that both motor behavior and number selection is influenced by the variability and speed of the metronome. Consistently, a positive correlation between metronome interval length and the quality of randomness is often reported (Baddeley, 1966; Brugger, 1997; Joppich et al., 2004). Withal, state-based randomization measures should not be as much affected by a change in long-range correlations. In contrast, RQA measures are sensitive to the sequential order of time series, and to eliminate this coupling effect, we used a non-paced RNG paradigm to examine the utility of RQA over traditional measures. Since little to no research has been done on RNG without a pacing signal, we first explored the similarities of the current results with those from a paced version. Specifically, we compared the factorial structure of the current data with results reported in the literature (Maes et al., 2011). Next, we added RQA measures to our factorial structure, to determine their similarity to the original RNG randomization measures and their interpretability within the often-used theoretical threefold of executive functioning: shifting between mental sets, updating and monitoring of working memory contents, and inhibition of prepotent responses (Miyake et al., 2000). Finally, we explored whether RQA provides a better explanation of executive functioning as measured by the RNG paradigm than is the case for the more conventional randomness measures. This was achieved by comparing the RQA measures to the randomization measures in terms of their interpretability, the number of components in the model, and the amount of variance explained.
Materials and Methods
Participants
A group of 242 first- and second-year students attending courses in methodology and statistics completed the RNG task. These students were asked during their respective classes to participate without getting any compensation. The task was completed within the classroom environment.
Apparatus
Participants generated a sequence of numbers by clicking (with a standard input device) on the cells of a 3 × 3 (12.5 × 13 cm) grid, shown on a laptop computer. The digits were displayed in a vertically inversed num-pad grid, with the numbers 1, 2, and 3 in the top row. Each response resulted in the appearance of a 3.8 × 4.2-cm rectangle drawn with a dotted line in the corresponding cell of the grid, while the grid and digits remained visible throughout. This rectangle disappeared upon selection of the subsequent response, and the newly selected digit was again marked by the appearance of a dotted-line rectangle. The grid was drawn in black against a white background.
Procedure
Participants were orally given the instruction to generate 100 numbers in their own pace with the sole rule that the numbers must be as random as possible. Since all participants were taught in basic methodology and statistics, no further explanations on the meaning of random was given. Because participants were free to take the time they needed to produce the number sequence, we term this procedure non-paced RNG. In contrast, a paced RNG paradigm uses a fixed decision time interval (e.g., one response each second) to randomly select numbers.
Measures
The randomization measures used in the current study were identical to those originally described by Towse and Neil (1998) and were calculated using software that these authors developed: RgCalc. The measures used were: adjacency, coupon, Phi 2-gram, Phi 3-gram, Phi 4-gram, Phi 5-gram, Phi 6-gram, Phi 7-gram, redundancy, repetition gap (mean), repetition gap (median), repetition gap (mode), RNG, RNG 2, runs, and Turning Point Index (TPI). For a full explanation of these measures, see Towse and Neil (1998) and Maes et al. (2011).
The RQA measures were calculated using Cross Recurrence Plot toolbox for MATLAB (Marwan et al., 2007). The measures were recurrence rate, determinism, longest diagonal line length, averaged diagonal line length entropy, laminarity, and trapping time (see Introduction for a full explanation of these measures). In many cases, laminarity proved to be zero, which makes it impossible to calculate trapping time for these cases. In order to include all participants in our principal component analysis (PCA), the missing trapping times were set to zero. These RQA measures are affected by the chosen embedding dimension (M), time delay (τ), minimal line length, and radius. To optimize the information gained from the time series, M is chosen based on the disappearance of false nearest neighbors (Kennel et al., 1992) and τ on the first minimum in the mutual information (Fraser and Swinney, 1986). However, since random number sequences contain only nominal information, we used the same embedding dimension (M = 1) as practiced by Coco and Dale (2014), Dale et al. (2010), and Dale and Spivey (2005) on categorical time series data. Our parameter τ was set to 1, which is advised for discontinuous data (Webber and Zbilut, 2005). Finally, the minimal line length was set to 2, to ensure that every recurring combination of 2 or more digits are considered a diagonal or vertical line structure, and the radius was set to less than 1 such that only exact matches are considered recurrent (Orsucci et al., 1999).
Analysis
To compare the current data to earlier results, the same data-reduction analysis (IBM SPSS Statistics 19.0) was used as in the study by Maes et al. (2011): PCA with uncorrelated components (varimax rotation) based on eigenvalues >1. Next, to determine the similarity of the randomization and RQA measures, factor analysis was performed on the combined data from the current experiment and those from Maes et al. (Experiment 1). However, because there is no reason to assume that inhibition of prepotent responses, updating, and output inhibition are not inter-correlated, four promax rotated components were sampled. Finally, the factorial structure based on the RQA measures was compared to that based on the randomization measures, focusing on both the number of components and the proportion of explained variance. To be able to compare the proportion of variance explained, the analysis was kept identical to the aforementioned dimension reduction technique: PCA with uncorrelated components (varimax rotation) based on eigenvalues >1.
Results
To examine the factorial similarity of the current data and earlier results, PCA was conducted on all 16 aforementioned randomization measures with orthogonal rotation (varimax). The Kaiser–Meyer–Olkin measure verified the sampling adequacy for the analysis, KMO = 0.823, and all KMO values for individual items were above the acceptable limit of 0.6. Barlett’s test of sphericity, χ2(120) = 2426.29, p < 0.001, indicated that correlations between measures were sufficiently large for PCA. Four components had eigenvalues larger than Kaiser’s criterion of 1 and in combination explained 71.60% of the variance (Field, 2009). Table 1 shows the factor loadings after rotation. Apart from slight deviations with respect to RNG(2) and Phi-gram measures, this factorial structure largely resembles the structure based on the paced RNG data reported by Maes et al. (2011) shown in Table 2.
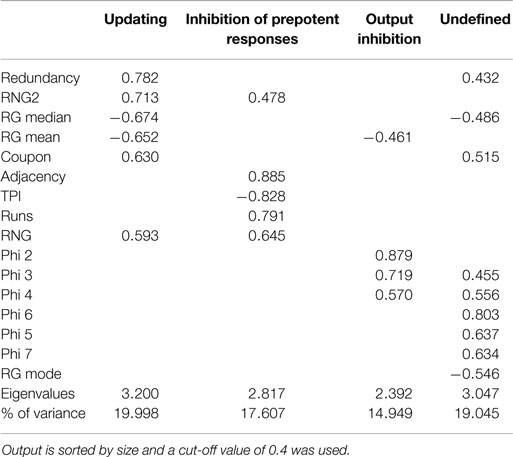
Table 1. Summary of principal component analysis of the data from the non-paced RNG task after orthogonal rotation (N = 242).
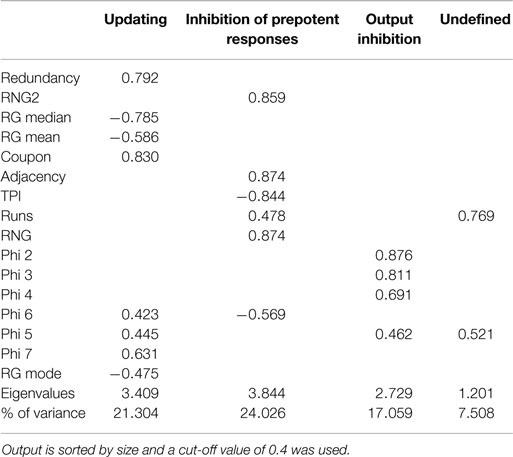
Table 2. Summary of principal component analysis of the paced RNG data from Maes et al. (2011) after orthogonal rotation (N = 118).
Next, PCA was conducted to explore the factorial structure of all 16 randomization measures in combination with seven RQA measures, with four oblique rotated components (promax). The Kaiser–Meyer–Olkin measure verified the sampling adequacy for the analysis, KMO = 0.841, and all KMO values for individual items were above the acceptable limit of 0.7. Barlett’s test of sphericity, χ2(253) = 6116.29, p < 0.001, indicated that correlations between measures were sufficiently large for PCA. The initial extraction, before rotation, of four components explained 70.39% of the variance. Table 3 shows the factor loadings after rotation, and Table 4 shows the structure matrix. The structure matrix confirms the assumed inter-correlation between components, mainly the components updating and output inhibition.
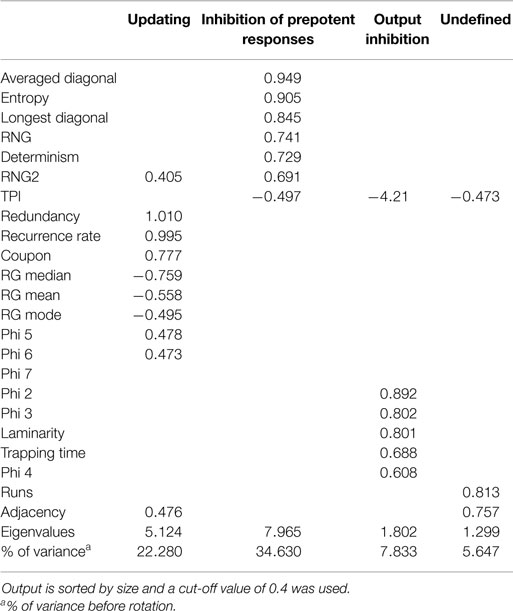
Table 3. Summary of principal component analysis of the non-paced RNG data after oblique rotation (N = 242): pattern matrix.
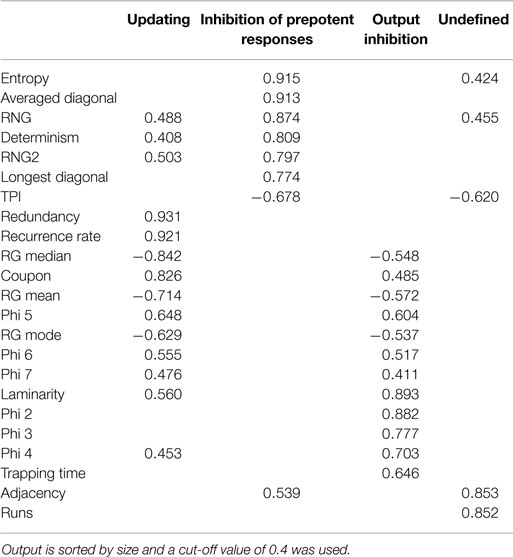
Table 4. Summary of principal component analysis of the non-paced RNG data after oblique rotation (N = 242): structure matrix.
Finally, PCA was conducted to explore the factorial structure of using only the recurrence quantification measures with orthogonal rotation (varimax). For the current sample, the Kaiser–Meyer–Olkin measure verified the sampling adequacy for the analysis, KMO = 0.645, and all KMO values for individual items were above the acceptable limit of 0.5. Barlett’s test of sphericity, χ2(21) = 1131.12, p < 0.001, indicated that correlations between measures were sufficiently large for PCA. Two components had eigenvalues above Kaiser’s criterion of 1 and in combination explained 71.91% of the variance. For the sample from the study by Maes et al. (2011), the KMO measure = 0.734, and all KMO values for individual items were above the acceptable limit of 0.5. Barlett’s test of sphericity, χ2(21) = 589.23, p < 0.001, indicated that correlations between measures were sufficiently large for PCA. Two components had eigenvalues above Kaiser’s criterion of 1 and in combination explained 76.34% of the variance. Tables 5 and 6 show the corresponding factor loadings after rotation.
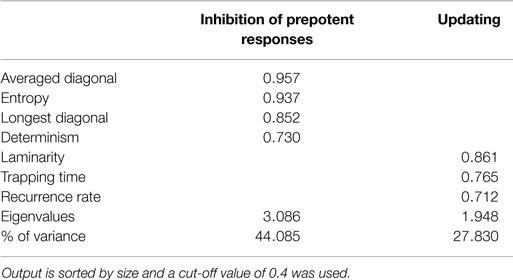
Table 5. Summary of principal component analysis of the non-paced RNG data after orthogonal rotation (N = 242).
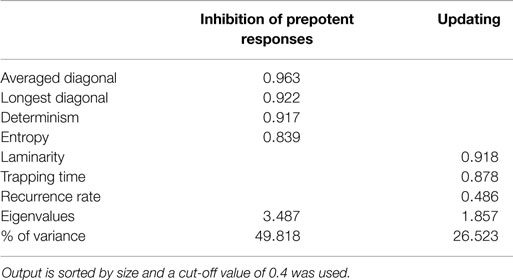
Table 6. Summary of principal component analysis of the paced RNG data from Maes et al. (2011) after orthogonal rotation (N = 118).
Discussion
In the current study, we explored RNG in healthy participants by using non-linear methods to quantify performance, specifically RQA. To this aim, the performance of students on a non-paced RNG task was compared to that in an earlier sample (Maes et al., 2011), using a paced RNG paradigm. Performance was analyzed using both traditional and RQA measures. We found that the RQA measures align well within the same factorial structure that is often reported in the literature using the traditional measures. Moreover, the RQA measures explain about the same amount of variance within RNG performance, but have a more sparse interpretation than that based on the traditional measures.
Only small differences between the factorial structure of the data from the current non-paced and earlier paced RNG paradigms were found. Moreover, the interpretation of the four components of the current non-paced RNG data did not differ from the often reported factorial structure with the three-defined components (inhibition of prepotent responses, working memory updating, and output inhibition) and one undefined component. Adding RQA measures to the factorial structure did not change this interpretation and the same structure could still be subtracted. Thus, the RQA measures convey more or less the same information as the traditional measures and most, if not all, theoretical implications should be applicable to the RQA measures.
Although no significant difference in the amount of explained variance was found between the RQA and the traditional measures, the amount of extracted components did differ. Whereas the traditional measures are interpreted within the aforementioned four-component structure, the RQA measures are aligned on just two components that could be interpreted as reflecting inhibition of prepotent responses and working memory updating. Diagonal line structures are indicative of deterministic or (complex) repetitive behavior, which is closely related to inhibition. This is true for simple repetitive structures like is measured by RNG and adjacency and for complex repetitive structures, which has no equivalent conventional measure. Determinism, diagonal line length, and entropy quantifies both simple and complex repetitive structures and, therefore, inhibiting behavior. Updating of working memory content, on the other hand, is theorized to reflect equality of response usage (Towse and Neil, 1998) or keeping track of recent responses (Miyake et al., 2000). This keeping track of recent responses is quantified by redundancy, coupon, and some of the longer Phi-gram measures. In contrast, recurrence rate is the amount of all recurring numbers regardless of distance between any two numbers and this conveys, among other things, the same information as the redundancy measure and all possible Phi-gram measures without breaking the time series down into digrams. Moreover, Tables 3, 5, and 6 do confirm inhibition of prepotent responses as being one factor and, to a lesser extent, working memory updating as the other.
The benefits of this two-component interpretation over the traditional component solution are twofold. First of all, the fourth component in the component structure of the traditional measures does explain a substantial amount of variance without, however, having a satisfying interpretation. Mayhap, this variance might be attributed to the sequencing of digits on longer timescales, seen in the longer Phi-gram measures and runs. Theoretically, these measures should coincide with either working memory updating (Phi gram) or inhibition of prepotent responses (runs). However, by using summary statistics, these randomization measures capture only a derivative of order and, therefore, create an artificial fourth factor. Secondly, this two-factor solution preempts the high correlation between updating of working memory content and output inhibition (Table 4). Furthermore, Baddeley et al. (1998) theorized that output inhibition reflects an automatic process of short-term negative priming and, hence, should not be attributed to the central executive or working memory. In other words, output inhibition is an automatic process and not part of human executive behavior and should, therefore, not be interpreted as a variable in theories on executive functioning. This effect of negative priming should primarily be seen on short timescales as captured by Phi 2-gram and Phi 3-gram, whereas the contribution of working memory gets larger with increasingly longer time intervals. The current findings show this by the overall high correlation between working memory updating and output inhibition, but this correlation is non-existent for the Phi 2-gram and Phi 3-gram measures (Table 4). Laminarity and trapping time are closely related to Phi 2-gram and, therefore, this effect of negative priming limits the information gained from these RQA measures (often the percentage of recurring points forming vertical line structures is zero), which makes their loadings on the updating component hard to interpret. However, taking all this argumentation into account, the RNG task measures only two domains of executive functioning, namely inhibition of stereotyped behavior and monitoring working memory content. As mentioned earlier, the advantage of RQA over the conventional measures is that the time series is kept intact. Most conventional measures use either the frequency of digrams or a summary statistic to model RNG and, thereby, lose all information of longer timescales. In contrast, all RQA measures are based on the longest timescale available within the data. In other words, whereas conventional measures quantify only snapshots of executive behavior, RQA uses all available information and quantifies executive behavior in a more holistic manner.
To summarize, we found that the RQA and traditional randomization measures convey the same information, but the RQA measures do so in a more parsimonious way with a better interpretation. Based on these findings, we believe that RQA is a useful, if not better, alternative to the study of executive functioning using RNG. Moreover, RQA and other non-linear methods offer many more perspectives to broaden our understanding of executive functioning that is reflected in RNG performance. One of these perspectives is to include non-paced response times into our analysis, as variability of response time intervals is another source of information that tells us much about the underlying system’s properties (Holden et al., 2009; Wijnants et al., 2009). In closing, it is important to keep the temporal structure of behavior intact, and for future reference, we will abide to this claim by embedding our discussion on RNG into a framework of interaction-dominance and complexity science.
Conflict of Interest Statement
The authors declare that there is no conflict of interest in the writing and publication of this article.
References
Anastas, J. R., Kelty-Stephen, D. G., and Dixon, J. A. (2014). Executive function as an interaction-dominant process. Ecol. Psychol. 26, 262–282. doi: 10.1080/10407413.2014.957985
Baddeley, A. D. (1966). The capacity for generating information by randomization. Q. J. Exp. Psychol. 18, 119–129. doi:10.1080/14640746608400019
Baddeley, A. D., Emslie, H., Kolodny, J., and Duncan, J. (1998). Random generation and the executive control of working memory. Q. J. Exp. Psychol. 51A, 819–852. doi:10.1080/713755788
Brugger, P. (1997). Variables that influence the generation of random sequences: an update. Percept. Mot. Skills 84, 627–661. doi:10.2466/pms.1997.84.2.627
Coco, M. I., and Dale, R. (2014). Cross-recurrence quantification analysis of categorical and continuous time series: an R package. Front. Psychol. 5:510. doi:10.3389/fpsyg.2014.00510
Coey, C. A., Washburn, A., and Richardson, M. J. (2014). “Recurrence quantification as an analysis of temporal coordination with complex signals,” in Translational Recurrences, Springer Proceedings in Mathematics & Statistics, Vol. 103, eds N. Marwan, M. Riley, A. Giuliani, and C. L. Webber Jr (Switzerland: Springer International Publishing), 173–186. doi:10.1007/978-3-319-09531-8_11
Dale, R., and Spivey, M. J. (2005). “Categorical recurrence analysis of child language,” in Proceedings of the 27th Annual Meeting of the Cognitive Science Society, (Mahwah: Lawrence Erlbaum), 530–535.
Dale, R., Warlaumont, A. S., and Richardson, D. C. (2010). Nominal cross recurrences as a generalized lag sequential analysis for behavioral streams. Int. J. Bifurcat. Chaos 21, 1153–1161. doi:10.1142/S0218127411028970
Eckman, J.-P., Kamphorst, S. O., and Ruelle, D. (1987). Recurrence plots of dynamical systems. Europhys. Lett. 4, 973–977. doi:10.1209/0295-5075/4/9/004
Evans, F. J. (1978). Monitoring attention deployment by random number generation: an index to measure subjective randomness. Bull. Psychon. Soc. 12, 35–38. doi:10.3758/BF03329617
Fraser, A. M., and Swinney, H. L. (1986). Independent coordinates for strange attractors from mutual information. Phys. Rev. A 33, 1134–1140. doi:10.1103/PhysRevA.33.1134
Friedman, N. P., and Miyake, A. (2004). The relations among inhibition and interference control functions: a latent-variable analysis. J. Exp. Psychol. Gen. 1, 101–135. doi:10.1037/0096-3445.133.1.101
Gilbert, S. J., and Burgess, P. W. (2008). Executive function. Curr. Biol. 18, R110–R114. doi:10.1016/j.cub.2007.12.014
Gilden, D. L. (2001). Cognitive emission of 1/f noise. Psychol. Rev. 108, 33–56. doi:10.1037/0033-295X.108.1.33
Holden, J. G., Van Orden, G. C., and Turvey, M. T. (2009). Dispersion of response times reveals cognitive dynamics. Psychol. Rev. 116, 318–342. doi:10.1037/a0014849
Joppich, G., Däuper, J., Dengler, R., Sönke, J., Rodriguez-Fornells, A., and Múnte, T. F. (2004). Brain potentials index executive functions during random number generation. Neurosci. Res. 49, 157–164. doi:10.1016/j.neures.2004.02.003
Jurado, M. B., and Rosselli, M. (2007). The elusive nature of executive functions: a review of our current understanding. Neuropsychol. Rev. 17, 213–233. doi:10.1007/s11065-007-9040-z
Kennel, B. M., Brown, R., and Aberbanel, H. D. I. (1992). Determining embedding dimensions for phase-space reconstruction using a geometrical construction. Phys. Rev. A 45, 3403–3411. doi:10.1103/PhysRevA.45.3403
Lichtwarck-Aschoff, A., Hasselman, F., Cox, R., Pepler, D., and Granic, I. (2012). A characteristic destabilization profile in parent-child interaction associated with treatment efficacy for aggressive children. Nonlinear Dynamics Psychol. Life Sci. 16, 353–379.
Maes, J. H., Eling, P. A., Reelick, M. F., and Kessels, R. P. (2011). Assessing executive functioning: on the validity, reliability, and sensitivity of a click/point random number generation task in healthy adults and patients with cognitive decline. J. Clin. Exp. Neuropsychol. 33, 366–378. doi:10.1080/13803395.2010.524149
Marmelat, V., Torre, K., Beek, P. J., and Daffershofer, A. (2014). Persistent fluctuations in stride intervals under fractal auditory stimulation. PLoS ONE 9:e91949. doi:10.1371/journal.pone.0091949
Marwan, N., Romano, M. C., Thiel, M., and Kurths, J. (2007). Recurrence plots for the analysis of complex systems. Phys. Rep. 438, 237–329. doi:10.1016/j.physrep.2006.11.001
Marwan, N., Wessel, N., Meyerfeldt, U., Schirdewan, A., and Kurths, J. (2002). Recurrence-plot-based measures of complexity and their application to heart rate variability data. Phys. Rev. E 66, 026702. doi:10.1103/PhysRevE.66.026702
McCabe, D. P., Roediger, H. L., McDaniel, M. A., Balota, D. A., and Hambrick, D. Z. (2010). The relationship between working memory capacity and executive functioning: evidence for a common executive attention construct. Neuropsychology 24, 222–243. doi:10.1037/a0017619
Miyake, A., Friedman, N. P., Emerson, M. J., Witzki, A. H., and Howerter, A. (2000). The unity and diversity of executive functions and their contribution to complex “frontal lobe” tasks: a latent variable analysis. Cogn. Psychol. 41, 49–100. doi:10.1006/cogp.1999.0734
Orsucci, F., Walter, K., Giuliani, A., Webber, C. L., and Zbilut, J. P. (1999). Orthographic structuring of human speech and texts: linguistic application of recurrence quantification analysis. Int. J. Chaos Theory Appl. 4, 21–28.
Packwood, S., Hodgetts, H. M., and Tremblay, S. (2011). A multiperspective approach to the conceptualization of executive functions. J. Clin. Exp. Neuropsychol. 33, 456–470. doi:10.1080/13803395.2010.533157
Pellecchia, G. L., and Shockley, K. (2005). “Application of recurrence quantification analysis: influence of cognitive activity on postural fluctuations,” in Tutorials in Contemporary Nonlinear Methods for the Behavioral Science, eds M. A. Riley and G. C. Van Orden, 95–141. Available at: http://www.nsf.gov/sbe/bcs/pac/nmbs/nmbs.jsp
Peters, M., Giesbrecht, T., Jelicic, M., and Merkelback, H. (2007). The random number generation task: psychometric properties and normative data of an executive function task in a mixed sample. J. Int. Neuropsychol. Soc. 13, 626–634. doi:10.1017/S1355617707070786
Richardson, D. C., Dale, R., and Kirkham, N. Z. (2007). The art of conversation is coordination: common ground and the coupling of eye movements during dialogue. Assoc. Psychol. Sci. 18, 407–413. doi:10.1111/j.1467-9280.2007.01914.x
Rigoli, L. M., Holman, D., Spivey, M. J., and Kello, C. T. (2014). Spectral convergence in tapping and physiological fluctuations: coupling and independence of 1/f noise in the central and autonomic nervous system. Front. Hum. Neurosci. 8:713. doi:10.3389/fnhum.2014.00713
Riley, M. A., Balasubramaniam, R., and Turvey, M. T. (1998). Recurrence quantification analysis of postural fluctuations. Gait Posture 9, 65–78. doi:10.1016/S0966-6362(98)00044-7
Riley, M. A., and Turvey, M. T. (2002). Variability and determinism in motor behavior. J. Mot. Behav. 34, 99–125. doi:10.1080/00222890209601934
Schulz, M. A., Schmalbach, B., Brugger, P., and Witt, K. (2012). Analysing humanly generated random number sequences: a pattern-based approach. PLoS ONE 7:e41531. doi:10.1371/journal.pone.0041531
Shockley, K. (2005). “Cross recurrence quantification of interpersonal postural activity,” in Tutorials in Contemporary Nonlinear Methods for the Behavioral Sciences, eds M. A. Riley and G. C. Van Orden, 142–177. Available at: http://www.nsf.gov/sbe/bcs/pac/nmbs/nmbs.jsp
Stephen, D. G., Dixon, J. A., and Isenhower, R. W. (2009). Dynamics of representational change: entropy, action, and cognition. J. Exp. Psychol. Hum. Percept. Perform. 35, 1811–1832. doi:10.1037/a0014510
Towse, J. N., and Neil, D. (1998). Analyzing human random generation behavior: a review of methods used and a computer program for describing performance. Behav. Res. Methods Instrum. Comput. 30, 583–591. doi:10.3758/BF03209475
Tsuchida, A., and Fellows, L. K. (2013). Are core components processes of executive function dissociable within the frontal lobes? Evidence from human focal prefrontal damage. Cortex 49, 1790–1800. doi:10.1016/j.cortex.2012.10.014
Van Orden, G. C., Holden, J. G., and Turvey, M. T. (2003). Self-organization of cognitive performance. J. Exp. Psychol. 132, 331–350. doi:10.1037/0096-3445.132.3.331
Webber, C. L. Jr., and Zbilut, J. P. (1994). Dynamical assessment of physiological systems and states using recurrence plot strategies. J. Appl. Physiol. 76, 965–973.
Webber, C. L. Jr., and Zbilut, J. P. (1996). “Assessing deterministic structures in physiological systems using recurrence plot strategies,” in Bioengineering Approaches to Pulmonary Physiology and Medicine, ed. M. C. K. Khoo (New York, NY: Plenum Press), 137–148.
Webber, C. L. Jr., and Zbilut, J. P. (2005). “Recurrence quantification analysis of nonlinear dynamical systems,” in Tutorials in Contemporary Nonlinear Methods for the Behavioral Science, eds M. A. Riley and G. C. Van Orden, 26–94. Available at: http://www.nsf.gov/sbe/bcs/pac/nmbs/nmbs.jsp
Keywords: random number generation, recurrence quantification analysis, executive functioning, cognition, principal component analysis
Citation: Oomens W, Maes JHR, Hasselman F and Egger JIM (2015) A time series approach to random number generation: using recurrence quantification analysis to capture executive behavior. Front. Hum. Neurosci. 9:319. doi: 10.3389/fnhum.2015.00319
Received: 16 March 2015; Accepted: 18 May 2015;
Published: 05 June 2015
Edited by:
John J. Foxe, Albert Einstein College of Medicine, USACopyright: © 2015 Oomens, Maes, Hasselman and Egger. This is an open-access article distributed under the terms of the Creative Commons Attribution License (CC BY). The use, distribution or reproduction in other forums is permitted, provided the original author(s) or licensor are credited and that the original publication in this journal is cited, in accordance with accepted academic practice. No use, distribution or reproduction is permitted which does not comply with these terms.
*Correspondence: Wouter Oomens, Centre of Excellence for Neuropsychiatry, Vincent van Gogh Institute for Psychiatry, Stationsweg 46, Venray 5803 AC, Netherlands,d29vbWVuc0B2dmdpLm5s