 Yuhan Jiang1†
 Qiuyi Gao2†
 Yangyingqiu Liu1
 Bingbing Gao1Yiwei Che3
 Liangjie Lin4
 Jian Jiang1Peipei Chang1Qingwei Song1Weiwei Wang1
 Nan Wang2*
 Yanwei Miao1*
- 1Department of Radiology, The First Affiliated Hospital of Dalian Medical University, Dalian, China
- 2Department of Nephrology, The First Affiliated Hospital of Dalian Medical University, Dalian, China
- 3Department of Radiology, The Third People’s Hospital of Dalian, Dalian, China
- 4Philips Healthcare China, Beijing, China
Background and Purpose: Reduced white matter (WM) integrity has been implicated in chronic kidney disease (CKD), especially in end-stage renal disease (ESRD). However, whether the differences in WM abnormalities exist in ESRD and non-end-stage CKD (NES-CKD) remains unclear. Hence, this study aimed to investigate the WM microstructural changes between the two stages using diffusion tensor imaging (DTI) and explore the related influencing factors.
Methods: Diffusion tensor imaging’ images were prospectively acquired from 18 patients with ESRD, 22 patients with NES-CKD, and 19 healthy controls (HCs). Tract-based spatial statistics (TBSS) was performed to assess the voxel-wise differences in WM abnormalities among the three groups. The relationships between DTI parameters and biochemical data were also analyzed.
Results: Compared with NES-CKDs, FA value was significantly decreased, and AD value increased in ESRDs mainly in brain regions of bilateral anterior thalamic radiation (ATR), the genu and body of corpus callosum (CC), bilateral anterior corona radiata, superior corona radiata, and superior longitudinal fasciculus. Besides, extensive and symmetrical deep WM damages were observed in patients with ESRD, accompanied by increased MD and RD values. Multiple regression analysis revealed that uric acid and serum phosphorus level can be used as independent predictors of WM microstructural abnormalities in clusters with statistical differences in DTI parameters between ESRD and NES-CKD groups.
Conclusion: In the progression of CKD, patients with ESRD have more severe WM microstructural abnormalities than NES-CKDs, and this progressive deterioration may be related to uric acid and phosphate levels.
Introduction
Chronic kidney disease (CKD) is defined as decreased kidney function shown by an estimated glomerular filtration rate (eGFR) of less than 60 ml/min per 1.73 m2 or the presence of albuminuria with at least 3-month duration (Zhang L. et al., 2012; Webster et al., 2017). End-stage renal disease (ESRD) occurs when CKD progresses to the eGFR of < 15 ml/min/1.73 m2. Continuous renal replacement therapy is essential to maintain the health of patients with ESRD, and hemodialysis accounts for the largest proportion in China (Navva et al., 2015). About 10–40% of patients with CKD had impaired cognitive function (Sarnak et al., 2013) and gradually progresses with the decline of kidney function. Patients at stage 4 have almost two times the memory and attention deficits compared with stage 3 (Egbi et al., 2015). In addition, patients with ESRD treated with hemodialysis show a 26–60% prevalence of mild cognitive impairment. The neurocognitive decline is most likely to be related to brain structure damage, especially white matter (WM) abnormalities (Vogels et al., 2012). Many studies have shown that WM abnormalities may appear earlier than brain atrophy and are more sensitive to early marker (Bartzokis, 2011; Metzler-Baddeley et al., 2019). In addition, more severe CKD may lead to more severe WM damage, which is associated with cognitive impairment (Liu et al., 2020). Therefore, WM integrity may be a more suitable biomarker for brain changes in patients with CKD.
Diffusion tensor imaging (DTI), a non-invasive neuroimaging technique, measures the diffusion tensor of water molecules and provides a detailed assessment of fiber tracts, which has been widely applied in microstructural WM integrity assessment (Hagmann et al., 2006; Nucifora et al., 2007). Therefore, patients with CKD can apply DTI technology for regular follow-up to track the changes in WM microstructure and conduct a detailed assessment of cognitive-related microstructure impairment. Some other more advanced dMRI techniques, such as diffusion kurtosis imaging (DKI) (Fieremans et al., 2011), neurite orientation dispersion and density imaging (NODDI) (Zhang H. et al., 2012), and fixel-based analysis (FBA) (Raffelt et al., 2015), provide additional and richer indicators to detailed evaluate the microstructure characteristics of tissues.
Previous studies based on DTI have found that patients with ESRD have abnormal WM integrity in multiple regions of the brain (Kong et al., 2014; Zhang et al., 2015; Yin et al., 2018; Chou et al., 2019). However, studies on the changes in WM integrity of patients with non-end-stage CKD (NES-CDK) are still limited. So far, only one study by Liu et al. (Liu et al., 2020) revealed that adult patients with CKD at stage 4 have reduced integrity of WM tracts in the corpus callosum (CC), anterior thalamic radiation (ATR), inferior fronto-occipital fasciculus (IFOF), and inferior longitudinal fasciculus (ILF). To rule out the effects of long-term hemodialysis, their study only included patients with CKD at stages 3–4. In fact, a report of longitudinal WM alterations in patients with ESRD showed that the toxic effect of ESRD itself may be the major factor of poor WM integrity (Chou et al., 2019).
Although WM microstructural abnormality in patients with CKD has been suggested, no studies have yet reported the direct comparison of DTI parameters (fractional anisotropy [FA], mean diffusivity [MD], axial diffusivity [AD], and radial [RD] diffusivity) between patients with ESRD and NES-CKD using tract-based spatial statistics (TBSS) analysis, to the best of our knowledge. TBSS is an advanced hypothesis-free method for analyzing whole-brain WM fiber tracts, which has been widely used in studies of various neurological diseases (Smith et al., 2006; Chen et al., 2018; Lim et al., 2019; Mei et al., 2020; Yamada et al., 2020). Compared with voxel-based analysis (VBA) using statistical parametric mapping, TBSS improves the registration sensitivity and accuracy based on the diffusion data projected onto a single, averaged FA skeleton located at the center of major cerebral WM pathways. TBSS also overcomes the personal evaluation bias in methods based on regions of interest (Smith et al., 2006; Qi et al., 2013).
This study applies TBSS to examine the microstructural abnormalities of the whole-brain WM skeleton among participants with ESRD, NES-CDK, and healthy controls (HCs) to accurately explore the characterization of WM alterations during CKD progression. The DTI metrics used in this study include FA, MD, AD, and RD, which may provide an overall characterization of WM alterations in patients with CKD. We hypothesize that WM microstructural alterations existed differences in the patients with ESRD and NES-CKD. We also explored the relationships among these DTI parameters with the clinical and laboratory data, and also cognitive function in participants with ESRD.
Materials and Methods
Participants
This study was approved by the Local Ethics Committee of the First Affiliated Hospital of Dalian Medical University. Informed consents were obtained from patients or legal guardians before the study. CKD diagnosis was confirmed by a nephrologist according to the kidney disease outcomes quality initiative (K/DOQI) classification, with < 15 and 15–59 ml/min/1.73 m2 classified as ESRD and NES-CDK, respectively. Other inclusion criteria for patients with ESRD and NES-CDK were as follows: (1) maintenance hemodialysis (3–4 times per week) for at least 3 months and no dialysis, respectively; (2) age > 18 years; and (3) right-handedness. Exclusion criteria included the following: (1) had a history of traumatic brain injury, psychiatric diseases, or other neurological disorders (e.g., infarction); (2) recipient of renal transplant; and (3) contraindications for MRI examination (e.g., claustrophobia, pacemaker).
Between April 2019 and May 2021, 45 patients diagnosed with CKD were prospectively recruited in this study. Patients with poor image quality (n = 3) and with claustrophobia (n = 2) were excluded. Therefore, 40 patients with CKD, including 18 patients with ESRD and 22 with NES-CKD at stages 1–4, were enrolled in the final analysis. Nineteen HCs (right-handedness) were recruited with similar age, sex, body mass index (BMI), and education level to the participants with CKD. The exclusion criteria for HCs were traumatic brain injury, mental disorder, and neurological disorders.
Neurocognitive Assessments
Among 40 patients with CKD, only 12 ESRD participants completed cognitive assessment [Beijing revised version Montreal Cognitive Assessment (MoCA)] before MR data acquisition. MoCA is a fast, comprehensive, deliberate, and sensitive neurocognitive assessment tool, which has previously been applied in the CKD population (Tiffin-Richards et al., 2014; Liu et al., 2020).
Clinical Data and Laboratory Tests
All patients with CKD underwent clinical data collection (course of disease, admission blood pressure) and several biochemical tests, including serum creatinine (Scr), creatinine (Cre), serum urea (Urea), uric acid (UA), cystatin C (Cys C), cholesterol (CHOL), homocysteine (HCY), low-density lipoprotein (LDH), high-density lipoprotein (HDL), triglyceride (TG), serum kalium (K), serum natrium (Na), serum calcium (Ca), serum phosphorus (P), and parathyroid hormone (PTH) levels before MR data acquisition. No biochemical test was performed on the participants in the HC group.
Diffusion Tensor Imaging
Diffusion Tensor Imaging Data Acquisition
Diffusion-weighted images were obtained with a 3.0T MRI scanner (Ingenia CX, Philips Healthcare, Best, Netherlands) equipped with a 32-channel phased-array head coil, using a single-shot echo-planar imaging (SS-EPI) sequence. The parameters were as follows: 64 non-collinear spatial directions at b value = 1,000 s/mm2, one baseline image at b = 0 s/mm2, TR/TE = 6,000 ms / 92 ms, voxel size = 2 mm × 2 mm × 2 mm, matrix size = 128 × 128, field of view = 256 mm × 256 mm, slice thickness = 2 mm, without a slice gap. A total of 68 axial slices were collected, covering the whole brain, and the duration of the DTI scan was 6 min and 46 s.
Diffusion Tensor Imaging Data Preprocessing
Diffusion tensor imaging data were processed using the Functional MRI of the Brain (FMRIB) Software Library (FSL) version 5.0.91 (Smith et al., 2004). Eddy current-induced distortions and motion artifacts were corrected by registering each diffusion-weighted image to the non-diffusion weighted volume (b0 image) using the affine alignment (Andersson and Sotiropoulos, 2016). All images were visually inspected before and after corrections. “Brain Extraction Tool (BET)” inside the FSL package was used to extract a brain mask from the eddy corrected image to remove the skull and non-brain tissue (Smith, 2002). Diffusion tensor at each voxel was fitted using the DTIFIT tool to generate FA, MD, and eigenvalue (λ1, λ2, λ3) maps. Axial (AD = λ1) and radial [RD = (λ2 + λ3)/2] diffusivity maps were then calculated from these eigenvalues.
Tract-Based Spatial Statistics Analysis
Voxel-wise statistical analysis of the FA maps was performed using the TBSS toolbox in FSL (Smith et al., 2004, 2006). All FA maps were spatially aligned to a 1 mm × 1 mm × 1 mm FMRIB58 FA standard space using a non-linear registration algorithm. The aligned FA maps were averaged to create a mean FA image and then skeletonized to generate a mean FA skeleton, which represents the center of all WM fiber tracts common to all participants. The FA threshold for the skeletonization was 0.20 to exclude gray matter and cerebrospinal fluid interference and also intersubject variability. Aligned FA maps for all subjects were then projected onto this skeleton. The same FA transformation was then also applied to MD, AD, and RD images for statistical analysis.
To estimate the voxel-wise FA, MD, AD, and RD differences among the three groups, individual skeleton images were inputted to the general linear model (GLM) analysis, adjusting for age, sex, years of education, and BMI as covariates. Non-parametric permutation-based testing was performed using randomize in FSL (Winkler et al., 2014). One-way analysis of covariance (ANOVA) was performed with one F-test for the overall group effect on diffusion parameters (FA, AD, RD, and MD) and six contrasts for the individual comparisons of voxel-wise diffusion parameters between the groups. Results are reported at the p < 0.05 level after 5,000 permutations using permutation-based non-parametric inference, with threshold-free cluster enhancement (TFCE) and family-wise error (FWE) rate correction for multiple comparisons (Smith and Nichols, 2009).
The FSL’s cluster was used to identify statistically significant (p < 0.05) clusters followed by an atlas query to describe the localization of all the anatomical clusters using the John Hopkins University (JHU)—International Consortium of Brain Mapping DTI-81 WM labels and JHU white matter tractography atlas template. DTI parameters in each significant cluster were then extracted from the skeletonized TBSS image of each participant.
Statistical Analysis
Statistical analysis was carried out using IBM SPSS software, version 22.0. One-way ANOVA was used to compare the ages and BMI of the participants among the three groups. A Kruskal–Wallis test was used to compare the years of education. Data without normal distributions were analyzed using non-parametric tests. Categorical variable analyses were analyzed by chi-squared test. The clinical features between the ESRD and CKD groups were performed using the independent sample t-tests.
For normally distributed data, the partial correlation was used to assess the association between the extracted DTI parameters and clinical data, adjusting for the same covariates as above. Non-normally distributed data were analyzed using Spearman’s correlation coefficient. Statistical significance was defined as two-tailed p < 0.05. Bonferroni’s correction was applied for multiple testing.
Results
Demographic and Clinical Characteristics
The demographic and clinical characteristics of the subjects from the ESRD, NES-CKD, and HC groups are presented in Table 1. There was no significant difference in gender, age, BMI, and years of education (p > 0.05). The ESRD group showed a significantly increased Cys C, Urea, Cre, K, Na, P, and PTH compared with the NES-CKD group (p < 0.01).
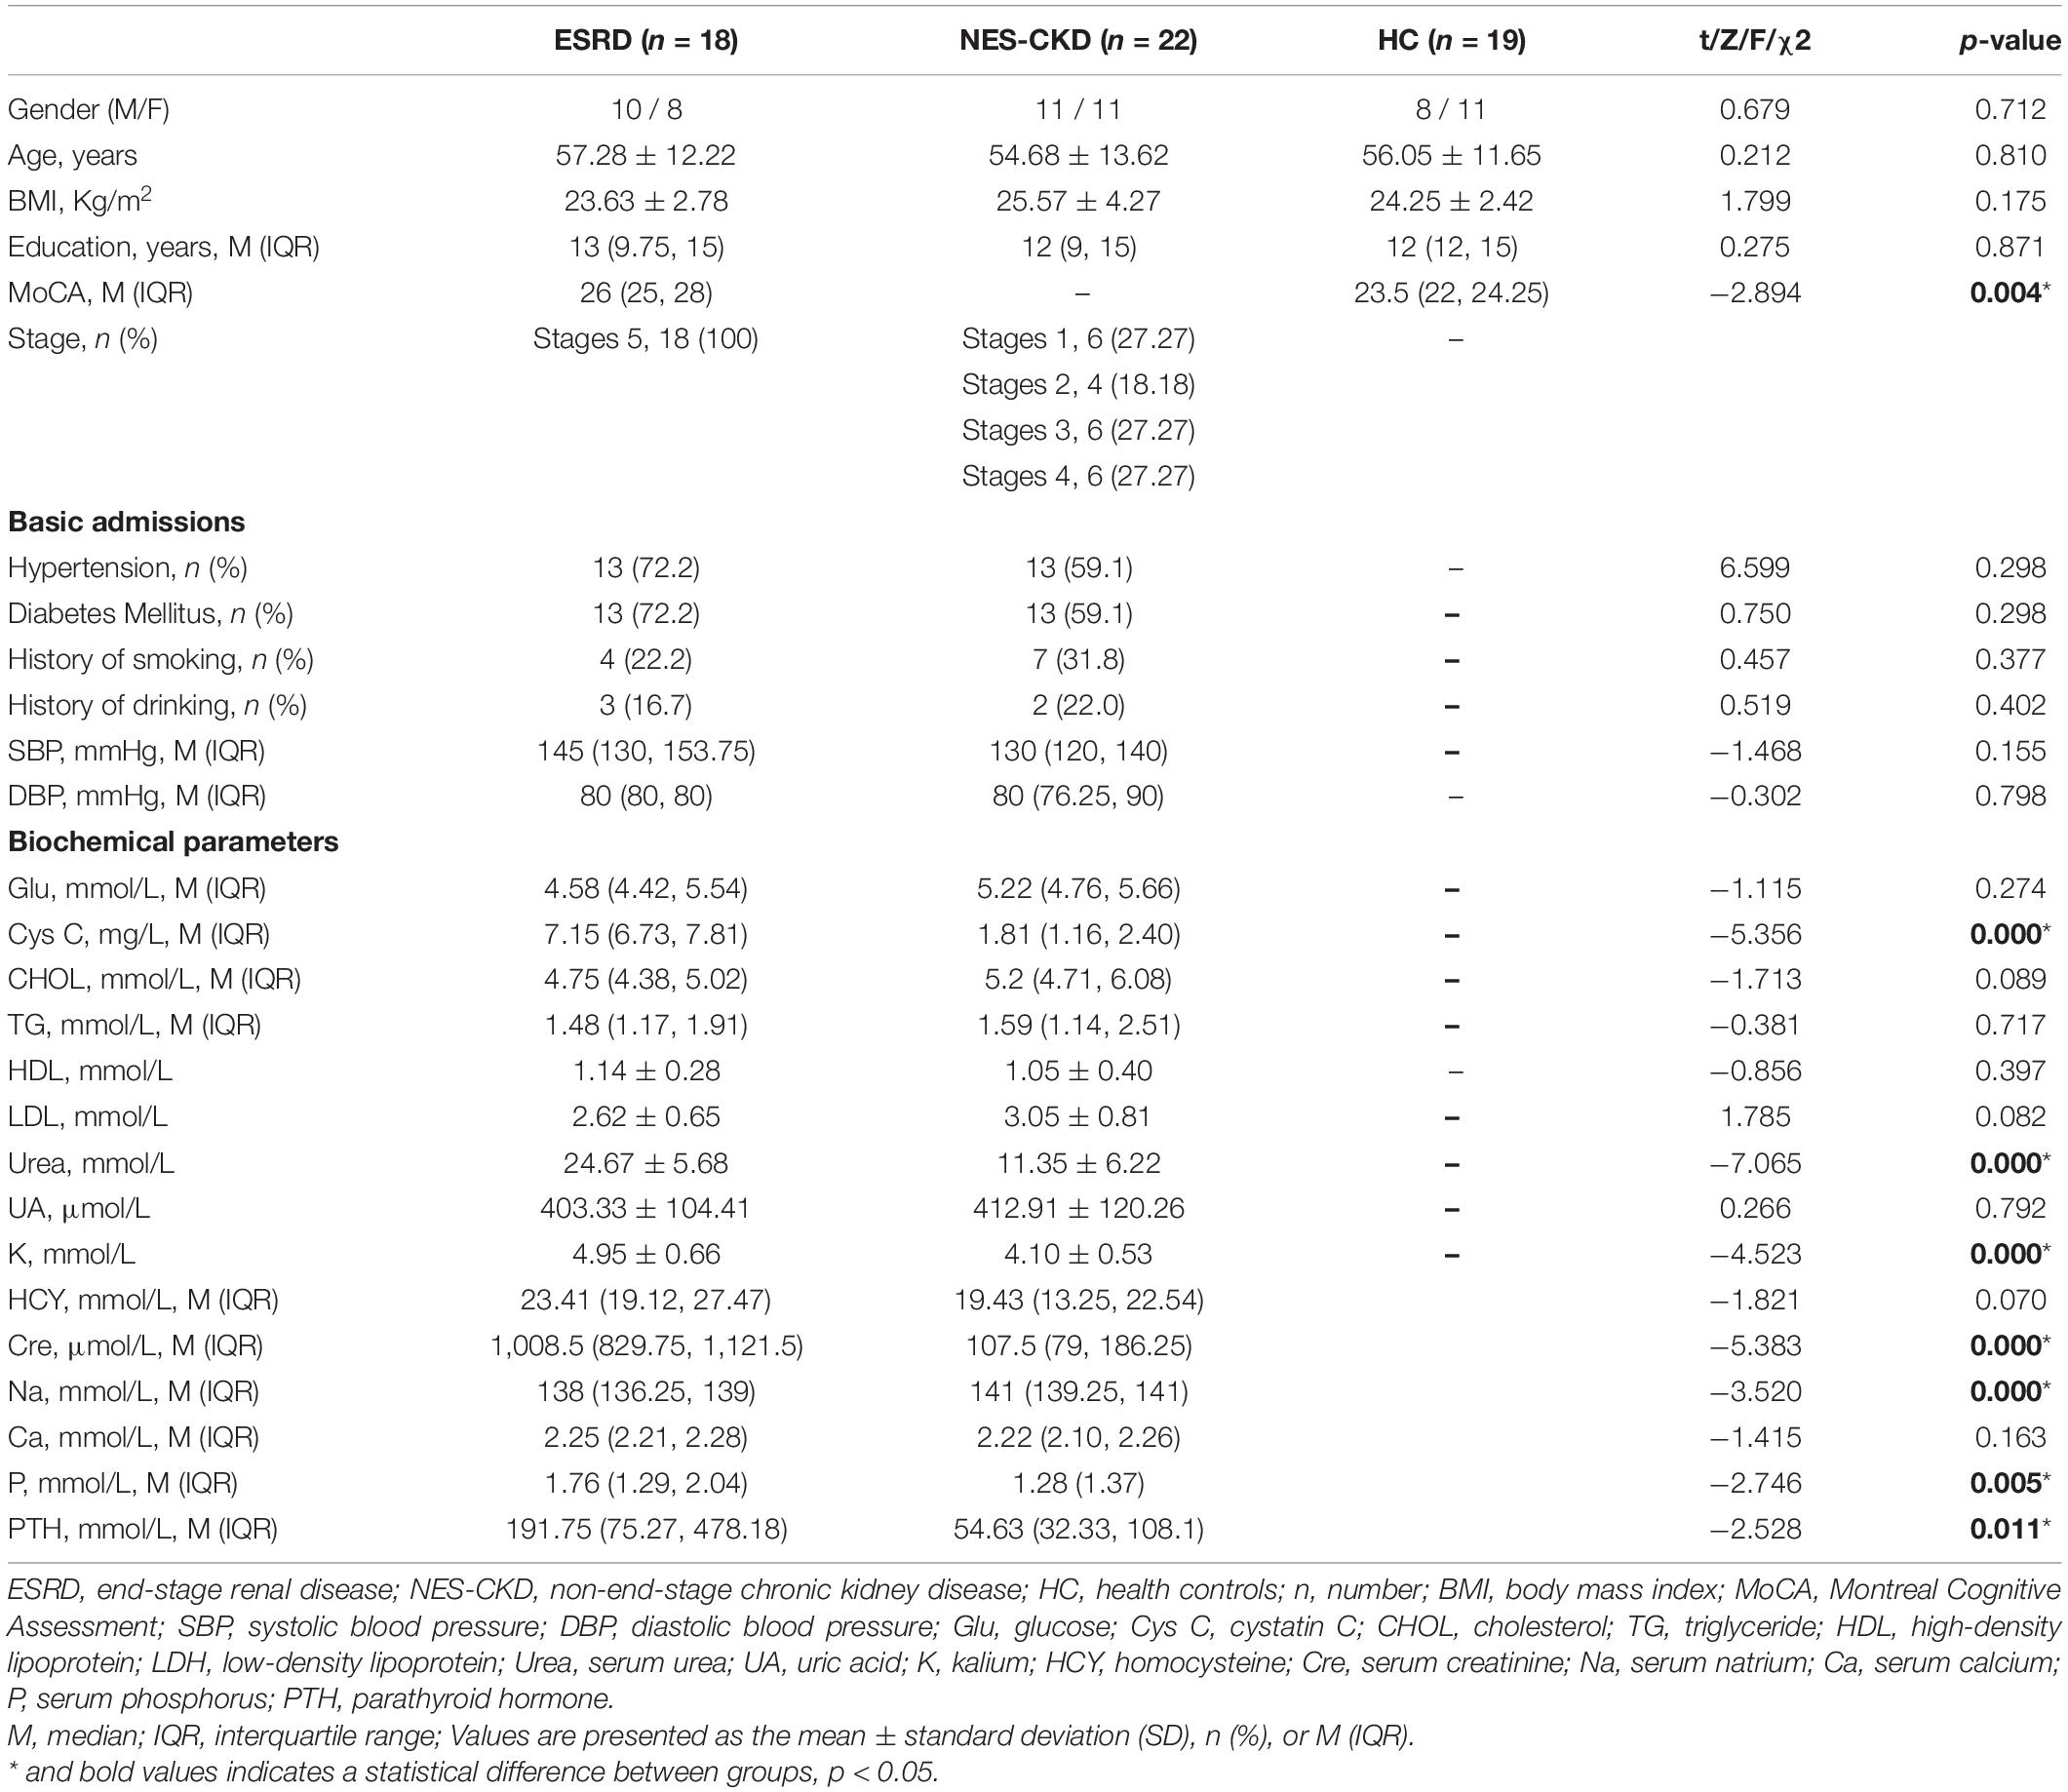
Table 1. Demographic and clinical characteristics.
Tract-Based Spatial Statistics Results Between Groups
ANCOVA
An ANCOVA revealed a statistically significant effect for FA, MD, AD, and RD across ESRD, NES-CKD, and HC groups (p < 0.05, TFCE-corrected, Supplementary Figure 1).
ESRD vs. NES-CKD
We identified three independent clusters with statistically significant differences in FA and AD values and one independent cluster with a significant difference in MD and RD values between ESRD and NES-CKD groups. When compared to patients with NES-CKD, these clusters showed decreased FA or increased MD, AD, or RD in the ESRD group. Additionally, in these clusters, the average diffusion index values in the NES-CKD and HC groups were roughly similar (Figure 1).
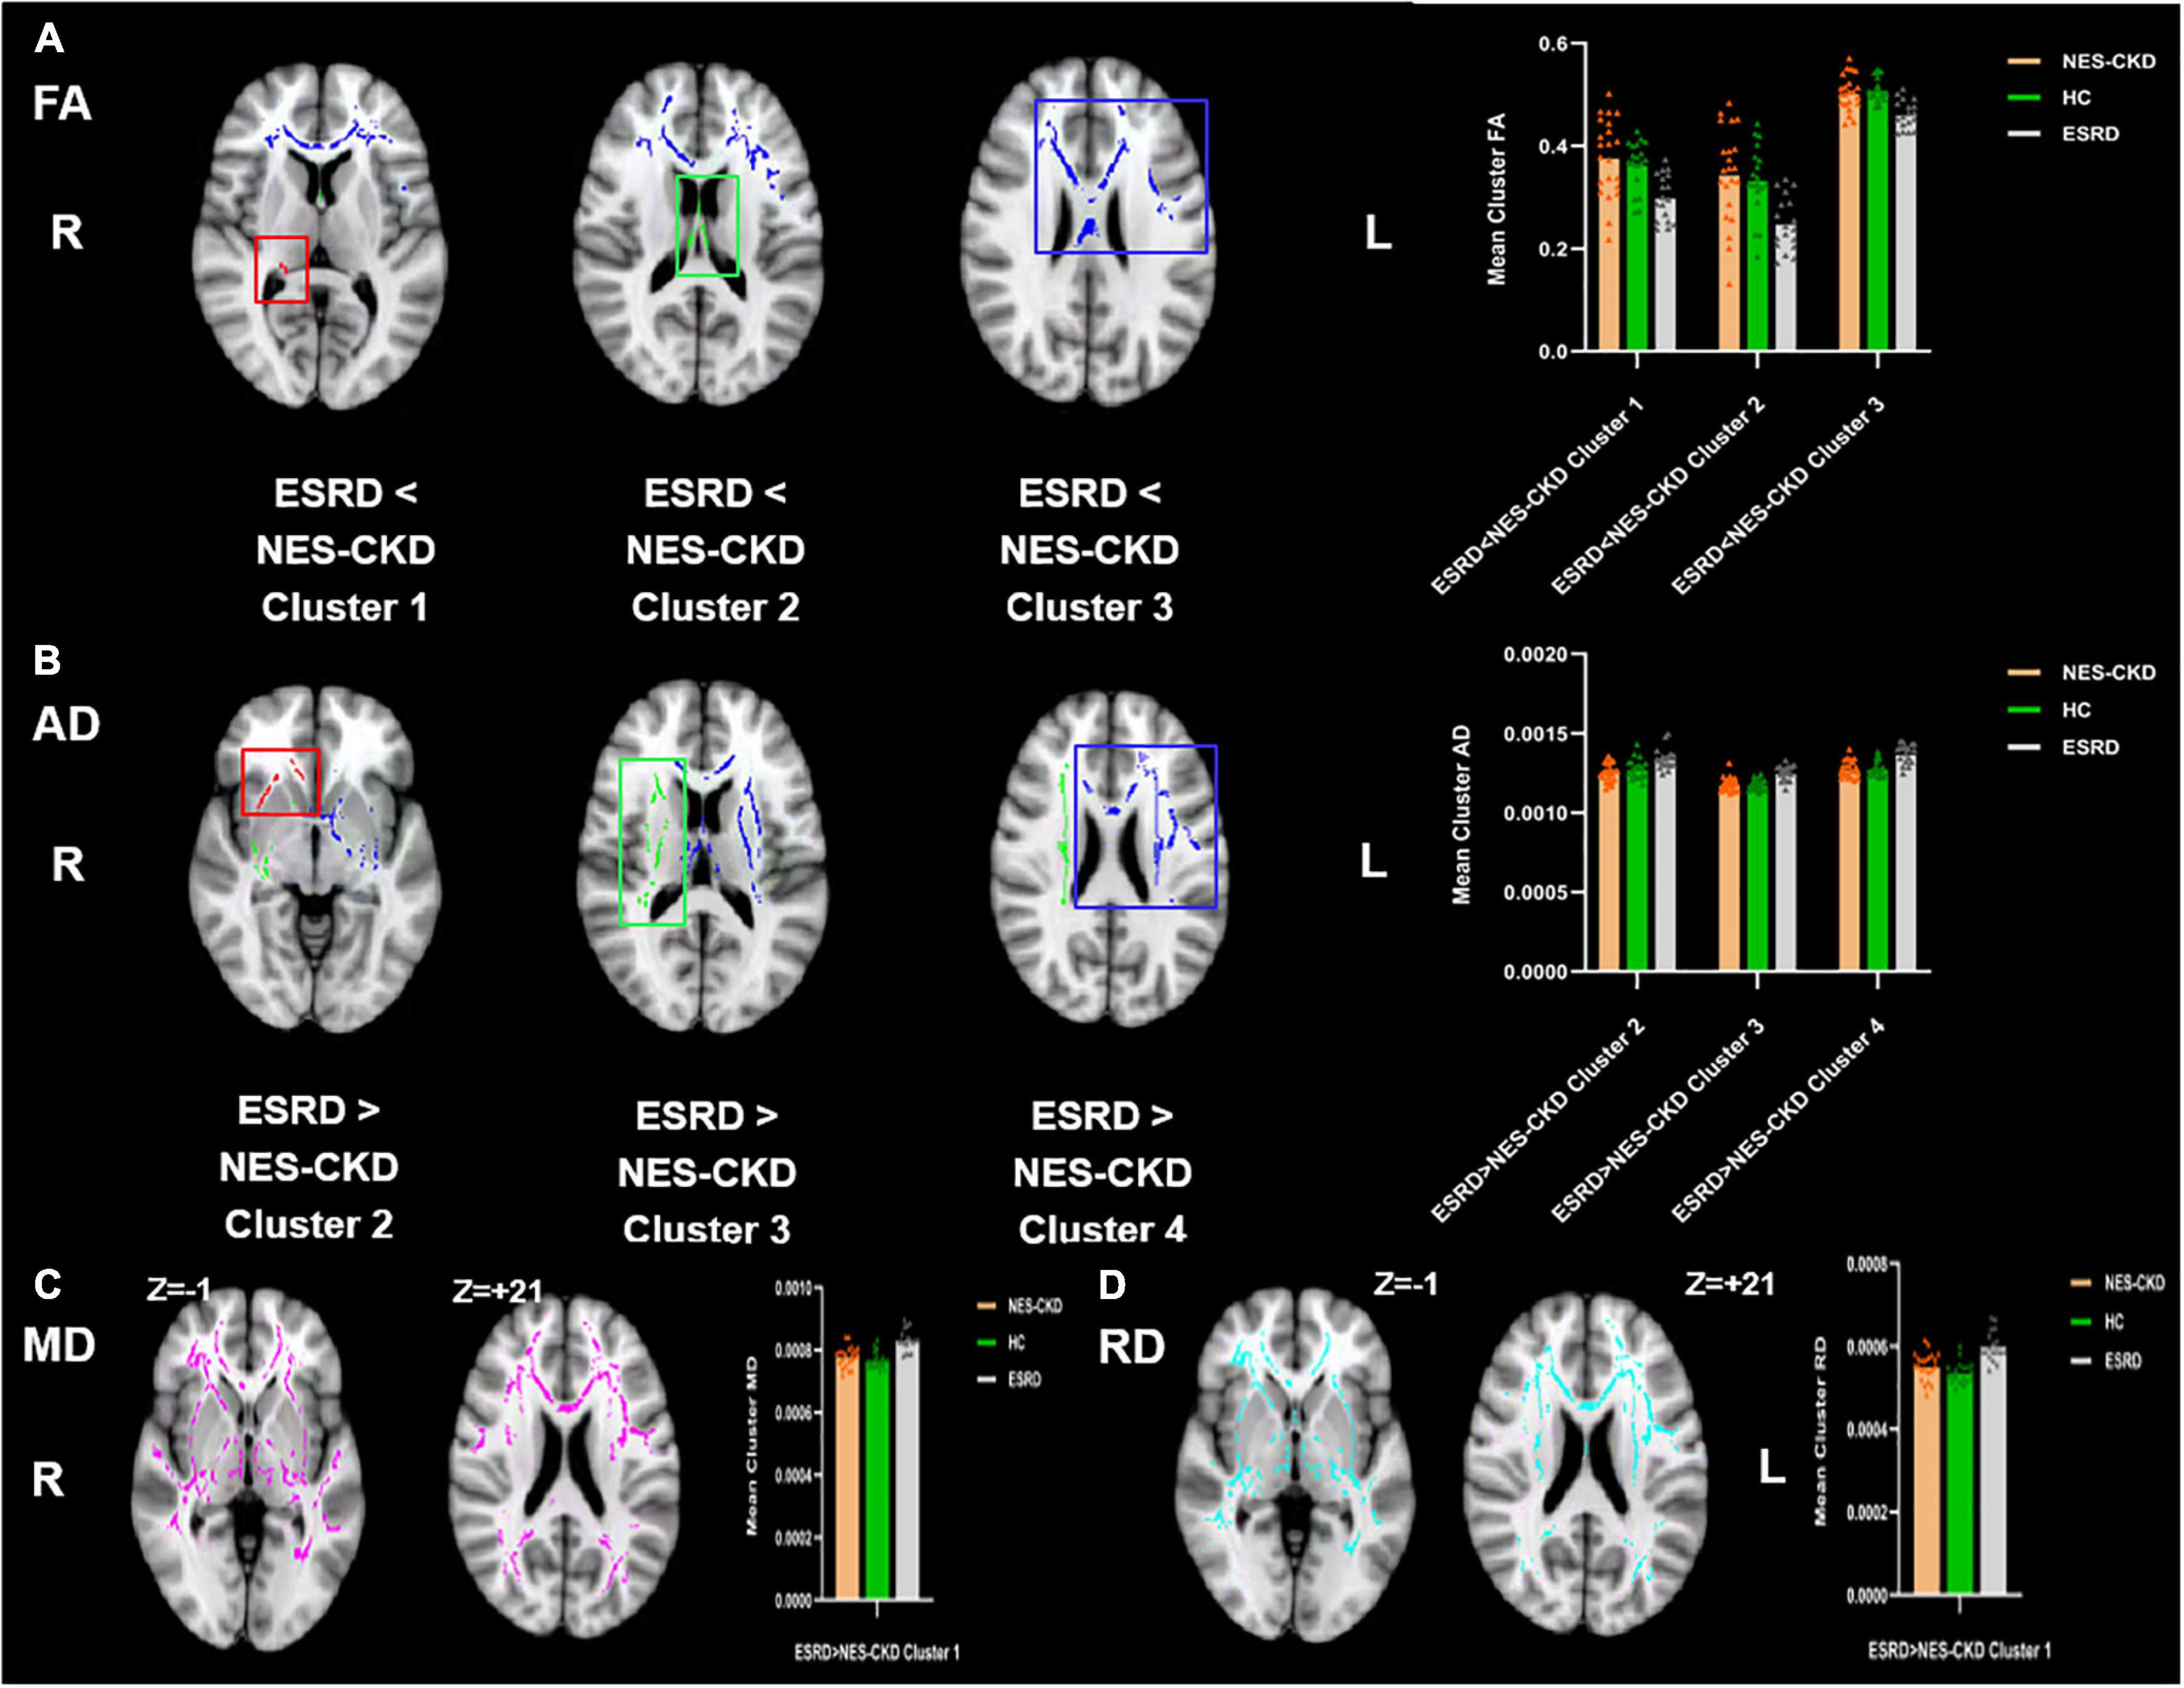
Figure 1. Voxel clusters in which patients with ESRD exhibited decreased FA or increased AD, MD, or RD than NES-CKD. (A) Three independent clusters (red for Cluster 1; green for Cluster 2; blue for Cluster 3) with lower FA values in ESRD vs. NES-CKD. (B) Three independent clusters (red for Cluster 2; green for Cluster 3; blue for Cluster 4) with higher AD values in ESRD vs. NES-CKD. (C) One independent cluster (pink) with higher MD values in ESRD vs. NES-CKD. (D) One independent cluster (light blue) with higher RD values in ESRD vs. NES-CKD. The bar plots represent the corresponding mean diffusion metrics for each group. The triangle symbols indicate the data points of each participant in each group. ESRD, end-stage renal disease; NES-CKD, non-end-stage chronic kidney disease; HC, healthy control; FA, fractional anisotropy; MD, mean diffusivity; AD, axial diffusivity; RD, radial diffusivity.
Figure 2 showed the more detailed locations of post hoc analyses between ESRD and NES-CKD groups. We found significantly reduced FA values in the ESRD group compared to the NES-CKD group, mainly in bilateral ATR, the genu, and body of CC, bilateral anterior corona radiata (ACR), bilateral superior corona radiata, bilateral IFOF, and left superior longitudinal fasciculus (SLF) (p < 0.05, TFCE-corrected, Table 2). Besides, significantly increased AD values in patients with ESRD were confined to genu and body of CC, right ACR, bilateral ATR, right internal capsule, bilateral external capsule, bilateral corticospinal tract, bilateral corona radiata, left SLF, left IFOF, and left IFOF (p < 0.05, TFCE-corrected, Table 3). In addition, we observed extensive and symmetrical deep WM damage in patients with ESRD, accompanied by increased MD and RD values, including CC, bilateral corona radiata, bilateral ATR, bilateral IFOF, bilateral SLF, bilateral internal capsule, and bilateral external capsule (Supplementary Tables 1, 2).
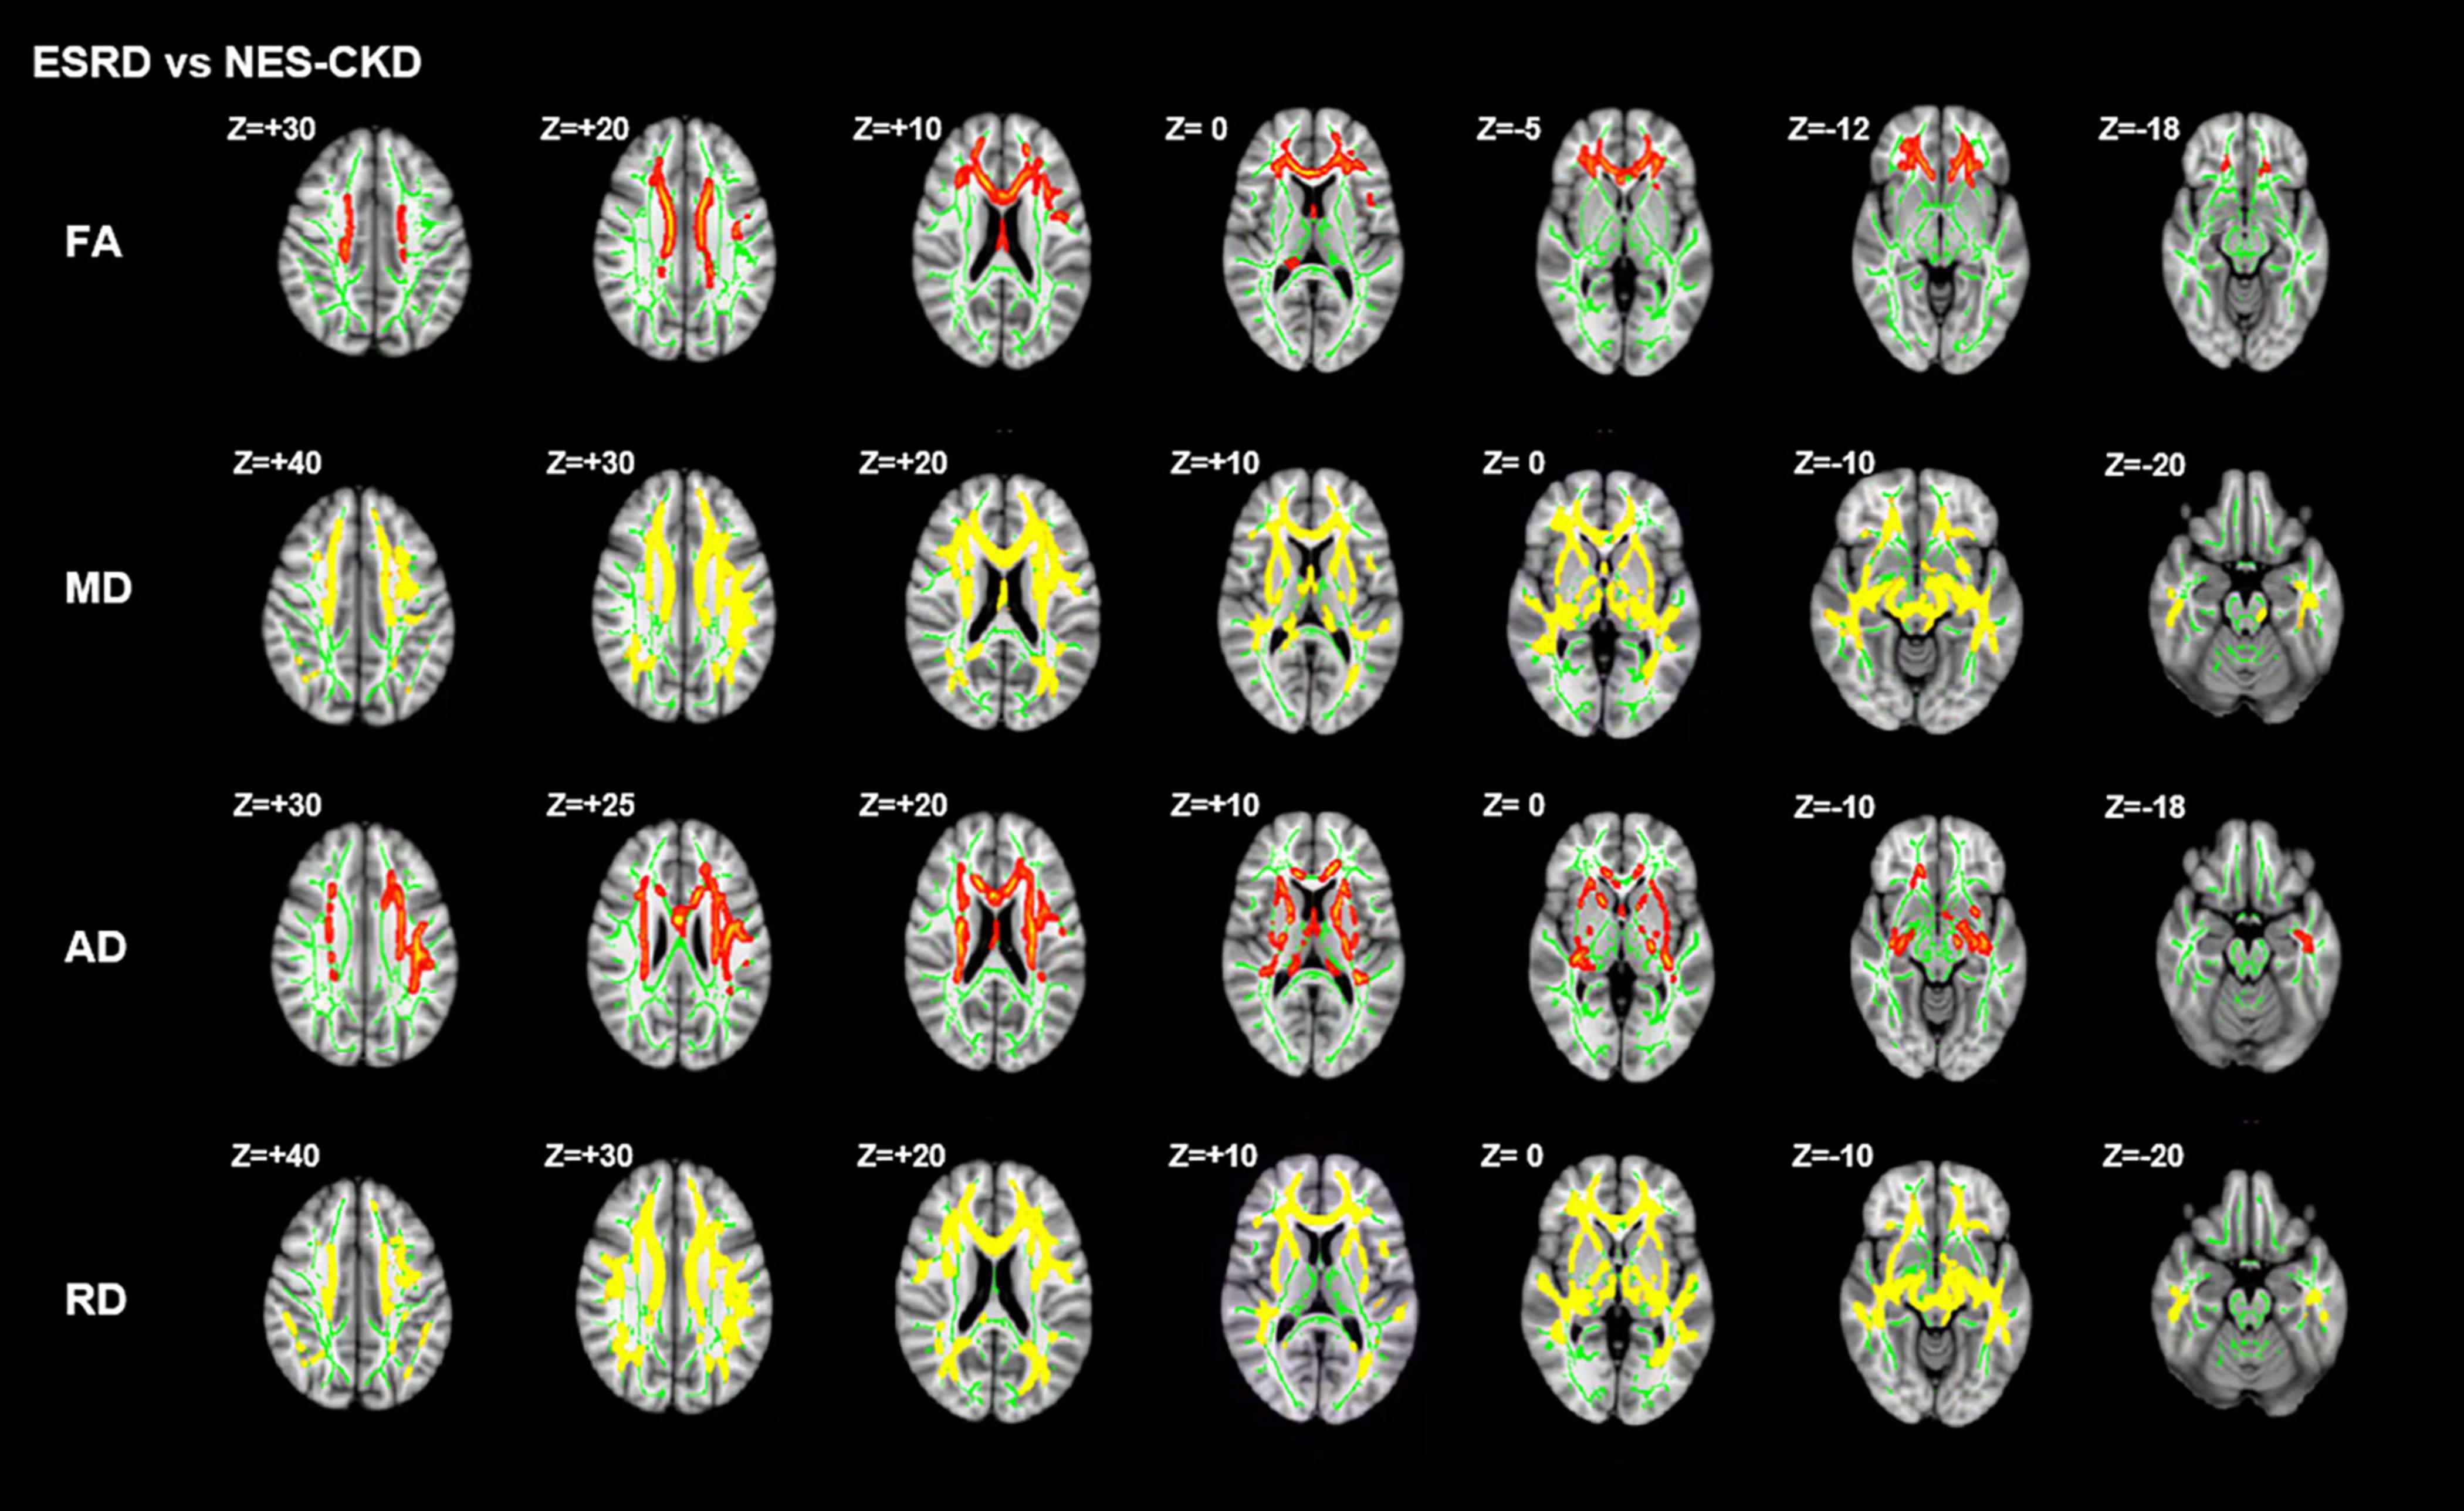
Figure 2. Post hoc analyses result between patients with ESRD and NES-CKD. Green represents the mean FA skeleton of all subjects. Red–yellow represent regions with significant statistical values (p < 0.05, TFCE-corrected). ESRD, end-stage renal disease; NES-CKD, non-end-stage chronic kidney disease; FA, fractional anisotropy; MD, mean diffusivity; AD, axial diffusivity; RD, radial diffusivity.
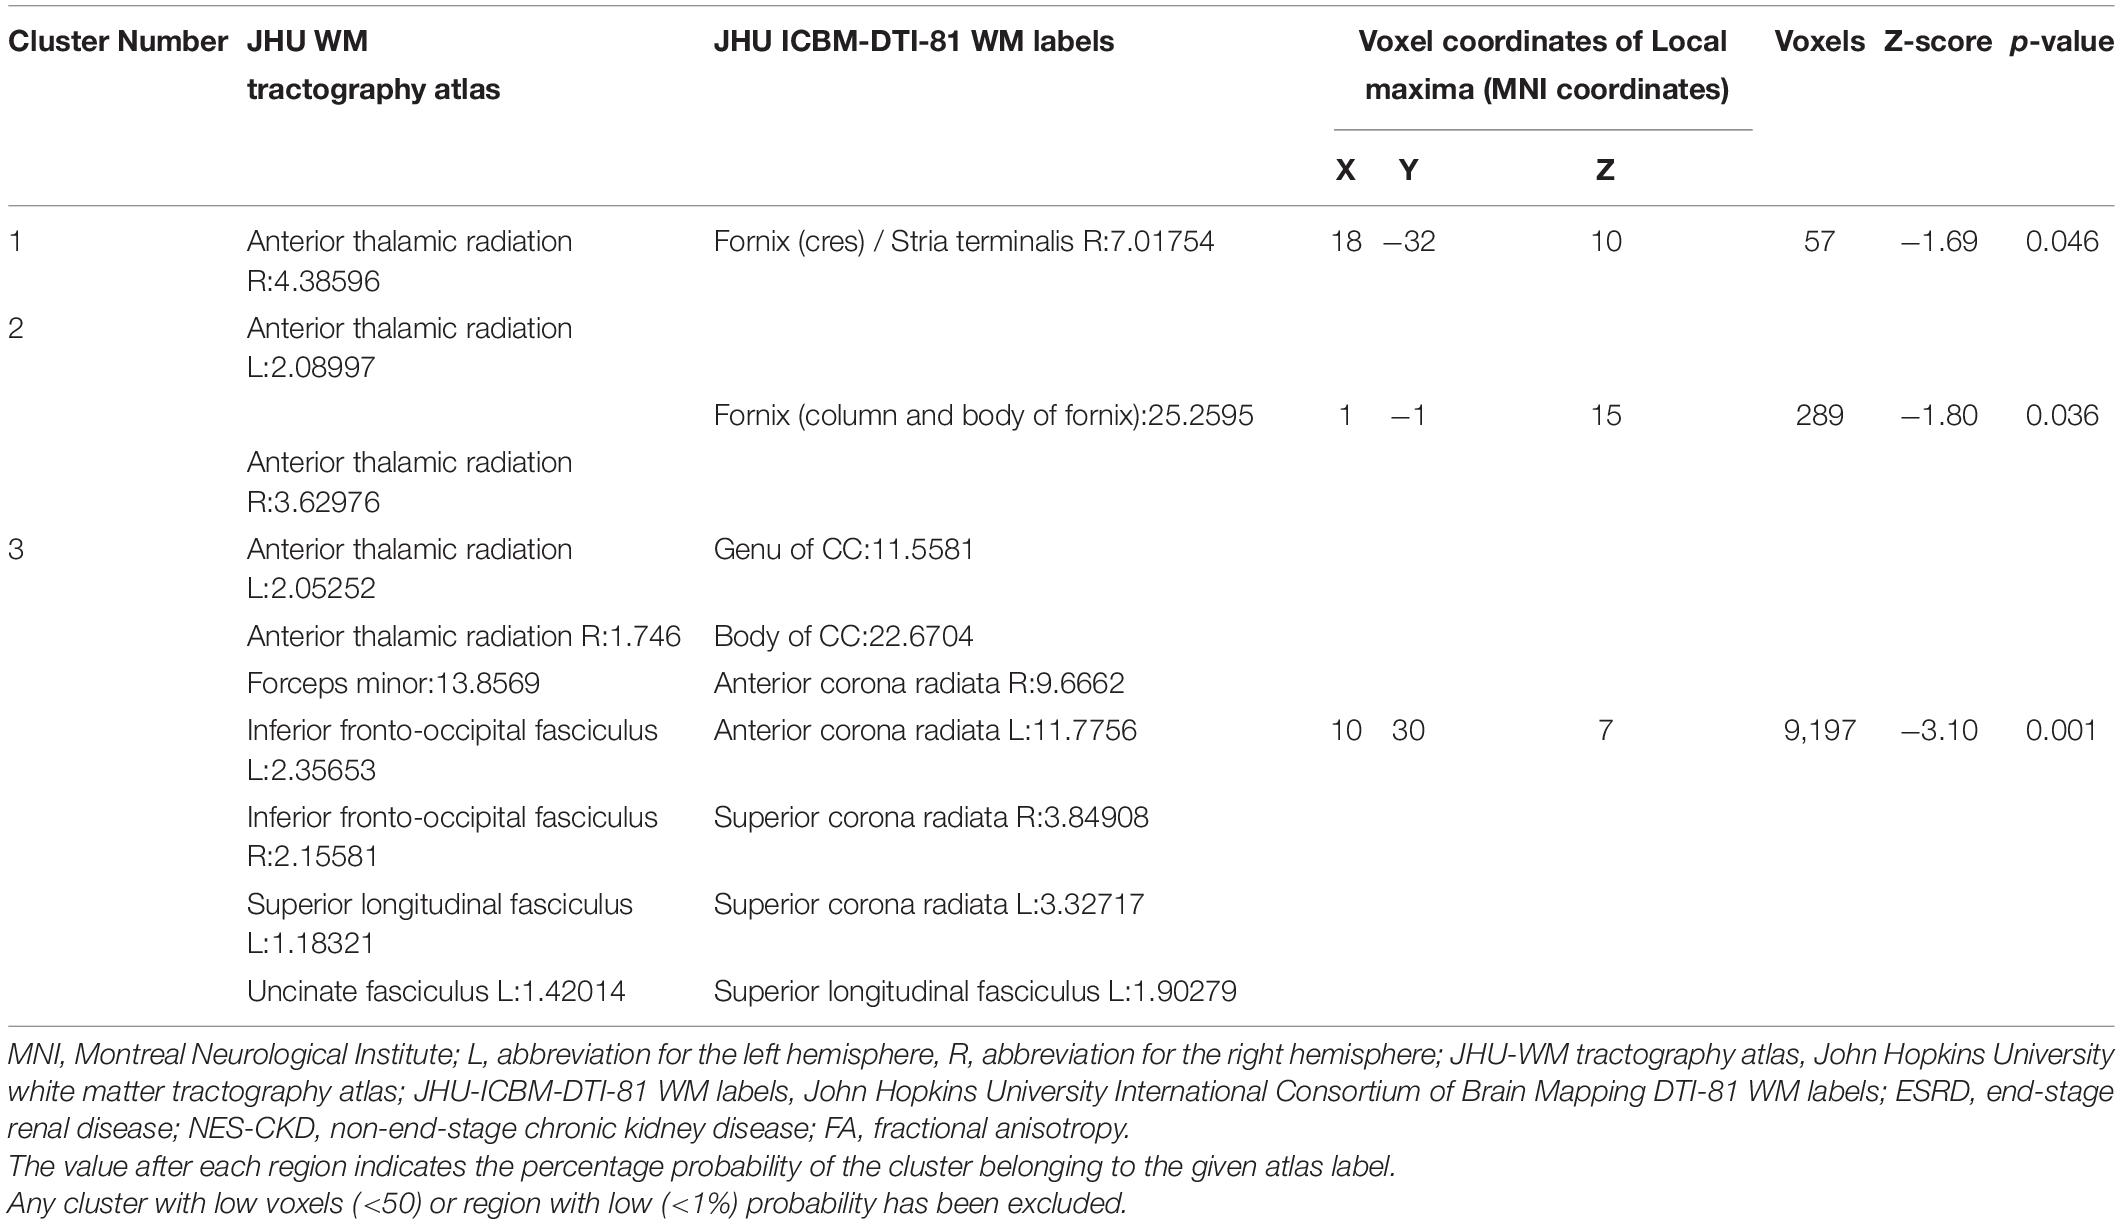
Table 2. Cluster sizes and locations for voxels with significantly reduced FA in ESRD vs. NES-CKD groups.
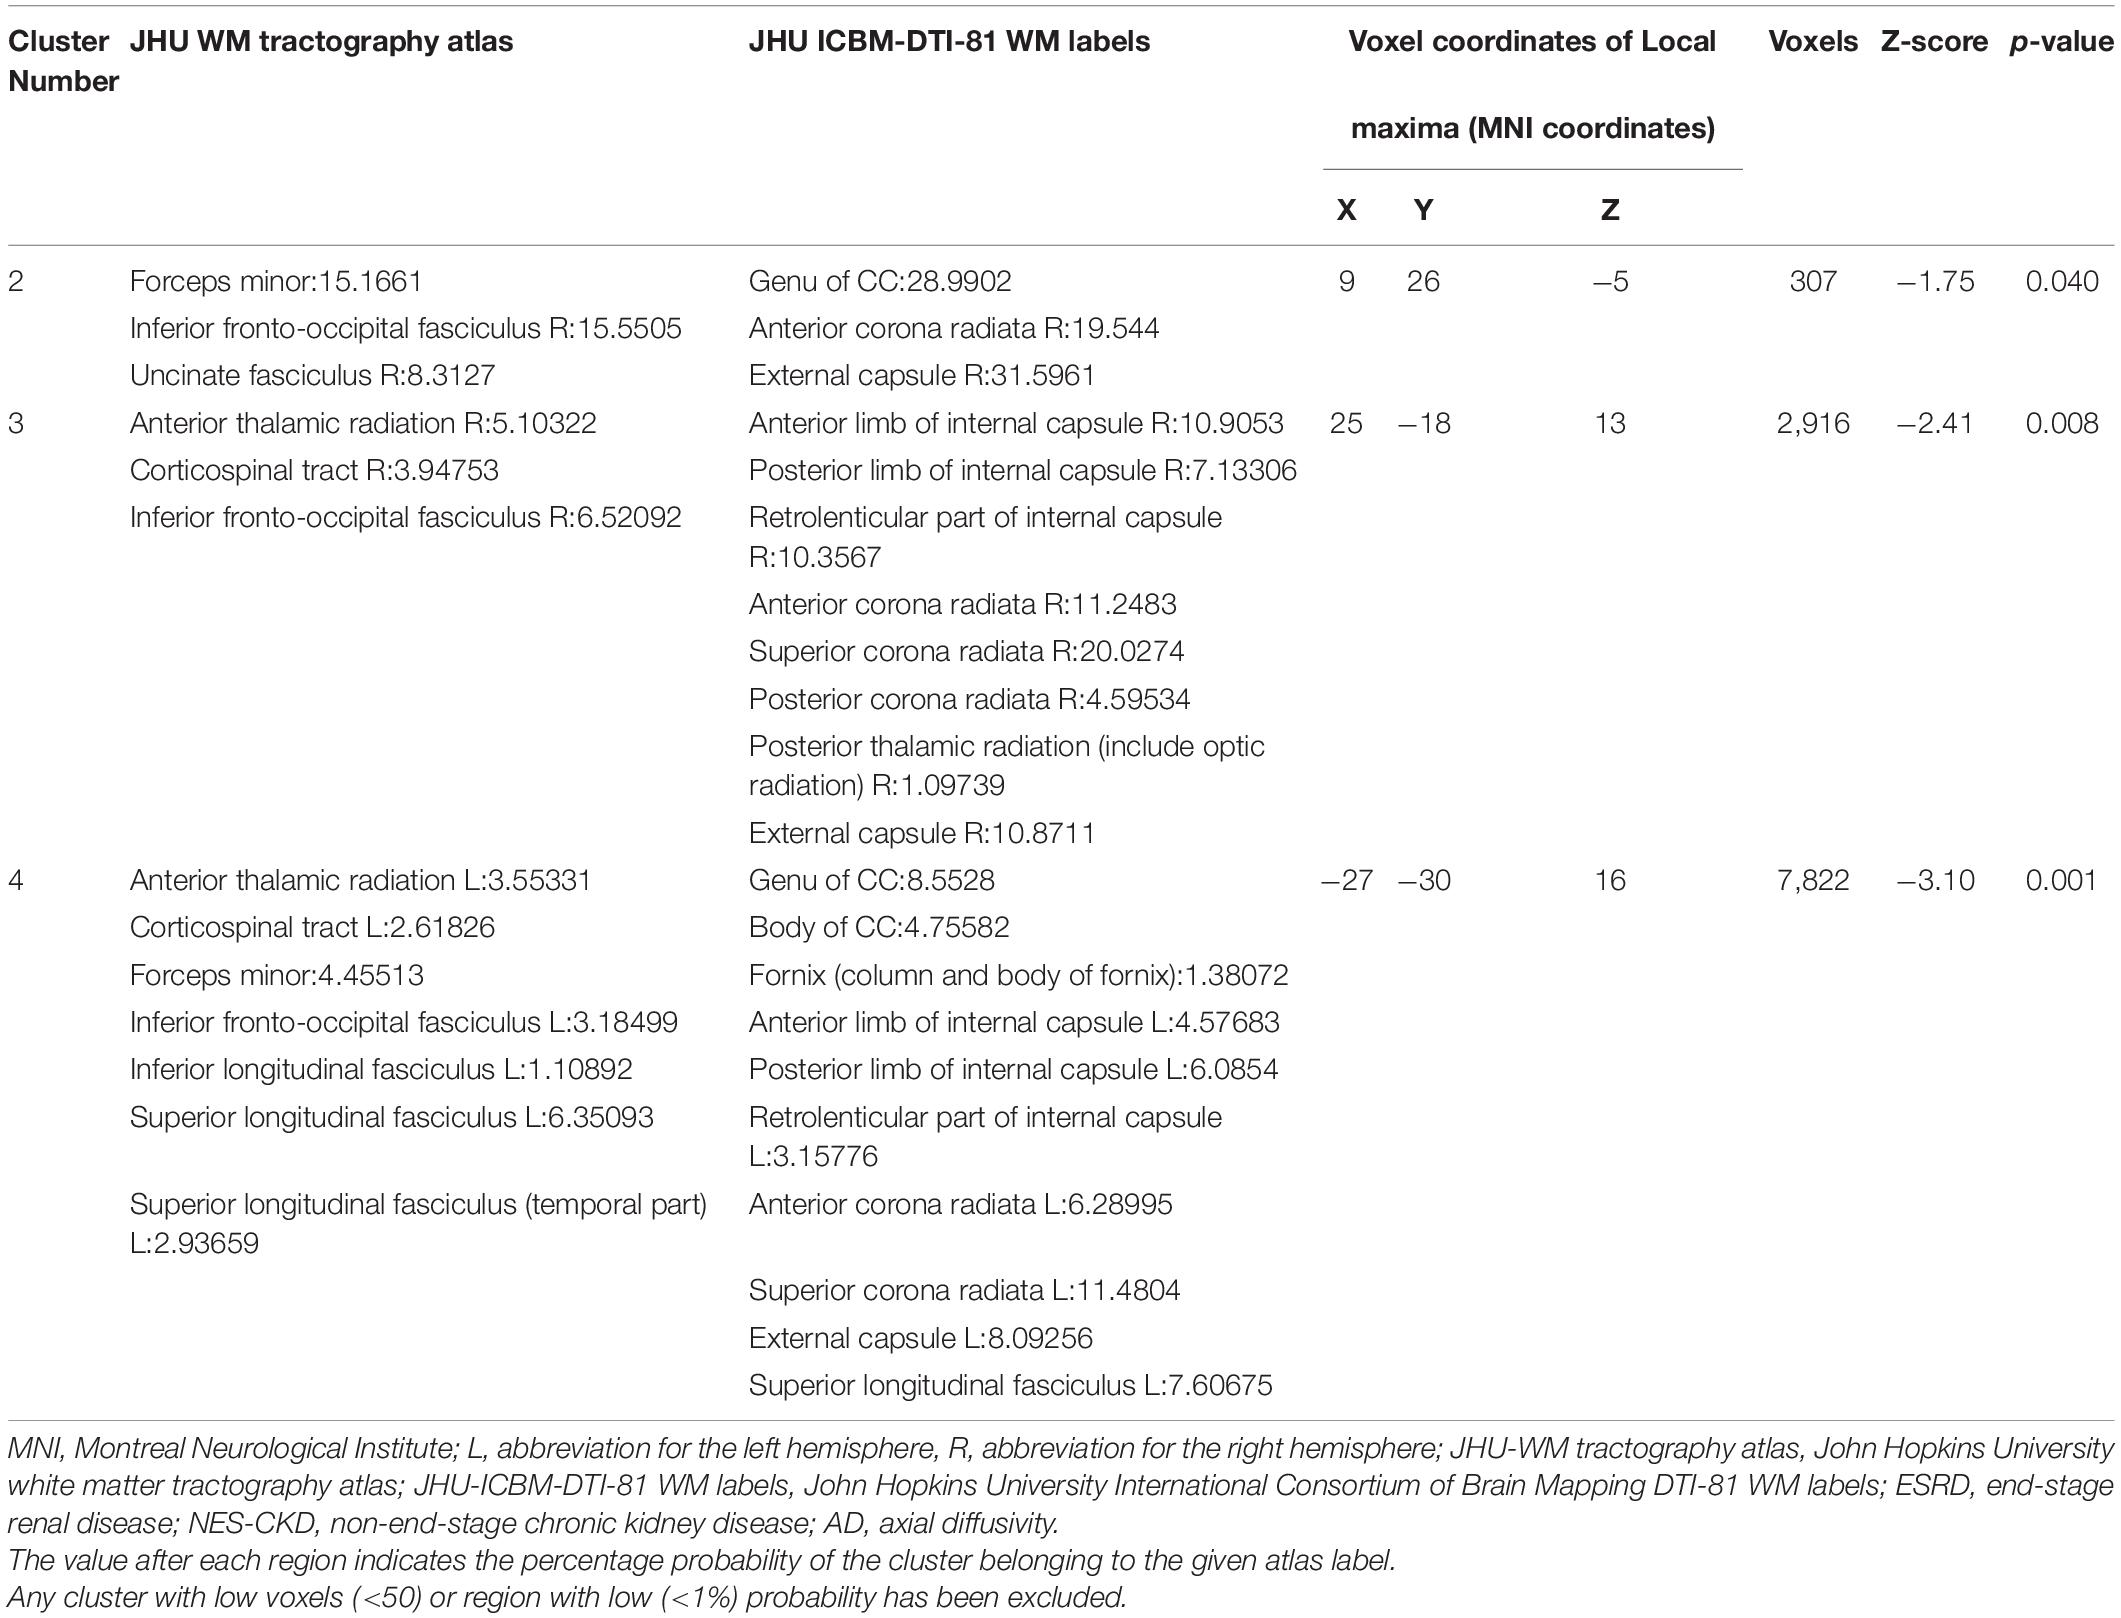
Table 3. Cluster sizes and locations for voxels with significantly increased AD in ESRD vs. NES-CKD groups.
NES-CKD vs. HC
We identified two independent clusters with statistically significant differences in FA values between the NES-CKD and HC groups. When compared to HC patients, all of these clusters showed decreased FA in the NES-CKD group (Figure 3).
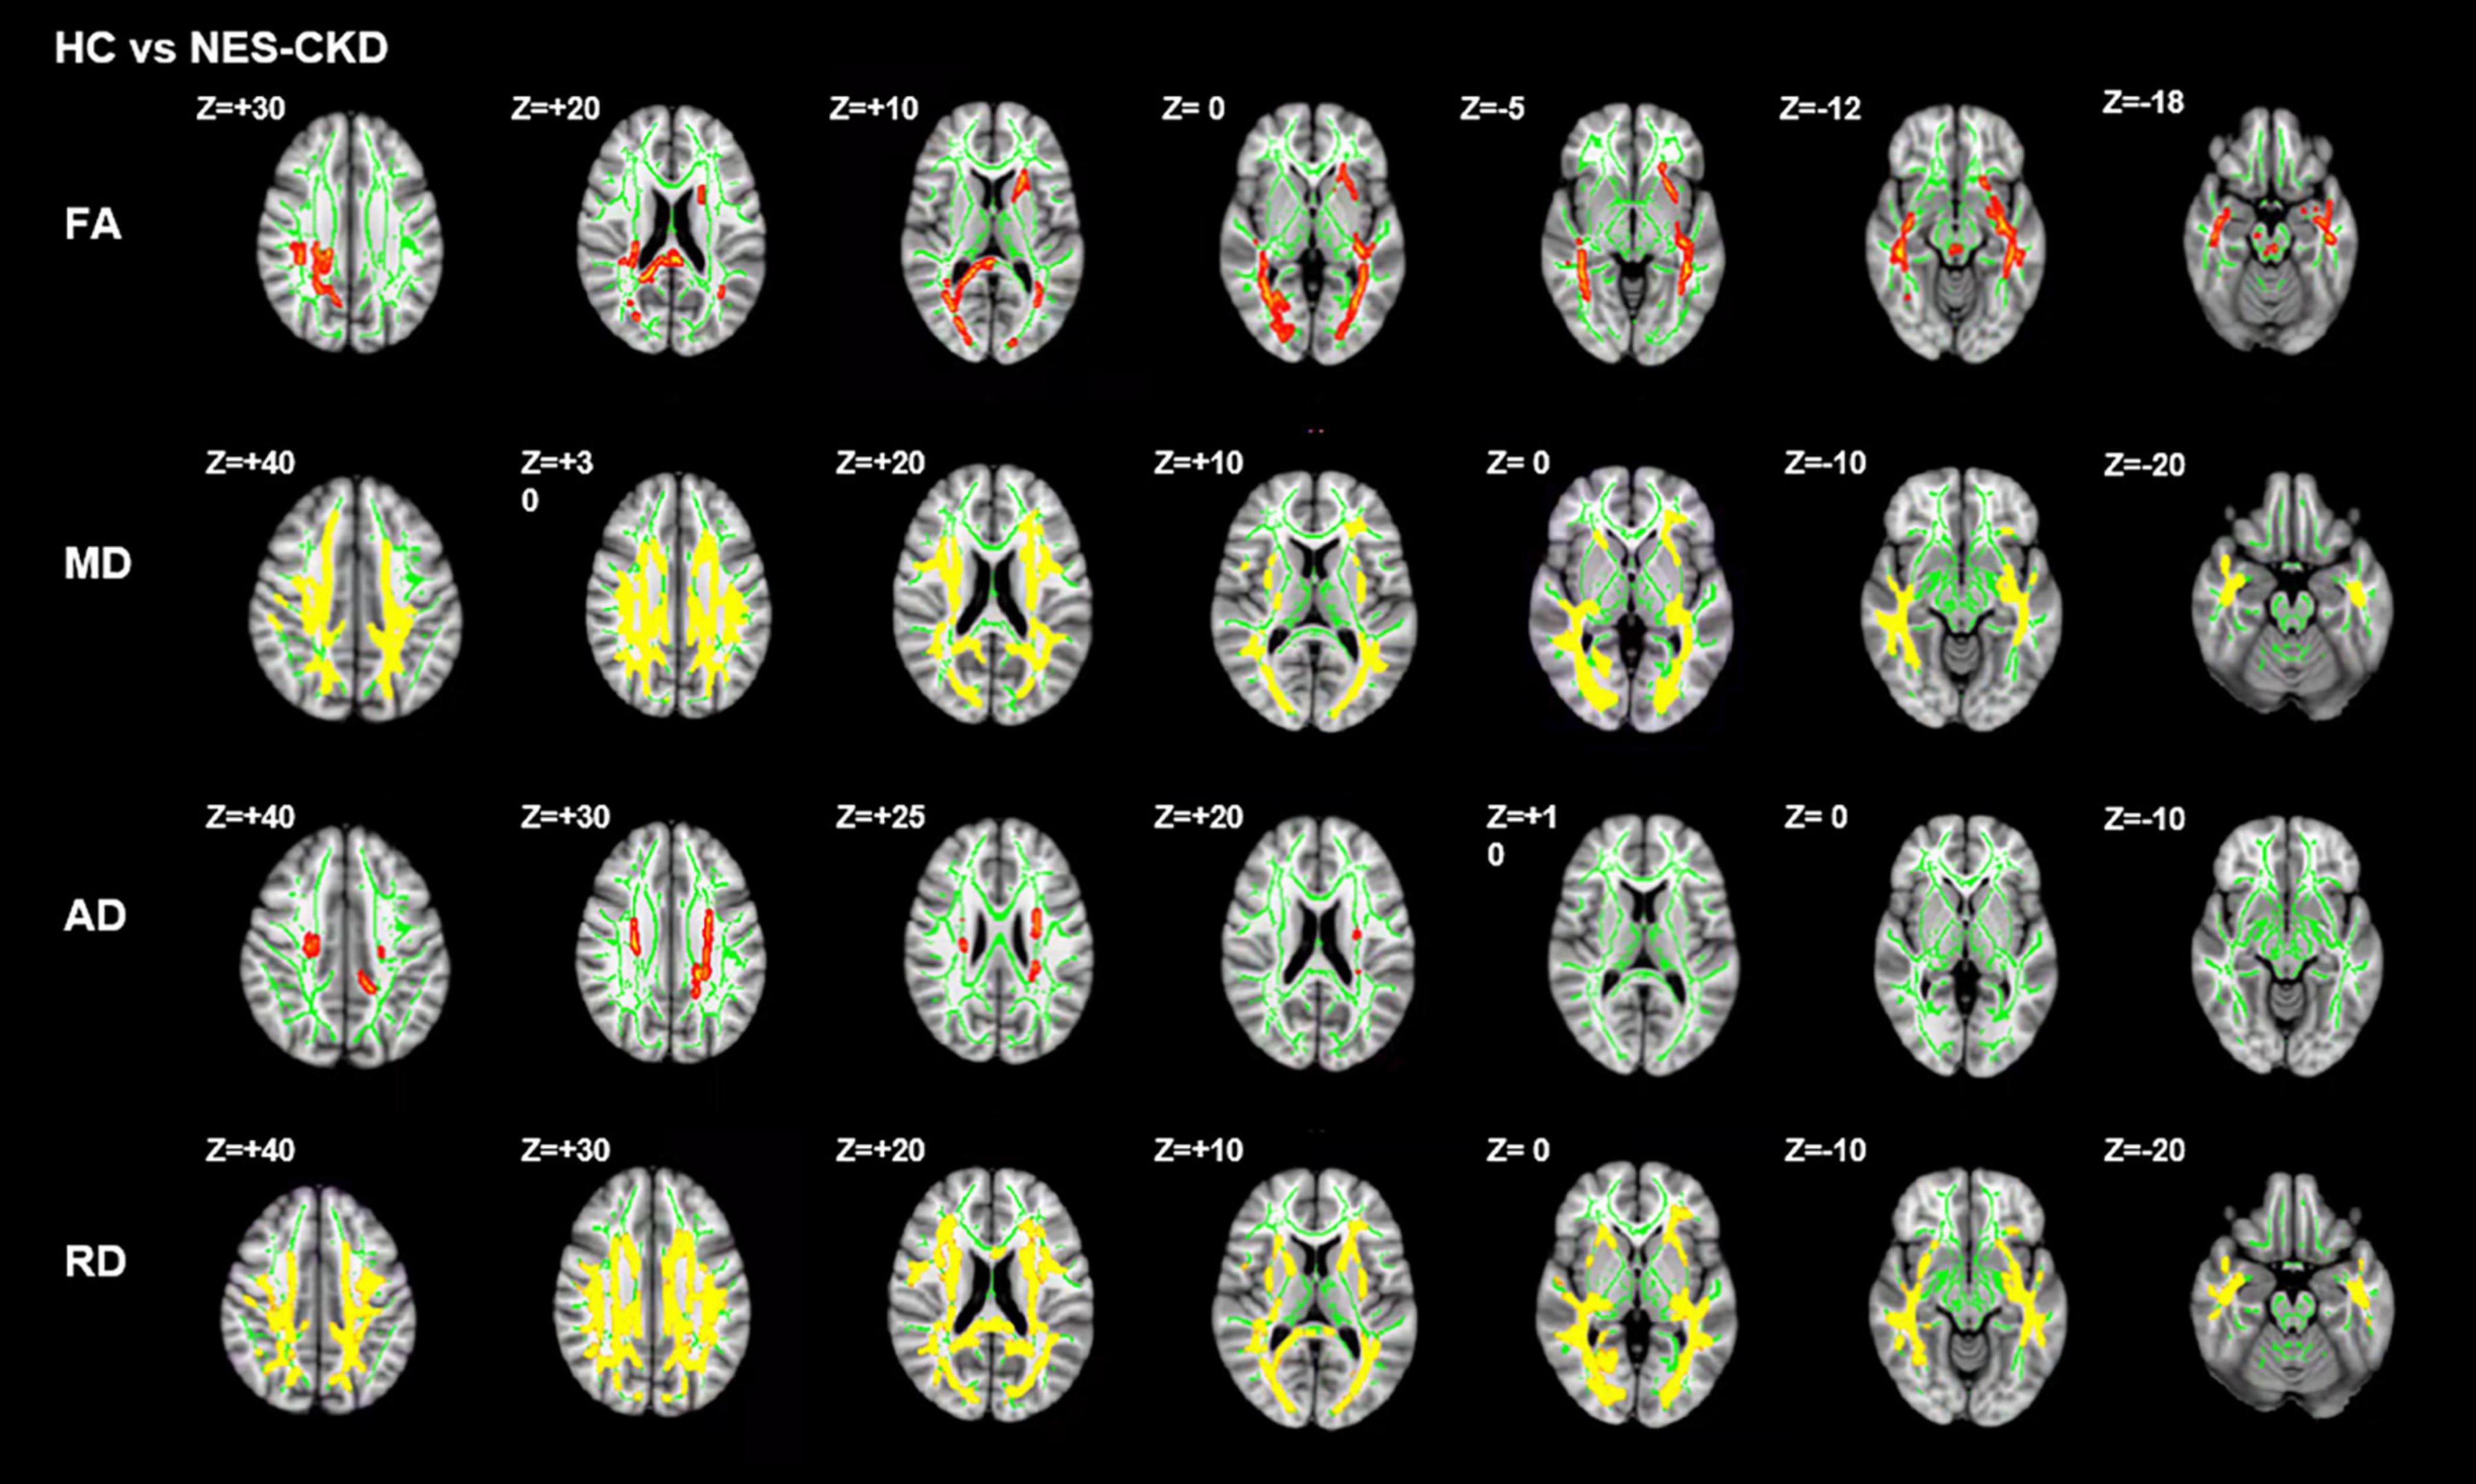
Figure 3. Post hoc analyses result between patients with NES-CKD and HCs. Green represents the mean FA skeleton of all subjects. Red–yellow represent regions with significant statistical values (p < 0.05, TFCE-corrected). NES-CKD, non-end-stage chronic kidney disease; HC, healthy control; FA, fractional anisotropy; MD, mean diffusivity; AD, axial diffusivity; RD, radial diffusivity.
Figure 4 showed the detailed locations of post hoc analyses between NES-CKD and HC groups. We found lower FA and higher MD, AD, and RD values in patients with NES-CKD compared with HCs. FA decreased mainly in forceps major, middle cerebellar peduncle, right corticospinal tract, right SLF, left ATR, bilateral IFOF, left ACR, left anterior limb of the internal capsule, left posterior thalamic radiation, left external capsule, splenium of CC, and right posterior corona radiata. Refer to Supplementary Table 3 for detailed information. Increased AD values are mainly located in the bilateral corona radiata, the body of CC, and bilateral corticospinal tracts (Supplementary Table 4). In addition, MD and RD values showed extensive and symmetrical increases in the deep WM. Detailed results were listed in Supplementary Tables 5, 6.
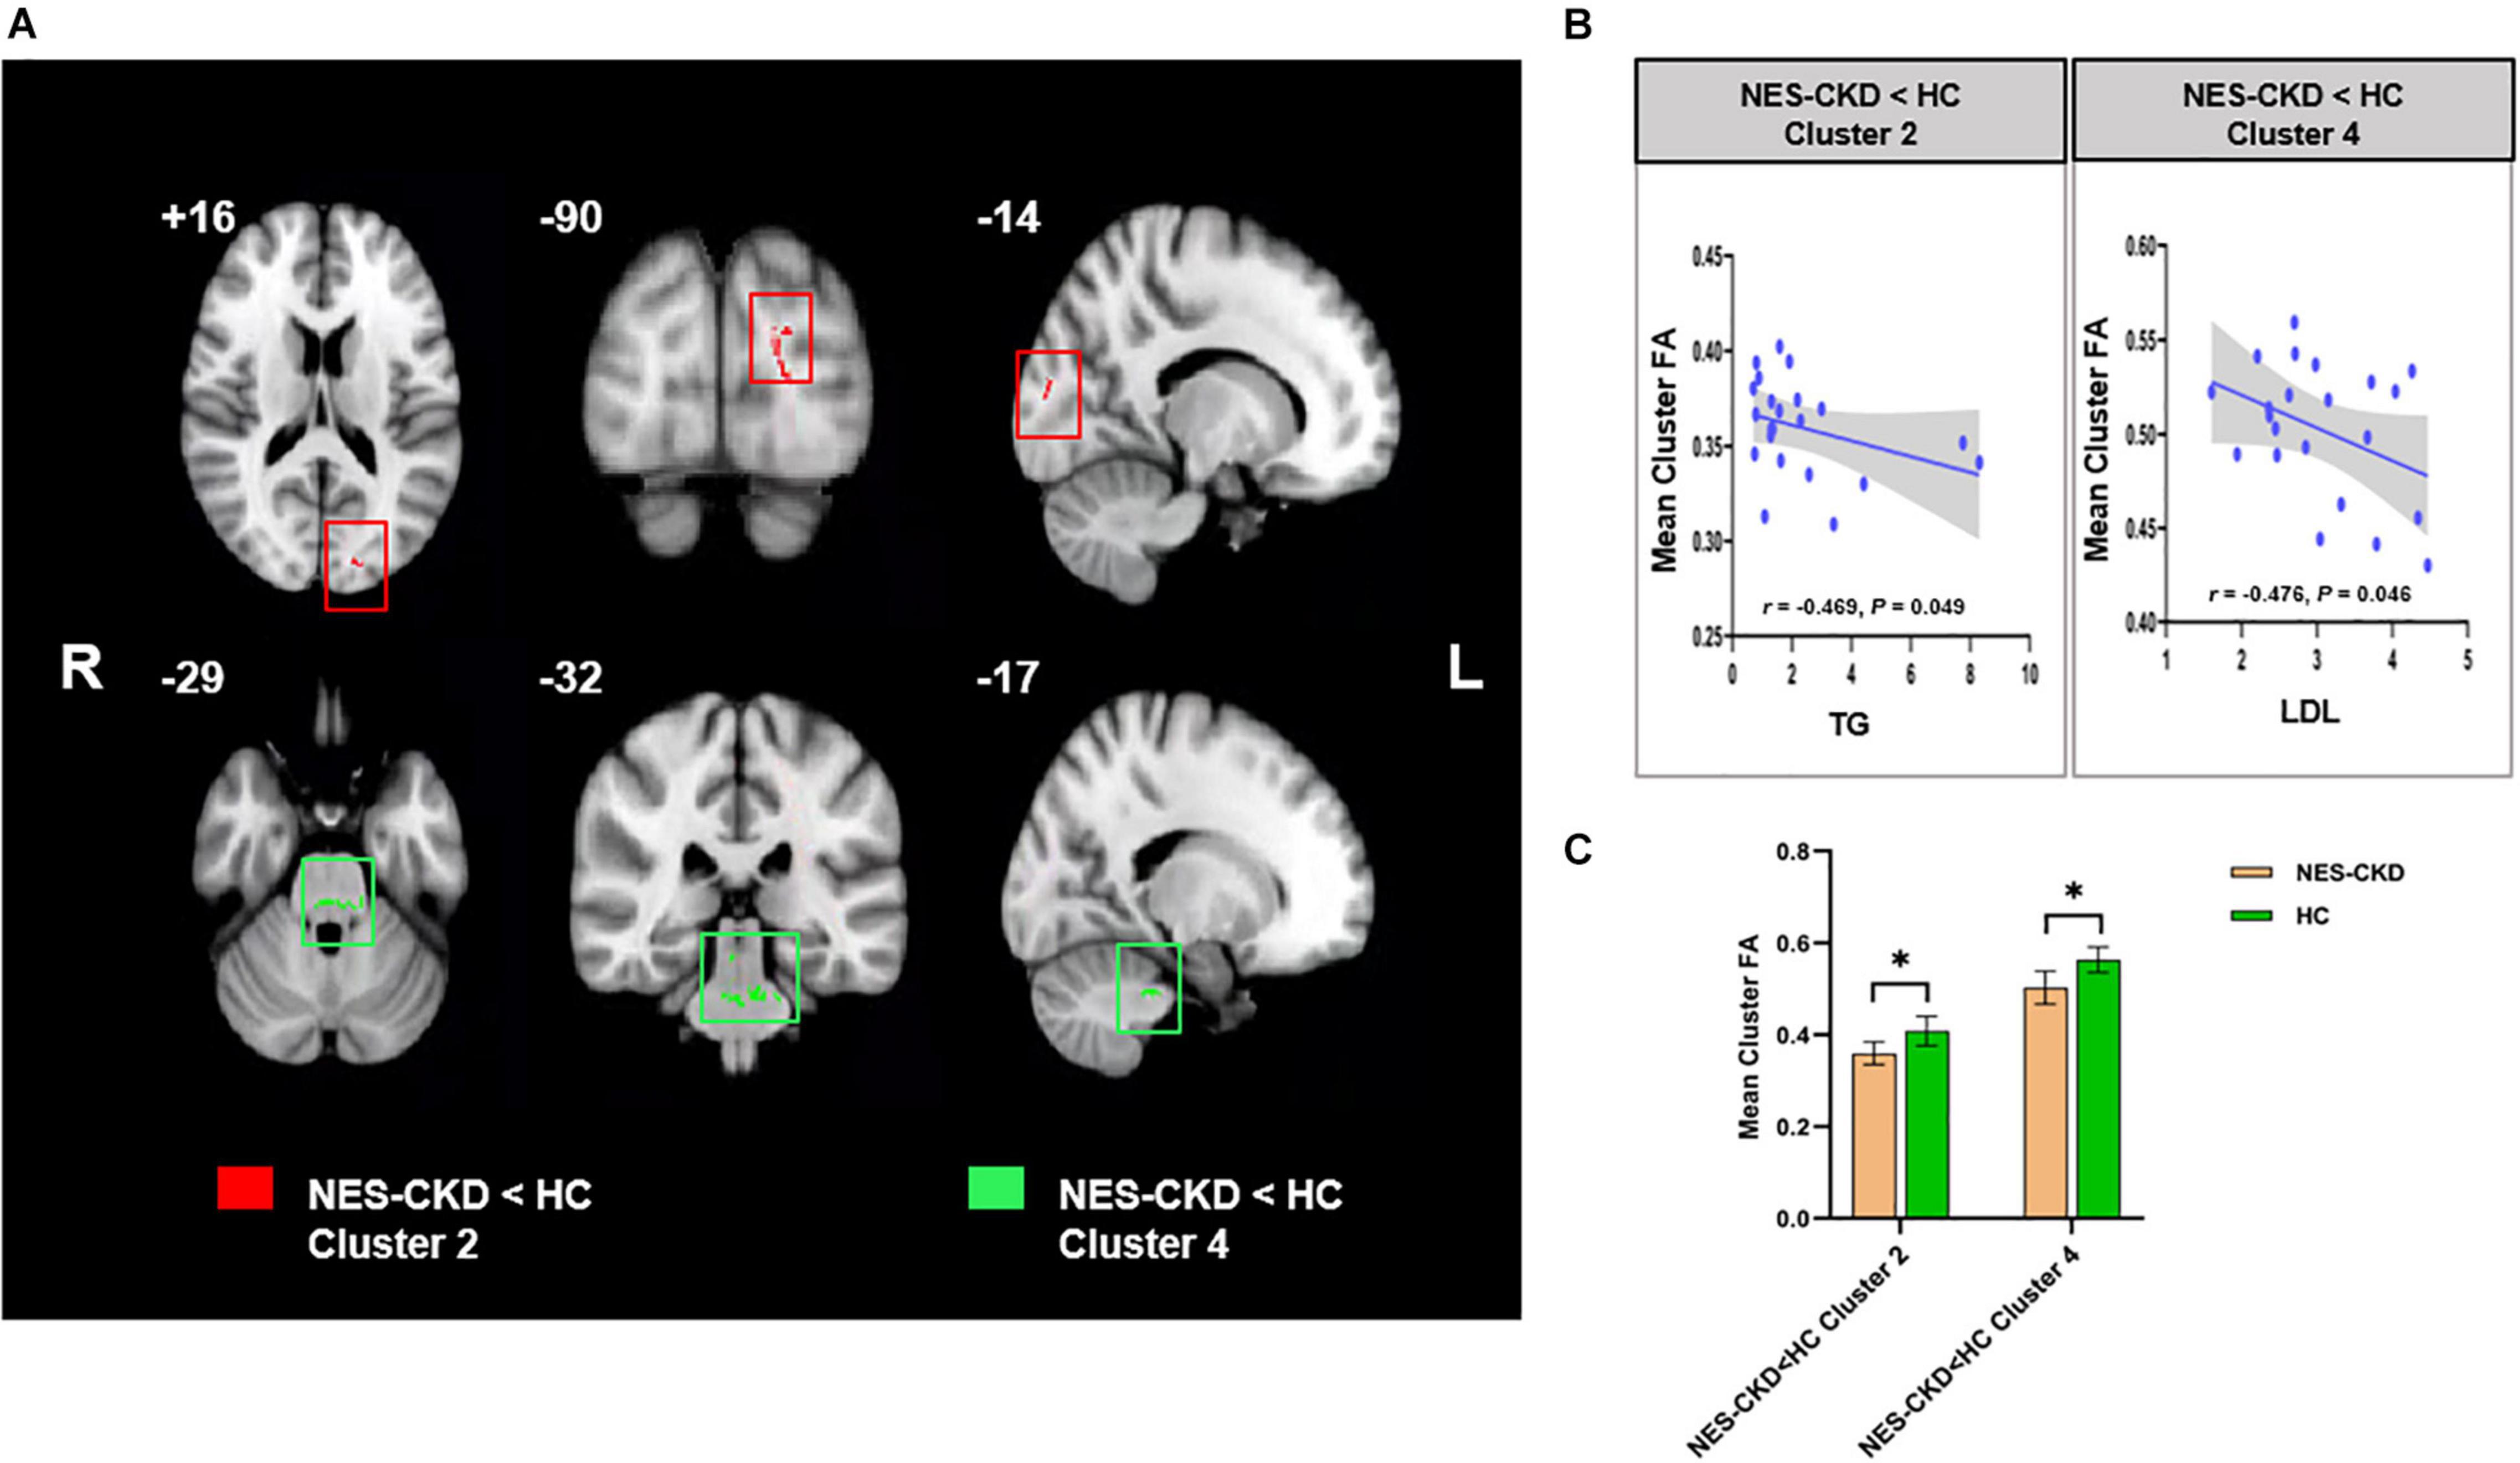
Figure 4. (A) Biochemical tests relevant clusters with statistically significant FA differences obtained from the NES-CKD and HCs. Cluster 2 is marked in red and Cluster 4 in green. (B) Relationship between mean cluster FA and TG (left) and LDL (right). (C) The bar plots represent the corresponding mean FA for each group. NES-CKD, non-end-stage chronic kidney disease; HC, healthy control; FA, fractional anisotropy. * indicates a statistical difference between the two groups, p < 0.05.
Correlation Analysis
In the NES-CKD group, partial correlation analysis was conducted between the clusters (with statistically significant differences between the NES-CKD and HC groups) and biochemical tests, and we only found mean FA values in two independent clusters (Cluster 2 and Cluster 4) negatively correlated with TG (r = −0.469, p = 0.049) and LDL (r = −0.476, p = 0.046), respectively (Figure 3). Obviously, they did not survive Bonferroni’s correction.
In the ESRD group, partial correlation analysis and multiple linear regression analysis revealed that UA level may serve as an independent predictor of mean FA changes in two clusters and mean AD changes in one cluster. Besides, LDL, P, and Urea levels may also be used as independent predictors of WM abnormalities in specific clusters with statistical differences in DTI parameters between ESRD and NES-CKD groups (Table 4). Figure 5 showed the above-mentioned results of the partial correlation analysis. Detailed correlations were displayed in Supplementary Figure 2. We did not find any relationship between mean diffusion metrics clusters and MoCA (p > 0.05).
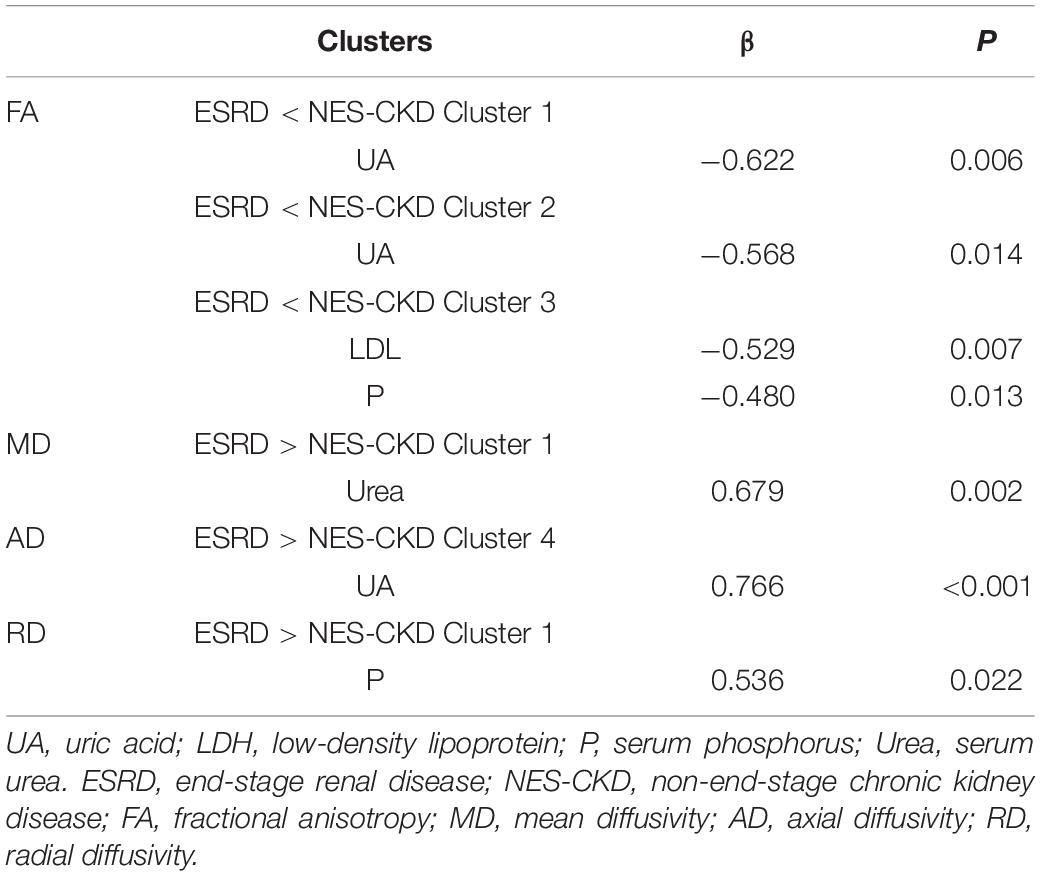
Table 4. Multiple linear regression analysis.
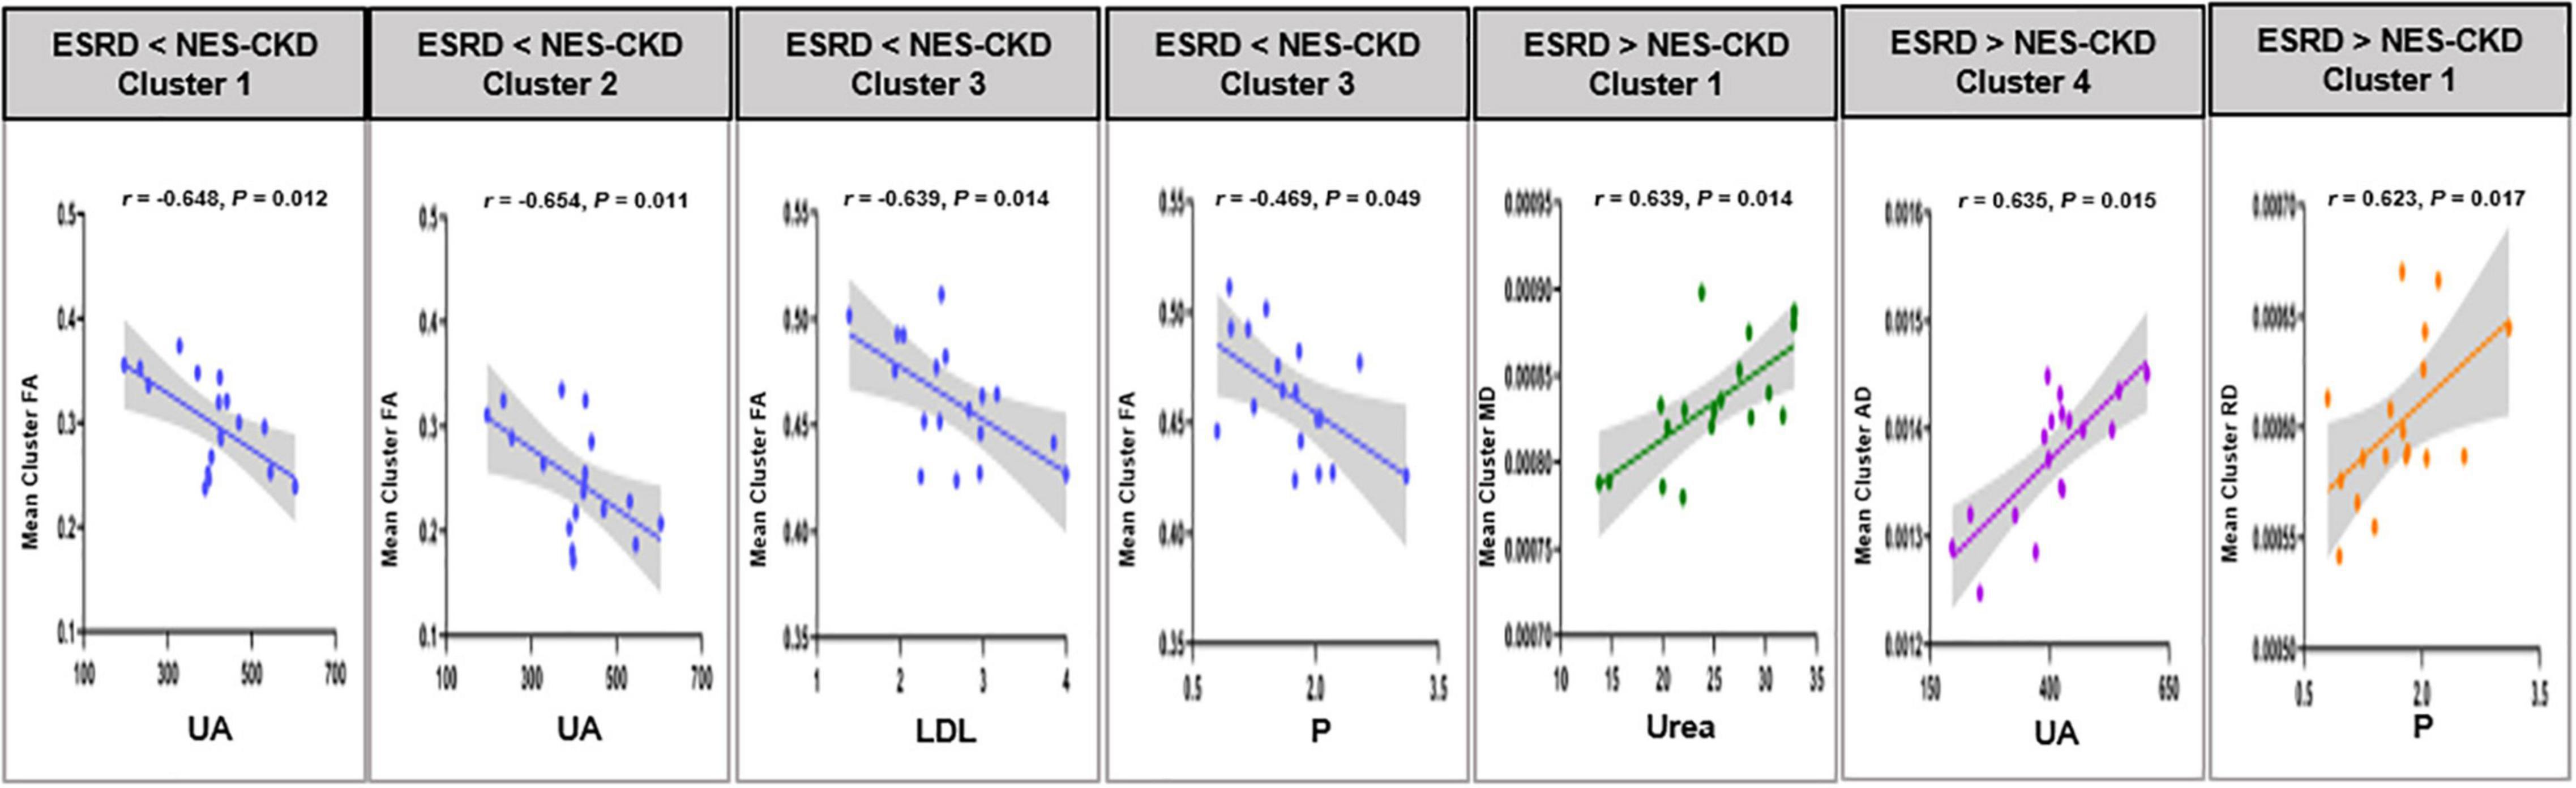
Figure 5. Relationship between mean cluster diffusion metrics and biochemical tests. UA, uric acid; LDH, low-density lipoprotein; P, serum phosphorus; Urea, serum urea. ESRD, end-stage renal disease; NES-CKD, non-end-stage chronic kidney disease; FA, fractional anisotropy; MD, mean diffusivity; AD, axial diffusivity; RD, radial diffusivity.
Discussion
In this study, we applied the TBSS method to investigate the difference in WM microstructure changes between patients with ESRD and NES-CKD and also NES-CKD and HCs. The relationship between DTI parameters and biochemical tests was also explored. The main findings of this work were as follows: (1) compared with HCs, FA values reduced, and MD, AD, and RD values increased significantly in patients with NES-CKD and ESRD, indicating the microstructural damage in patients with both ESRD and NES-CKD; (2) In comparison with patients with NES-CKD, patients with ESRD also showed a significant decrease in FA values and an increase in MD, AD, and RD values, which suggests that patients with ESRD have more serious WM microstructure abnormalities; (3) DTI parameters in some clusters were significantly correlated with biochemical tests, such as UA, Urea, and P, showing that these indicators may induce the fragility of WM microstructure in patients with ESRD.
At present, the research on the WM microstructure changes of NES-CKD by TBSS is very minimal, and only one study involving patients with stages 3 and 4 has been consulted (Liu et al., 2020). Similar to the results by Liu (Liu et al., 2020), our study also found decreased FA and increased MD values in multiple regions of patients with NES-CKD, especially in bilateral SLF, bilateral ILF, bilateral IFOF, CC, and bilateral corona radiata, in comparison with those of HCs.
Compared with the previous analyses based only on the FA and MD values, our study incorporated four diffusion metrics (FA, MD, AD, and RD), and thus the results can be more comprehensive. AD and RD indicate the degree of diffusion parallel to and perpendicular to the fiber orientation, respectively, and are sensitive to axon integrity and myelin damage. Our research showed that compared to healthy subjects, patients with NES-CKD have a broad and symmetrical increase in the RD value of WM microstructures, while the WM regions with increased AD values were relatively small. We speculate that in the progression of CKD, the reduction of FA is dominated by demyelination, and axonal injury only plays a small role. In addition, this study found that in regions where the MD values of patients with NES-CKD increased, the RD values also increased significantly. This finding has only been previously reported in ESRD (Chou et al., 2013). It is speculated that WM demyelination is the main neuropathy in patients with ESRD on long-term hemodialysis. But at present, changes in demyelination can also be observed in the progression of CKD. This also confirmed our above speculation.
In addition, in this study, reduced FA was observed in the middle cerebellar peduncle, which has not been mentioned previously. WM abnormalities in the infratentorial regions only have been reported in the study of ESRD after hemodialysis and were believed to be the results of transient edema and demyelination after hemodialysis (Tarhan et al., 2004; Lakadamyali and Ergün, 2011; Chou et al., 2013). However, the results of our study showed that there may also be changes in the microstructure of the subtentorial WM in patients with progressing CKD without dialysis, but the reason is still unclear and needs to be confirmed by larger samples or animal experiments.
Notably, in this study, we have found differences in WM characteristics between patients with ESRD and NES-CKD. To our knowledge, this is the first study applying TBSS to analyze the difference in WM microstructure between NES-CKDs and ESRDs.
In the ESRD group, although three independent clusters were identified with reduced FA values, and more than 96% voxels were located in Cluster 3, indicating that from non-end-stages to the end-stage, WM in patients with CKD has occurred large-scale alterations. Cluster 3 included voxels in the bilateral ATR, the genu and body of CC, bilateral ACR, bilateral superior corona radiata, bilateral IFOF, and left SLF. We found that most regions of this cluster were not shown in the different clusters between NES-CKD and HC groups, especially for genu and its extension radiating fibers (forceps minor) and body of CC and bilateral superior corona radiata, suggesting that the changes in WM characteristics in these regions only appear in the ESRD. As the largest WM tract, CC connects the bilateral hemispheres to realize their communication. Post hoc analysis showed decreased FA in the splenium of CC in patients with NES-CKD, while WM abnormalities in the genu and body of CC appeared in patients with ESRD, indicating that with the progress of CKD, the abnormality in WM microstructure of the CC is gradually developing. We also identified that WM damages appear mainly in superior brain portions of the ESRD group. Corona radiata includes the ascending and descending fibers of the thalamus and cerebral cortex and participates in various functions such as emotion, execution, and cognition (Drevets et al., 2008; Cui et al., 2020). Studies have confirmed that the incidence of depressive symptoms in patients with CKD is significantly higher than that of ordinary people (Fischer et al., 2012; Al-Ali et al., 2021). Therefore, we suspect that the WM damage of CR may be related to a certain degree of depressive symptoms in the enrolled patients. However, it is a pity that the depression has not been evaluated due to patients’ compliance, and follow-up studies are still needed.
Multiple regression analysis was conducted within the significant clusters and biochemical tests in the whole patients with ESRD to determine the impacts of biochemical indicators on WM microstructure. Excitingly, we identified the relationships between UA and mean FA or AD in three clusters demonstrating differences between ESRDs and NES-CKDs. Additionally, we also observed that these three clusters mainly include the region of ATR. ATR connects the mediodorsal and anterior thalamic nucleus with the frontal cortex and the anterior cingulate cortex and can also process information from the hippocampus (Setiadi et al., 2021), thus affecting cognitive function. Although there were literature supporting that UA can be beneficial to the pathological process of neurodegenerative diseases by reducing oxidative stress and free radicals (Kim et al., 2006; Lee et al., 2021), more and more studies have investigated the relationship between UA and cognitive impairment and found evidence about UA in exacerbating the deterioration of cognitive function (Beydoun et al., 2016; Li et al., 2021). Therefore, we speculate that UA may affect cognitive function through its effect on ATR. But this may be limited by the small sample size and the lack of correlation between UA and cognitive scores. Compared with the NES-CKD group, the phosphate and PTH levels in patients with ESRD were significantly higher, and the correlations observed in Table 4 indicated that the serum phosphate level may serve as an independent influencing factor of diffusion parameters in some significant clusters. This suggests an association between phosphate and WM abnormalities; however, little is known about the mechanism. When renal function is impaired, an increase in phosphate will cause the secretion of PTH but reduce the active form of vitamin D, which will induce secondary hyperparathyroidism (Tsuchiya and Akihisa, 2021). However, high PTH can affect the neurotransmission of the central nervous system and induce neurotoxicity (Wilmskoetter et al., 2019).
Several limitations of this study should be noted. First, the small sample size in this study may limit the generality of the results. Second, the enrolled patients with ESRD were all undergoing regular hemodialysis, and the effect of hemodialysis on WM abnormalities cannot be ruled out. Third, due to patient compliance issues, most patients have not completed the cognitive tests, which also has a certain impact on our results regarding cognitive function in patients. Fourth, patients with CKD at stages 1–4 were combined into one group for analysis. In the future, dynamic research on CKD can be considered to further reveal the changes in WM at different stages.
Conclusion
In conclusion, the results of this study indicate that compared with patients in the progression of CKD, patients with ESRD have more severe WM microstructural abnormalities, and this progressive deterioration is related to uric acid and phosphate levels.
Data Availability Statement
The original contributions presented in the study are included in the article/Supplementary Material, further inquiries can be directed to the corresponding author/s.
Ethics Statement
The studies involving human participants were reviewed and approved by the Local Ethics Committee of the First Affiliated Hospital of Dalian Medical University. The patients/participants provided their written informed consent to participate in this study. Written informed consent was obtained from the individual(s) for the publication of any potentially identifiable images or data included in this article.
Author Contributions
YJ and QG were the guarantor of integrity of the entire study. YJ, QG, YL, BG, YC, JJ, and PC performed the literature research. YJ, QG, YL, BG, YC, JJ, PC, QS, LL, NW, WW, and YM performed the clinical studies. YJ, QG, NW, and YM performed experimental studies and manuscript editing. YJ, QG, and JJ performed statistical analysis. All authors contributed to study concepts, study design, data acquisition, data analysis/interpretation, involved in manuscript drafting and manuscript revision for important intellectual content, approved the final version of the submitted manuscript, and agreed to ensure that any questions related to the work are appropriately resolved.
Funding
This study was supported by the National Natural Science Foundation of China (Nos. 81671646 and 81801657).
Conflict of Interest
LL was employed by the company Philips Healthcare China.
The remaining authors declare that the research was conducted in the absence of any commercial or financial relationships that could be construed as a potential conflict of interest.
Publisher’s Note
All claims expressed in this article are solely those of the authors and do not necessarily represent those of their affiliated organizations, or those of the publisher, the editors and the reviewers. Any product that may be evaluated in this article, or claim that may be made by its manufacturer, is not guaranteed or endorsed by the publisher.
Supplementary Material
The Supplementary Material for this article can be found online at: https://www.frontiersin.org/articles/10.3389/fnhum.2021.774236/full#supplementary-material
Abbreviations
AD, axial diffusivity; ATR, anterior thalamic radiation; CKD, chronic kidney disease; CST, corticospinal; ESRD, end-stage renal disease; FA, fractional anisotropy; FDR, false discovery rate; LDL, low-density lipoprotein; P, serum phosphorus; MD, mean diffusivity; MoCA, Montreal Cognitive Assessment; RD, radial diffusivity; TBSS, tract-based spatial statistics; NES-CKD, non-end-stage chronic kidney disease; Urea, serum urea; UA, uric acid.
Footnotes
References
Al-Ali, F., Elshirbeny, M., Hamad, A., Kaddourah, A., Ghonimi, T., Ibrahim, R., et al. (2021). Prevalence of depression and sleep disorders in patients on dialysis: a cross-sectional study in qatar. Int. J. Nephrol. 2021:5533416. doi: 10.1155/2021/5533416
Andersson, J. L. R., and Sotiropoulos, S. N. (2016). An integrated approach to correction for off-resonance effects and subject movement in diffusion MR imaging. Neuroimage 125, 1063–1078. doi: 10.1016/j.neuroimage.2015.10.019
Bartzokis, G. (2011). Alzheimer’s disease as homeostatic responses to age-related myelin breakdown. Neurobiol. Aging 32, 1341–1371. doi: 10.1016/j.neurobiolaging.2009.08.007
Beydoun, M. A., Canas, J. A., Dore, G. A., Beydoun, H. A., Rostant, O. S., Fanelli-Kuczmarski, M. T., et al. (2016). Serum uric acid and its association with longitudinal cognitive change among urban adults. J Alzheimers Dis. 52, 1415–1430. doi: 10.3233/JAD-160028
Chen, H. J., Gao, Y. Q., Che, C. H., Lin, H., and Ruan, X. L. (2018). Diffusion tensor imaging with tract-based spatial statistics reveals white matter abnormalities in patients with vascular cognitive impairment. Front. Neuroanat. 12:53. doi: 10.3389/fnana.2018.00053
Chou, M. C., Hsieh, T. J., Lin, Y. L., Hsieh, Y. T., Li, W. Z., Chang, J. M., et al. (2013). Widespread white matter alterations in patients with end-stage renal disease: a voxelwise diffusion tensor imaging study. AJNR Am. J. Neuroradiol. 34, 1945–1951. doi: 10.3174/ajnr.A3511
Chou, M. C., Ko, C. H., Hsieh, T. J., Chang, J. M., and Chung, W. S. (2019). A preliminary report of longitudinal white matter alterations in patients with end-stage renal disease: a three-year diffusion tensor imaging study. PLoS One 14:e0215942. doi: 10.1371/journal.pone.0215942
Cui, Y., Dong, J., Yang, Y., Yu, H., Li, W., Liu, Y., et al. (2020). White matter microstructural differences across major depressive disorder, bipolar disorder and schizophrenia: a tract-based spatial statistics study. J. Affect. Disord. 260, 281–286. doi: 10.1016/j.jad.2019.09.029
Drevets, W. C., Price, J. L., and Furey, M. L. (2008). Brain structural and functional abnormalities in mood disorders: implications for neurocircuitry models of depression. Brain Struct. Funct. 213, 93–118. doi: 10.1007/s00429-008-0189-x
Egbi, O. G., Ogunrin, O., and Oviasu, E. (2015). Prevalence and determinants of cognitive impairment in patients with chronic kidney disease: a cross-sectional study in Benin City, Nigeria. Ann. Afr. Med. 14, 75–81. doi: 10.4103/1596-3519.149877
Fieremans, E., Jensen, J. H., and Helpern, J. A. (2011). White matter characterization with diffusional kurtosis imaging. Neuroimage 58, 177–188. doi: 10.1016/j.neuroimage.2011.06.006
Fischer, M. J., Xie, D., Jordan, N., Kop, W. J., Krousel-Wood, M., Kurella Tamura, M., et al. (2012). Factors associated with depressive symptoms and use of antidepressant medications among participants in the Chronic Renal Insufficiency Cohort (CRIC) and Hispanic-CRIC Studies. Am. J. Kidney Dis. 60, 27–38. doi: 10.1053/j.ajkd.2011.12.033
Hagmann, P., Jonasson, L., Maeder, P., Thiran, J. P., Wedeen, V. J., and Meuli, R. (2006). Understanding diffusion MR imaging techniques: from scalar diffusion-weighted imaging to diffusion tensor imaging and beyond. Radiographics 26 Suppl 1, S205–S223. doi: 10.1148/rg.26si065510
Kim, T. S., Pae, C. U., Yoon, S. J., Jang, W. Y., Lee, N. J., Kim, J. J., et al. (2006). Decreased plasma antioxidants in patients with Alzheimer’s disease. Int. J. Geriatr. Psychiatry 21, 344–348. doi: 10.1002/gps.1469
Kong, X., Wen, J. Q., Qi, R. F., Luo, S., Zhong, J. H., Chen, H. J., et al. (2014). Diffuse interstitial brain edema in patients with end-stage renal disease undergoing hemodialysis: a tract-based spatial statistics study. Medicine (Baltimore) 93:e313. doi: 10.1097/MD.0000000000000313
Lakadamyali, H., and Ergün, T. (2011). MRI for acute neurologic complications in end-stage renal disease patients on hemodialysis. Diagn. Interv. Radiol. 17, 112–117. doi: 10.4261/1305-3825.DIR.3063-09.1
Lee, Y. G., Park, M., Jeong, S. H., Kang, S. W., Baik, K., Jung, J. H., et al. (2021). Effects of baseline serum uric acid and apolipoprotein E4 on longitudinal cognition and cerebral metabolism. Neurobiol. Aging 106, 223–231. doi: 10.1016/j.neurobiolaging.2021.05.003
Li, L. L., Ma, Y. H., Bi, Y. L., Sun, F. R., Hu, H., Hou, X. H., et al. (2021). Serum uric acid may aggravate Alzheimer’s disease risk by affecting amyloidosis in cognitively intact older adults: the cable study. J. Alzheimers Dis. 81, 389–401. doi: 10.3233/JAD-201192
Lim, L., Hart, H., Howells, H., Mehta, M. A., Simmons, A., Mirza, K., et al. (2019). Altered white matter connectivity in young people exposed to childhood abuse: a tract-based spatial statistics (TBSS) and tractography study. J. Psychiatry Neurosci. 44, E11–E20. doi: 10.1503/jpn.170241
Liu, M., Wu, Y., Wu, X., Ma, X., Yin, Y., Fang, H., et al. (2020). White matter microstructure changes and cognitive impairment in the progression of chronic kidney disease. Front. Neurosci. 14:559117. doi: 10.3389/fnins.2020.559117
Mei, L., Li, X., Zhou, G., Ji, T., Chen, J., Xu, Z., et al. (2020). Effects of obstructive sleep apnoea severity on neurocognitive and brain white matter alterations in children according to sex: a tract-based spatial statistics study. Sleep Med. 82, 134–143. doi: 10.1016/j.sleep.2020.08.026
Metzler-Baddeley, C., Mole, J. P., Sims, R., Fasano, F., Evans, J., Jones, D. K., et al. (2019). Fornix white matter glia damage causes hippocampal gray matter damage during age-dependent limbic decline. Sci. Rep. 9:1060.
Navva, P. K., Venkata Sreepada, S., and Shivanand Nayak, K. (2015). Present status of renal replacement therapy in asian countries. Blood Purif. 40, 280–287. doi: 10.1159/000441574
Nucifora, P. G., Verma, R., Lee, S. K., and Melhem, E. R. (2007). Diffusion-tensor MR imaging and tractography: exploring brain microstructure and connectivity. Radiology 245, 367–384. doi: 10.1148/radiol.2452060445
Qi, R., Zhang, L. J., Zhong, J., Zhu, T., Zhang, Z., Xu, C., et al. (2013). Grey and white matter abnormalities in minimal hepatic encephalopathy: a study combining voxel-based morphometry and tract-based spatial statistics. Eur. Radiol. 23, 3370–3378. doi: 10.1007/s00330-013-2963-2
Raffelt, D. A., Smith, R. E., Ridgway, G. R., Tournier, J. D., Vaughan, D. N., Rose, S., et al. (2015). Connectivity-based fixel enhancement: whole-brain statistical analysis of diffusion MRI measures in the presence of crossing fibres. Neuroimage 117, 40–55. doi: 10.1016/j.neuroimage.2015.05.039
Sarnak, M. J., Tighiouart, H., Scott, T. M., Lou, K. V., Sorensen, E. P., Giang, L. M., et al. (2013). Frequency of and risk factors for poor cognitive performance in hemodialysis patients. Neurology 80, 471–480. doi: 10.1212/WNL.0b013e31827f0f7f
Setiadi, T. M., Martens, S., Opmeer, E. M., Marsman, J. C., Tumati, S., Reesink, F. E., et al. (2021). Widespread white matter aberration is associated with the severity of apathy in amnestic mild cognitive impairment: tract-based spatial statistics analysis. Neuroimage Clin. 29:102567. doi: 10.1016/j.nicl.2021.102567
Smith, S. M., and Nichols, T. E. (2009). Threshold-free cluster enhancement: addressing problems of smoothing, threshold dependence and localisation in cluster inference. Neuroimage 44, 83–98. doi: 10.1016/j.neuroimage.2008.03.061
Smith, S. M., Jenkinson, M., Johansen-Berg, H., Rueckert, D., Nichols, T. E., Mackay, C. E., et al. (2006). Tract-based spatial statistics: voxelwise analysis of multi-subject diffusion data. Neuroimage 31, 1487–1505.
Smith, S. M., Jenkinson, M., Woolrich, M. W., Beckmann, C. F., Behrens, T. E., Johansen-Berg, H., et al. (2004). Advances in functional and structural MR image analysis and implementation as FSL. Neuroimage 23 Suppl 1, S208–S219. doi: 10.1016/j.neuroimage.2004.07.051
Tarhan, N. C., Agildere, A. M., Benli, U. S., Ozdemir, F. N., Aytekin, C., and Can, U. (2004). Osmotic demyelination syndrome in end-stage renal disease after recent hemodialysis: MRI of the brain. AJR Am. J. Roentgenol. 182, 809–816. doi: 10.2214/ajr.182.3.1820809
Tiffin-Richards, F. E., Costa, A. S., Holschbach, B., Frank, R. D., Vassiliadou, A., Krüger, T., et al. (2014). The montreal cognitive assessment (MoCA) – a sensitive screening instrument for detecting cognitive impairment in chronic hemodialysis patients. PLoS One 9:e106700. doi: 10.1371/journal.pone.0106700
Tsuchiya, K., and Akihisa, T. (2021). The importance of phosphate control in chronic kidney disease. Nutrients 13:1670. doi: 10.3390/nu13051670
Vogels, S. C., Emmelot-Vonk, M. H., Verhaar, H. J., and Koek, H. L. (2012). The association of chronic kidney disease with brain lesions on MRI or CT: a systematic review. Maturitas 71, 331–336. doi: 10.1016/j.maturitas.2012.01.008
Webster, A. C., Nagler, E. V., Morton, R. L., and Masson, P. (2017). Chronic kidney disease. Lancet 389, 1238–1252.
Wilmskoetter, J., Fridriksson, J., Gleichgerrcht, E., Stark, B. C., Delgaizo, J., Hickok, G., et al. (2019). Neuroanatomical structures supporting lexical diversity, sophistication, and phonological word features during discourse. Neuroimage Clin. 24:101961. doi: 10.1016/j.nicl.2019.101961
Winkler, A. M., Ridgway, G. R., Webster, M. A., Smith, S. M., and Nichols, T. E. (2014). Permutation inference for the general linear model. Neuroimage 92, 381–397. doi: 10.1016/j.neuroimage.2014.01.060
Yamada, S., Takahashi, S., Ohoshi, Y., Ishida, T., Tsuji, T., Shinosaki, K., et al. (2020). Widespread white matter microstructural abnormalities and cognitive impairment in schizophrenia, bipolar disorder, and major depressive disorder: tract-based spatial statistics study. Psychiatry Res. Neuroimaging 298:111045. doi: 10.1016/j.pscychresns.2020.111045
Yin, Y., Li, M., Li, C., Ma, X., Yan, J., Wang, T., et al. (2018). Reduced white matter integrity with cognitive impairments in end stage renal disease. Front. Psychiatry 9:143. doi: 10.3389/fpsyt.2018.00143
Zhang, H., Schneider, T., Wheeler-Kingshott, C. A., and Alexander, D. C. (2012). NODDI: practical in vivo neurite orientation dispersion and density imaging of the human brain. Neuroimage 61, 1000–1016. doi: 10.1016/j.neuroimage.2012.03.072
Zhang, L., Wang, F., Wang, L., Wang, W., Liu, B., Liu, J., et al. (2012). Prevalence of chronic kidney disease in China: a cross-sectional survey. Lancet 379, 815–822.
Keywords: tract-based spatial statistics, chronic kidney disease, end-stage renal disease, uric acid, phosphate
Citation: Jiang Y, Gao Q, Liu Y, Gao B, Che Y, Lin L, Jiang J, Chang P, Song Q, Wang W, Wang N and Miao Y (2021) Reduced White Matter Integrity in Patients With End-Stage and Non-end-Stage Chronic Kidney Disease: A Tract-Based Spatial Statistics Study. Front. Hum. Neurosci. 15:774236. doi: 10.3389/fnhum.2021.774236
Received: 16 September 2021; Accepted: 12 November 2021;
Published: 10 December 2021.
Edited by:
Ahmad Raza Khan, Center of Bio-Medical Research (CBMR), IndiaReviewed by:
Kourosh Sheibani, Basir Eye Health Research Center, IranMukesh Kumar, All India Institute of Medical Sciences, India
Copyright © 2021 Jiang, Gao, Liu, Gao, Che, Lin, Jiang, Chang, Song, Wang, Wang and Miao. This is an open-access article distributed under the terms of the Creative Commons Attribution License (CC BY). The use, distribution or reproduction in other forums is permitted, provided the original author(s) and the copyright owner(s) are credited and that the original publication in this journal is cited, in accordance with accepted academic practice. No use, distribution or reproduction is permitted which does not comply with these terms.
*Correspondence: Nan Wang, cHlyYW43OEAxNjMuY29t; Yanwei Miao, eXdtaWFvNzE2QDE2My5jb20=
†These authors have contributed equally to this work