 Lucas R. Trambaiolli1*
 Raymundo Cassani2
 Claudinei E. Biazoli Jr.3,4
 André M. Cravo3
 João R. Sato3,5
 Tiago H. Falk6
- 1Basic Neuroscience Division, McLean Hospital–Harvard Medical School, Belmont, MA, United States
- 2McConnell Brain Imaging Centre, Montreal Neurological Institute, McGill University, Montreal, QC, Canada
- 3Center for Mathematics, Computing and Cognition, Federal University of ABC, São Bernardo do Campo, Brazil
- 4School of Biological and Behavioural Sciences, Queen Mary University of London, London, United Kingdom
- 5Big Data, Hospital Israelita Albert Einstein, São Paulo, Brazil
- 6Institut National de la Recherche Scientifique, University of Quebec, Montreal, QC, Canada
Neurofeedback has been suggested as a potential complementary therapy to different psychiatric disorders. Of interest for this approach is the prediction of individual performance and outcomes. In this study, we applied functional connectivity-based modeling using electroencephalography (EEG) and functional near-infrared spectroscopy (fNIRS) modalities to (i) investigate whether resting-state connectivity predicts performance during an affective neurofeedback task and (ii) evaluate the extent to which predictive connectivity profiles are correlated across EEG and fNIRS techniques. The fNIRS oxyhemoglobin and deoxyhemoglobin concentrations and the EEG beta and gamma bands modulated by the alpha frequency band (beta-m-alpha and gamma-m-alpha, respectively) recorded over the frontal cortex of healthy subjects were used to estimate functional connectivity from each neuroimaging modality. For each connectivity matrix, relevant edges were selected in a leave-one-subject-out procedure, summed into “connectivity summary scores” (CSS), and submitted as inputs to a support vector regressor (SVR). Then, the performance of the left-out-subject was predicted using the trained SVR model. Linear relationships between the CSS across both modalities were evaluated using Pearson’s correlation. The predictive model showed a mean absolute error smaller than 20%, and the fNIRS oxyhemoglobin CSS was significantly correlated with the EEG gamma-m-alpha CSS (r = −0.456, p = 0.030). These results support that pre-task electrophysiological and hemodynamic resting-state connectivity are potential predictors of neurofeedback performance and are meaningfully coupled. This investigation motivates the use of joint EEG-fNIRS connectivity as outcome predictors, as well as a tool for functional connectivity coupling investigation.
Introduction
During a neurofeedback session, participants are trained to achieve volitional control of their neural activity through real-time feedback (Sitaram et al., 2017). Potential applications of this approach in psychiatry include the treatment of mood and anxiety disorders, such as depression (Trambaiolli et al., 2021a) and obsessive-compulsive disorder (OCD) (Ferreira et al., 2019). Clinical benefits have been reported to persist for weeks or months after training (Rance et al., 2018). However, not all users will benefit from neurofeedback training, and it is a current interest in this research field to identify potential predictors of performance and outcomes (Weber et al., 2020; Haugg et al., 2021). Recently, targeted functional connectivity has been explored as a potential predictor of neurofeedback training performance. This has been motivated by findings showing that individual differences in resting-state functional connectivity can identify individuals from a large group (Finn et al., 2015), and influence task performances in different cognitive domains (Shen et al., 2017). For example, Scheinost et al. (2014) showed that fMRI-based whole-brain functional connectivity could be used as a predictor of affective neurofeedback treatment success in patients with OCD (Scheinost et al., 2014).
However, for a clearer picture of the neurobiological mechanisms underlying the relations between resting-state networks and task outcomes, a better understanding of the neural activity related to spontaneous hemodynamic fluctuations is required (Ma et al., 2016). In this context, several studies have explored the combination of electrophysiological and hemodynamic methodologies (Ingvar et al., 1979; Okyere et al., 1986; Goldman et al., 2002; Mantini et al., 2007; Scheeringa et al., 2008; Britz et al., 2010; Schölvinck et al., 2010; Yuan et al., 2012; Talukdar et al., 2015). A previous study combining functional magnetic resonance imaging (fMRI) blood oxygen level-dependent (BOLD) signals with local field potential records in monkeys observed correlated spontaneous fluctuations over the cortex, particularly for gamma-band power (Schölvinck et al., 2010). In humans, the neurovascular coupling has been broadly studied by combining the fMRI-BOLD signal with electroencephalography (EEG) recordings (Goldman et al., 2002; Mantini et al., 2007; Scheeringa et al., 2008; Britz et al., 2010; Yuan et al., 2012). An inverse correlation between the BOLD signal amplitude and the EEG alpha frequency power has been consistently observed (Goldman et al., 2002). Moreover, a linear correlation between the EEG spectro-temporal amplitude modulation (EEG-AM) and the blood flow through the gray matter has also been observed (Ingvar et al., 1979; Okyere et al., 1986; Talukdar et al., 2015; Trambaiolli et al., 2020).
Nevertheless, simultaneous EEG-fMRI recording is challenging. The EEG signal is corrupted by magnetic gradient artifacts due to interference caused by the MRI, and artifacts on functional images can be caused by the electrodes positioning (Talukdar et al., 2015). Recently, functional near-infrared spectroscopy (fNIRS) has emerged as a useful tool combined with EEG since there is no electro-optical interference (Talukdar et al., 2015; Chiarelli et al., 2017). Moreover, fNIRS data provides information about oxyhemoglobin and deoxyhemoglobin concentration changes at the cortical surface with relatively high sampling rates (Strangman et al., 2002; Cui et al., 2011), allowing for the temporal evaluation of neurovascular coupling. Joint EEG-fNIRS measurement was recently applied to several neuroscientific questions, such as to investigate the neurodevelopment (Roche-Labarbe et al., 2007), language processing (Wallois et al., 2012), or to develop brain-computer interfaces (BCI) (Fazli et al., 2012; Tomita et al., 2014; Banville et al., 2017).
In this study, we combined EEG and fNIRS data with a task-related connectivity modeling (Finn et al., 2015; Shen et al., 2017) to predict participants’ performance in an fNIRS-based affective neurofeedback task (Trambaiolli et al., 2018). The interest in this particular task is due to the potential of fNIRS-based protocols to be used as an intervention outside the overcontrolled environment of laboratories (Trambaiolli et al., 2021b). We achieved a satisfactory performance prediction using these modalities as inputs for a support vector regressor. We also identified that connectivity profiles derived from the EEG-AM and fNIRS hemoglobin concentrations are significantly correlated. These results suggest that complementary neurovascular signatures converge to the same task-preparation network to perform best in the upcoming neurofeedback task.
Materials and methods
Participants
Thirty-one healthy participants (16 women), aged between 20 and 35 years (mean age of 25.71 ± 3.32 years) and all undergraduate or graduate students were recruited. The subjects had no diagnosis of neurological diseases (ICD-10: G00G99) or psychiatric disorders (ICD-10: F00-F99) and had a normal or corrected-to-normal vision. Ethical approval was obtained from the Ethics Committee of the Federal University of ABC, and all participants provided written consent before participation.
Data acquisition
fNIRS recording was performed using the NIRScout System (NIRx Medical Technologies, LLC. Los Angeles, California) with an array of 11 light sources and 11 detectors. These optodes were arranged in an elastic cap, with 9 pairs of source-detectors positioned over the fronto-temporal regions and 3 pairs of source-detectors over the occipital region as depicted in Figures 1A,B,D. We adopted four positions from the international 10–20 EEG system as reference points during the setup: detectors 1 and 9 were positioned approximately over the T7 and T8 positions, respectively, while the Fpz and Oz were in the center of channels 5-5 and 11-11, respectively. Source-receptor distance was 30 mm for contiguous optodes, and the used wavelengths were 760 and 850 nm. This setup resulted in a total of 32 source-detector channels. Signals obtained from these 32 channels were measured with a sampling rate of 5.2083 Hz using the NIRStar 14.0 software (NIRx Medical Technologies, LLC. Los Angeles, California).
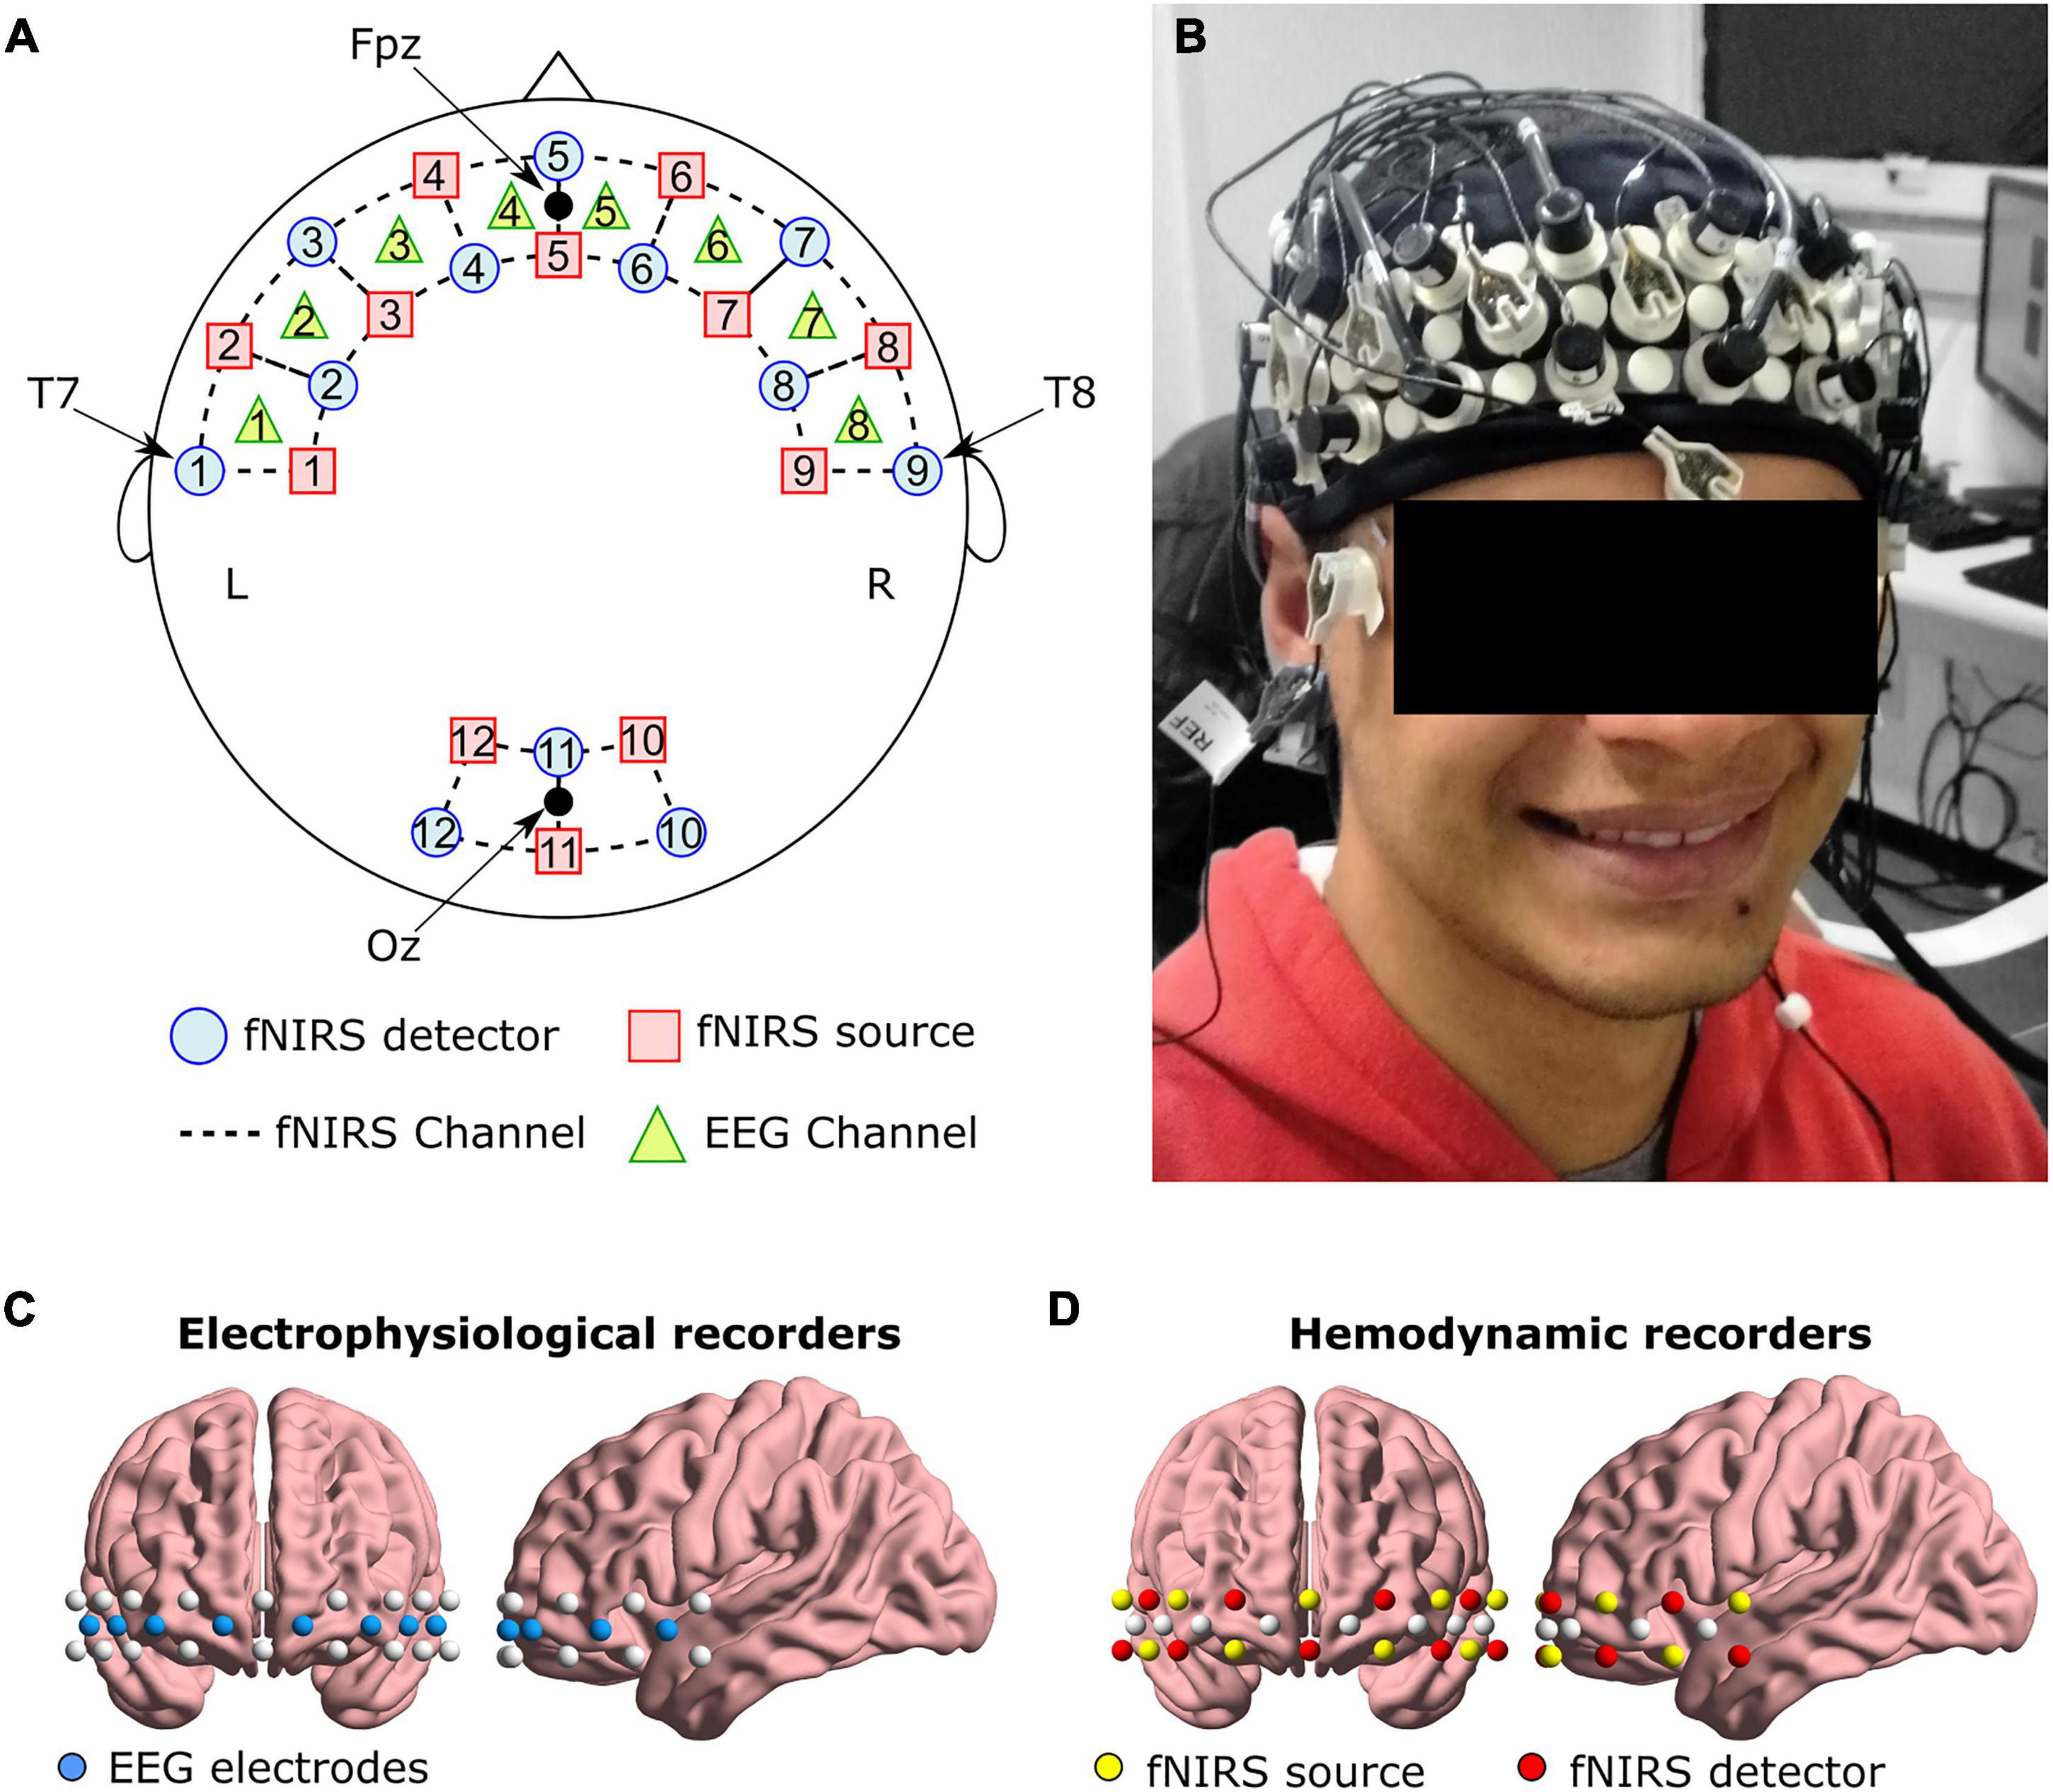
Figure 1. (A) Schematic representation of EEG and fNIRS channels, and (B) an example of the cap on one volunteer. Anatomical representation of the positioning of (C) EEG electrodes, and (D) fNIRS optodes.
Eight active EEG channels (see Figures 1A–C) were recorded using a 72-channel QuickAmp amplifier system (Brain Products GmbH, Germany). To ensure that any lateralization effect was not caused by the reference placement, for half of the subjects the reference electrode was positioned over the left earlobe and the ground electrode over the right earlobe. For the second half, these positions were inverted (reference on the right earlobe and ground on the left earlobe). The BrainVision Recorder software (Brain Products GmbH, Germany) was used to acquire the data with a sampling frequency of 500 Hz and without applying filters during acquisition.
Electrode and optode locations followed the same placement as in the original neurofeedback experiment (Trambaiolli et al., 2018). The frontal cortex includes important regions for emotion processing (e.g., the orbitofrontal cortex and the lateral and medial prefrontal cortex) (Lindquist et al., 2012, 2015) and is relevant during the affective neurofeedback task.
Neurofeedback task
All volunteers participated in an affective neurofeedback task (Trambaiolli et al., 2018) that consisted of 5 min of continuous eyes-opened resting-state, followed by two pairs of training-test blocks with 10 and 11 trials, respectively. During the training and test blocks, subjects were instructed to remember autobiographical memories with a positive affect context or to remain relaxed (rest with eyes opened), depending on the stimuli presented on the screen. For each trial, a 3-s moving window extracted average values of oxyhemoglobin and deoxyhemoglobin concentrations to compose the respective feature set. Data from each training block was used to train a linear discriminant analysis (LDA) model, which was used to provide feedback to the participant during each test block. The “performance” measure used in the next steps corresponds to the number of trials during the test blocks where the user achieved minimum control of the system. The interested reader is referred to Trambaiolli et al. (2018), where a detailed description of the protocol and the original report of the results from the neurofeedback task are provided.
Electroencephalography pre-processing
Filtering and artifact correction
First, the pre-task resting block was segmented from the raw data and then band-pass filtered between 0.1 and 100 Hz by a second-order Butterworth filter. Then, we applied the wavelet-enhanced independent component analysis (wICA) for artifact correction (Castellanos and Makarov, 2006; Akhtar et al., 2012). With this method, EEG signals were decomposed into independent components (ICs), and the discrete wavelet transform (DWT) was applied to each IC. In sequence, wavelet thresholds were selected to differentiate between neural and artifactual coefficients. The inverse wavelet transform was applied to these thresholds, retrieving only data related to neural activity in each IC. Importantly, the wICA method allows for recovering neural data leaked on noisy ICs by filtering out artifacts from the wavelet-decomposed signals in each IC (Castellanos and Makarov, 2006). Thus, no IC exclusion was necessary. Lastly, the artifact-free EEG data were reconstructed using the wavelet-corrected ICs (Castellanos and Makarov, 2006; Akhtar et al., 2012). All these steps were performed using the EEGLAB (Delorme and Makeig, 2004) and wICA toolboxes (Castellanos and Makarov, 2006), with the cleaning artifact tolerance set to 1.4 and the IC artifact detection threshold to 1.6. Both values were empirically determined.
Amplitude modulation computation
Amplitude modulations were computed following the procedure described in Trambaiolli et al. (2011, 2020) and Falk et al. (2012). Briefly, the full band temporal series from all signals were decomposed into five classical spectral bands, namely: delta (0.1–4.0 Hz), theta (4.0–8.0 Hz), alpha (8.0–12.0 Hz), beta (12.0–30.0 Hz), and gamma (30.0–50.0 Hz), using finite impulse response (FIR) bandpass filters. The temporal envelope was extracted from each frequency band using a Hilbert transform. Then, each envelope was further decomposed into five modulation bands called: m-delta (0.1–4.0 Hz), m-theta (4.0–8.0 Hz), m-alpha (8.0–12.0 Hz), m-beta (12.0–30.0 Hz), and m-gamma (30.0–50.0 Hz), using FIR bandpass filters. However, due to Bedrosian’s theorem (Bedrosian, 1963), the envelope signal can only contain modulation frequencies up to the maximum frequency of its originating signal. Hence, if we use the notation “frequency band—m—modulation band,” only the following amplitude modulations are relevant: delta-m-delta, theta-m-delta, theta-m-theta, alpha-m-delta, alpha-m-theta, beta-m-delta, beta-m-theta, beta-m-alpha, beta-m-beta, gamma-m-delta, gamma-m-theta, gamma-m-alpha, gamma-m-beta, and gamma-m-gamma.
As previous studies have reported that alpha modulations are related to the regional blood flow (Ingvar et al., 1979; Okyere et al., 1986; Jann et al., 2010; Trambaiolli et al., 2020), the present study focused exclusively on the alpha band modulations. In other words, we used for further analysis the beta-m-alpha and gamma-m-alpha modulations.
Electroencephalography connectivity matrices
For each of the previously mentioned alpha modulation bands, the connectivity between two channels was measured using Pearson’s correlation over the whole pre-task resting block (Bastos and Schoffelen, 2016). All possible combinations of channels were used to generate a connectivity matrix of 8 × 8 dimensions (a total of two EEG-based connectivity matrices per participant: one for beta-m-alpha and one for gamma-m-alpha).
Functional near-infrared spectroscopy pre-processing
Filtering and hemoglobin concentrations computation
The fNIRS data were pre-processed using the NIRStar toolbox (v. 14.0, NIRx Medical Technologies, LLC. Los Angeles, California). First, fNIRS raw data were bandpass filtered between 0.01 and 0.2 Hz by a linear-phase FIR filter. Then, the filtered temporal series were detrended by their respective whole-length record (without segmentation). Next, the oxy and deoxyhemoglobin concentrations were computed using the modified Beer-Lambert law, with the differential pathlength factor (DPF) set to 7.25 and 6.38, respectively, for both fronto-temporal and occipital regions (Essenpreis et al., 1993). Finally, the pre-task resting-state block was segmented for the functional connectivity analysis.
Functional near-infrared spectroscopy connectivity matrices
For each hemoglobin concentration preprocessed time series, the functional connectivity between two channels was measured using Pearson’s correlation over the whole pre-task resting block (Bastos and Schoffelen, 2016). Considering the disposition of all fNIRS and EEG channels in our experiment, only the 25 fNIRS channels around the EEG electrodes (Figure 1) were used to compute the connectivity. Hence, each hemoglobin concentration resulted in a connectivity matrix of 25 × 25 dimensions (a total of two fNIRS-based connectivity matrices per participant: one for oxyhemoglobin and one for deoxyhemoglobin).
Connectivity predictive modeling
Connectivity profiles
Up until now, all analyses were performed using data from each subject at a time. Now, the next steps focus on the inter-subject approach and follow the connectome-based predictive modeling method proposed by Shen et al. (2017) (see Figure 2). These steps were repeated for each connectivity matrix.
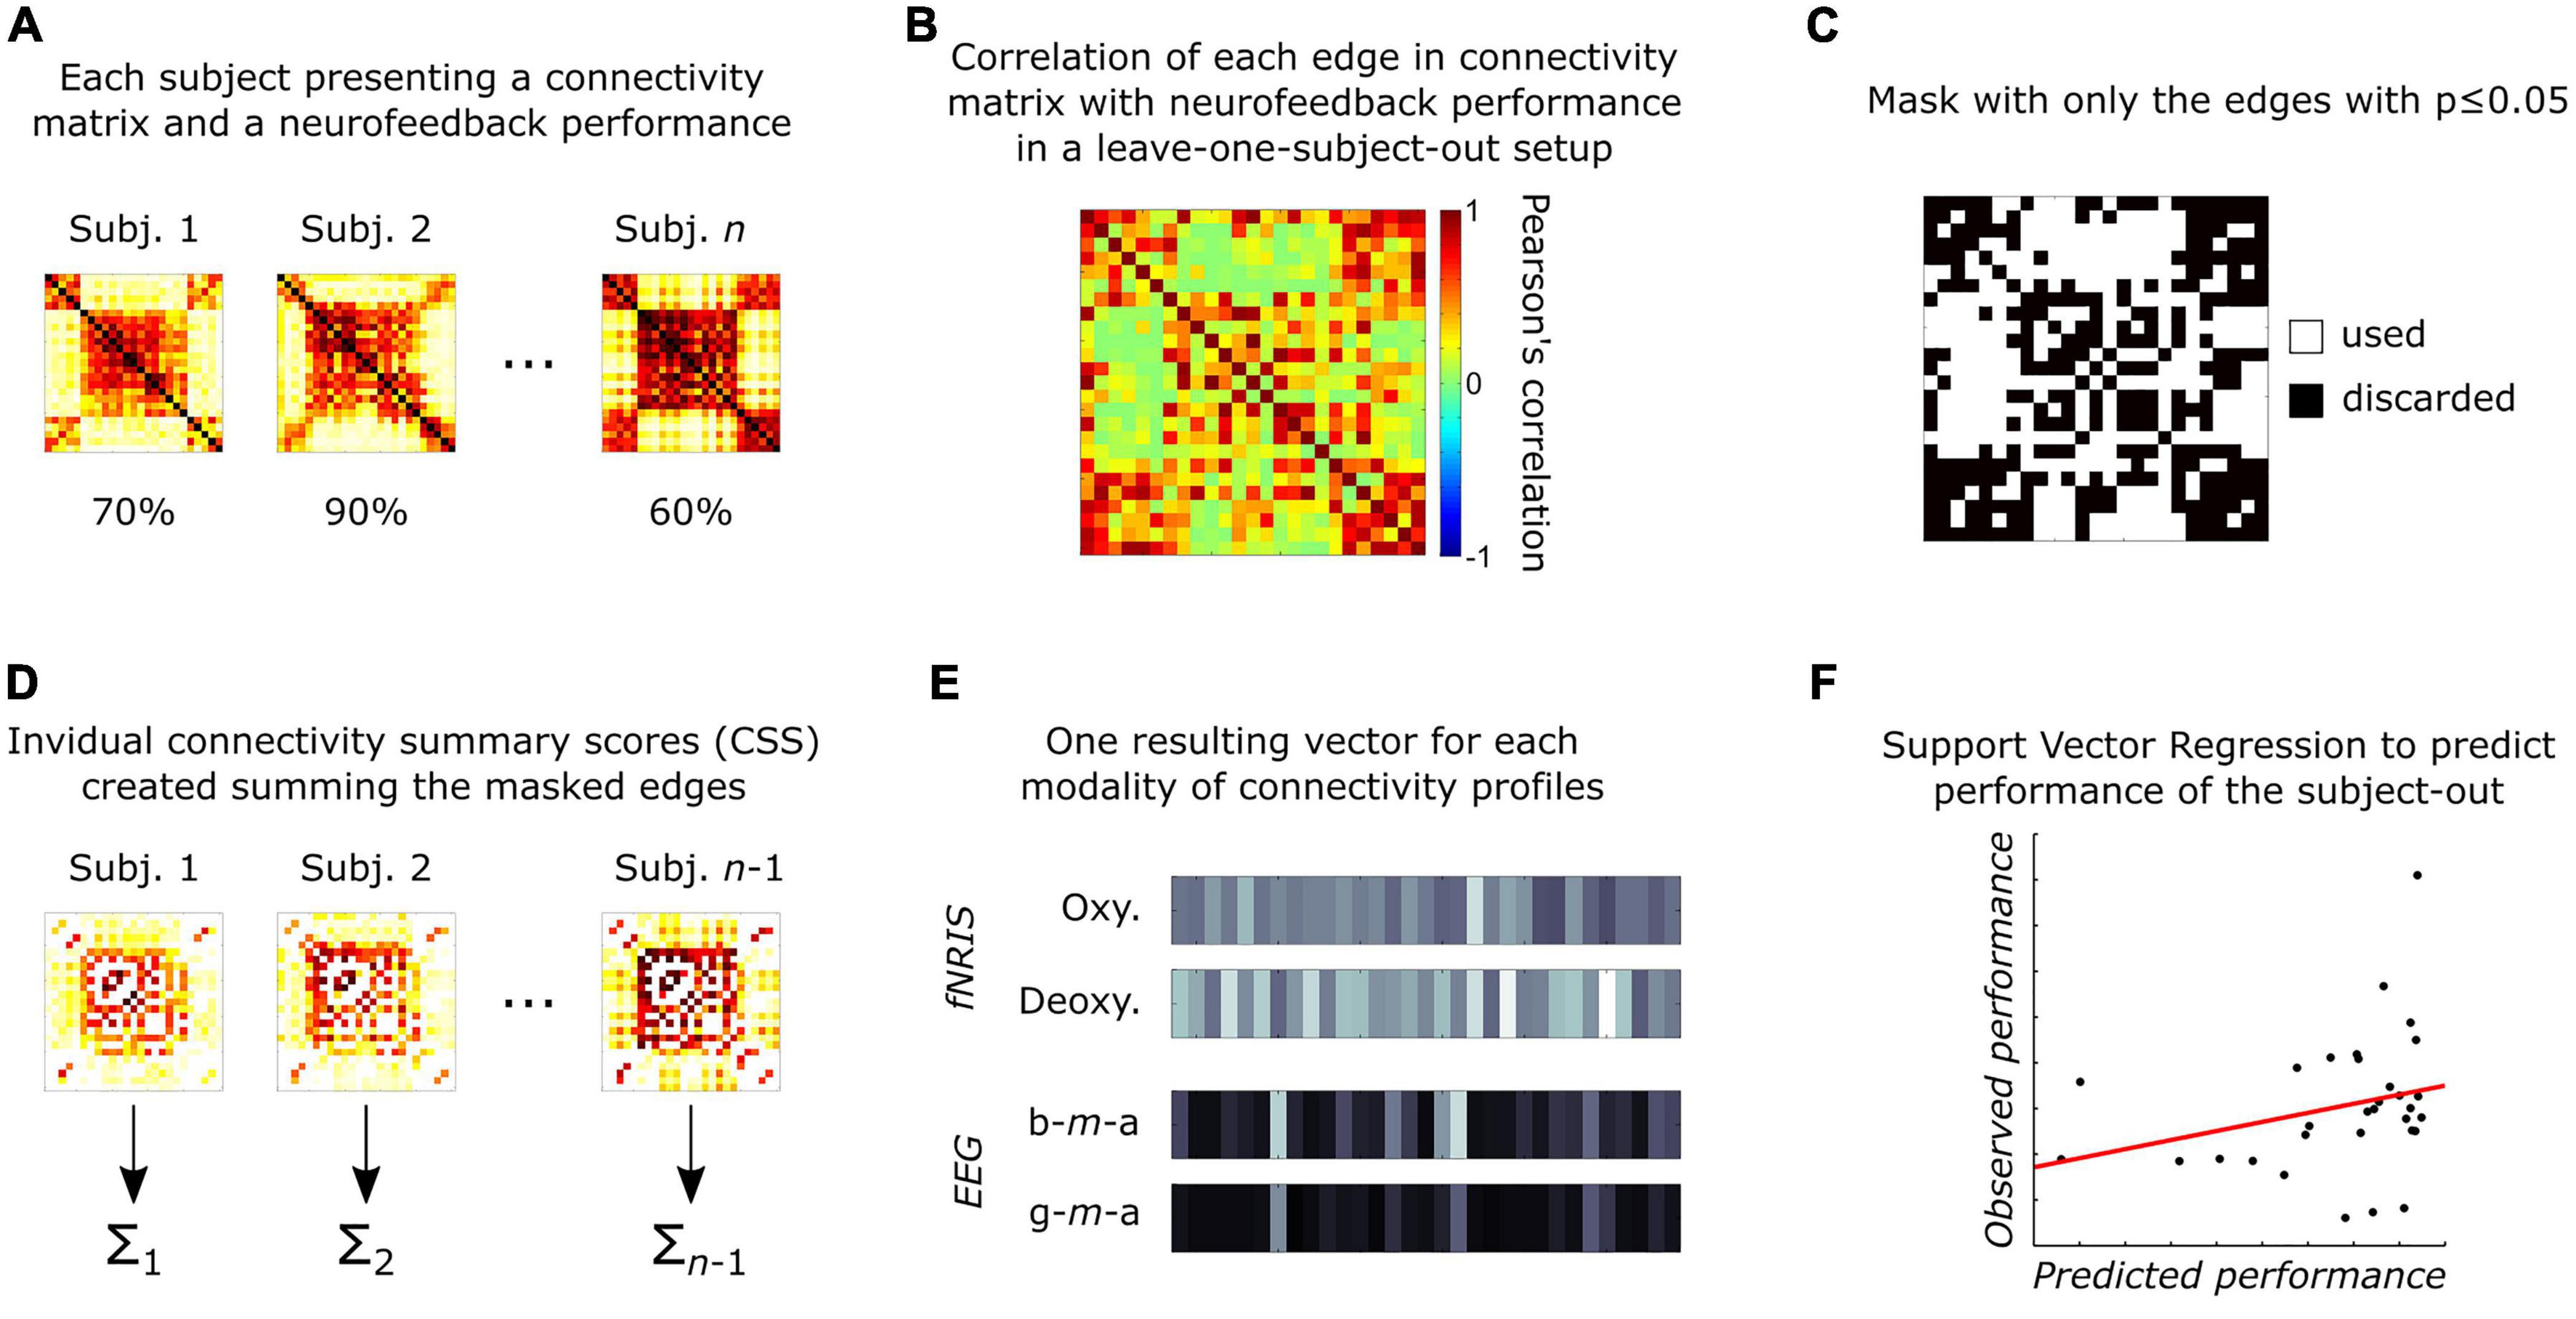
Figure 2. Schematic representation of the connectivity-based predictive modeling (adapted from Shen et al., 2017), summarized as: (A) Each participant has one connectivity matrix per neuroimaging feature and one performance measurement related to the affective neurofeedback task; (B) each edge in connectivity matrices is related to the subject’s performance using Pearson’s correlation in a leave-one-subject-out (LOSO) setup; (C) next, significant edges (p ≤ 0.05) are selected to create a mask; (D) then, for each subject in the training group, the mask is applied to select most important edges, which are then summarized (summed) into a single CSS value per subject; (E) next, an inter-subject vector is created for each neuroimaging modality, containing the respective summary values; (F) finally, these four vectors are used to train a support vector regressor (SVR) and test it in the subject-out.
In our analysis, we used a leave-one-subject-out (LOSO) setup, as it emulates how the prediction of performance would happen when evaluating new patients in real-world scenarios. For each LOSO iteration, each edge of the connectivity matrices (from all subjects but one, i.e., training group) was correlated with their performance during the neurofeedback task, resulting in a correlation matrix that was used to create a mask consisting of all edges presenting significant correlations (p ≤ 0.05). This mask was then applied to the original connectivity matrices of each subject from the training group. The remaining edges were summed, creating a single connectome value (here called “connectome summary score”—CSS) for each subject. This procedure was repeated for each modality (two from fNIRS—oxyhemoglobin and deoxyhemoglobin—and two from EEG—beta-m-alpha and gamma-m-alpha). As result, four CSS values were obtained per subject, and these were used as features to train a linear support vector regressor (SVR) to predict the performance during the neurofeedback task. The hyperparameter C was set to 1, and epsilon was estimated as a tenth of the standard-deviation of the performance values in the training set. Finally, the SVR was then tested in the left-out subject. These steps were repeated, each time leaving a different subject out until we tested all possible setups.
Correlation comparison
To evaluate intra- and inter-modality correlations, we calculated the two CSS vectors for each modality using edges selected in at least one LOSO iteration. Then, we computed Pearson’s correlation with these vectors. In intra-modality analyses, for fNIRS it was oxyhemoglobin vs. deoxyhemoglobin, and for EEG beta-m-alpha vs. gamma-m-alpha. For inter-modality analyses, we explored oxyhemoglobin vs. beta-m-alpha, oxyhemoglobin vs. gamma-m-alpha, deoxyhemoglobin vs. beta-m-alpha, and deoxyhemoglobin vs. gamma-m-alpha. Then, for each combination, we performed 106 permutations of CSS values across subjects to establish a confidence interval. Finally, the resulting p-values were corrected using the false discovery rate (FDR) method for six multiple comparisons.
Results
Connectivity-based prediction of performance
A detailed description of the neurofeedback performance is reported in Trambaiolli et al. (2018). In the current study, we only considered the performance in trials with real feedback from the original experiment. The included sample presents different levels of neurofeedback literacy, ranging from 0 to 100% of accuracy, with a median ± standard-deviation of 70.00 ± 24.18%, The performance prediction combining the CCS values from both modalities (four features) and the SVR showed a mean absolute error (MAE) of 19.68 ± 15.65%; a scatterplot of the observed vs. predicted performances is shown in Figure 3.
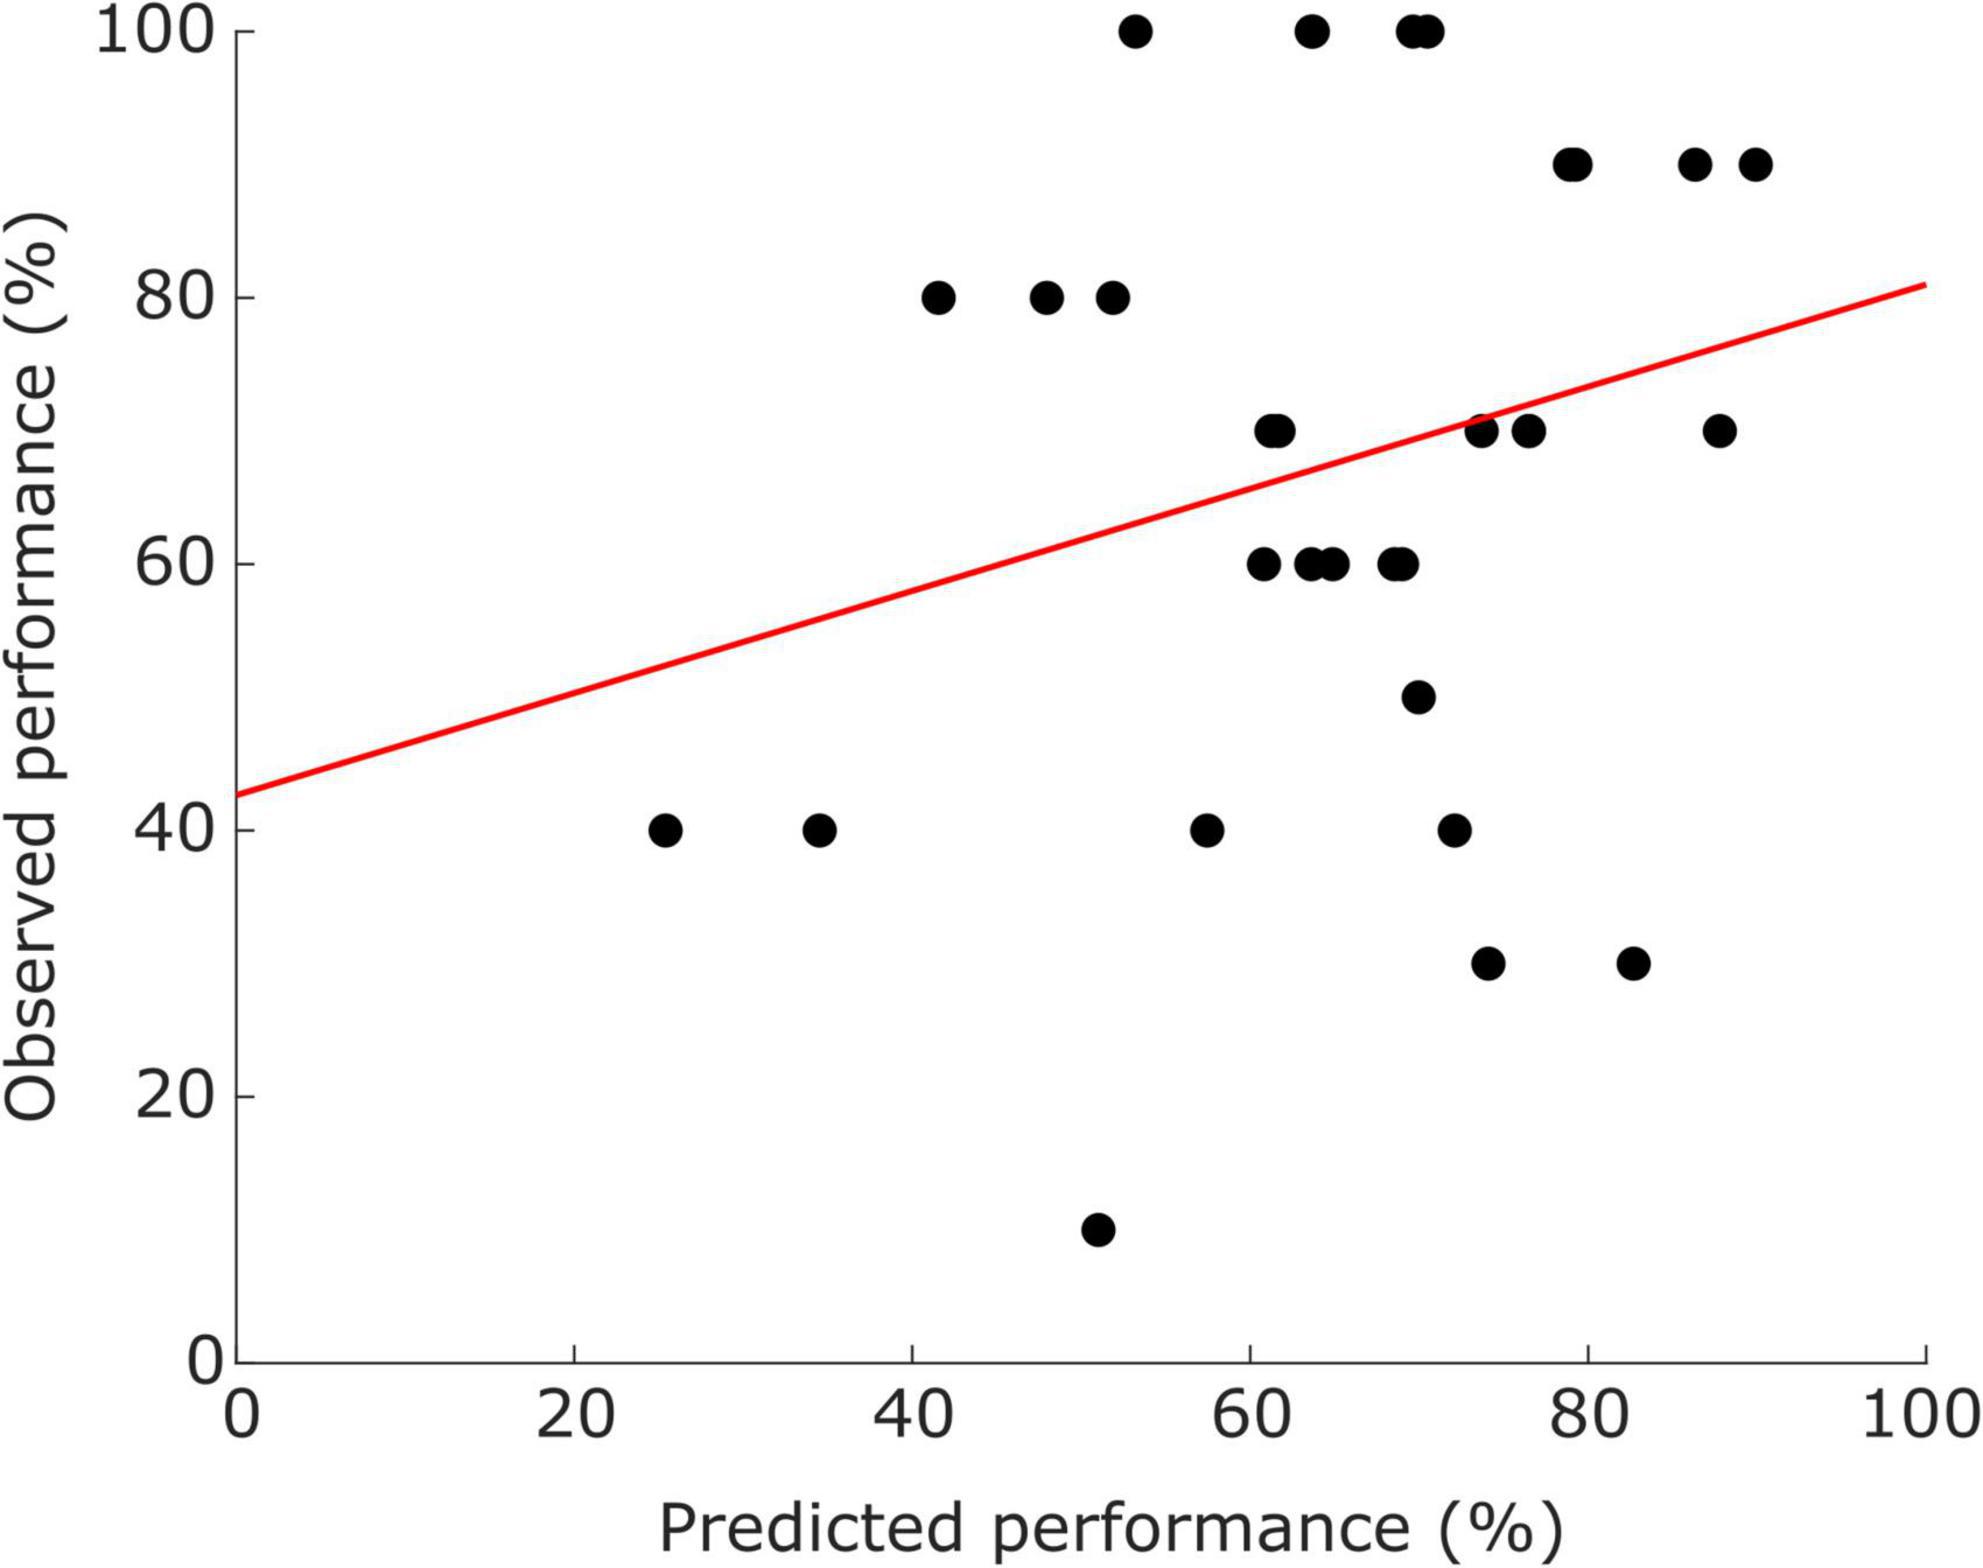
Figure 3. Scatter plots illustrating the distribution of participants (dots) according to predicted performance (x-axis) and observed performance (y-axis). Red line represents the trend.
Multimodal connectivity profiles
Figure 4 shows ring graphs with the edges selected at least once during the LOSO iterations of the connectivity-based predictive model, as well as matrices with averaged edge strengths. fNIRS oxyhemoglobin (Figure 4A) data showed a total of 82 unique edges selected, with a balanced number of edges in each hemisphere (20 in the left, 22 in the right, and 40 inter-hemispheric). The deoxyhemoglobin connectome (Figure 4B) had a total of 33 edges, with a higher concentration in the left hemisphere (Scheeringa et al., 2008) than in the right one (Trambaiolli et al., 2021a), and 18 inter-hemispheric connections. From the EEG data, both beta-m-alpha (Figure 4C) and gamma-m-alpha (Figure 4D) had two edges selected each. Beta-m-alpha edges were both inter-hemispheric, while the gamma-m-alpha connectome had one edge in the right hemisphere and one inter-hemispheric connection.
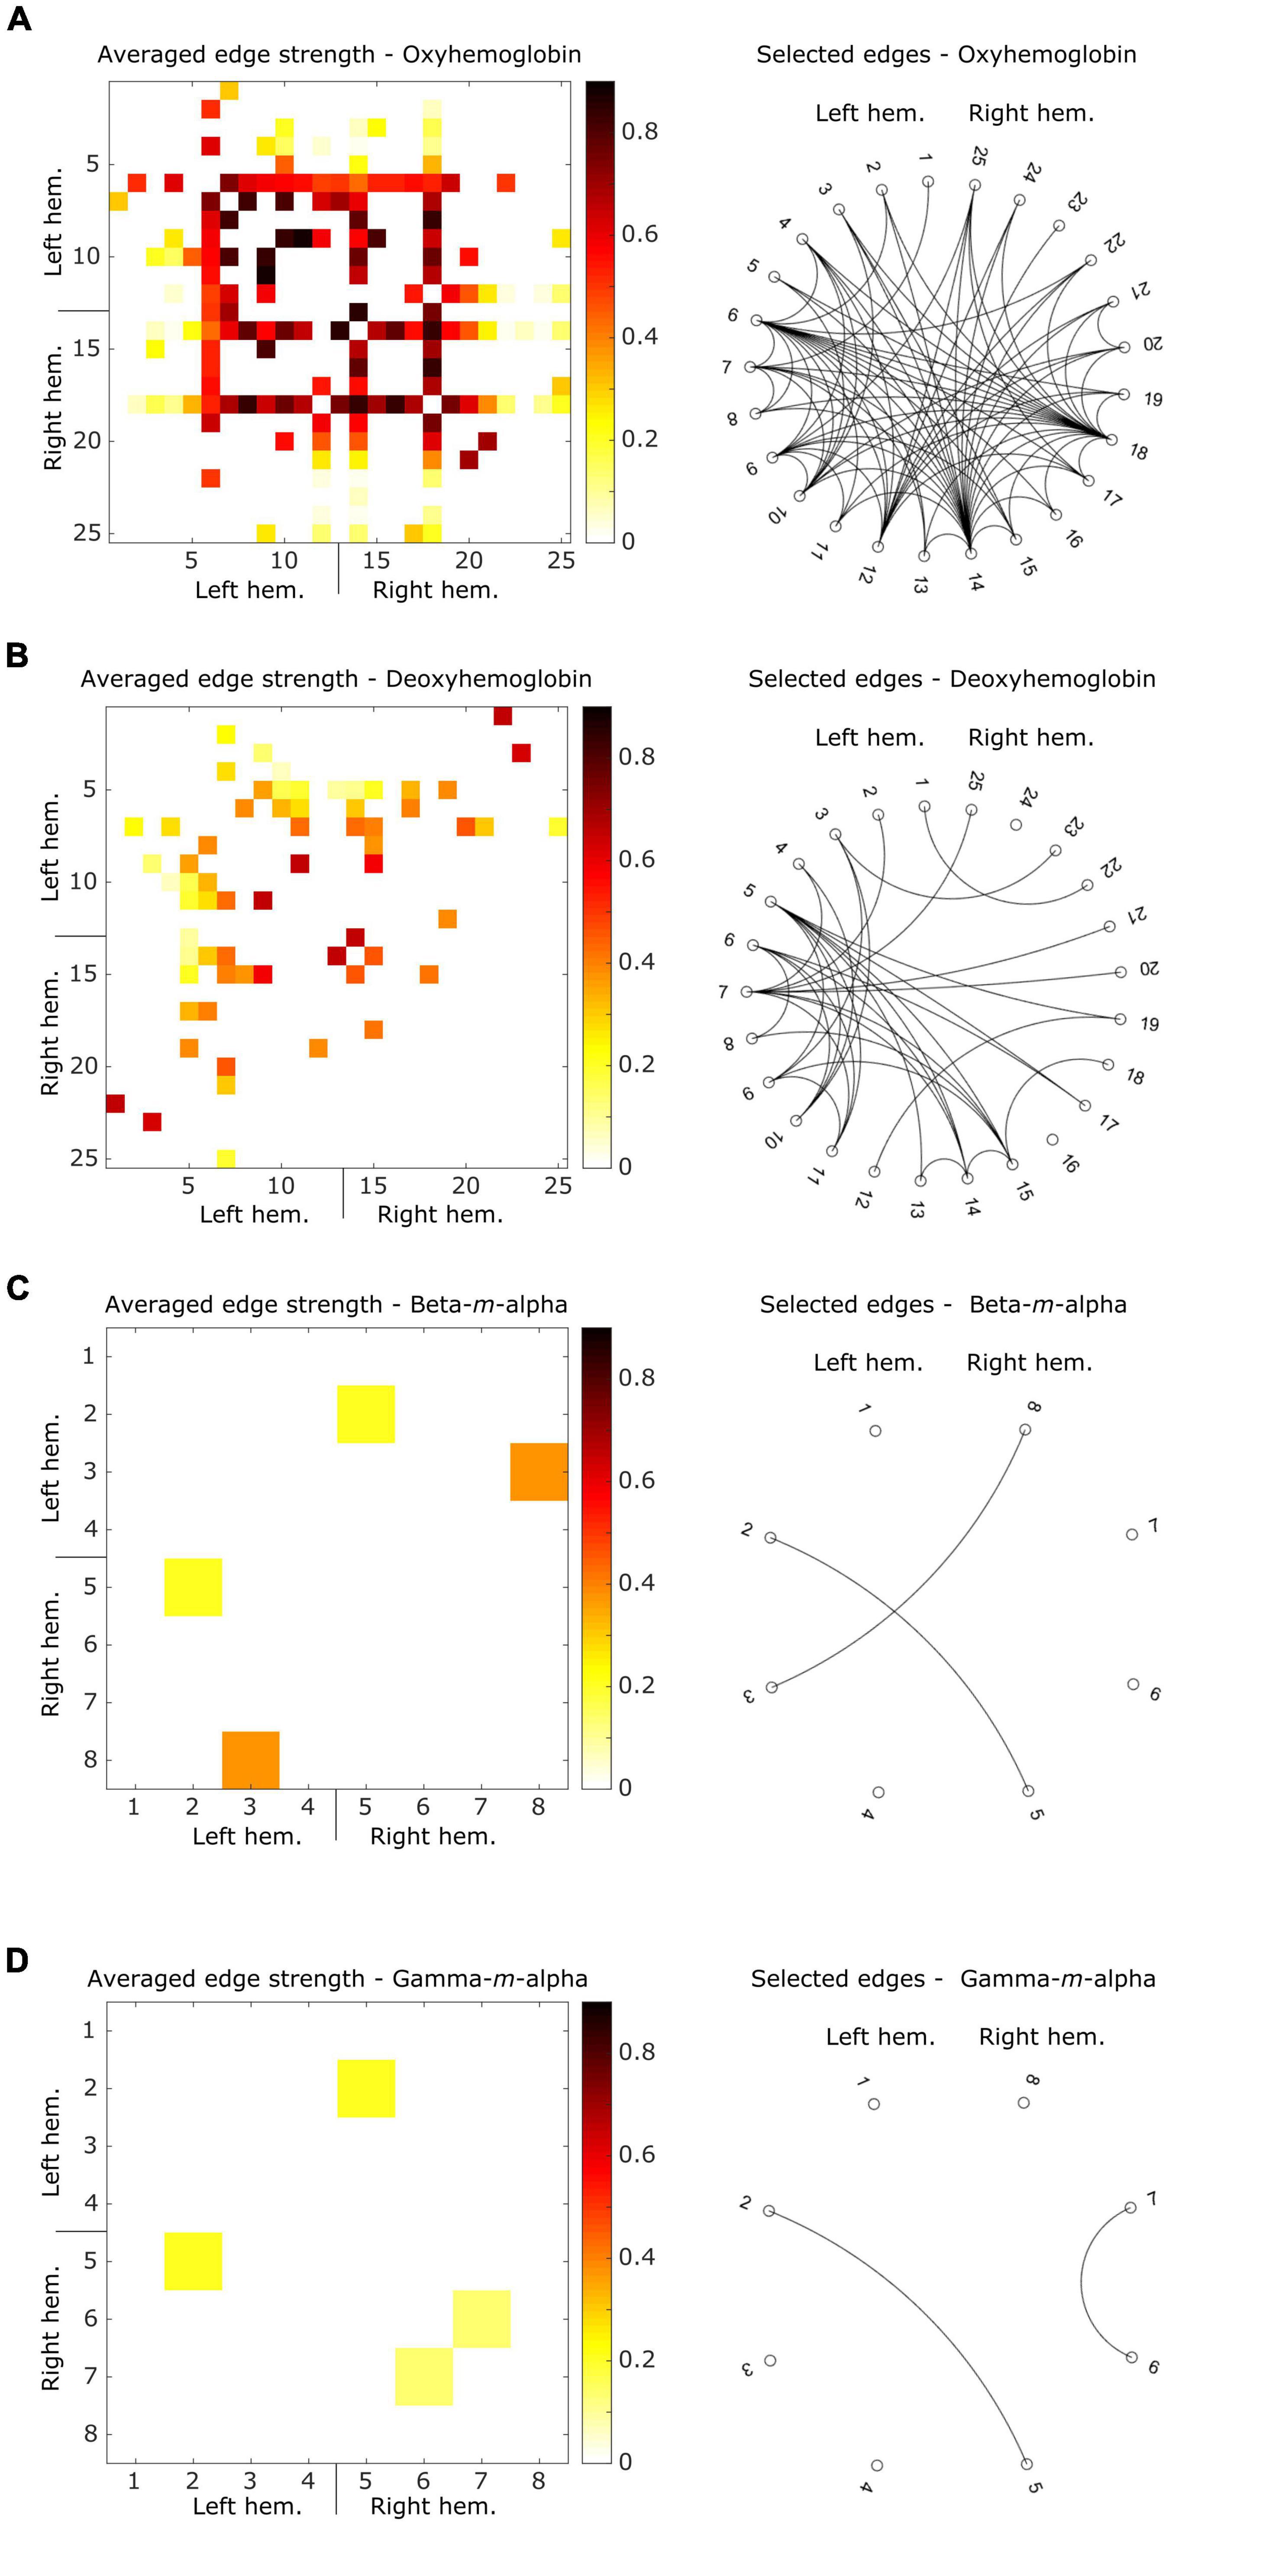
Figure 4. Averaged connectivity matrices showing the strength of the selected edges, and ring graphs describing the binary connections resulting from these edges for (A) oxyhemoglobin, (B) deoxyhemoglobin, (C) beta-m-alpha, (D) gamma-m-alpha. For connectivity matrices, hotter colors represent strong connectivity, while white squares represent connections removed by the correlation-based mask. For ring graphs, each black line represents a binary connection between two areas.
Figure 5 presents the distribution of participants according to different combinations of CSS values. Intra-modality CSS pairs showed a positive correlation for both fNIRS (Figure 5A) and EEG (Figure 5B) combinations, but only EEG-based CSS values showed a significant correlation (r = 0.767, p < 0.001). Inter-modality pairs showed a negative correlation in all combinations (Figures 5C–F), with a significant correlation between the fNIRS oxyhemoglobin and the EEG gamma-m-alpha features (r = −0.456, p = 0.030).
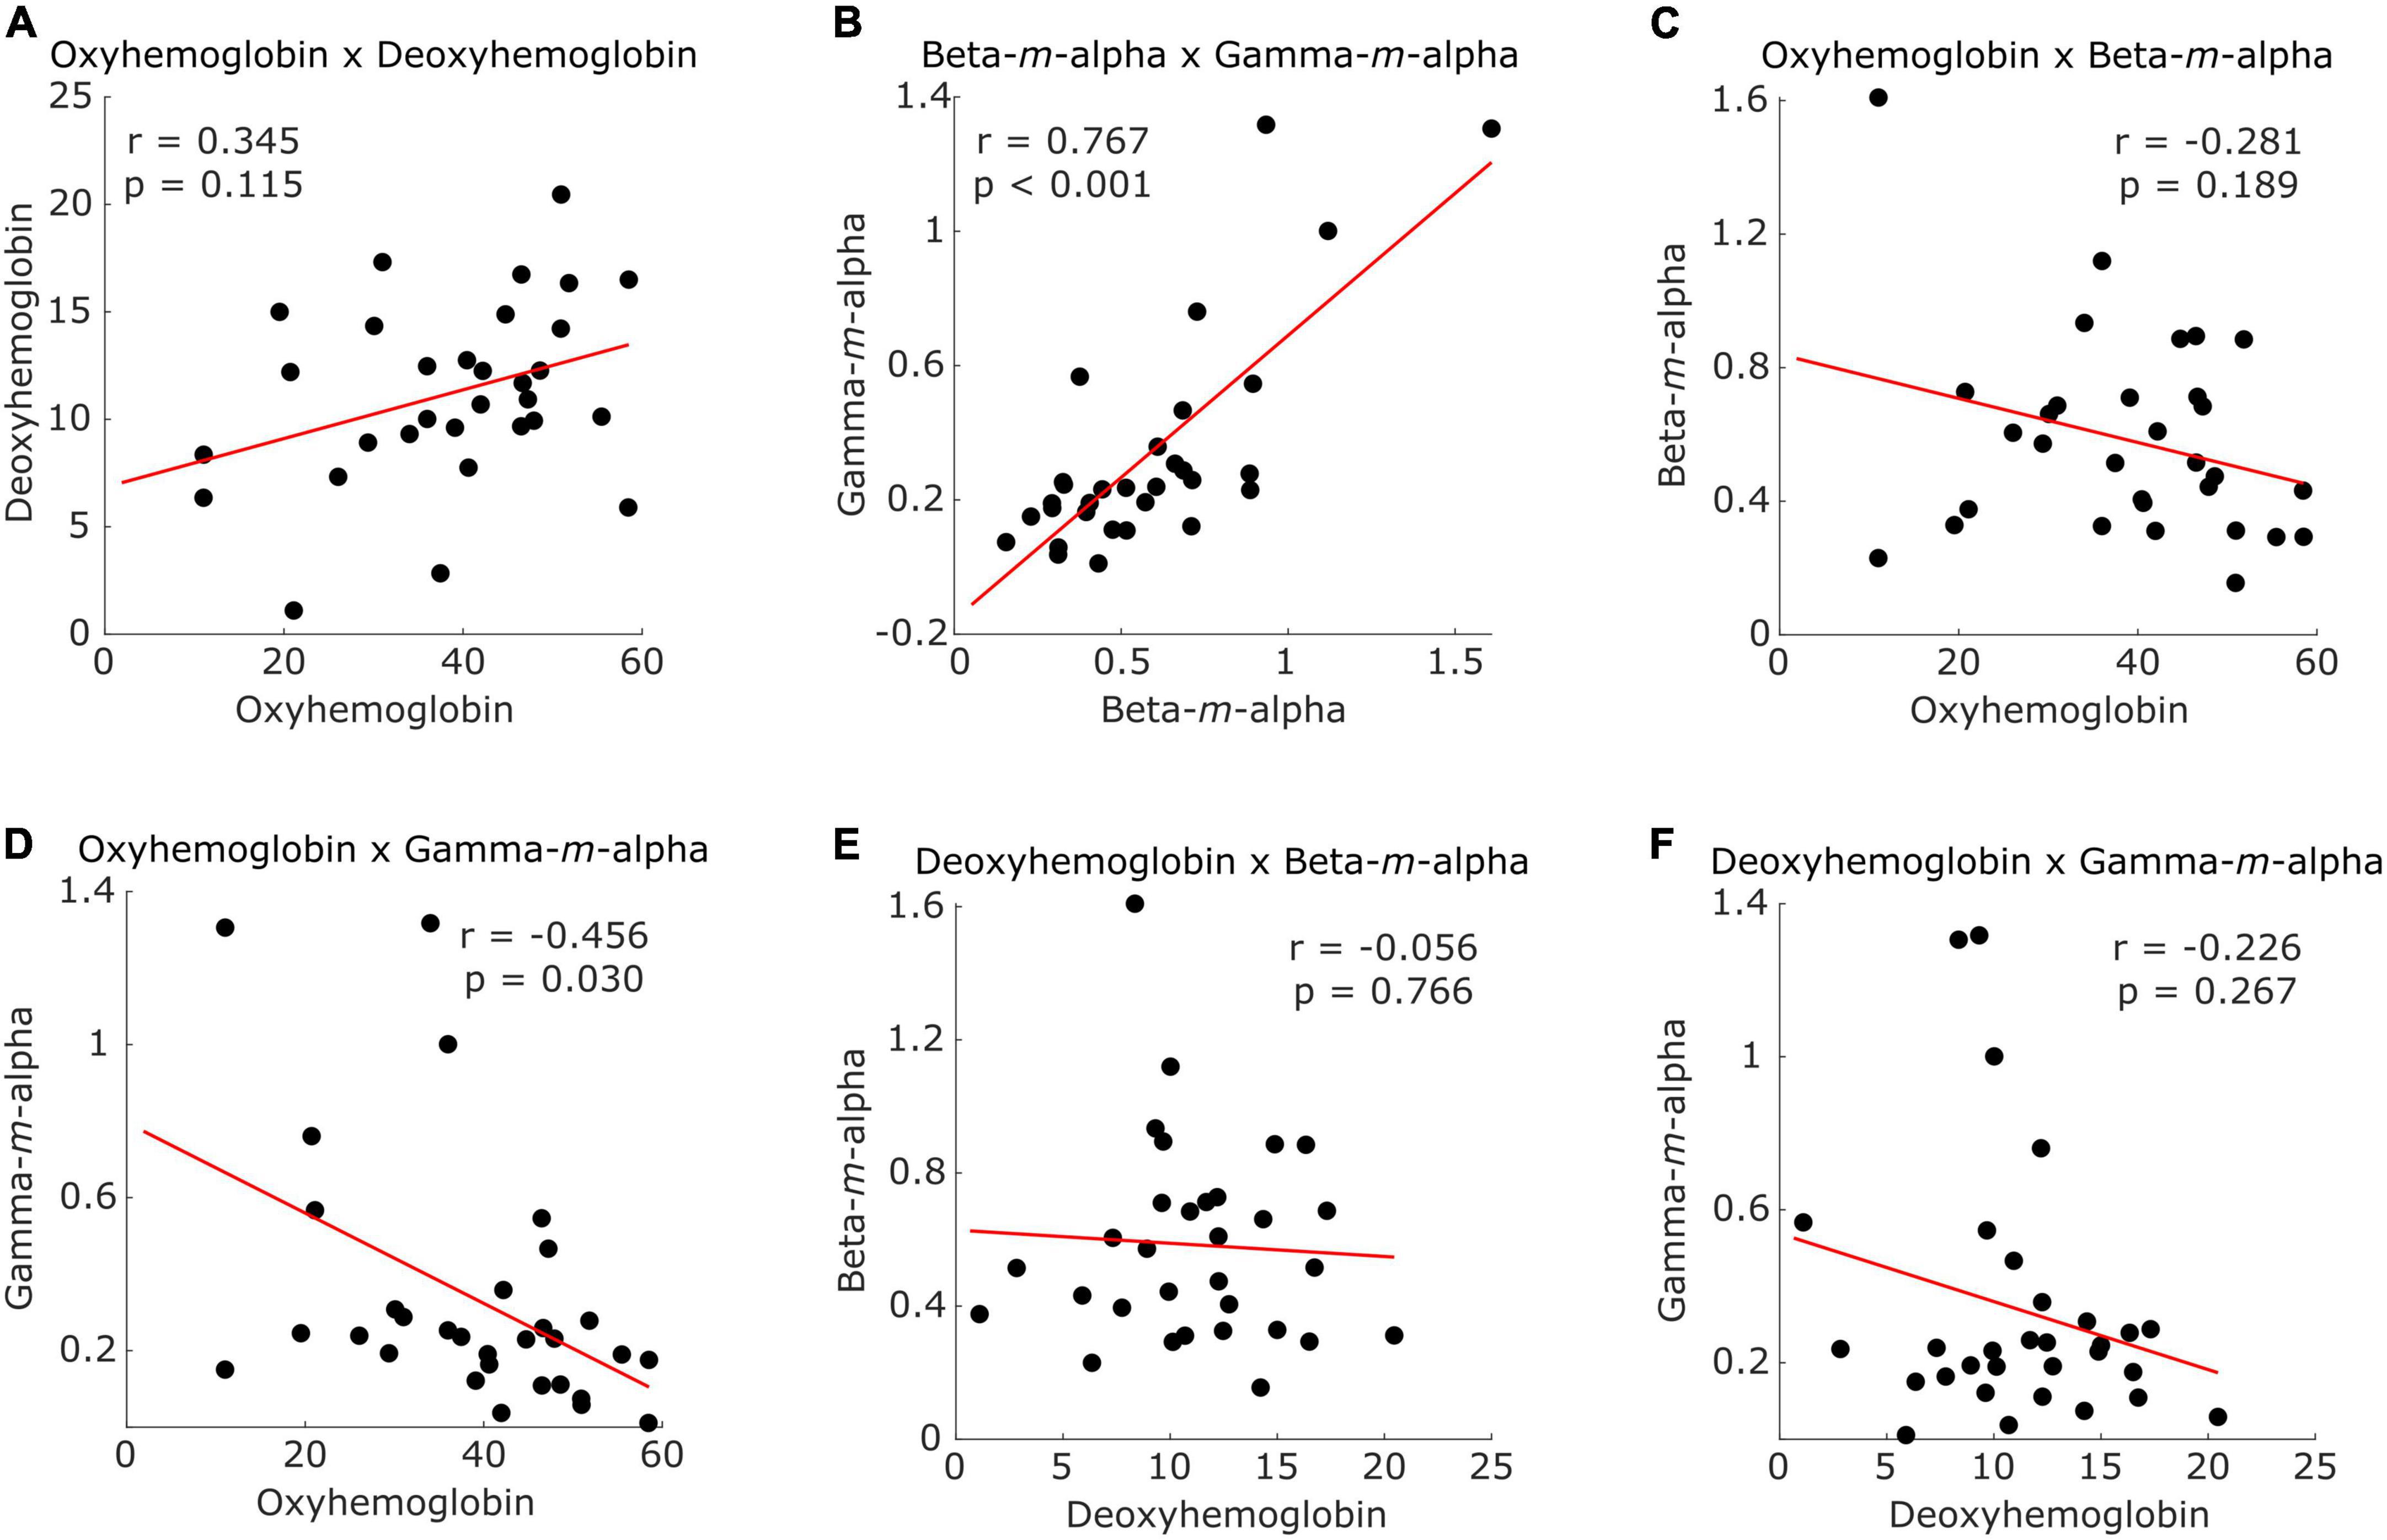
Figure 5. Scatter plots illustrating participants (dots) distribution according to (A) CSS from fNIRS oxyhemoglobin and deoxyhemoglobin, (B) CSS from EEG beta -m-alpha and gamma-m-alpha, (C) CSS from fNIRS oxyhemoglobin and EEG beta-m-alpha, (D) CSS from fNIRS oxyhemoglobin and EEG gamma-m-alpha, (E) CSS from fNIRS deoxyhemoglobin and EEG beta-m-alpha, and (F) CSS from fNIRS deoxyhemoglobin and EEG gamma-m-alpha. Red line represents the trend.
Discussion
In this study we evaluated if simultaneous EEG and fNIRS recordings during a pre-task resting condition would provide information about subsequent neurofeedback performance and present convergent connectivity profiles. This approach revealed good prediction accuracy and a significant correlation between the CSS values from EEG gamma-m-alpha modulation band and fNIRS oxyhemoglobin concentration. Moreover, both pre-task resting-state matrices presented similar clusters of intra and inter-hemispheric functional connections.
Our results are consistent with a recent trend of investigations for neurofeedback performance predictors (Alkoby et al., 2018; Weber et al., 2020). Previously, resting-state functional connectivity showed a good prediction of performance, or outcomes, in neurofeedback or brain-computer interface tasks when calculated using fMRI (Scheinost et al., 2014), EEG (Zhang et al., 2013, 2015; Lee et al., 2020), or fNIRS data (Trambaiolli et al., 2018) individually. Complementary to region-specific or psychophysiological predictors (Weber et al., 2020), connectivity-based predictors provide network-wide information about the neural mechanisms involved in the control of the proposed protocol. These could include information about resting-state networks involved in preparation for the neurofeedback training or those specific to the task (e.g., emotion processing networks for affective neurofeedback or motor control network for motor imagery neurofeedback). However, although the combination of hemodynamics and electrophysiological measures is becoming a common approach for the development of neurofeedback protocols (Perronnet et al., 2017), this is the first time that they are combined as a neurofeedback performance predictor. Thus, we present an innovative perspective for future experiments aiming to understand the neural basis of neurofeedback success.
Importantly, new EEG and fNIRS equipment are portable and allow quick setup when using dry and active electrodes (Lopez-Gordo et al., 2014) or modular multimodal sensors (von Lühmann et al., 2016). Thus, these imaging modalities are ideal for naturalistic neurofeedback implementations (Trambaiolli et al., 2021b). Moreover, the proposed pipeline is simple and has low computational cost. These characteristics make the proposed protocol a promising tool for real-world applications. For instance, affective neurofeedback shows encouraging results in treating depression (Trambaiolli et al., 2021a). This connectivity-based predictor could be used in the future to select personalized treatments, identifying patients who would potentially benefit from affective neurofeedback and those who would benefit from other treatment options.
Regarding intra-modality CSS correlations, it is notable that both pairs of modalities presented a positive correlation between features. The significant result between EEG-based features can be explained by the fact that both EEG-AM frequencies are modulated by the same modulation band. The EEG-AM analysis consists of the spectral characterization of the temporal changes of the instantaneous amplitude of the EEG signals. Thus, it provides information on the second-order periodicities (sometimes referred to as “hidden periodicities”), i.e., modulation frequencies, which are present in the EEG signals (Cassani and Falk, 2018). These frequency interactions have a fundamental importance in neural communication since this conjunction creates different neural signatures with the integration of activity across different temporal and spatial scales (Canolty and Knight, 2010; Hyafil et al., 2015). On the other hand, the non-significant result between fNIRS-based CSS might be related to the difference in the number of edges selected for each concentration. Also, oxyhemoglobin and deoxyhemoglobin concentrations present a high negative correlation (Cui et al., 2010), and the functional connectivity analysis resulting from these measures might present different distributions over the scalp (Sasai et al., 2011).
The oxyhemoglobin and deoxyhemoglobin time series are spatially and temporally correlated with the superficial fMRI-BOLD signal (Strangman et al., 2002; Huppert et al., 2006; Toronov et al., 2007; Cui et al., 2011; Sato et al., 2013). They show similar connectivity results to those measured by regional fMRI signals close to the fNIRS channels (Sasai et al., 2012). Thus, convergence between fNIRS and EEG-based connectivity profiles is expected for features related to neurovascular coupling phenomena (i.e., the local hemodynamic changes driven by regional neural activity) (Shibasaki, 2008). For example, EEG and BOLD-related functional connectivity are related to similar phenotypes (Nentwich et al., 2020), and share mutual information (Keinänen et al., 2018; Wirsich et al., 2020). Also, previous studies show that different characteristics of the EEG alpha band (i.e., spectral peak, power, latency, etc.) present a negative relationship with the BOLD signal (Goldman et al., 2002; Laufs et al., 2003; Gonçalves et al., 2006; Horovitz et al., 2008; Jann et al., 2009, 2010; Britz et al., 2010) and BOLD-based functional connectivity (Scheeringa et al., 2012; Chang et al., 2013). On the other hand, EEG gamma frequencies positively correlate with the BOLD signal (Lachaux et al., 2007; Scheeringa et al., 2011), while local field potential gamma frequencies are predictors of the BOLD fluctuation (Niessing et al., 2005; Nir et al., 2007; Viswanathan and Freeman, 2007; Goense and Logothetis, 2008). The opposite relationship between alpha and gamma with BOLD suggests different roles from both frequencies in the brain communication (Scheeringa and Fries, 2019). In fact, the alpha rhythm is described as an active inhibitor that modulates task-irrelevant brain regions (Jensen and Mazaheri, 2010; Zumer et al., 2014), while the gamma cycle reflects the alternation of excitability in groups of neurons to respond to new inputs (Ni et al., 2016). In the context of our pre-task resting-state connectome modeling, both rhythms may be constantly integrated into a transitional loop of inhibitory-excitatory processes while the participant gets ready to perform the neurofeedback task. For example, the gamma-alpha interaction was already described in human neuroimaging, mainly over sensory areas (Osipova et al., 2008; Voytek et al., 2010; Spaak et al., 2012; Bonnefond and Jensen, 2015). This interaction is suggested as a combination of the alpha function while filtering sensory incomes with the gamma role in the active processing information (Bonnefond and Jensen, 2015).
In both modalities, we see a predominance of inter-hemispheric connections selected as relevant edges. Although not linearly dependent nor perfectly spatiotemporally correspondent (Chiarelli et al., 2017), source estimation of EEG and fNIRS signals showed a significant level of corresponding sensitivity to gray matter activity between co-localized channels (Giacometti and Diamond, 2014), which may explain this multimodal consistency. Additionally, prior studies exploring comparable characteristics in fNIRS-EEG recordings reported that the variation of oxyhemoglobin and deoxyhemoglobin concentrations show intra- and inter-areal temporal coupling with the power peaks in EEG alpha frequencies at rest (Koch et al., 2008; Pfurtscheller et al., 2012; Keles et al., 2016), the component amplitude of visually evoked potentials (Obrig et al., 2002), and the whole-head alpha band connectivity during hypercapnia (Babiloni et al., 2014). Also, epidural fNIRS and electrophysiological recordings in anesthetized macaque monkeys reported a temporal correlation between the vascular and neural modulation peaks (Zaidi et al., 2015). These phenomena might be the foundation for the correlated trends between fNIRS and EEG CSS values and the similar predominance of inter-hemispheric connections in both modalities.
Our study presents some limitations which should be considered when interpreting our results. First, fNIRS signals may also encompass peripheral changes [e.g., skin impedance, muscular and cranial blood flow, among others (Nishitani and Shinohara, 2013)]. Although this was not controlled in our design, future studies should consider using short-separation channels to filter systemic hemodynamic fluctuations from non-neural sources (Gagnon et al., 2014; Brigadoi and Cooper, 2015). Similarly, for the EEG connectivity measure, methods for volume conduction correction could be explored to avoid signal leakage (Brookes et al., 2012). Given the wide range of methods to infer functional connectivity, future studies could also evaluate other approaches for connectivity analysis, such as those estimating directional, non-linear, or frequency-domain interactions (Bastos and Schoffelen, 2016). Future studies should also explore the possibility of feeding the regressor model directly with the selected multimodal features instead of summarizing them into CSS values. For this, penalized regression methods, such as ridge regression, could be used (Gao et al., 2019).
Another important point is that our experimental design focused on positioning detectors over the frontal cortex. Thus, relevant brain structures to the resting-state networks, such as the cingulate cortex and the precuneus for the default mode network (Raichle et al., 2001), or the insular cortex, basal ganglia, and amygdala for the salience network (Seeley et al., 2007), are not covered here. However, to the best of our knowledge, there is no pair of electro-hemodynamic modalities capable of recording simultaneously some of these deep brain structures. Other sensor configurations would also be relevant for neurofeedback or BCI task of interest. For instance, central regions could be relevant when predicting the performance of motor imagery protocols (Hwang et al., 2009) and parietal regions for attention-based experiments (Bagherzadeh et al., 2020). Future studies using EEG-fNIRS modalities could also explore whole-brain connectivity using evenly distributed electrodes to evaluate the role of multiple brain regions as performance predictors.
Conclusion
This paper provided preliminary evidence of the feasibility of multimodal predictors of neurofeedback performance and demonstrated the convergence of resting-state functional connectomes across modalities. Considering the portability and simplicity of EEG and fNIRS modalities, this type of result is promising for a wide range of applications which might be benefited from resting-state connectivity analysis, such as the diagnosis or prediction of treatment effectiveness in neurological and psychiatric disorders. Also, our results suggest the combined use of fNIRS and EEG methods in the investigation and description of the neurovascular coupling phenomena in network neuroscience.
Data availability statement
The raw data supporting the conclusions of this article will be made available by the authors, without undue reservation.
Ethics statement
The studies involving human participants were reviewed and approved by the Ethics Committee of the Federal University of ABC. The patients/participants provided their written informed consent to participate in this study.
Author contributions
LT, JS, and TF conceptualized the experiment. LT and CB collected the data. LT and RC performed the analysis. All authors contributed to the article and approved the submitted version.
Funding
This work was supported by the Coordination of Improvement of Higher Education Personnel (CAPES—grant 88881.134039/2016-01), the São Paulo Research Foundation (FAPESP—grants 2015/17406-5, 2018/04654-9, and 2018/21934-5), and the Canada Natural Science and Engineering Research Council (grant RGPIN-2021-03246).
Conflict of interest
The authors declare that the research was conducted in the absence of any commercial or financial relationships that could be construed as a potential conflict of interest.
Publisher’s note
All claims expressed in this article are solely those of the authors and do not necessarily represent those of their affiliated organizations, or those of the publisher, the editors and the reviewers. Any product that may be evaluated in this article, or claim that may be made by its manufacturer, is not guaranteed or endorsed by the publisher.
References
Akhtar, M. T., Mitsuhashi, W., and James, C. J. (2012). Employing spatially constrained ica and wavelet denoising, for automatic removal of artifacts from multichannel EEG data. Signal Proc. 92, 401–416.
Alkoby, O., Abu-Rmileh, A., Shriki, O., and Todder, D. (2018). Can we predict who will respond to neurofeedback? a review of the inefficacy problem and existing predictors for successful EEG neurofeedback learning. Neuroscience 378, 155–164. doi: 10.1016/j.neuroscience.2016.12.050
Babiloni, C., Vecchio, F., Altavilla, R., Tibuzzi, F., Lizio, R., Altamura, C., et al. (2014). Hypercapnia affects the functional coupling of resting state electroencephalographic rhythms and cerebral haemodynamics in healthy elderly subjects and in patients with amnestic mild cognitive impairment. Clin. Neurophysiol. 125, 685–693. doi: 10.1016/j.clinph.2013.10.002
Bagherzadeh, Y., Baldauf, D., Pantazis, D., and Desimone, R. (2020). Alpha synchrony and the neurofeedback control of spatial attention. Neuron 105, 577–587.e5.
Banville, H., Gupta, R., and Falk, T. H. (2017). Mental task evaluation for hybrid nirs-EEG brain-computer interfaces. Comp. Intell. Neurosci. 2017:3524208. doi: 10.1155/2017/3524208
Bastos, A. M., and Schoffelen, J.-M. (2016). A tutorial review of functional connectivity analysis methods and their interpretational pitfalls. Front. Systems Neurosci. 9:175. doi: 10.3389/fnsys.2015.00175
Bedrosian, E. (1963). A product theorem for Hilbert Transforms. Proc. IEEE 51, 868–869. doi: 10.1109/PROC.1963.2308
Bonnefond, M., and Jensen, O. (2015). Gamma activity coupled to alpha phase as a mechanism for top-down controlled gating. PLoS One 10:e0128667. doi: 10.1371/journal.pone.0128667
Brigadoi, S., and Cooper, R. J. (2015). How short is short? optimum source–detector distance for short-separation channels in functional near-infrared spectroscopy. Neurophotonics 2:025005. doi: 10.1117/1.NPh.2.2.025005
Britz, J., Van De Ville, D., and Michel, C. M. (2010). Bold correlates of EEG topography reveal rapid resting-state network dynamics. Neuroimage 52, 1162–1170. doi: 10.1016/j.neuroimage.2010.02.052
Brookes, M. J., Woolrich, M. W., and Barnes, G. R. (2012). Measuring functional connectivity in meg: a multivariate approach insensitive to linear source leakage. Neuroimage 63, 910–920. doi: 10.1016/j.neuroimage.2012.03.048
Canolty, R. T., and Knight, R. T. (2010). The functional role of cross-frequency coupling. Trends Cogn. Sci. 14, 506–515.
Cassani, R., and Falk, T. H. (2018). “Spectrotemporal modeling of biomedical signals: Theoretical foundation and applications,” in Reference module in biomedical sciences (Elsevier: Amsterdam).
Castellanos, N. P., and Makarov, V. A. (2006). Recovering EEG brain signals: artifact suppression with wavelet enhanced independent component analysis. J. Neurosci. Methods 158, 300–312. doi: 10.1016/j.jneumeth.2006.05.033
Chang, C., Liu, Z., Chen, M. C., Liu, X., and Duyn, J. H. (2013). EEG correlates of time-varying bold functional connectivity. Neuroimage 72, 227–236. doi: 10.1016/j.neuroimage.2013.01.049
Chiarelli, A. M., Zappasodi, F., Di Pompeo, F., and Merla, A. (2017). Simultaneous functional near-infrared spectroscopy and electroencephalography for monitoring of human brain activity and oxygenation: a review. Neurophotonics 4:041411. doi: 10.1117/1.NPh.4.4.041411
Cui, X., Bray, S., Bryant, D. M., Glover, G. H., and Reiss, A. L. (2011). A quantitative comparison of nirs and fMRI across multiple cognitive tasks. Neuroimage 54, 2808–2821. doi: 10.1016/j.neuroimage.2010.10.069
Cui, X., Bray, S., and Reiss, A. L. (2010). Functional near infrared spectroscopy (Nirs) signal improvement based on negative correlation between oxygenated and deoxygenated hemoglobin dynamics. Neuroimage 49, 3039–3046. doi: 10.1016/j.neuroimage.2009.11.050
Delorme, A., and Makeig, S. (2004). EEGlab: an open source toolbox for analysis of single-trial EEG dynamics including independent component analysis. J. Neurosci. Methods 134, 9–21.
Essenpreis, M., Elwell, C., Cope, M., Van der Zee, P., Arridge, S., and Delpy, D. (1993). Spectral dependence of temporal point spread functions in human tissues. Appl. Opt. 32, 418–425. doi: 10.1364/AO.32.000418
Falk, T. H., Fraga, F. J., Trambaiolli, L., and Anghinah, R. (2012). EEG amplitude modulation analysis for semi-automated diagnosis of alzheimer’s disease. EURASIP J. Adv. Signal Proc. 2012:192. doi: 10.3389/fnagi.2014.00055
Fazli, S., Mehnert, J., Steinbrink, J., Curio, G., Villringer, A., Müller, K.-R., et al. (2012). Enhanced performance by a hybrid nirs–EEG brain computer interface. Neuroimage 59, 519–529. doi: 10.1016/j.neuroimage.2011.07.084
Ferreira, S., Pego, J. M., and Morgado, P. (2019). The efficacy of biofeedback approaches for obsessive-compulsive and related disorders: a systematic review and meta-analysis. Psychiatry Res. 272, 237–245. doi: 10.1016/j.psychres.2018.12.096
Finn, E. S., Shen, X., Scheinost, D., Rosenberg, M. D., Huang, J., Chun, M. M., et al. (2015). Functional connectome fingerprinting: identifying individuals using patterns of brain connectivity. Nat. Neurosci. 18, 1664–1671.
Gagnon, L., Yücel, M. A., Boas, D. A., and Cooper, R. J. (2014). Further improvement in reducing superficial contamination in nirs using double short separation measurements. Neuroimage 85, 127–135. doi: 10.1016/j.neuroimage.2013.01.073
Gao, S., Greene, A. S., Constable, R. T., and Scheinost, D. (2019). Combining multiple connectomes improves predictive modeling of phenotypic measures. Neuroimage 201:116038. doi: 10.1016/j.neuroimage.2019.116038
Giacometti, P., and Diamond, S. G. (2014). Correspondence of electroencephalography and near-infrared spectroscopy sensitivities to the cerebral cortex using a high-density layout. Neurophotonics 1:025001. doi: 10.1117/1.NPh.1.2.025001
Goense, J. B., and Logothetis, N. K. (2008). Neurophysiology of the bold fMRI signal in awake monkeys. Curr. Biol. 18, 631–640.
Goldman, R. I., Stern, J. M., Engel, J. Jr., and Cohen, M. S. (2002). Simultaneous EEG and fMRI of the alpha rhythm. Neuroreport 13:2487.
Gonçalves, S. I., De Munck, J. C., Pouwels, P. J., Schoonhoven, R., Kuijer, J. P., Maurits, N. M., et al. (2006). Correlating the alpha rhythm to bold using simultaneous EEG/fMRI: inter-subject variability. Neuroimage 30, 203–213. doi: 10.1016/j.neuroimage.2005.09.062
Haugg, A., Renz, F. M., Nicholson, A. A., Lor, C., Götzendorfer, S. J., Sladky, R., et al. (2021). Predictors of real-time fMRI neurofeedback performance and improvement–a machine learning mega-analysis. NeuroImage 237:118207. doi: 10.1016/j.neuroimage.2021.118207
Horovitz, S. G., Fukunaga, M., de Zwart, J. A., van Gelderen, P., Fulton, S. C., Balkin, T. J., et al. (2008). Low frequency bold fluctuations during resting wakefulness and light sleep: a simultaneous EEG-fMRI study. Hum. Brain Mapp. 29, 671–682. doi: 10.1002/hbm.20428
Huppert, T. J., Hoge, R. D., Diamond, S. G., Franceschini, M. A., and Boas, D. A. (2006). A temporal comparison of bold, ASL, and nirs hemodynamic responses to motor stimuli in adult humans. Neuroimage 29, 368–382. doi: 10.1016/j.neuroimage.2005.08.065
Hwang, H.-J., Kwon, K., and Im, C.-H. (2009). Neurofeedback-Based motor imagery training for Brain–Computer Interface (BCI). J. Neurosci. Methods 179, 150–156.
Hyafil, A., Giraud, A.-L., Fontolan, L., and Gutkin, B. (2015). Neural cross-frequency coupling: connecting architectures, mechanisms, and functions. Trends Neurosci. 38, 725–740.
Ingvar, D., Rosen, I., and Johannesson, G. (1979). EEG related to cerebral metabolism and blood flow. Pharmacopsychiatry 12, 200–209.
Jann, K., Dierks, T., Boesch, C., Kottlow, M., Strik, W., and Koenig, T. (2009). Bold correlates of EEG alpha phase-locking and the fMRI default mode network. Neuroimage 45, 903–916. doi: 10.1016/j.neuroimage.2009.01.001
Jann, K., Koenig, T., Dierks, T., Boesch, C., and Federspiel, A. (2010). Association of individual resting state EEG alpha frequency and cerebral blood flow. Neuroimage 51, 365–372.
Jensen, O., and Mazaheri, A. (2010). Shaping functional architecture by oscillatory alpha activity: gating by inhibition. Front. Hum. Neurosci. 4:186. doi: 10.3389/fnhum.2010.00186
Keinänen, T., Rytky, S., Korhonen, V., Huotari, N., Nikkinen, J., Tervonen, O., et al. (2018). Fluctuations of the EEG-fMRI correlation reflect intrinsic strength of functional connectivity in default mode network. J. Neurosci. Res. 96, 1689–1698. doi: 10.1002/jnr.24257
Keles, H. O., Barbour, R. L., and Omurtag, A. (2016). Hemodynamic correlates of spontaneous neural activity measured by human whole-head resting state EEG+ FNIRS. Neuroimage 138, 76–87. doi: 10.1016/j.neuroimage.2016.05.058
Koch, S. P., Koendgen, S., Bourayou, R., Steinbrink, J., and Obrig, H. (2008). Individual alpha-frequency correlates with amplitude of visual evoked potential and hemodynamic response. Neuroimage 41, 233–242.
Lachaux, J. P., Fonlupt, P., Kahane, P., Minotti, L., Hoffmann, D., Bertrand, O., et al. (2007). Relationship between task-related gamma oscillations and bold signal: new insights from combined fMRI and intracranial EEG. Hum. Brain Mapp. 28, 1368–1375. doi: 10.1002/hbm.20352
Laufs, H., Kleinschmidt, A., Beyerle, A., Eger, E., Salek-Haddadi, A., Preibisch, C., et al. (2003). EEG-Correlated fMRI of human alpha activity. Neuroimage 19, 1463–1476.
Lee, M., Yoon, J.-G., and Lee, S.-W. (2020). Predicting motor imagery performance from resting-state EEG using dynamic causal modeling. Front. Hum. Neurosci. 14:321. doi: 10.3389/fnhum.2020.00321
Lindquist, K. A., Satpute, A. B., Wager, T. D., Weber, J., and Barrett, L. F. (2015). The brain basis of positive and negative affect: evidence from a meta-analysis of the human neuroimaging literature. Cereb. Cortex 26, 1910–1922. doi: 10.1093/cercor/bhv001
Lindquist, K. A., Wager, T. D., Kober, H., Bliss-Moreau, E., and Barrett, L. F. (2012). The brain basis of emotion: a meta-analytic review. Behav. Brain Sci. 35:121.
Lopez-Gordo, M., Sanchez-Morillo, D., and Valle, F. (2014). Dry EEG electrodes. Sensors 14, 12847–12870.
Ma, Y., Shaik, M. A., Kozberg, M. G., Kim, S. H., Portes, J. P., Timerman, D., et al. (2016). Resting-State hemodynamics are spatiotemporally coupled to synchronized and symmetric neural activity in excitatory neurons. Proc. Natl. Acad. Sci. U S A. 113, E8463–E8471. doi: 10.1073/pnas.1525369113
Mantini, D., Perrucci, M. G., Del Gratta, C., Romani, G. L., and Corbetta, M. (2007). Electrophysiological signatures of resting state networks in the human brain. Proc. Natl. Acad. Sci. U S A. 104, 13170–13175.
Nentwich, M., Ai, L., Madsen, J., Telesford, Q. K., Haufe, S., Milham, M. P., et al. (2020). Functional connectivity of EEG is subject-specific, associated with phenotype, and different from fMRI. NeuroImage 218:117001. doi: 10.1016/j.neuroimage.2020.117001
Ni, J., Wunderle, T., Lewis, C. M., Desimone, R., Diester, I., and Fries, P. (2016). Gamma-Rhythmic gain modulation. Neuron 92, 240–251.
Niessing, J., Ebisch, B., Schmidt, K. E., Niessing, M., Singer, W., and Galuske, R. A. (2005). Hemodynamic signals correlate tightly with synchronized gamma oscillations. Science 309, 948–951.
Nir, Y., Fisch, L., Mukamel, R., Gelbard-Sagiv, H., Arieli, A., Fried, I., et al. (2007). Coupling between neuronal firing rate, Gamma LFP, and bold fMRI is related to interneuronal correlations. Curr. Biol. 17, 1275–1285. doi: 10.1016/j.cub.2007.06.066
Nishitani, S., and Shinohara, K. (2013). Nirs as a tool for assaying emotional function in the prefrontal cortex. Front. Hum. Neurosci. 7:770. doi: 10.3389/fnhum.2013.00770
Obrig, H., Israel, H., Kohl-Bareis, M., Uludag, K., Wenzel, R., Muller, B., et al. (2002). Habituation of the visually evoked potential and its vascular response: implications for neurovascular coupling in the healthy adult. Neuroimage 17, 1–18. doi: 10.1006/nimg.2002.1177
Okyere, J. G., Ktonas, P. Y., and Meyer, J. S. (1986). Quantification of the Alpha EEG modulation and its relation to cerebral blood flow. IEEE Trans. Biomed. Eng. 33, 690–696. doi: 10.1109/TBME.1986.325759
Osipova, D., Hermes, D., and Jensen, O. (2008). Gamma power is phase-locked to posterior alpha activity. PLoS One 3:e3990. doi: 10.1371/journal.pone.0003990
Perronnet, L., Lécuyer, A., Mano, M., Bannier, E., Lotte, F., Clerc, M., et al. (2017). Unimodal versus bimodal EEG-fMRI neurofeedback of a motor imagery task. Front. Hum. Neurosci. 11:193. doi: 10.3389/fnhum.2017.00193
Pfurtscheller, G., Daly, I., Bauernfeind, G., and Müller-Putz, G. R. (2012). Coupling between intrinsic prefrontal Hbo2 and central EEG beta power oscillations in the resting brain. PLoS One 7:e43640. doi: 10.1371/journal.pone.0043640
Raichle, M. E., MacLeod, A. M., Snyder, A. Z., Powers, W. J., Gusnard, D. A., and Shulman, G. L. (2001). A default mode of brain function. Proc. Natl. Acad. Sci. U S A. 98, 676–682.
Rance, M., Walsh, C., Sukhodolsky, D. G., Pittman, B., Qiu, M., Kichuk, S. A., et al. (2018). Time course of clinical change following neurofeedback. Neuroimage 181, 807–813.
Roche-Labarbe, N., Wallois, F., Ponchel, E., Kongolo, G., and Grebe, R. (2007). Coupled oxygenation oscillation measured by nirs and intermittent cerebral activation on EEG in premature infants. Neuroimage 36, 718–727. doi: 10.1016/j.neuroimage.2007.04.002
Sasai, S., Homae, F., Watanabe, H., Sasaki, A. T., Tanabe, H. C., Sadato, N., et al. (2012). A NIRS–fMRI study of resting state network. Neuroimage 63, 179–193. doi: 10.1016/j.neuroimage.2012.06.011
Sasai, S., Homae, F., Watanabe, H., and Taga, G. (2011). Frequency-specific functional connectivity in the brain during resting state revealed by nirs. Neuroimage 56, 252–257.
Sato, H., Yahata, N., Funane, T., Takizawa, R., Katura, T., Atsumori, H., et al. (2013). A NIRS–fMRI investigation of prefrontal cortex activity during a working memory task. Neuroimage 83, 158–173. doi: 10.1016/j.neuroimage.2013.06.043
Scheeringa, R., Bastiaansen, M. C., Petersson, K. M., Oostenveld, R., Norris, D. G., and Hagoort, P. (2008). Frontal theta EEG activity correlates negatively with the default mode network in resting state. Int. J. Psychophysiol. 67, 242–251. doi: 10.1016/j.ijpsycho.2007.05.017
Scheeringa, R., and Fries, P. (2019). Cortical layers, rhythms and bold signals. NeuroImage 197, 689–698.
Scheeringa, R., Fries, P., Petersson, K.-M., Oostenveld, R., Grothe, I., Norris, D. G., et al. (2011). Neuronal dynamics underlying high-and low-frequency EEG oscillations contribute independently to the human bold signal. Neuron 69, 572–583. doi: 10.1016/j.neuron.2010.11.044
Scheeringa, R., Petersson, K. M., Kleinschmidt, A., Jensen, O., and Bastiaansen, M. C. (2012). EEG α power modulation of fMRI resting-state connectivity. Brain Connect. 2, 254–264. doi: 10.1089/brain.2012.0088
Scheinost, D., Stoica, T., Wasylink, S., Gruner, P., Saksa, J., Pittenger, C., et al. (2014). Resting state functional connectivity predicts neurofeedback response. Front. Behav. Neurosci. 8:338. doi: 10.3389/fnbeh.2014.00338
Schölvinck, M. L., Maier, A., Frank, Q. Y., Duyn, J. H., and Leopold, D. A. (2010). Neural basis of global resting-state fMRI activity. Proc. Natl. Acad. Sci. U S A. 107, 10238–10243.
Seeley, W. W., Menon, V., Schatzberg, A. F., Keller, J., Glover, G. H., Kenna, H., et al. (2007). Dissociable intrinsic connectivity networks for salience processing and executive control. J. Neurosci. 27, 2349–2356.
Shen, X., Finn, E. S., Scheinost, D., Rosenberg, M. D., Chun, M. M., Papademetris, X., et al. (2017). Using connectome-based predictive modeling to predict individual behavior from brain connectivity. Nat. Protocols 12:506.
Shibasaki, H. (2008). Human brain mapping: hemodynamic response and electrophysiology. Clin. Neurophysiol. 119, 731–743.
Sitaram, R., Ros, T., Stoeckel, L., Haller, S., Scharnowski, F., Lewis-Peacock, J., et al. (2017). Closed-Loop brain training: the science of neurofeedback. Nat. Rev. Neurosci. 18:86.
Spaak, E., Bonnefond, M., Maier, A., Leopold David, A., and Jensen, O. (2012). Layer-Specific entrainment of gamma-band neural activity by the Alpha rhythm in monkey visual cortex. Curr. Biol. 22, 2313–2318. doi: 10.1016/j.cub.2012.10.020
Strangman, G., Culver, J. P., Thompson, J. H., and Boas, D. A. (2002). A quantitative comparison of simultaneous bold fMRI and nirs recordings during functional brain activation. Neuroimage 17, 719–731.
Talukdar, M. T., Frost, H. R., and Diamond, S. G. (2015). Modeling neurovascular coupling from clustered parameter sets for multimodal EEG-NIRS. Comp. Mathematical Methods Med. 2015:830849. doi: 10.1155/2015/830849
Tomita, Y., Vialatte, F.-B., Dreyfus, G., Mitsukura, Y., Bakardjian, H., and Cichocki, A. (2014). Bimodal BCI using simultaneously NIRS and EEG. IEEE Trans. Biomed. Eng. 61, 1274–1284.
Toronov, V. Y., Zhang, X., and Webb, A. G. (2007). A spatial and temporal comparison of hemodynamic signals measured using optical and functional magnetic resonance imaging during activation in the human primary visual cortex. Neuroimage 34, 1136–1148. doi: 10.1016/j.neuroimage.2006.08.048
Trambaiolli, L. R., Biazoli, C. E., Cravo, A. M., Falk, T. H., and Sato, J. R. (2018). Functional near-Infrared spectroscopy-based affective neurofeedback: feedback effect, illiteracy phenomena, and whole-connectivity profiles. Neurophotonics 5:035009. doi: 10.1117/1.NPh.5.3.035009
Trambaiolli, L. R., Cassani, R., and Falk, T. H. (2020). EEG spectro-temporal amplitude modulation as a measurement of cortical hemodynamics: an EEG-FNIRS study. Annu. Int. Conf. IEEE Eng. Med. Biol. Soc. 2020, 3481–3484. doi: 10.1109/EMBC44109.2020.9175409
Trambaiolli, L. R., Falk, T. H., Fraga, F. J., Anghinah, R., and Lorena, A. C. (eds) (2011). EEG spectro-temporal modulation energy: a new feature for automated diagnosis of alzheimer’s disease. Annu. Int. Conf. IEEE Eng. Med. Biol. Soc. 2011, 3828–3831. doi: 10.1109/IEMBS.2011.6090951
Trambaiolli, L. R., Kohl, S. H., Linden, D. E., and Mehler, D. M. (2021a). Neurofeedback training in major depressive disorder: a systematic review of clinical efficacy, study quality and reporting practices. Neurosci. Biobehav. Rev. 125, 33–56. doi: 10.1016/j.neubiorev.2021.02.015
Trambaiolli, L. R., Tiwari, A., and Falk, T. H. (2021b). Affective neurofeedback under naturalistic conditions: a mini-review of current achievements and open challenges. Front. Neuroergonom. 2:678981. doi: 10.3389/fnrgo.2021.678981
Viswanathan, A., and Freeman, R. D. (2007). Neurometabolic coupling in cerebral cortex reflects synaptic more than spiking activity. Nat. Neurosci. 10, 1308–1312. doi: 10.1038/nn1977
von Lühmann, A., Wabnitz, H., Sander, T., and Müller, K.-R. (2016). M3ba: a mobile, modular, multimodal biosignal acquisition architecture for miniaturized EEG-NIRS-based hybrid bci and monitoring. IEEE Trans. Biomed. Eng. 64, 1199–1210. doi: 10.1109/TBME.2016.2594127
Voytek, B., Canolty, R. T., Shestyuk, A., Crone, N., Parvizi, J., and Knight, R. T. (2010). Shifts in gamma phase–amplitude coupling frequency from theta to alpha over posterior cortex during visual tasks. Front. Hum. Neurosci. 4:191. doi: 10.3389/fnhum.2010.00191
Wallois, F., Mahmoudzadeh, M., Patil, A., and Grebe, R. (2012). Usefulness of simultaneous EEG–NIRS recording in language studies. Brain Lang. 121, 110–123.
Weber, L. A., Ethofer, T., and Ehlis, A. C. (2020). Predictors of neurofeedback training outcome: a systematic review. Neuroimage Clin. 27:102301. doi: 10.1016/j.nicl.2020.102301
Wirsich, J., Giraud, A.-L., and Sadaghiani, S. (2020). Concurrent EEG-and fMRI-Derived functional connectomes exhibit linked dynamics. NeuroImage 219:116998. doi: 10.1016/j.neuroimage.2020.116998
Yuan, H., Zotev, V., Phillips, R., Drevets, W. C., and Bodurka, J. (2012). Spatiotemporal dynamics of the brain at rest—exploring EEG microstates as electrophysiological signatures of bold resting state networks. Neuroimage 60, 2062–2072. doi: 10.1016/j.neuroimage.2012.02.031
Zaidi, A. D., Munk, M. H., Schmidt, A., Risueno-Segovia, C., Bernard, R., Fetz, E., et al. (2015). Simultaneous epidural functional near-infrared spectroscopy and cortical electrophysiology as a tool for studying local neurovascular coupling in primates. Neuroimage 120, 394–399. doi: 10.1016/j.neuroimage.2015.07.019
Zhang, R., Yao, D., Valdés-Sosa, P. A., Li, F., Li, P., Zhang, T., et al. (2015). Efficient resting-state EEG network facilitates motor imagery performance. J. Neural Eng. 12:066024. doi: 10.1088/1741-2560/12/6/066024
Zhang, Y., Xu, P., Guo, D., and Yao, D. (2013). Prediction of Ssvep-Based BCI performance by the resting-state EEG network. J. Neural Eng. 10:066017. doi: 10.1088/1741-2560/10/6/066017
Keywords: neurofeedback, brain connectivity, electroencephalography, functional near-infrared spectroscopy, resting-state
Citation: Trambaiolli LR, Cassani R, Biazoli CE Jr, Cravo AM, Sato JR and Falk TH (2022) Multimodal resting-state connectivity predicts affective neurofeedback performance. Front. Hum. Neurosci. 16:977776. doi: 10.3389/fnhum.2022.977776
Received: 24 June 2022; Accepted: 03 August 2022;
Published: 08 September 2022.
Edited by:
Luca Tonin, University of Padua, ItalyReviewed by:
Emanuela Formaggio, University of Padua, ItalyMarie-Constance Corsi, Institut National de Recherche en Informatique et en Automatique (INRIA), France
Copyright © 2022 Trambaiolli, Cassani, Biazoli, Cravo, Sato and Falk. This is an open-access article distributed under the terms of the Creative Commons Attribution License (CC BY). The use, distribution or reproduction in other forums is permitted, provided the original author(s) and the copyright owner(s) are credited and that the original publication in this journal is cited, in accordance with accepted academic practice. No use, distribution or reproduction is permitted which does not comply with these terms.
*Correspondence: Lucas R. Trambaiolli, bHRyYW1iYWlvbGxpQG1jbGVhbi5oYXJ2YXJkLmVkdQ==