 Eric Suero Molina1,2*
 David Black3
 Anna Walke1,4
 Ghasem Azemi2
 Fabio D’Alessandro1,4Simone König4
 Walter Stummer1
- 1Department of Neurosurgery, University Hospital of Münster, Münster, Germany
- 2Computational NeuroSurgery (CNS) Lab, Macquarie Medical School, Faculty of Medicine, Health and Human Sciences, Macquarie University, Sydney, NSW, Australia
- 3Department of Electrical and Computer Engineering, University of British Columbia, Vancouver, BC, Canada
- 4Core Unit Proteomics, Interdisciplinary Centre for Clinical Research, University of Münster, Münster, Germany
In glioma surgery, the low-density infiltration zone of tumors is difficult to detect by any means. While, for instance, 5-aminolevulinic acid (5-ALA)-induced fluorescence is a well-established surgical procedure for maximizing resection of malignant gliomas, a cell density in tumor tissue of 20–30% is needed to observe visual fluorescence. Hyperspectral imaging is a powerful technique for the optical characterization of brain tissue, which accommodates the complex spectral properties of gliomas. Thereby, knowledge about the signal source is essential to generate specific separation (unmixing) procedures for the different spectral characteristics of analytes and estimate compound abundances. It was stated that protoporphyrin IX (PpIX) fluorescence consists mainly of emission peaks at 634 nm (PpIX634) and 620 nm (PpIX620). However, other members of the substance group of porphyrins fluoresce similarly to PpIX due to their common tetrapyrrole core structure. While the PpIX634 signal has reliably been assigned to PpIX, it has not yet been analyzed if PpIX620 might result from a different porphyrin rather than being a second photo state of PpIX. We thus reviewed more than 200,000 spectra from various tumors measured in almost 600 biopsies of 130 patients. Insufficient consideration of autofluorescence led to artificial inflation of the PpIX620 peak in the past. Recently, five basis spectra (PpIX634, PpIX620, flavin, lipofuscin, and NADH) were described and incorporated into the analysis algorithm, which allowed more accurate unmixing of spectral abundances. We used the improved algorithm to investigate the PpIX620 signal more precisely and investigated coproporphyrin III (CpIII) fluorescence phantoms for spectral unmixing. Our findings show that the PpIX634 peak was the primary source of the 5-ALA-induced fluorescence. CpIII had a similar spectral characteristic to PpIX620. The supplementation of 5-ALA may trigger the increased production of porphyrins other than PpIX within the heme biosynthesis pathway, including that of CpIII. It is essential to correctly separate autofluorescence from the main PpIX634 peak to analyze the fluorescence signal. This article highlights the need for a comprehensive understanding of the spectral complexity in gliomas and suggests less significance of the 620 nm fluorescence peak for PpIX analysis and visualization.
Introduction
Gliomas, the most common primary brain tumors, are still among the most challenging neuro-oncological diseases to diagnose and treat (Schaff and Mellinghoff, 2023). Surgery is the first step in standard multimodal therapy. By using surgical adjuncts such as 5-aminolevulinic acid (5-ALA), neurosurgeons can maximize tumor resection. The use of 5-ALA is well-established in fluorescence-guided neurosurgery for high-grade glioma (HGG) resection and photodynamic therapy (Stummer et al., 2006; Stummer and Suero Molina, 2017; Schipmann et al., 2020). Resection of the fluorescing tissue will regularly exceed the borders of contrast enhancement in magnetic resonance images (Schucht et al., 2014).
5-ALA is a non-fluorescent and naturally occurring prodrug metabolized by malignant tissue, which induces the accumulation of protoporphyrin IX (PpIX). Current evidence shows that malignant glioma tissue exhibits visual fluorescence upon reaching a threshold of tumor cell density ranging from at least 20 to 30% (Stummer et al., 2017; Suero Molina et al., 2020); below this level, fluorescence visualization is limited. Only about 20% of low-grade gliomas (LGG) display visual fluorescence in surgical microscopy (Jaber et al., 2016), which can be significantly improved when doubling the standard 5-ALA dosage from 20 to 40 mg/k.g. b.w. (Suero Molina et al., 2022).
However, many recurrences occur near resection margins (Petrecca et al., 2013). Therefore, current research is directed toward better visualization of the low-density infiltration zone of HGG and LGG. For this purpose, several research groups apply hyperspectral imaging (HI) to increase the sensitivity in optical visualization of malignant tissue (Bravo et al., 2017; Valdes et al., 2017; Black et al., 2021; Walke et al., 2023). The feature of spatially resolved spectroscopy makes HI a powerful tool in the characterization of tissues, potentially aiding in diagnosis. Fast diagnosis of diseases and surgical aiding have been the most desired application of HI in healthcare so far (Mangotra et al., 2023). Moreover, label-free imaging is under current scientific scrutiny, and although not limited to this technique, HI might be the tool for its realization.
Acquiring spatial and spectral information creates a unique fingerprint for each image pixel. Spectral alterations can then be attributed to different biochemical characteristics. Correctly describing the spectral complexity in gliomas is essential in understanding the processes of 5-ALA uptake and the subsequent induction of heme biosynthesis. HI measures a continuous spectrum within a selected spectral range and allows for spectral characterization of autofluorescence and PpIX fluorescence (Black et al., 2021; Walke et al., 2023).
PpIX exhibits maximum absorption at 405 nm, the Soret band, in the blue light range of the electromagnetic spectrum (Stummer et al., 1998). Characteristically, its fluorescence presents a double emission peak at 634 and 705 nm. The difference in wavelength between absorption and emission is known as the Stokes shift, which permits separation of excitation wavelength and emitted fluorescence via optical filters for optimal visualization of tumors and brain tissue.
A second photo-state of PpIX peaking at 620 nm (PpIX620) was proposed as a fluorophore in glioma, contributing to the PpIX fluorescence emission (Montcel et al., 2013). A PpIX620/634 ratio was described in vivo, which increases toward the infiltration zone and decreases toward the tumor core (Montcel et al., 2013; Alston et al., 2019). Thereby, the tumor microenvironment is of importance; it is believed that pH and the macromolecule concentration influence the PpIX photo-state distribution as observed in solution or tissue-simulating phantoms (Melo and Reisaeter, 1986; Lozovaya et al., 1990; Scolaro et al., 2002; Montcel et al., 2013; Alston et al., 2018).
The extracellular pH can be more acidic in malignant than in non-malignant tissue; the cellular pH gradient is considered to be reduced or, in some cases, even reversed in tumors compared to normal tissue (Gerweck and Seetharaman, 1996). Especially in glioma, alterations of pH are thought to be linked with tumor pathogenicity (Honasoge and Sontheimer, 2013). Thus, pH is an essential factor of the tumor microenvironment and should be considered in spectral imaging approaches.
The two PpIX photo-states are reported to have different quantum yields (Lozovaya et al., 1990; Montcel et al., 2013; Jonin et al., 2020), which is why they should be treated separately in spectral unmixing. Recent characterization of basis spectra improved the spectral unmixing algorithm, allowing for a more precise description of the abundances of the major five basis spectra in glioma tissue (PpIX620, PpIX634, flavin, lipofuscin, and NADH) (Black et al., 2021). This improves the exploration of the two photo-states of PpIX and the autofluorescence spectra from NADH, flavin (i.e., flavin adenine dinucleotide), and lipofuscin (Black et al., 2021). This analysis is particularly interesting for the 620 nm abundance ([PpIX620]), as it is artificially inflated when not unmixed with the five basis spectra (Black et al., 2021). Furthermore, porphyrins fluoresce similarly due to their common tetrapyrrole core structure (Seo et al., 2009; Lang et al., 2015), and it has not been analyzed for glioma, if the PpIX620 signal might result from other porphyrins rather than being a second photo-state of PpIX.
By performing pH-dependent measurements in pig brain homogenates and creating fluorescence phantoms with coproporphyrin III (CpIII) using hyperspectral imaging, we aimed to better understand the PpIX620 peak in gliomas. Furthermore, we reviewed more than 200,000 spectra acquired from almost 600 human biopsies. This article discusses the spectral characteristics of tumors following 5-ALA administration, focusing on the origin of the PpIX620 signal.
Materials and methods
We retrospectively analyzed spectra of biopsies from previous projects (Kaneko et al., 2019, 2021; Black et al., 2021; Suero Molina et al., 2021, 2022; Walke et al., 2023). Patients harboring distinct tumors who received 5-ALA orally 4 h before induction of anesthesia at a dose of 20 mg/k.g. b.w., were selected (n = 130). As varying information was available for the different analyzed criteria, we selected respective subsets of patients for each analysis (Table 1).
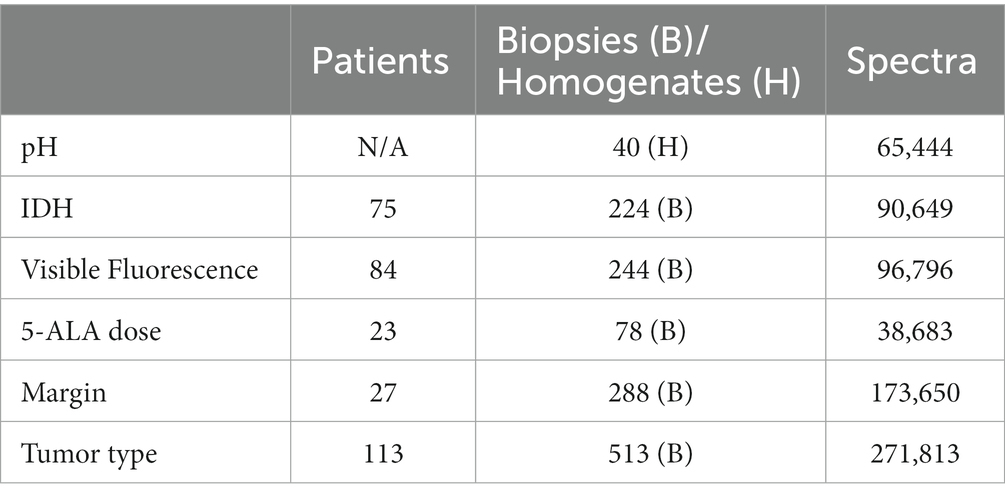
Table 1. Number of available data for this study (IDH = isocitrate dehydrogenase).
Acquisition and preprocessing
All data were measured ex vivo with a previously described widefield hyperspectral microscopy device (Kaneko et al., 2019, 2021; Black et al., 2021; Suero Molina et al., 2021, 2022; Walke et al., 2023). Spectral and spatial data cubes were generated by varying a tunable bandpass filter from 420 nm to 730 nm and capturing a 2048 × 2048 pixel image with a scientific complementary metal oxide semiconductor (sCMOS) monochrome camera every 3 to 5 nm. This procedure was carried out under intense 405 nm illumination, white light, and no illumination. In each case, light was captured through a ZEISS OPMI Pico microscope and filtered to eliminate the reflected blue excitation light but to retain the fluorescence spectrum. Regions of interest were selected manually in every data cube for the targeted tissue. These regions were divided into 10 × 10 squares of pixels and averaged to create one spectrum per square, thus reducing noise. After correcting for dark noise using the un-illuminated images, the white light spectra were used for dual-band normalization of the fluorescence spectra (Valdes et al., 2012). This process removes bias due to inhomogeneous absorption and scattering across the tissue surface.
By manually selecting regions of interest in every biopsy, we confidently removed the background and present only tumor tissue spectra, further reducing noise. Once extracted and normalized, the spectra were unmixed into their constituent parts using non-negative least squares and a priori knowledge of the present fluorophores (Black et al., 2021). This assumes that the measured fluorescence spectrum is a linear combination of individual fluorescences. The weighting of each spectrum in the linear combination describes the relative abundance of that fluorophore in the measurement. Converting these abundances given in arbitrary units (a.u.) to a concentration (for example, μg/mL) has previously been challenging (Black et al., 2021; Walke et al., 2023). This was partly due to the spectral complexity of PpIX and the difference in biochemical microenvironment and optical properties between human tissue and the phantom samples used for calibration. As absolute concentration values are ultimately not required in this paper, we present all results as abundances in arbitrary units (a.u.).
Control experiments with pig brain homogenates
To assess possible spectral alterations related to pH variance, pig brain reference tissue homogenates (RTH), as previously described by Walke et al. (2023) were used. Experiments were permitted by the Health and Veterinary Office Münster (Reg.-No. 055151052 21). Only cerebrum was used for the experiments. Tissue was washed with distilled water, roughly cut into pieces, and homogenized using a blender (VDI 12, VWR International, Hannover, Germany). Adjustment of pH within the range of 5 to 9 was achieved using 0.5 M tris(hydroxymethyl)aminomethane (Tris-base, Serva, Heidelberg, Germany) and hydrochloric acid (HCl, Honeywell Riedel-de Haen, Seelze, Germany). RTHs with pH control (pH-RTHs) were composed of homogenized cerebrum and buffer (w/v) as displayed in Table 2, before adding PpIX stock solution (300 pmol/μL in dimethyl sulfoxide (DMSO), Merck KGaA, Darmstadt, Germany) to the desired concentration of 3.0 pmol/mg. The PpIX concentration was fixed in all evaluated pH-RTHs; only the pH varied (Table 2). An exemplary spectrum is shown in Figure 1A.
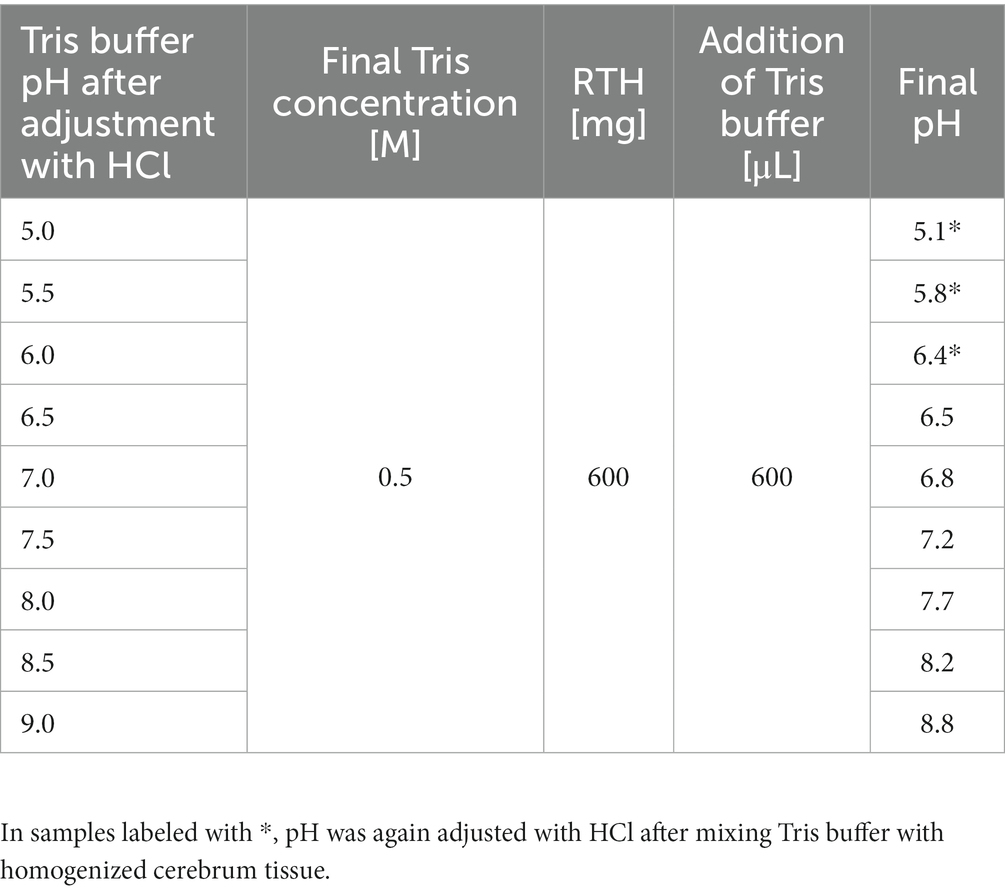
Table 2. Composition of pH-RTHs.
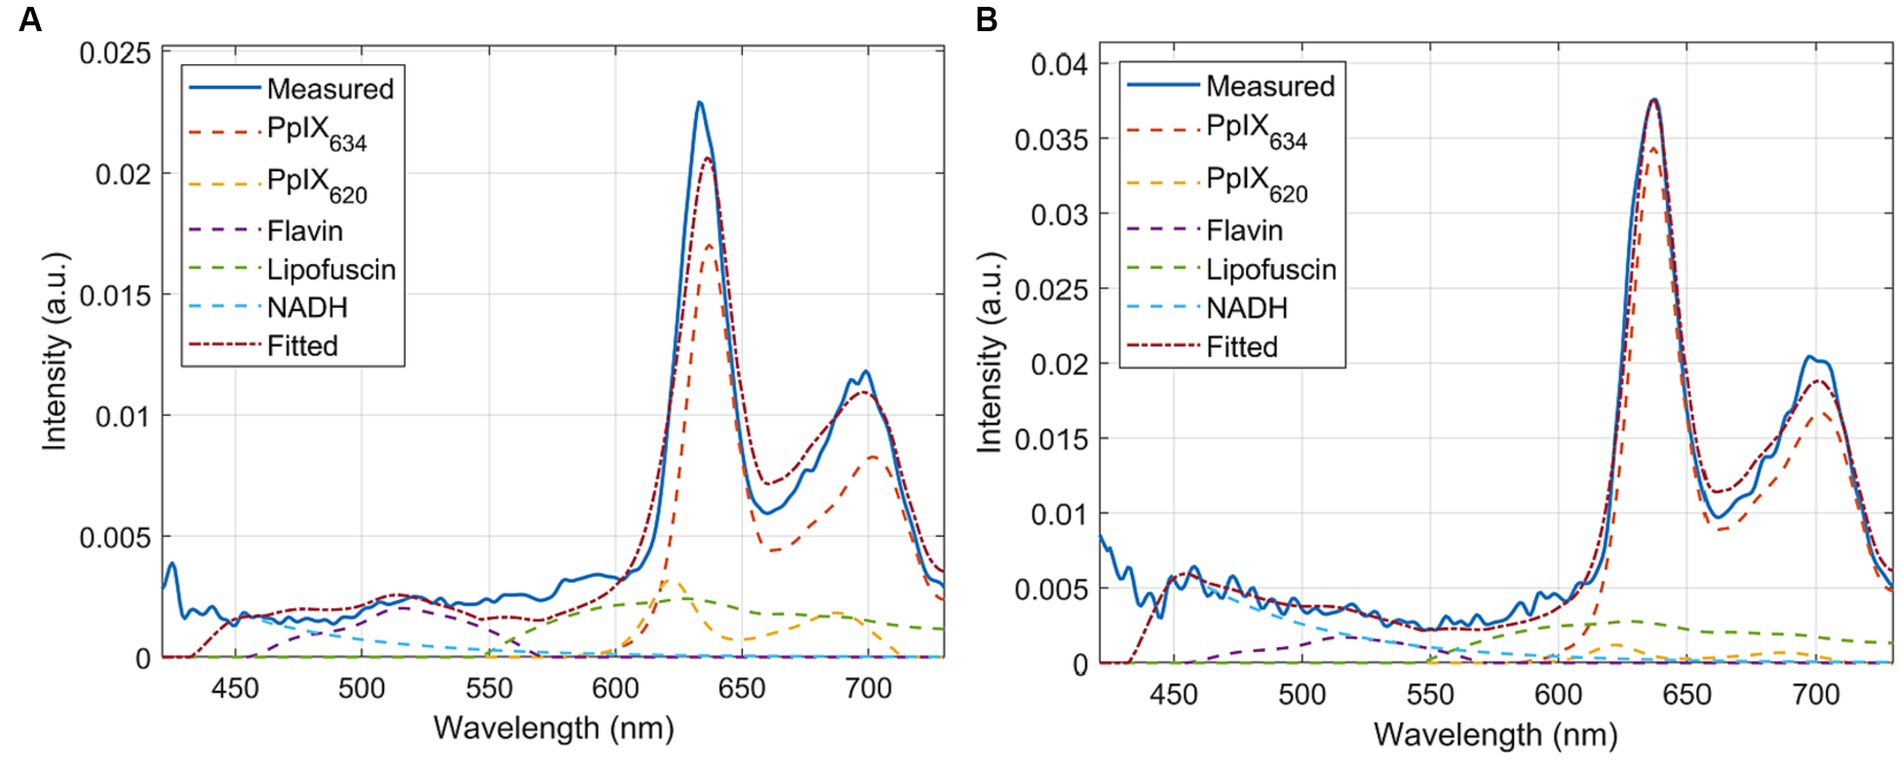
Figure 1. Sample measured spectra and unmixing of (A) pig brain homogenates and (B) phantoms. These show that the established basis spectra are completely effective on both and are, therefore, representative models of human tissue.
Phantom models
Phantom samples were prepared from RTHs and different porphyrin stock solutions to evaluate the spectral characteristics of various porphyrins. 600 mg cerebrum RTH was directly spiked with PpIX stock solution (300 pmol/μL in DMSO) or CpIII stock solution (300 pmol/μL in DMSO, Livchem Logistics, Frankfurt, Germany), yielding a concentration of 3.0 pmol/mg. pH was not adjusted or controlled in the phantoms. We also intended to test uroporphyrin, which was, however, only available in acidic solution and could thus not be compared to the other porphyrins dissolved in DMSO. PpIX and CpIII phantoms were transferred to a petri dish, forming samples of about 4 × 4 × 2 mm; for measurement of pH-RTHs, black washers were used. PpIX, CpIII phantoms, and pH-RTHs were immediately measured with the same parameters as for clinical biopsy measurements. Measurements were performed with three technical replicates. An exemplary spectrum is shown in Figure 1B.
Statistical analyses
MATLAB (The Math Works Inc., Natick, Massachusetts) and Python were used for the analysis. Statistical significance was measured using the 2-sample Kolmogorov–Smirnov test or the Wilcoxon rank-sum test, depending on the data type.
Experiments
The pH effects were studied in pH-RTH, while IDH-mutation (mutated vs. wildtype), fluorescence visibility during surgery (graded as none, weak or strong), 5-ALA dose (20 vs. 40 mg/k.g. b.w), and margin type (solid tumor (ST), infiltration zone (IZ), and reactive altered brain tissue (RABT)) were analyzed in the tumor types shown in Table 3.
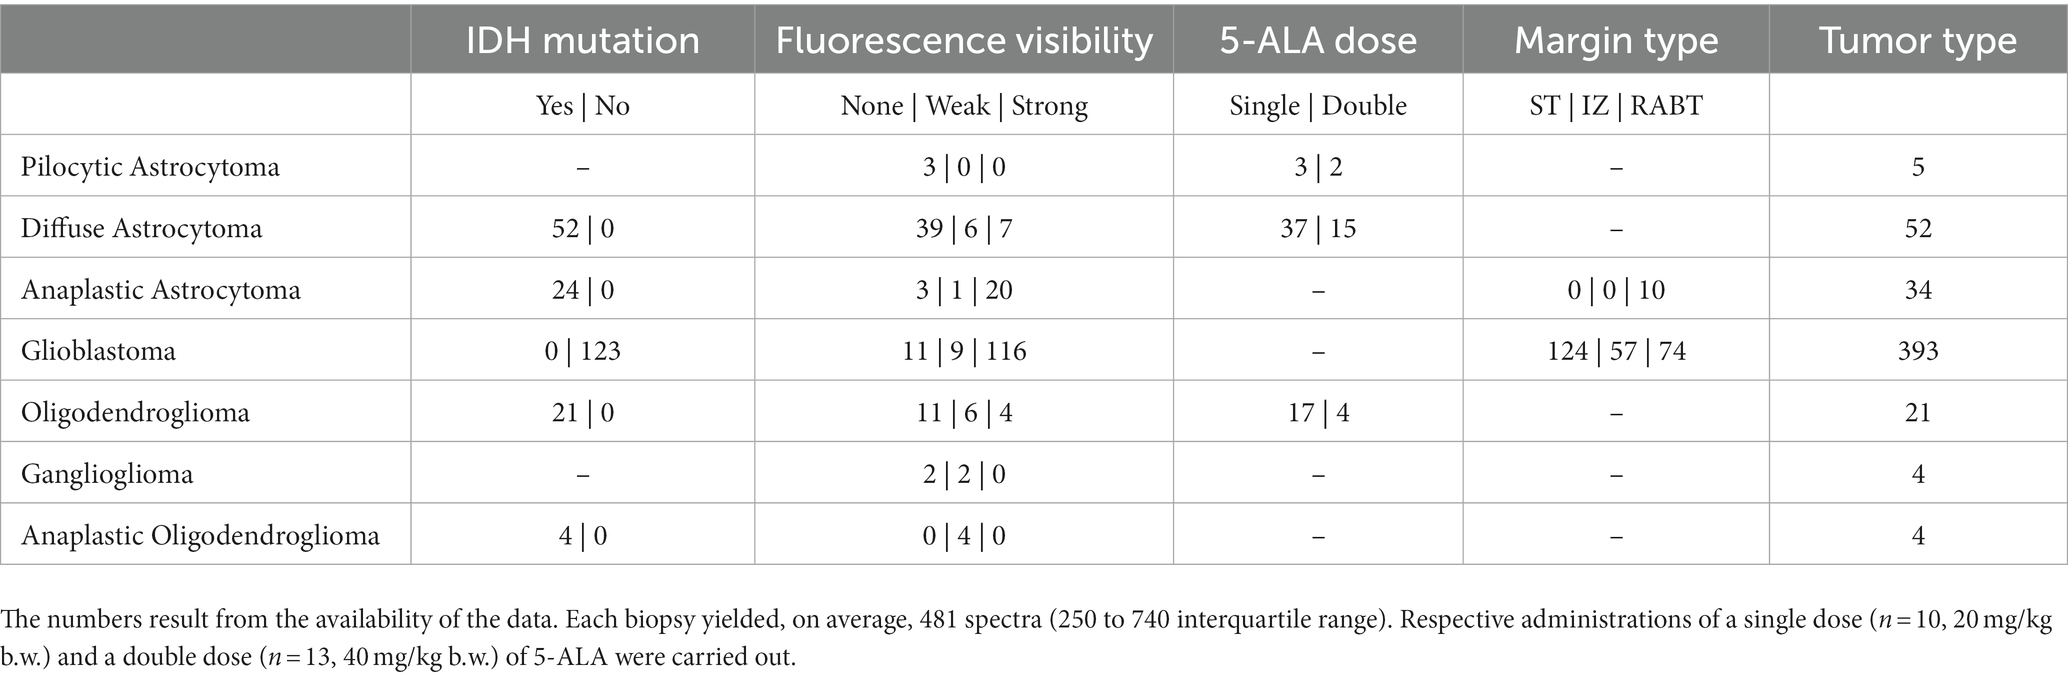
Table 3. Number of biopsies of different tumor types used in the analysis of each variable.
Results
pH-variance pig brain homogenates
[PpIX620] was determined in the RTHs with known pH and PpIX concentration. Using the 2-sample Kolmogorov–Smirnov test, the [PpIX620] differed significantly (p < 0.001) between different pH levels (Figure 2B). However, unlike [PpIX634], [PpIX620] is not strongly linearly related to pH (r2 = 0.50). For the comparison of the measured [PpIX634] values and tissue pH (p < 0.001 between all pH values), there is a clear linear trend (r2 = 0.88). This is shown in Figure 2 for a given PpIX concentration in cerebrum pH-RTHs. It seems that [PpIX634] increases linearly with pH in the tested range (pH 5.1–8.8) while [PpIX620] decreases linearly until pH 7.2 and is high in the pH range 7.7–8.8 (Figure 2). Compared to [PpIX634], the [PpIX620] is lower by about factor five (Figure 2). This shows that PpIX634 is more important for PpIX analysis compared to PpIX620 when considering pH dependence between pH 5 and 9.
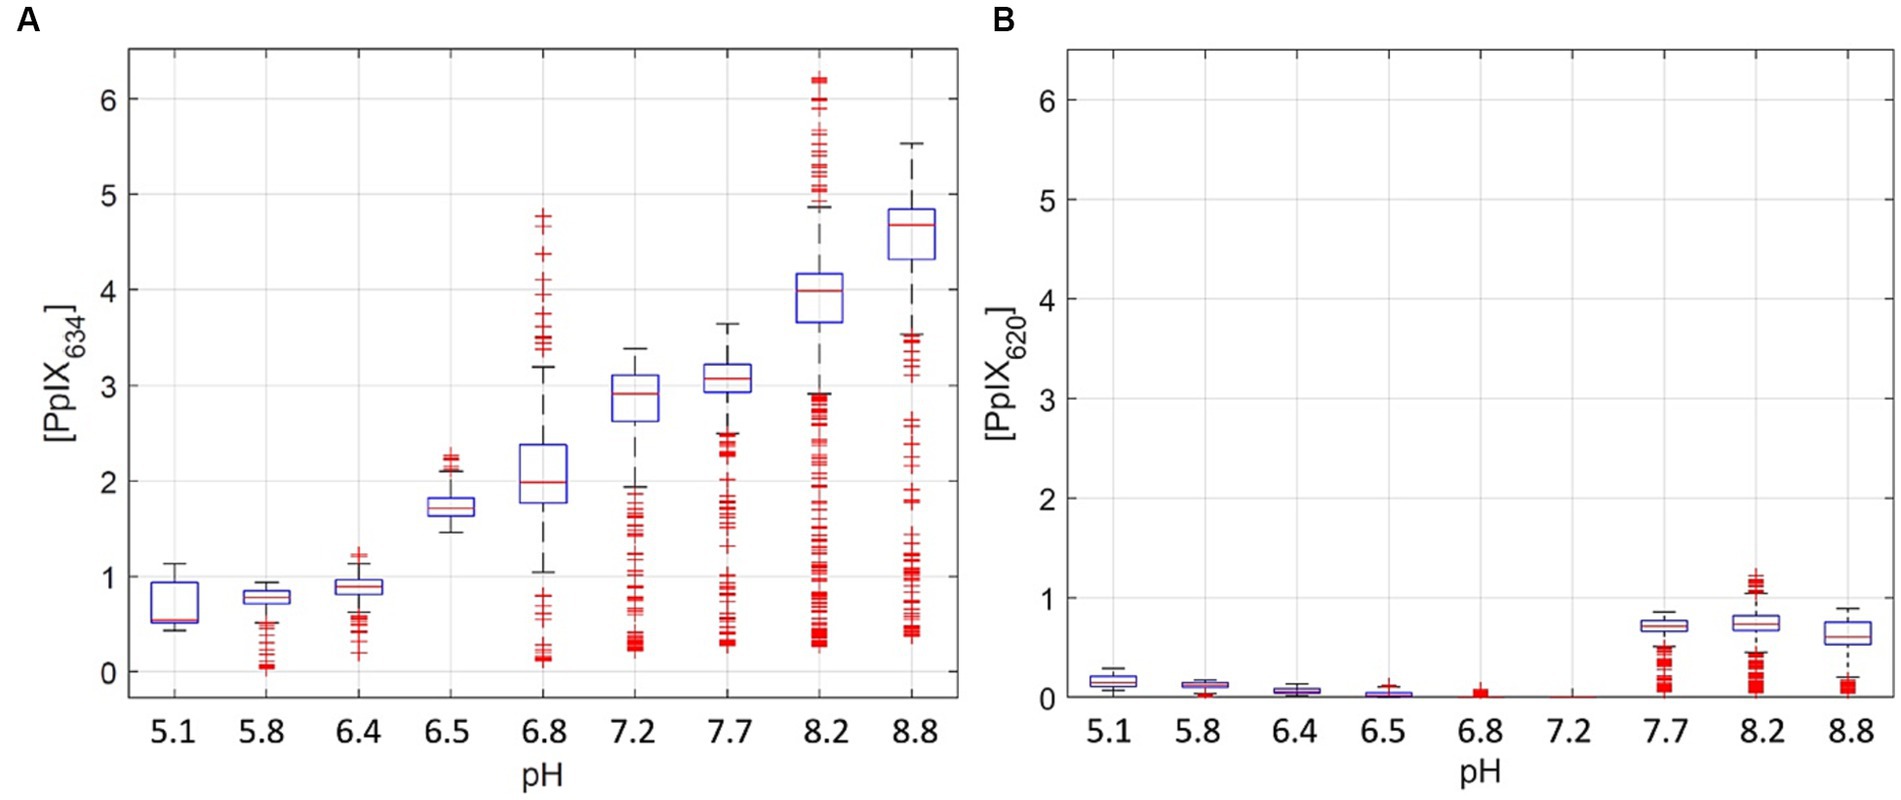
Figure 2. Pig homogenates measurements with 3 pmol/mg PpIX and pH adjustment between 5.1 to 8.8 (A,B). (A) shows the [PpIX634], and (B) shows [PpIX620]. The physiological range for normal brain and glioma tissue is between pH 6 and 8 (Gerweck and Seetharaman, 1996; Honasoge and Sontheimer, 2013).
Human brain data
IDH mutation
The abundances for PpIX634 and PpIX620 were analyzed concerning the IDH mutation in ex vivo human tissue samples. IDH mutation was detected for a subset of patients and not for each measured tumor biopsy. The ratio [PpIX620]/[PpIX634] is much higher for tumors with IDH mutation than in IDH-wildtype tumors. The mean ratio for IDH-wildtype tumors was 0.046 ± 0.168, whereas IDH-mutant tumors presented a 0.477 ± 1.878 mean ratio. The difference is statistically significant with p < 0.001. Most of the change in the ratio is due to [PpIX634], while [PpIX620] does not vary much. Median values are listed in Table 4, and the ratio distributions are shown in Figure 3A. The ratio was calculated for each spectrum, and the mean/median was computed after.
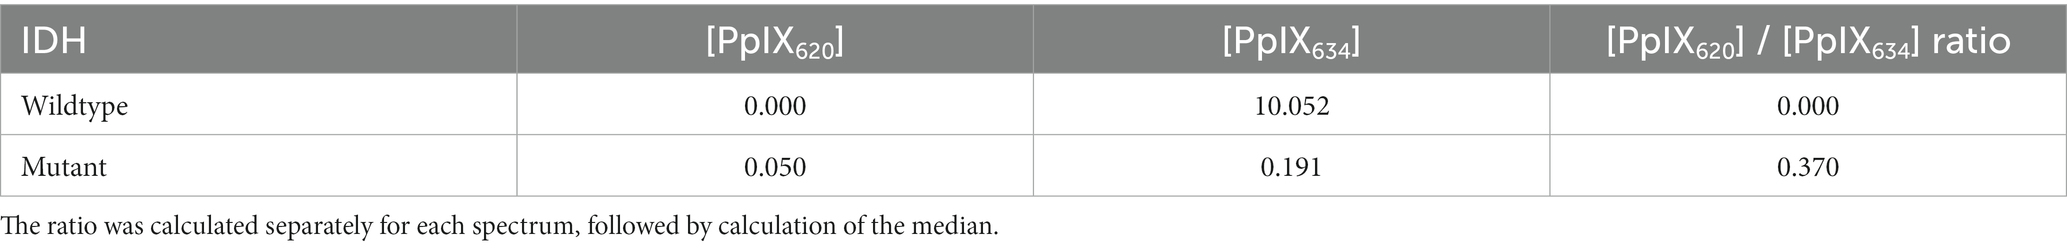
Table 4. Median values of [PpIX620], [PpIX634] and their ratio in IDH-mutated and IDH-wildtype gliomas.
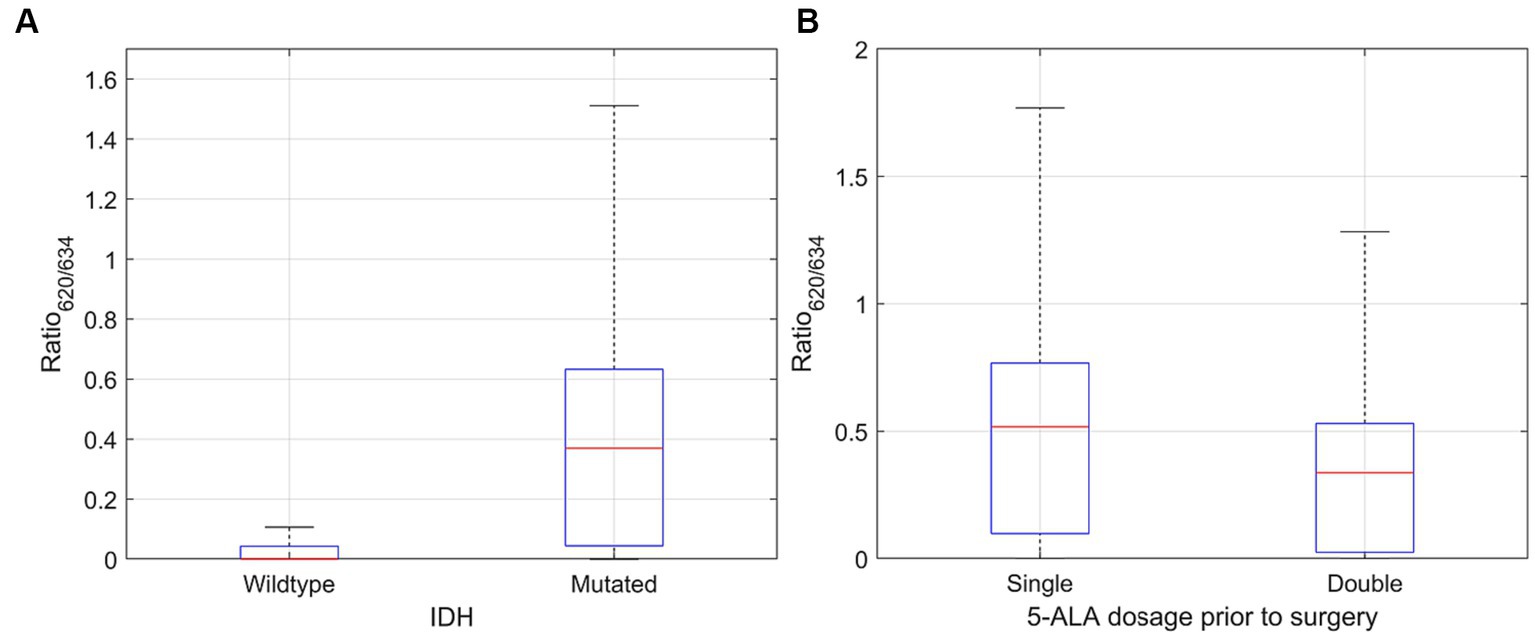
Figure 3. Distribution of [PpIX620]/[PpIX634] ratio for (A) IDH mutated and wildtype glioma (significantly higher for mutated glioma; p < 0.001) and (B) single (20 mg/k.g. b.w.) and double (40 mg/k.g. b.w.) dose of 5-ALA. The mean and median [PpIX620] proportion was significantly higher for single dose (p < 0.001).
Double dose of 5-ALA
Doubling the dosage of 5-ALA in LGG leads to a decrease in the median and mean proportion of PpIX620. Even though the single-dose group presented some outliers, using the Wilcoxon-Rank-Sum test, a significant difference was observed (p < 0.001). The median [PpIX620]/[PpIX634] ratio after a single (20 mg/k.g. b.w.) vs. a double (40 mg/k.g. b.w.) 5-ALA dose was 0.517 and 0.337, respectively. The mean was likewise higher despite the outliers, with 0.648 ± 2.623 in the single-dose group and 0.346 ± 0.337 in the double-dose group. Figure 3B illustrates the dependence of the ratio [PpIX620]/[PpIX634] on the 5-ALA dose.
Only 10 patients received a double dose of 5-ALA for a small proof-of-principle study (Suero Molina et al., 2022). Therefore, the subset of patients analyzed in the IDH comparison is much larger. The effect of the double dose in the IDH subset is relatively small.
Fluorescence visibility
Before tumor removal and ex vivo measurement, the surgeon first graded every brain tumor sample regarding the quality of visible fluorescence. As observed for the pH and IDH, [PpIX620] seems far less interesting than [PpIX634] concerning fluorescence visibility. The [PpIX620] / [PpIX634] ratio decreases as visibility increases. This comes, however, from the fact that the [PpIX634] increases on average by a factor of 46 while [PpIX620] only doubles and is not strongly related to fluorescence visibility (r2 = 0.0148), although the categories’ differences are statistically significant (p < 0.01). This is shown in Table 5.
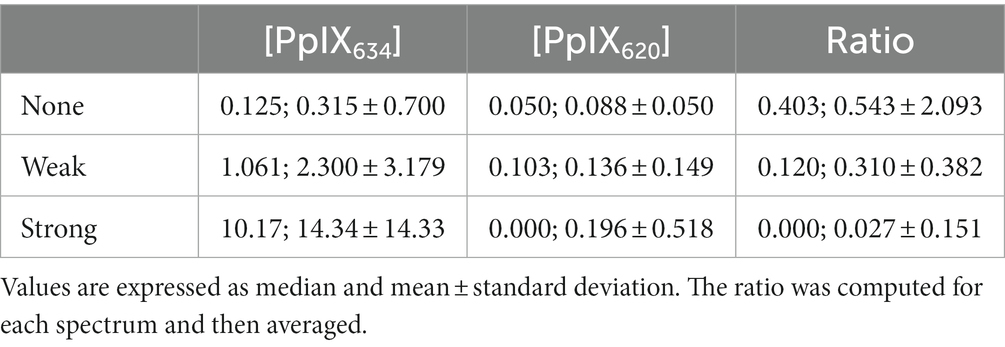
Table 5. PpIX contributions versus fluorescence visibility.
Margin classification
Tissues were divided according to the histopathological assessment between ST, IZ, and RABT. For the comparison of tumor margin and PpIX abundance, both [PpIX634] and [PpIX620] vary similarly. The abundance is relatively high for ST and decreasing for IZ and RABT. As a result, the ratio does not change as much as in other categories. This is visualized in Figure 4. The mean ratio is 0.472 ± 1.359 (mean ± standard deviation) for ST, 0.907 ± 1.687 (mean ± standard deviation) for IZ, and 1.014 ± 4.286 (mean ± standard deviation) for RABT (median 0.331, 0.635, and 0.705, respectively).
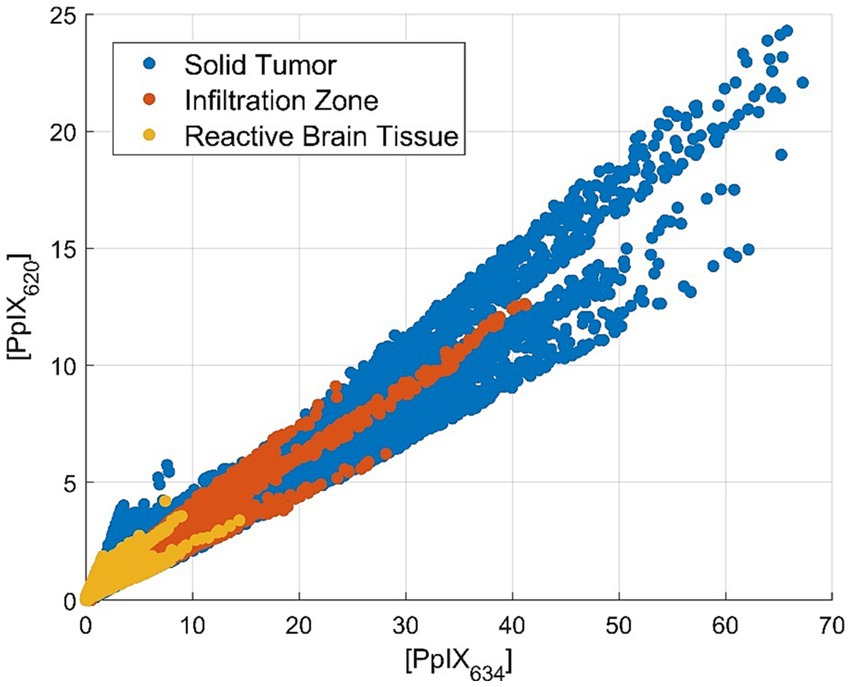
Figure 4. Scatterplot of the PpIX634 and PpIX620 abundance in solid tumor, infiltration zone, and reactive altered brain tissue showing approximately constant PpIX ratio.
Phantom experiments
In the various tests described so far, [PpIX620] was always relatively constant while [PpIX634] varied. If PpIX620 would be a second fluorescing state of PpIX, caused by a different microenvironment or pH, as has been hypothesized (Melo and Reisaeter, 1986; Lozovaya et al., 1990; Kim et al., 2010; Montcel et al., 2013; Alston et al., 2019), then one might expect it to vary more. An alternative theory is that the 620 nm peak fluorescence stems from other porphyrin precursors in the heme synthesis pathway, including coproporphyrin III (CpIII) and uroporphyrin (Up) (Dietel et al., 2007; Seo et al., 2009; Lang et al., 2015). We created CpIII and PpIX phantoms to explore this hypothesis, measured them, and extracted 689 CpIII and 1884 PpIX spectra. Up was only available in HCl, which causes a strong peak wavelength shift (Melo and Reisaeter, 1986), thus it could not be used. However, its fluorescence curve is expected to have a PpIX-like shape, peaking at 616 nm (Lang et al., 2015).
Using the pig brain-based phantoms described in the Methods section, the peak wavelengths of these spectra were determined using two methods. First, the maximum of each spectrum was taken and averaged over all the measurements. However, fluorescence is a Poisson process, so the intensity at each wavelength is Poisson distributed rather than Gaussian. Thus, the fluorescence peak maxima are the noisiest regions, and it is easy to miss the maximum by several nanometers. To address this, the spectra were first averaged, which decreases noise by . The average spectrum was then fitted to each spectrum in the region of the main peak (from 590 to 640 nm) by maximizing the normalized cross-correlation between the two signals. This fits the peak shape, independent of magnitude.
Additionally, since this method is much more robust to noise than simply finding the maximum, the measured spectra were first up-sampled by a factor of 10 through cubic spline interpolation to obtain a more precise peak location. The resulting peak locations are given in Table 6 and Figure 5A, with similar results from both methods. Figure 5B shows the new PpIX634 and CpIII spectra obtained from the phantom measurements. Both PpIX and CpIII match well with previous data from Seo et al. (2009), as seen in Figure 6. These observations show that CpIII is similar to the previously published basis spectrum of PpIX620 (Black et al., 2021).
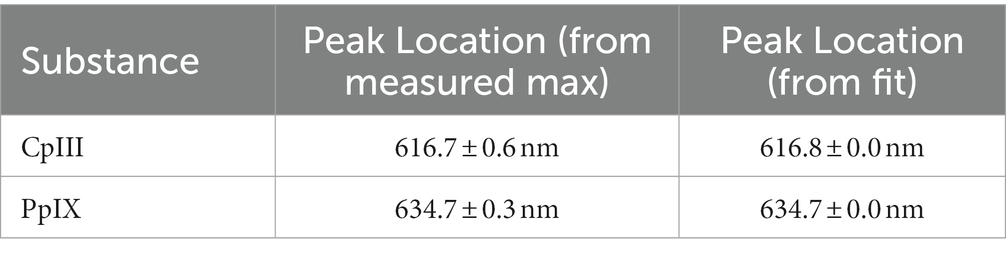
Table 6. Porphyrin peak fluorescence locations from the two methods.
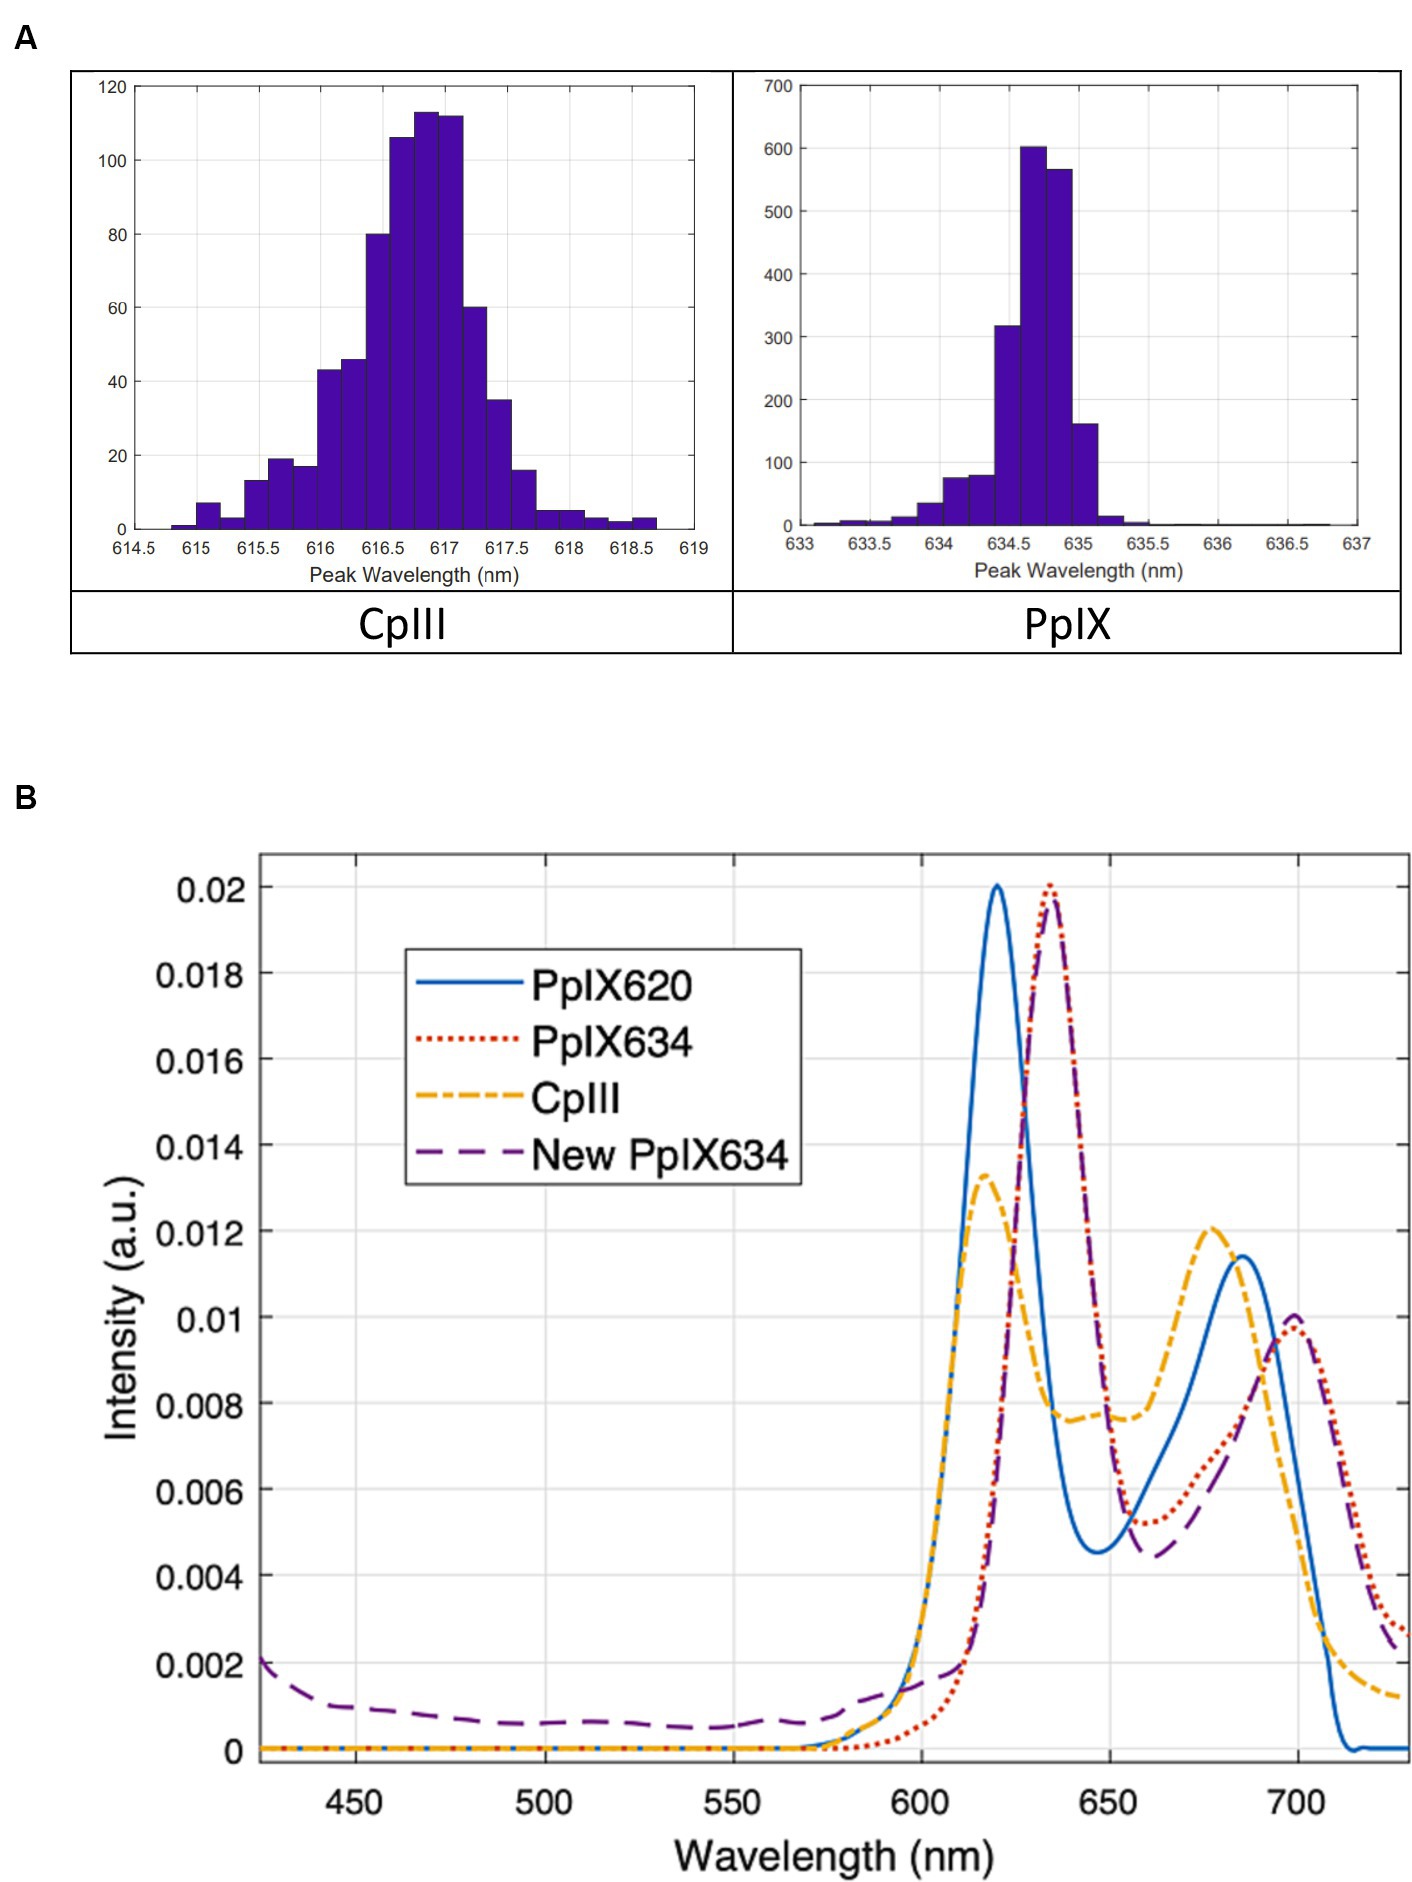
Figure 5. (A) Peak location distributions from using the maxima of the individual spectra (B) Porphyrin basis spectra for unmixing tests. CpIII and the new PpIX634 are based on pig brain phantoms. The old PpIX spectra (labeled PpIX620 and PpIX634) are from Black et al. (2021). The new and old PpIX634 match very well, so the new PpIX634 and the CpIII should be directly applicable to our existing human data.
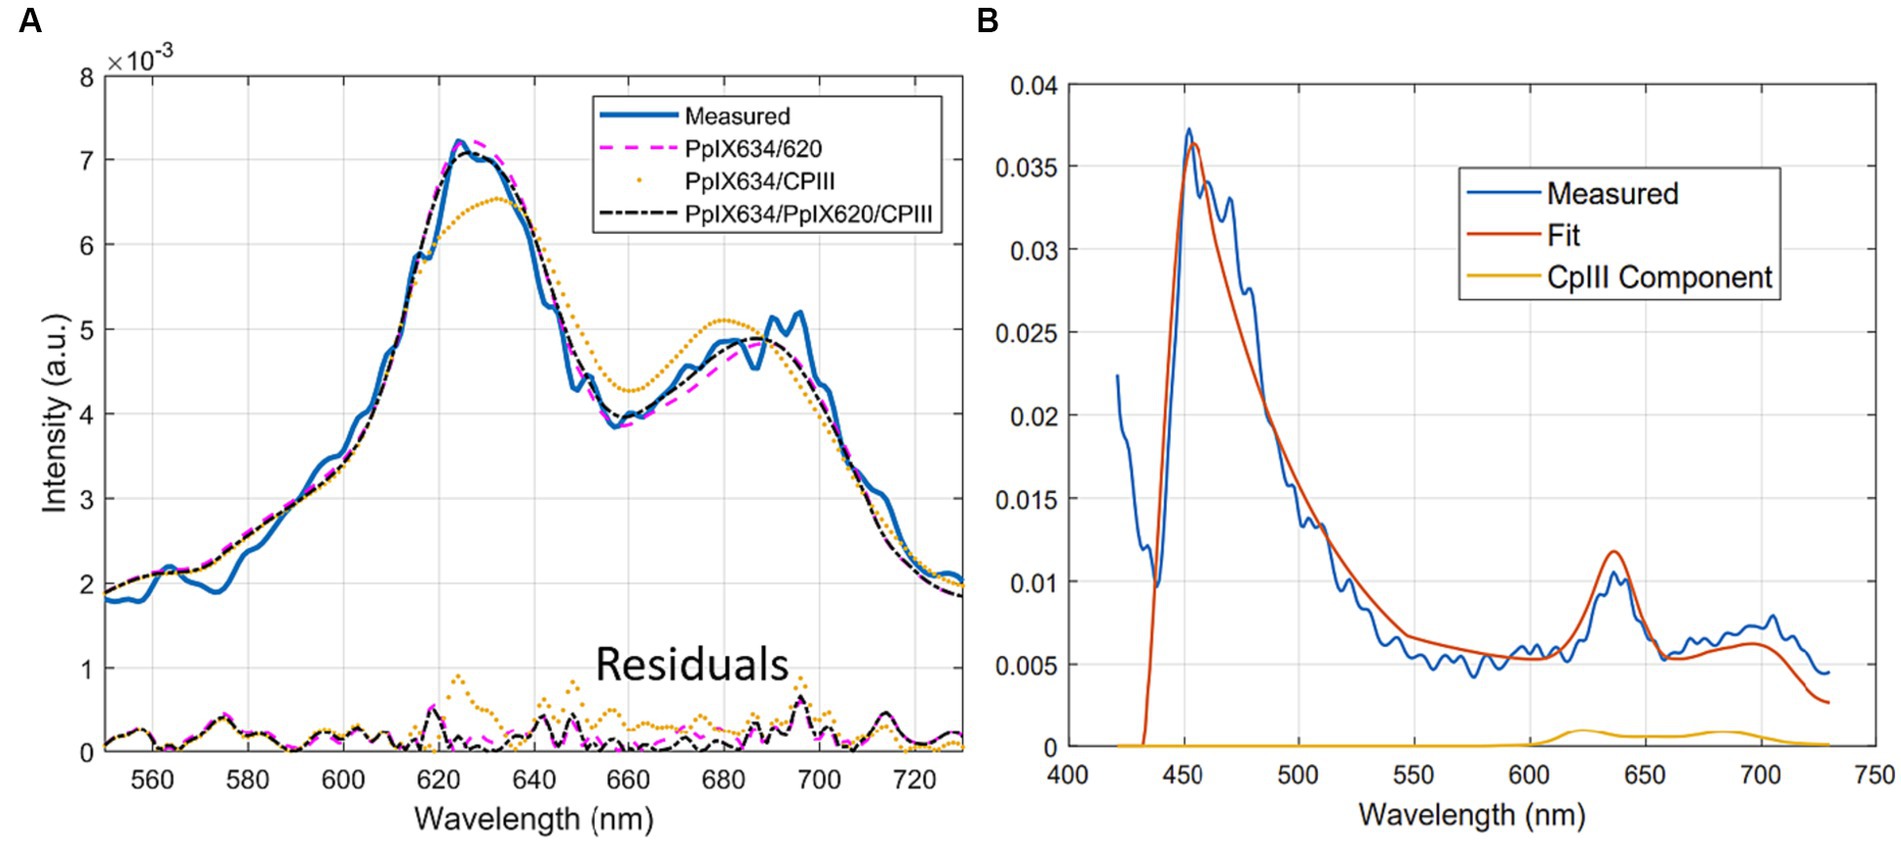
Figure 6. (A) Typical unmixing with three different bases (PpIX634, PpIX620, and CpIII), showing the residuals below, (B) Typical CpIII component fitting to noise in the secondary fluorescence peak.
We performed unmixing experiments using the average spectra of the individual fluorophore phantoms as new basis spectra, shown in Figure 5B. We used three different sets of basis spectra: A = [PpIX634, PpIX620, autofluorescence], B = [PpIX634, CpIII, autofluorescence], and C = [PpIX634, PpIX620, CpIII, autofluorescence], where the autofluorescence was lipofuscin, flavin, and NADH (Black et al., 2021).
First, pig brain phantoms spiked with PpIX and CpIII were unmixed (1995 spectra). Basis C gave a significantly better unmixing result than basis B and A (p < 0.001), with root mean square (RMS) unmixing errors (A = 0.0038, B = 0.0029, and C = 0.0026). This suggests that neither CpIII nor PpIX620 alone are sufficient to describe the spectral characteristics of pig brain phantoms and that a model like set C, which uses three porphyrin spectra (PpIX634, PpIX620, and CpIII), is superior. Alternatively, the better performance of set C could be due to slight overfitting.
Next, the human brain spectra were unmixed. The RMS unmixing error of A and C were significantly lower than B (p < 0.001), again indicating that CpIII alone does not effectively account for PpIX620. The average ± standard deviation abundances of the porphyrins from the three different unmixing processes are shown in Table 7. Note that each basis spectrum was initially normalized to have the same area under the curve, so the abundances can be compared directly, though they are in arbitrary units.
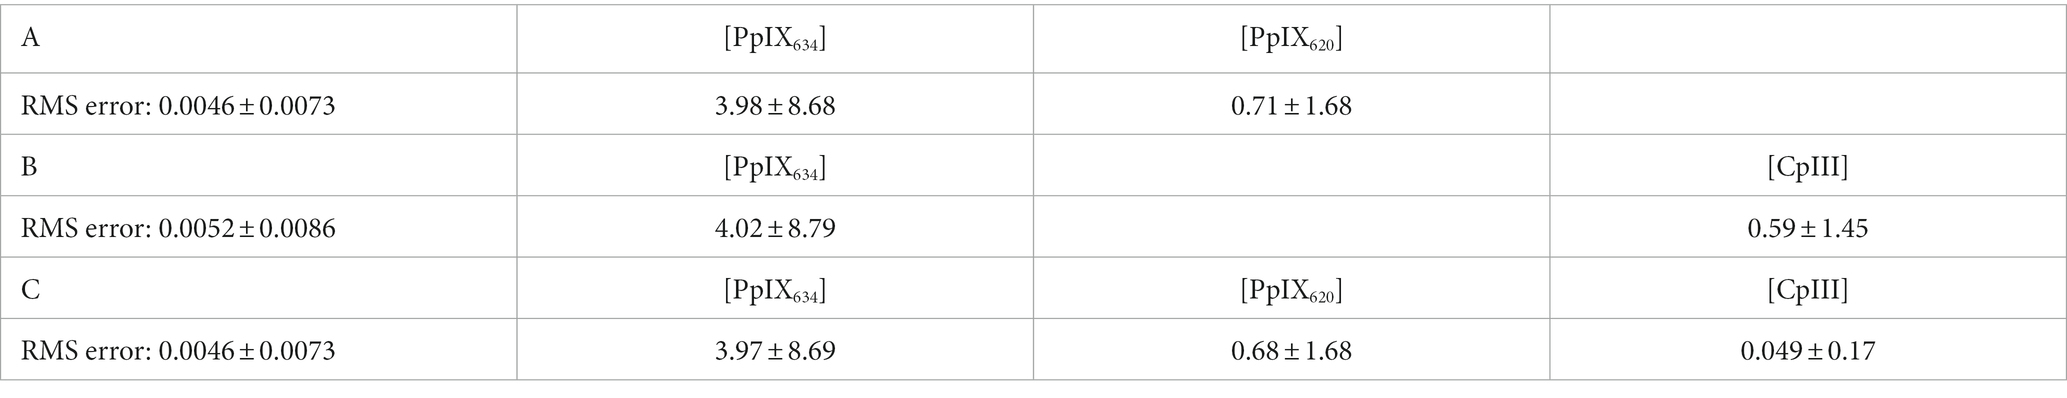
Table 7. Abundances of potential porphyrins in human brain spectra, calculated by fitting the human brain spectra with specific portions of the basis spectra shown in Figure 5B and autofluorescence (lipofuscin, flavin, NADH) as described previously (Black et al., 2021).
The abundance of PpIX634 and PpIX620 using set A and C were similar, and the published PpIX620 basis spectrum (Black et al., 2021) alone performs better than that of CpIII. The difference may be because the PpIX620 spectrum is more optimized for human data, whereas the CpIII spectrum was derived from spiked pig brain experiments and was not naturally occurring. We also used a PpIX spectrum, shifted to peak at 616 nm, as an approximation for Up and found its abundance negligible (< 0.01) in all cases. This implies that Up is probably not commonly present in the measured human spectra, though we have not carefully characterized its spectrum.
It is also possible to compare the unmixing process qualitatively. The fits of set A versus B in human data were visibly different, with set A using the PpIX620 (Black et al., 2021) basis spectrum instead of the CpIII spectrum, giving a better fit around the two peaks. Using set C does improve the fit slightly, possibly due to overfitting. A typical unmixing with set A, B, and C is shown in Figure 6A. In measurements where a non-negligible CpIII component is fitted, the secondary peak is often noisy, so CpIII is fitted to boost up this portion of the fitted spectrum. It usually results in a fit where the primary peak is overly blue-shifted due to the location of the primary peak of CpIII. A typical example is shown in Figure 6B.
The difference in fit error between basis A and C is minimal in all unmixing. The combination of all three spectra may work best because, with three spectra, we are overfitting. Indeed, in the human data, the RMS fit errors of basis C and A are identical, at 0.0046 ± 0.0073 (mean ± standard deviation). This is because the attributed CpIII abundance is negligible. The [CpIII] is 14 times smaller than that of [PpIX620] and 80 times smaller than that of [PpIX634].
This suggests that either (1) CpIII and the peak so far labeled as PpIX620 originate from the same fluorophore, where the difference in shape stems from the different measurement conditions (human tumor versus spiked pig brain), or (2) CpIII is not present in appreciable abundances in the human measurements, and PpIX620 is probably a state of PpIX. It is challenging to distinguish conclusively between PpIX620 and CpIII in the spectra as both are very similar. The basis vectors in the unmixing should be as mutually orthogonal as possible, but CpIII and PpIX620 are relatively colinear due to their similarity. Hence, the unmixing problem with basis C becomes more degenerate, and different values of [CpIII] and [PpIX620] can give almost equally good results. Due to the degeneracy, overfitting, and the two possible conclusions above, we postulate that one should use only the PpIX620 basis spectrum in the unmixing.
On the other hand, Up is not appreciably present in human tumor data. Besides Up, Cp, and PpIX, there are also hepta-, hexa- and penta-carboxylporphyrinogens, which are intermediates in heme biosynthesis between Up and CpIII. These porphyrins should be kept in mind for future projects.
Tumor types
Differences in spectral characteristics between different tumor types were analyzed with the five basis spectra (PpIX634, PpIX620, lipofuscin, flavin, NADH) (Black et al., 2021). The differences in [PpIX634] and [PpIX620] between tumor types were statistically significant (p < 0.01), but again, [PpIX634] seems to vary much more than [PpIX620] between the different classes. By plotting the five basis spectra among various tumor entities (Figure 7A), clusters can be built, indicating different abundances of autofluorescence according to the tumor type. Figure 7B shows the distribution among [PpIX620] and [PpIX634] for different tumor types.
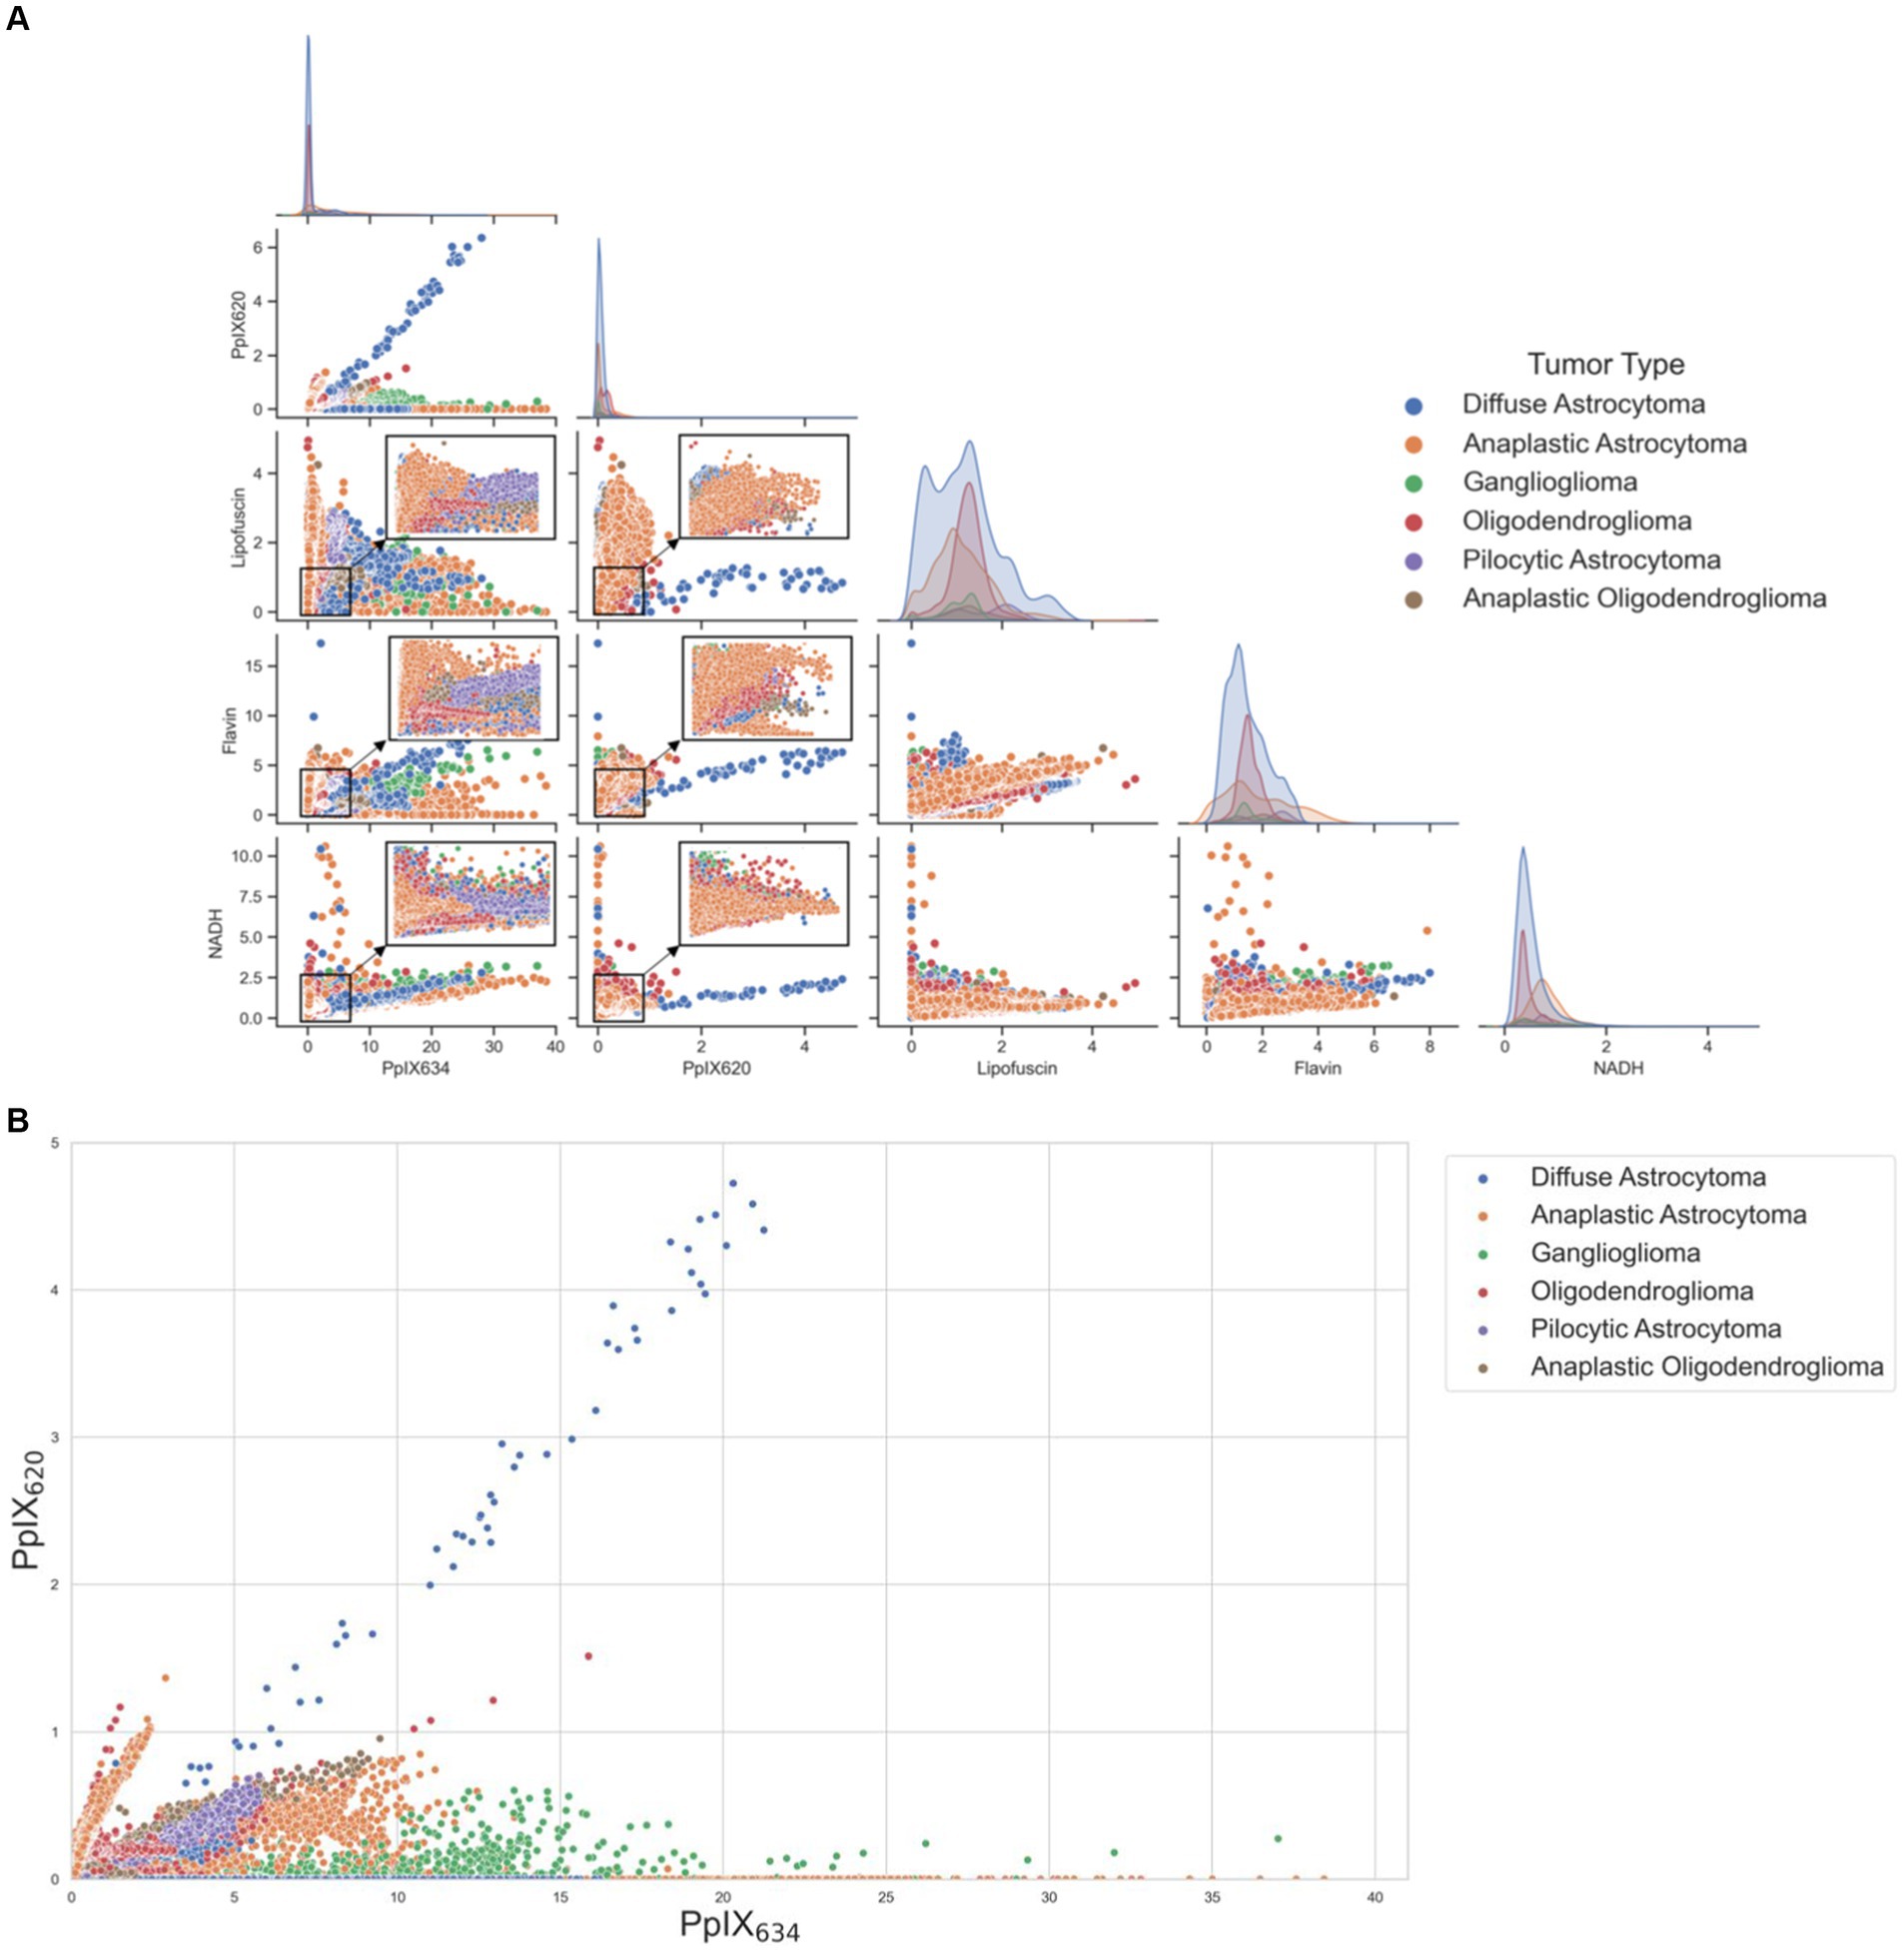
Figure 7. (A) Scatterplot matrix demonstrating cluster formation within tumor types when divided by the five basis spectra. Clusters within the scatterplot were magnified, emphasizing regions of higher data density. The diagonal shows the distribution of the respective abundances of the basis spectra for each tumor subtype. (B) Scatterplot of different tumor types and their distribution among [PpIX620] and [PpIX634].
Discussion
Significance of the 620 nm fluorescence
The origin of the 620 nm fluorescence peak, which is blue-shifted compared to the well-known PpIX fluorescence maximum at 634 nm, is of ongoing discussion. Previous work suggested that the signal arose from a second PpIX photo-state (Montcel et al., 2013; Alston et al., 2019; Black et al., 2021). The reason for this was data that showed the appearance of a fluorescence maximum at 620 nm in an aqueous solution containing only PpIX and dependent on the physicochemical aggregation behavior of PpIX (Melo and Reisaeter, 1986; Scolaro et al., 2002). It was, thus, for a good reason, assumed that the signal at 620 nm in neurosurgical applications is a second photo-state of PpIX and that the PpIX photo-state distribution is dependent on the microenvironment as this affects PpIX aggregation. Consequently, aqueous phantoms were developed, which proved the observations of Melo and Reisaeter (Melo and Reisaeter, 1986). Shifting the PpIX fluorescence maximum between 634 and 620 nm was possible by variation of surfactant, lipid volume fraction, and pH (Alston et al., 2018).
Moreover, addition of human serum albumin (Lozovaya et al., 1990), or isolated proteinoid solution (Lozovaya et al., 1990), also shifted the PpIX fluorescence from 620 nm in aqueous solution, which is attributed to a highly aggregated PpIX micelle (Melo and Reisaeter, 1986), towards 634 nm, an effect commonly observed in organic solvents like methanol (Lozovaya et al., 1990). During our experiments with pH-RTHs, the pH did not affect the 620 nm fluorescence much, possibly because the aggregation behavior of PpIX was different in pH-RTHs compared to aqueous phantoms (Alston et al., 2018). Thus, in aqueous solutions and phantoms, the published data and our results imply that (i) both fluorescence maxima originated from PpIX, as this was the only fluorophore present, (ii) the appearance of different PpIX fluorescence emission maxima was foremost due to the PpIX aggregation behavior, (iii) the aggregation behavior was dependent on the microenvironment in aqueous solutions and phantoms, which is different from RTHs. Still, it is unclear if these observations can be transferred to an in vivo setting, where, most likely, aggregation of PpIX is prevented by proteins, e.g., albumin (Lamola et al., 1981), and association of PpIX to lipid bilayers like the cell or mitochondria membrane.
In a biological system, if the heme biosynthesis is performed in situ, it becomes more reasonable that the 620 nm fluorescence emission could be attributed to other porphyrin precursors like Up or CpIII. Indeed, the 620 nm signal was labeled as a more hydrophilic PpIX precursor during spectral studies in the human skin (Seo et al., 2009), blood plasma (Lang et al., 2015), bacteria cultures of the human digestive tract (Dietel et al., 2007), or in carcinoma cells (Dietel et al., 1996). In some instances, the spectral results were verified using high-performance liquid chromatography (HPLC) (Dietel et al., 1996), which is more specific than spectral fluorescence. Dietel and co-workers identified Up, Cp, and traces of hepta-, hexa- and penta-carboxyporphyrin besides PpIX in carcinoma cells after induction of heme biosynthesis with 5-ALA (Dietel et al., 1996).
The exact mechanisms that lead to induction of heme biosynthesis and accumulation of PpIX in glioma tissue are multifactorial and not entirely clear (Stepp and Stummer, 2018; McNicholas et al., 2019). After 5-ALA enters the cell, the tumor microenvironment, e.g., hypoxia due to altered glucose metabolism, may play an important role, as well as alterations in heme biosynthesis (McNicholas et al., 2019). Often, reduced activity of the enzyme ferrochelatase (FECH) and iron deficiency are proposed to be linked to the PpIX accumulation in cancer cells (Valdes et al., 2010; Stepp and Stummer, 2018; McNicholas et al., 2019). Still, evidence is missing that this plays a role in vivo. Nevertheless, synthesis of PpIX is only possible via induction of the whole heme synthesis pathway, including the more hydrophilic porphyrin precursors. Closely linked to heme biosynthesis is a group of genetic metabolic disorders, the porphyrias. There, dysfunction in any of the enzymes in the heme pathway can lead to accumulation of a heme precursor (Figure 8) in blood, urine, and stool (Bissell and Wang, 2015; Lang et al., 2015; Bissell et al., 2017). It is, therefore, possible that the more hydrophilic porphyrins are also elevated in cancer besides the well-known substantial accumulation of PpIX. Future work should aim to characterize the porphyrin pattern in cancer by spectral analysis, accompanied by more specific analytical methods, e.g., HPLC and mass spectrometry. Also, an excitation at 405 nm might account for a low quantum yield of PpIX620/CpIII. Additionally, heme biosynthesis enzymes should be included in these studies to understand the cause of porphyrin accumulation. Such studies would also contribute to elucidating the mechanisms that lead to PpIX accumulation in glioma cells.
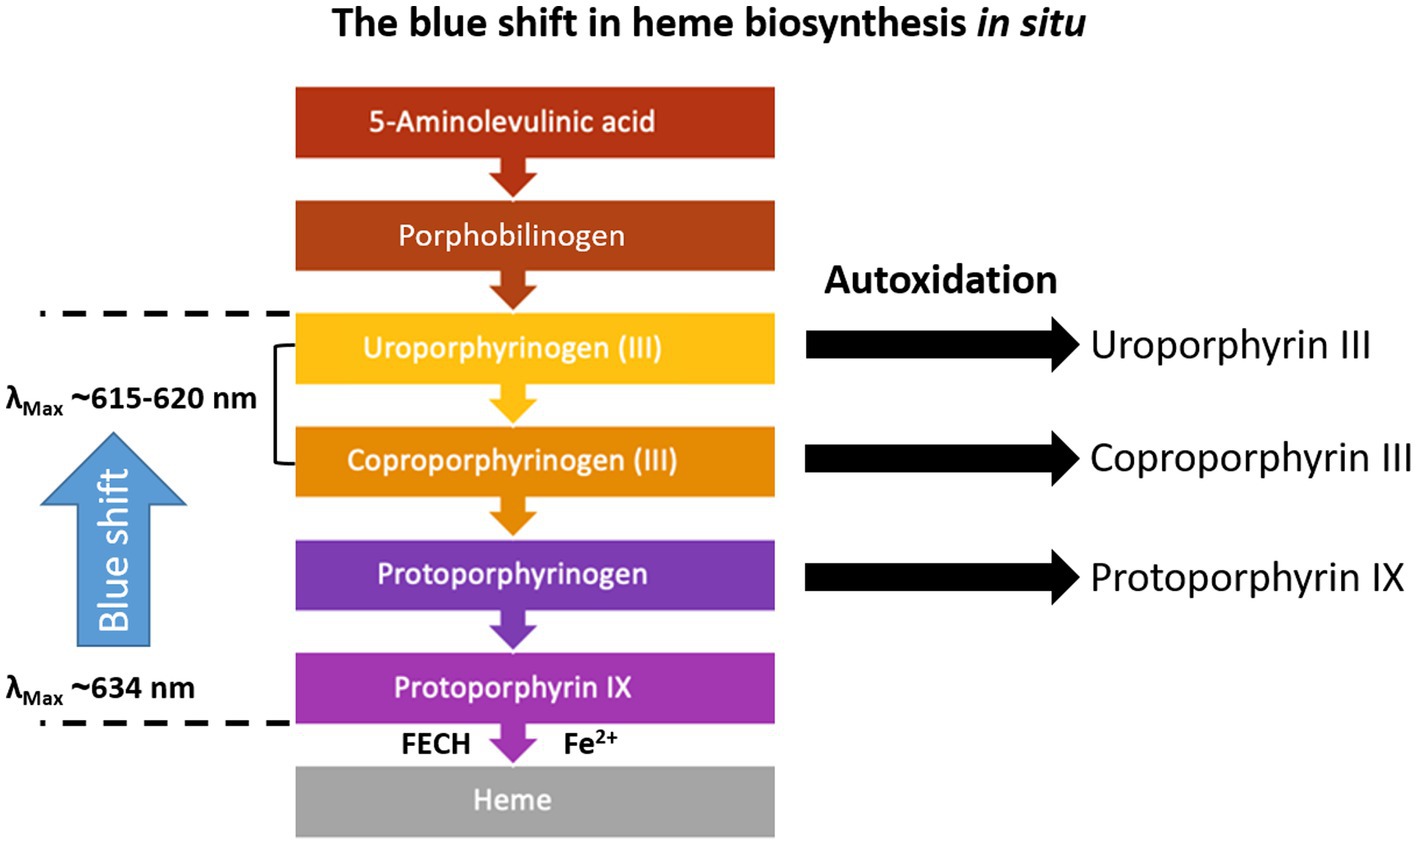
Figure 8. Heme biosynthesis and fluorescence peak maxima according to the literature (Dietel et al., 2007; Seo et al., 2009; Lang et al., 2015). The porphyrinogen intermediates do not fluoresce, but they readily oxidize in situ, if oxygen is available, and form the delocalized system of π-electrons, which facilitates fluorescence. This process is further enhanced by irradiation.
The blue shift
In previous work, while characterizing [PpIX634] and [PpIX620] and calculating the proposed ratio, a shift in the measured spectrum from 634 nm to 620 nm was observed. This blue shift was progressive with decreasing malignancy and was significantly correlated with [PpIX634], [PpIX620], Ki-67 proliferation index, fluorescence visibility, and WHO grade of tumors (Black et al., 2021). [PpIX620] is artificially inflated when not unmixing with sufficient basis spectra; the blue shift was proposed as a more robust biomarker than the PpIX620/634 ratio, as it is independent of the autofluorescence (Black et al., 2021).
According to our analysis, [PpIX634] is much more informative for all the assessed classifications than [PpIX620]. Therefore, it is sufficient to note this abundance as the main one regarding optical device development. [PpIX620] does not vary much with pH, while [PpIX634] changes approximately linearly. The same is true for IDH mutation and fluorescence visibility. In both cases, [PpIX634] strongly correlates with the respective variable, whereas [PpIX620] is relatively constant. The ratio [PpIX620]/[PpIX634] is significantly greater for IDH-mutant tumors than IDH-wildtype and for non-fluorescing tumors greater than strongly fluorescing ones. [PpIX634] also varies much more than [PpIX620] between different tumor types. Still, in general, other tumor types seem to have different amounts of lipofuscin, NADH, flavin, PpIX620, and PpIX634 fluorescence (Figure 7). Still, again, it is mostly [PpIX634] that changes. Doubling the dose of 5-ALA seems to decrease the proportion of [PpIX620]. Both [PpIX620] and [PpIX634] vary approximately by the same amount when assessing the tumor margins between ST, IZ, and RABT. As a result, the ratio is approximately constant.
As a potential limitation of this study, it has to be noted that experiments were performed ex vivo with a wide-field HI device, and previously described work about the two-peaked 5-ALA-induced PpIX fluorescence emission spectrum was described in vivo by using a different technique from HI, i.e., fiber optic point spectroscopy (Montcel et al., 2013; Alston et al., 2019). Therefore, results might not be entirely comparable. However, this study measured ex vivo tissue immediately after extraction. We still believe our analysis in a large collective demonstrates the importance of the unmixing method with the appropriate basis spectra (Black et al., 2021), as we still see artificially inflated [PpIX620] when not correctly unmixing.
Conclusion
[PpIX634] mainly contributes to visual 5-ALA-induced fluorescence in brain tumors. [PpIX620] varied only slightly with pH and different tumor regions, IDH status, and fluorescence visibility. Other porphyrin intermediates of heme biosynthesis are discussed as a possible origin of the blue-shifted 620 nm fluorescence emission. One potential candidate, CpIII, was examined here, revealing similar spectral characteristics to PpIX620. Given the spectral complexity of the measurements, the contribution of multiple fluorophores, the value of information contained in each fluorophore, and the risk of drawing incorrect conclusions on the identity of fluorophores, it is important to continue exploring the spectra and identifying their sources. Together with improved spectral unmixing methods, this will contribute to a deeper understanding of tumor biology.
Data availability statement
The datasets presented in this article are not readily available because these large database of biopsies has not been approved for sharing publicly. Requests to access the datasets should be directed to eric.suero@ukmuenster.de.
Ethics statement
The studies involving humans were approved by the Ethics committee, University of Münster. The studies were conducted in accordance with the local legislation and institutional requirements. Written informed consent for participation in this study was provided by the participants’ legal guardians/next of kin. The animal studies were approved by Health and Veterinary Office Münster. The studies were conducted in accordance with the local legislation and institutional requirements. Written informed consent was not obtained from the owners for the participation of their animals in this study because pig brain was acquired from a local butcher.
Author contributions
EM: Conceptualization, Data curation, Formal analysis, Investigation, Methodology, Software, Supervision, Validation, Visualization, Writing – original draft, Writing – review & editing. DB: Conceptualization, Data curation, Formal analysis, Methodology, Visualization, Writing – original draft, Writing – review & editing. AW: Investigation, Methodology, Writing – original draft, Writing – review & editing, Data curation. GA: Software, Visualization, Writing – review & editing. Fd’A: Investigation, Methodology, Writing – review & editing. SK: Investigation, Methodology, Project administration, Supervision, Writing – review & editing. WS: Investigation, Project administration, Supervision, Writing – review & editing.
Funding
The author(s) declare that no financial support was received for the research, authorship, and/or publication of this article.
Acknowledgments
We thank Carl Zeiss Meditec (Oberkochen, Germany) for providing us with the OPMI pico system and the BLUE 400 filter.
Conflict of interest
WS has received speaker and consultant fees from Medac, Carl Zeiss, Leica, SBI Ala-Pharma, and NXDC, as well as research support from Carl Zeiss and Photonamic. EM received research support from Carl Zeiss Meditec AG.
The remaining authors declare that the research was conducted in the absence of any commercial or financial relationships that could be construed as a potential conflict of interest.
Publisher’s note
All claims expressed in this article are solely those of the authors and do not necessarily represent those of their affiliated organizations, or those of the publisher, the editors and the reviewers. Any product that may be evaluated in this article, or claim that may be made by its manufacturer, is not guaranteed or endorsed by the publisher.
References
Alston, L., Mahieu-Williame, L., Hebert, M., Kantapareddy, P., Meyronet, D., Rousseau, D., et al. (2019). Spectral complexity of 5-ala induced Ppix fluorescence in guided surgery: a clinical study towards the discrimination of healthy tissue and margin boundaries in high and low grade gliomas. Biomed. Opt. Express 10, 2478–2492. doi: 10.1364/BOE.10.002478
Alston, L., Rousseau, D., Hebert, M., Mahieu-Williame, L., and Montcel, B. (2018). Nonlinear relation between concentration and fluorescence emission of Protoporphyrin ix in calibrated phantoms. J. Biomed. Opt. 23, 1–7. doi: 10.1117/1.JBO.23.9.097002
Bissell, D. M., and Wang, B. (2015). Acute hepatic Porphyria. J. Clin. Transl. Hepatol. 3, 17–26. doi: 10.14218/JCTH.2014.00039
Black, D., Kaneko, S., Walke, A., Konig, S., Stummer, W., and Suero Molina, E. (2021). Characterization of autofluorescence and quantitative Protoporphyrin ix biomarkers for optical spectroscopy-guided glioma surgery. Sci. Rep. 11:20009. doi: 10.1038/s41598-021-99228-6
Bravo, J. J., Olson, J. D., Davis, S. C., Roberts, D. W., Paulsen, K. D., and Kanick, S. C. (2017). Hyperspectral data processing improves Ppix contrast during fluorescence guided surgery of human brain tumors. Sci. Rep. 7:9455. doi: 10.1038/s41598-017-09727-8
Dietel, W., Bolsen, K., Dickson, E., Fritsch, C., Pottier, R., and Wendenburg, R. (1996). Formation of water-soluble porphyrins and Protoporphyrin ix in 5-Aminolevulinic-acid-incubated carcinoma cells. J. Photochem. Photobiol. B 33, 225–231. doi: 10.1016/1011-1344(95)07249-7
Dietel, W., Pottier, R., Pfister, W., Schleier, P., and Zinner, K. (2007). 5-Aminolaevulinic acid (ala) induced formation of different fluorescent porphyrins: a study of the biosynthesis of porphyrins by Bacteria of the human digestive tract. J. Photochem. Photobiol. B 86, 77–86. doi: 10.1016/j.jphotobiol.2006.07.006
Gerweck, L. E., and Seetharaman, K. (1996). Cellular Ph gradient in tumor versus Normal tissue: potential exploitation for the treatment of Cancer. Cancer Res. 56, 1194–1198.
Honasoge, A., and Sontheimer, H. (2013). Involvement of tumor acidification in brain Cancer pathophysiology. Front. Physiol. 4:316. doi: 10.3389/fphys.2013.00316
Jaber, M., Wolfer, J., Ewelt, C., Holling, M., Hasselblatt, M., Niederstadt, T., et al. (2016). The value of 5-Aminolevulinic acid in low-grade gliomas and high-grade gliomas lacking glioblastoma imaging features: an analysis based on fluorescence, magnetic resonance imaging, 18f-Fluoroethyl tyrosine positron emission tomography, and tumor molecular factors. Neurosurgery 78, 401–411; Discussion 411. doi: 10.1227/NEU.0000000000001020
Jonin, C., Ray, C., Salmon, E., Leclerc, P., Montcel, B., Mahieu-Williame, L., et al. (2020). Two photon excited fluorescence and hyper Rayleigh scattering of Protoporphyrin ix. J. Photochem. Photobiol. A Chem. 402:112812. doi: 10.1016/j.jphotochem.2020.112812
Kaneko, S., Suero Molina, E., Ewelt, C., Warneke, N., and Stummer, W. (2019). Fluorescence-based measurement of real-time kinetics of Protoporphyrin ix after 5-Aminolevulinic acid administration in human in situ malignant gliomas. Neurosurgery 85, E739–E746. doi: 10.1093/neuros/nyz129
Kaneko, S., Suero Molina, E., Sporns, P., Schipmann, S., Black, D., and Stummer, W. (2021). Fluorescence real-time kinetics of Protoporphyrin ix after 5-ala Administration in low-grade glioma. J. Neurosurg. 136, 1–7. doi: 10.3171/2020.10.JNS202881
Kim, A., Khurana, M., Moriyama, Y., and Wilson, B. C. (2010). Quantification of in vivo fluorescence decoupled from the effects of tissue optical properties using Fiber-optic spectroscopy measurements. J. Biomed. Opt. 15:067006. doi: 10.1117/1.3523616
Lamola, A. A., Asher, I., Muller-Eberhard, U., and Poh-Fitzpatrick, M. (1981). Fluorimetric study of the binding of Protoporphyrin to Haemopexin and albumin. Biochem. J. 196, 693–698. doi: 10.1042/bj1960693
Lang, A., Stepp, H., Homann, C., Hennig, G., Brittenham, G. M., and Vogeser, M. (2015). Rapid screening test for Porphyria diagnosis using fluorescence spectroscopy. Clin. Biomed. Spectrosc. Imag. 9537
Lozovaya, G. I., Masinovsky, Z., and Sivash, A. A. (1990). Protoporphyrin ix as a possible ancient photosensitizer: spectral and photochemical studies. Orig. Life Evol. Biosph. 20, 321–330. doi: 10.1007/BF01808114
Mangotra, H., Srivastava, S., Jaiswal, G., Rani, R., and Sharma, A. (2023). Hyperspectral imaging for early diagnosis of diseases: a review. Expert. Syst. 40. doi: 10.1111/exsy.13311
Mcnicholas, K., Macgregor, M. N., and Gleadle, J. M. (2019). In order for the light to Shine so brightly, the darkness must be present-why do cancers fluoresce with 5-Aminolaevulinic acid? Br. J. Cancer 121, 631–639. doi: 10.1038/s41416-019-0516-4
Melo, T. B., and Reisaeter, G. (1986). The physicochemical state of Protoporphyrin ix in aqueous solution investigated by fluorescence and light scattering. Biophys. Chem. 25, 99–104. doi: 10.1016/0301-4622(86)85070-0
Montcel, B., Mahieu-Williame, L., Armoiry, X., Meyronet, D., and Guyotat, J. (2013). Two-peaked 5-ala-induced Ppix fluorescence emission Spectrum distinguishes glioblastomas from low grade gliomas and infiltrative component of glioblastomas. Biomed. Opt. Express 4, 548–558. doi: 10.1364/BOE.4.000548
Petrecca, K., Guiot, M. C., Panet-Raymond, V., and Souhami, L. (2013). Failure pattern following complete resection plus radiotherapy and Temozolomide is at the resection margin in patients with glioblastoma. J. Neuro-Oncol. 111, 19–23. doi: 10.1007/s11060-012-0983-4
Schaff, L. R., and Mellinghoff, I. K. (2023). Glioblastoma and other primary brain malignancies in adults: a review. JAMA 329, 574–587. doi: 10.1001/jama.2023.0023
Schipmann, S., Muther, M., Stogbauer, L., Zimmer, S., Brokinkel, B., Holling, M., et al. (2020). Combination of ala-induced fluorescence-guided resection and intraoperative open photodynamic therapy for recurrent glioblastoma: case series on a promising dual strategy for local tumor control. J. Neurosurg. 134, 1–11.
Schucht, P., Knittel, S., Slotboom, J., Seidel, K., Murek, M., Jilch, A., et al. (2014). 5-ala complete resections go beyond Mr contrast enhancement: shift corrected volumetric analysis of the extent of resection in surgery for glioblastoma. Acta Neurochir. 156, 305–312; Discussion 312. doi: 10.1007/s00701-013-1906-7
Scolaro, L. M., Castriciano, M., Romeo, A., Patanè, S., Cefalì, E., and Allegrini, M. (2002). Aggregation behavior of Protoporphyrin ix in aqueous solutions: clear evidence of vesicle formation. J. Phys. Chem. B 106, 2453–2459. doi: 10.1021/jp013155h
Seo, I., Tseng, S. H., Cula, G. O., Bargo, P. R., and Kollias, N. (2009). Fluorescence spectroscopy for endogenous porphyrins in human facial skin. Photo. Therap. Diagn. V:7161.
Stepp, H., and Stummer, W. (2018). 5-ala in the management of malignant glioma. Lasers Surg. Med. 50, 399–419. doi: 10.1002/lsm.22933
Stummer, W., Pichlmeier, U., Meinel, T., Wiestler, O. D., Zanella, F., Reulen, H. J., et al. (2006). Fluorescence-guided surgery with 5-Aminolevulinic acid for resection of malignant glioma: a randomised controlled multicentre phase iii trial. Lancet Oncol. 7, 392–401. doi: 10.1016/S1470-2045(06)70665-9
Stummer, W., Stepp, H., Moller, G., Ehrhardt, A., Leonhard, M., and Reulen, H. J. (1998). Technical principles for Protoporphyrin-ix-fluorescence guided microsurgical resection of malignant glioma tissue. Acta Neurochir. 140, 995–1000. doi: 10.1007/s007010050206
Stummer, W., Stepp, H., Wiestler, O. D., and Pichlmeier, U. (2017). Randomized, prospective double-blinded study comparing 3 different doses of 5-Aminolevulinic acid for fluorescence-guided resections of malignant gliomas. Neurosurgery 81, 230–239. doi: 10.1093/neuros/nyx074
Stummer, W., and Suero Molina, E. (2017). Fluorescence imaging/agents in tumor resection. Neurosurg. Clin. N. Am. 28, 569–583. doi: 10.1016/j.nec.2017.05.009
Suero Molina, E., Black, D., Kaneko, S., Muther, M., and Stummer, W. (2022). Double dose of 5-Aminolevulinic acid and its effect on Protoporphyrin ix accumulation in low-grade glioma. J. Neurosurg. 134, 1–10.
Suero Molina, E., Kaneko, S., Black, D., and Stummer, W. (2021). 5-Aminolevulinic acid-induced porphyrin contents in various brain tumors: implications regarding imaging device design and their validation. Neurosurgery 89, 1132–1140. doi: 10.1093/neuros/nyab361
Suero Molina, E., Stogbauer, L., Jeibmann, A., Warneke, N., and Stummer, W. (2020). Validating a new generation filter system for visualizing 5-ala-induced Ppix fluorescence in malignant glioma surgery: a proof of principle study. Acta Neurochir. 162, 785–793. doi: 10.1007/s00701-020-04227-7
Valdes, P. A., Angelo, J. P., Choi, H. S., and Gioux, S. (2017). Qf-Ssop: real-time optical property corrected fluorescence imaging. Biomed. Opt. Express 8, 3597–3605. doi: 10.1364/BOE.8.003597
Valdes, P. A., Leblond, F., Kim, A., Wilson, B. C., Paulsen, K. D., and Roberts, D. W. (2012). A spectrally constrained dual-band normalization technique for Protoporphyrin ix quantification in fluorescence-guided surgery. Opt. Lett. 37, 1817–1819. doi: 10.1364/OL.37.001817
Valdes, P. A., Samkoe, K., O'hara, J. A., Roberts, D. W., Paulsen, K. D., and Pogue, B. W. (2010). Deferoxamine Iron chelation increases Delta-Aminolevulinic acid induced Protoporphyrin ix in xenograft glioma model. Photochem. Photobiol. 86, 471–475. doi: 10.1111/j.1751-1097.2009.00664.x
Keywords: 5-ALA, fluorescence-guided resection, autofluorescence, PpIX photo-states, hyperspectral imaging
Citation: Suero Molina E, Black D, Walke A, Azemi G, D’Alessandro F, König S and Stummer W (2023) Unraveling the blue shift in porphyrin fluorescence in glioma: The 620 nm peak and its potential significance in tumor biology. Front. Neurosci. 17:1261679. doi: 10.3389/fnins.2023.1261679
Edited by:
Bruno Montcel, Université de Lyon, FranceReviewed by:
Arthur Gautheron, Université Jean Monnet, FranceNeda Haj-Hosseini, Linköping University, Sweden
Copyright © 2023 Suero Molina, Black, Walke, Azemi, D’Alessandro, König and Stummer. This is an open-access article distributed under the terms of the Creative Commons Attribution License (CC BY). The use, distribution or reproduction in other forums is permitted, provided the original author(s) and the copyright owner(s) are credited and that the original publication in this journal is cited, in accordance with accepted academic practice. No use, distribution or reproduction is permitted which does not comply with these terms.
*Correspondence: Eric Suero Molina, eric.suero@ukmuenster.de