 Sanjib Mukherjee1,2
 Khurshed Katki1,2
 Gabriel M. Arisi1,2 Maira L. Foresti1,2
 Lee A. Shapiro1,2,3,4,5*
- 1 Neuroscience Research Institute, Scott & White Hospital, Temple, TX, USA
- 2 Central Texas Veterans Health System, Temple, TX, USA
- 3 Department of Surgery, College of Medicine, Texas A&M Health Science Center, Temple, TX, USA
- 4 Department of Neurosurgery, College of Medicine, Texas A&M Health Science Center, Temple, TX, USA
- 5 Department of Neuroscience and Experimental Therapeutics, College of Medicine, Texas A&M Health Science Center, Temple, TX, USA
Annually, more than a million persons experience traumatic brain injury (TBI) in the US and a substantial proportion of this population develop debilitating neurological disorders, such as, paralysis, cognitive deficits, and epilepsy. Despite the long-standing knowledge of the risks associated with TBI, no effective biomarkers or interventions exist. Recent evidence suggests a role for inflammatory modulators in TBI-induced neurological impairments. Current technological advances allow for the simultaneous analysis of the precise spatial and temporal expression patterns of numerous proteins in single samples which ultimately can lead to the development of novel treatments. Thus, the present study examined 23 different cytokines, including chemokines, in the ipsi and contralateral cerebral cortex of rats at 24 h after a fluid percussion injury (FPI). Furthermore, the estimation of cytokines were performed in a newly developed multiplex assay instrument, MAGPIX (Luminex Corp), and compared with an established instrument, Bio-Plex (Bio-Rad), in order to validate the newly developed instrument. The results show numerous inflammatory changes in the ipsi and contralateral side after FPI that were consistently reported by both technologies.
Introduction
It has been estimated that between one and two million persons in the United States are subjected to traumatic brain injury (TBI) each year and that approximately 230,000 are hospitalized (Dempsey et al., 2009). There are more than 50,000 deaths from TBI annually. These figures do not include the often devastating injuries to the members of the armed forces, the number and severity of which represent classified information. Furthermore, data from the Center for Disease Control and Prevention have provided the estimate that more than 80,000 Americans develop long-term disability related to TBI each year and that 3.2 million individuals in the USA are living with such disabilities, not including the military veterans. Therefore, it is of great importance to better understand the underlying mechanisms of this type of neuropathology. It is known that neuroinflammatory cascades are initiated following TBI (Pleines et al., 2001) and there are scant reports that inhibiting neuroinflammation following TBI may improve functional outcomes (Chen et al., 2008; Harting et al., 2008). Because of the complex milieu of inflammatory proteins, systematic estimation of cytokine expressions is of vital importance. This is magnified by the fact that some inflammatory proteins can be both, beneficial and detrimental, depending on when and where they are released, as well as their relative concentration within the overall milieu of the inflammatory proteins. Thus, describing the precise temporal and spatial expression patterns of inflammatory proteins after TBI can lead to improved diagnosis and treatment.
Cytokines, including chemokines, play a critical role in mediating inflammation. Although altered levels of various cytokines were reported 24 h after TBI-induced in the lateral fluid percussion injury (FPI) model (Knoblach and Faden, 2000), a comprehensive analysis of proinflammatory and anti-inflammatory proteins after FPI is lacking in the field. The optimum method to detect the level of different cytokines in the brain would be using a multiplex assay instrument. Simultaneous estimation of multiple analytes in biological samples using multiplex assay technology has recently become a powerful technique in research and clinical laboratories (Kingsmore, 2006; Ellington et al., 2010). However, the availability of multiplex assay data from brain analysis is relatively limited. Estimation of a single analyte, using traditional immunosorbent assays has been used for more than five decades. However, detection of several analytes using monoplex immunoassay such as enzyme-linked immunosorbent assay (ELISA) has several shortcomings. These include: the requirement of large volumes of sample, lengthy time period for detection, as well as being labor intensive and relatively expensive. Multiplex assay uses the same principle of ELISA but overcomes single analyte limitations.
The basic multiplex assay method uses protein, peptide, or antibodies to tag individual analytes in the biological tissue samples (Ellington et al., 2010) and is subsequently detected by using different labeled reporter ligands. Alternate methods of label-free detection technologies are also available, such as, detection technologies based on piezoelectric acoustic sensors (Luo et al., 2006) and spinning-disk microinterferometry (Varma et al., 2004).
Based on the dimensions of the reactive space, multiplex immunoassay systems are primarily classified as planar assays and suspension microsphere assays. The mini-immunoassay in the two dimensional planar assays, gives better lower limit of quantification because of lower signal to noise ratio and shorter diffusion time compare to traditional immunoassay (Ekins, 1989). The three dimensional suspension multiplexes use microspheres which act as a solid support to which captured ligands are attached. The fluid-phase kinetics of suspension arrays are faster than the solid-phase kinetics of planar arrays. In addition, other advantages of suspension arrays are custom multiplex assays and greater precision due to measurements of hundreds of beads for each analyte (Kingsmore, 2006). The established solution-based formats, however, require specialized flow cytometry equipment for sample analysis, lasers to excite the reporting ligand and associated optics to measure the biochemical reactions that occur on the surface of the microspheres. Additionally, it also uses a digital signal processor that manages the fluorescent intensity depending on the concentration of the analytes present in the tissue.
Recently, a new detection technology was developed where light emitting diodes (LEDs) are used instead of laser, for identifying beads and for exciting the reporting ligand. The resultant fluorescent signal is captured by charged coupled device (CCD) imager. The concentration of the analytes in the biological sample is then reported by the software, depending on the fluorescent intensity in the sample. The introduction of this new detection technology demands validation of this technique with respect to traditional laser excitation and digital signal processing. Although CCD imaging technology for the multiplex assay was recently used to measure the chemiluminescence from ELISA to detect six analytes in the human sera (Urbanowska et al., 2006), no studies have directly compared multiplex assay results obtained from laser and digital signal processors with the newer, LED and CCD image analysis.
This study aimed at determining the cortical level of 23 cytokines, on the ipsilateral and contralateral cortex, 24 h after FPI. Additionally, it also aimed at comparing cytokine levels from identical samples across two distinct multiplex assays. The results demonstrate that FPI results in modulation of cytokines in the cortex and that the data generated by the two different multiplex assay instruments are very similar.
Materials and Methods
All experimental protocols were approved by the Institutional Animal Care Committee (IACUC) of Texas A&M University, Health Science Center and Scott & White hospital. Animals were initially housed 2 per cage and singly after surgery with a 12-h light–dark cycle (light on 6:00 and light off 18:00). All animals had continuous access to food and water. Twenty male Sprague Dawley rats, 9–10 weeks of age and weighing between 275 to 310 g were used in this study. Rats were randomly assigned to either the experimental group or the sham group, so that each group had 10 rats.
Rats were initially anesthetized with 4% isoflurane and oxygen for anesthesia induction and later the concentration of isoflurane was reduced to 2% for maintenance. Once under anesthesia, the heads of the animals were shaved. Strict sterile technique was maintained during surgical procedures. Animals were placed in a stereotaxic instrument (Stoelting, Illinois) and a 2-mm burr hole was drilled on the skull over the left parietal cortex, at 2 mm posterior and 3 mm lateral from the bregma, as previously described (D’Ambrosio et al., 2004). A female Luer-Lok cannula was then secured to the skull with dental cement (PlasticOne). The animals were connected to the fluid percussion instrument (custom design and fabrication from the radiology department from VCU, Model 01-B) via the Luer-Lok. A single 4–4.25 atm pressure pulse was delivered, with a duration of 18–20 ms, as measured by a digital Oscilloscope (Tenma model # 728395), connected to a signal transducer hooked in-line between the fluid percussion cylinder and the syringe. Sham animals were anesthetized and manipulated in an identical manner, but no pressure pulse from the fluid percussion instrument was delivered.
At 24 h after FPI or sham surgery, animals were deeply anesthetized with Euthasol (390 mg pentobarbital sodium and 50 mg phenytoin sodium i.p) as described previously (Foresti et al., 2009). Animals were decapitated, the brains rapidly removed and the ipsi and contralateral cortices, corresponding to cingulated, retrosplenial, primary and secondary visual cortex, and motor cortex, were dissected out and immediately frozen in liquid nitrogen.
Multiplex Assays
In order to quantify the analytes within the tissue, two distinct multiplex instruments were used, Bio-Plex200 and MAGPIX. Both instruments use “xMAP” technology based microspheres that enables detection of protein or nucleic acid concentrations of specific analytes. Whereas typical flow cytometry based assays identify a combination of different sizes and color intensity of microspheres, xMAP technology uses a fixed size microsphere (5.6 μ polystyrene or 6.45 μ magnetic microspheres). These microspheres are fluorescent–dyed and dually act as analyte identifier, as well as to provide a solid surface to build the assay. It should be noted that the analysis comparing both machines was performed using the same analytes and the same tissue homogenates.
While both the Bio-Plex and MAGPIX system use the same beads for analysis, the method of detection is different. Bio-Plex uses flow cytometry principle to quantify the analytes. This is accomplished by fluid flow to align beads single file through a cuvette. Dual lasers excite each bead and the fluorescence from the beads is measured with avalanche photodiodes (bead identification) and a photomultiplier tube (reporter signal). Alternatively, MAGPIX flows the magnetic beads with less fluid volume into a chamber, where they are held in a monolayer by a magnet, where the beads are imaged with a CCD camera. The software processes the image to deliver the assay results. Table 1 highlights the difference between Bio-Plex, MAGPIX, and traditional ELISA.
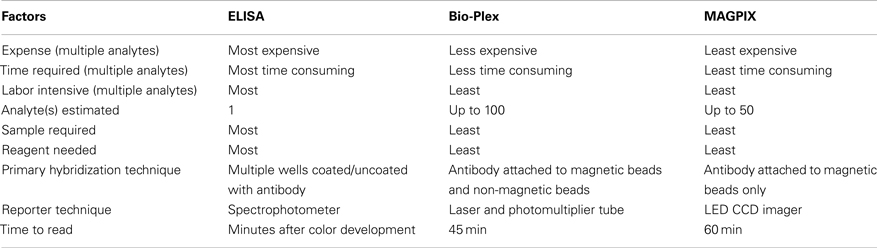
Table 1. Comparisons of traditional ELISA with two multiplexing methods.
Frozen tissue was homogenized following the manufacturer’s instructions (Milliplex MAP kit, Millipore) and 25 μl of undiluted homogenate was added to 25 ml of assay buffer. Then, 25 ml of magnetic beads (bead size = 6.45 μ) coated with specific antibodies (RCYTOMAG-80K-PMX, Milliplex MAP Kit, Millipore) was added to this solution and the reaction was incubated at 4°C for 24 h. Next, the beads were washed and incubated with 24 ml of biotinylated detection antibody at room temperature (RT) for 2 h. To complete the reaction 25 ml of Streptavidin–Phycoerythrin conjugate compound was added and allowed to incubate for 30 min at RT. The beads were then washed and incubated with 150 ml of sheath fluid for 5 min at RT.
The samples were analyzed first on the Bio-Plex and then on MAGPIX instruments. The detection systems in both machines are different. Bio-Plex, uses two lasers, the first to excite the internal dyes marking the microsphere set and the second laser excites the Streptavidin–Phycoerythrin conjugate on the reporter molecule. A high-speed digital processor identifies each individual microsphere and quantifies the result based on fluorescent reporter signals. MAGPIX on the other hand, uses red LED instead of a laser to excite the dyes in the beads for identification of specific analytes and green LED to excite the reporter ligand. The acquisition of the fluorescent signal is achieved by a CCD imager. The concentration of the analytes is then determined by Bio-Plex Manager version 5.0 and MAGPIX xPONENT software, respectively. The assays were run in triplicate to confirm the results. Analytes were normalized to total protein concentration which was estimated with a Bradford assay, a colorimetric protein assay.
Twenty three analytes were studied: interleukin 1 alpha (IL-1α), interleukin 1 beta (IL-1β), interleukin-2 (IL-2), interleukin-4 (IL-4), interleukin-5 (IL-5), interleukin-6 (IL-6), interleukin-10 (IL-10), interleukin-12p70 (IL-12p70), interleukin-13 (IL-13), interleukin-17 (IL-17), interleukin-18 (IL-18), interferon gamma (IFN Γ) induced protein 10 (IP-10), chemokine C-C motif ligand 2 (CCL2, previously known as monocyte chemoattractant protein 1, MCP-1), chemokine C-C motif ligand 3 (CCL3, previously known as macrophage inflammatory protein 1 alpha, MIP 1α), chemokine C-C motif ligand 5 (CCL5, also known as Regulated upon Activation Normal T-cell Expressed, RANTES), tumor necrosis factor alpha (TNFα), vascular endothelial growth factor (VEGF), eotaxin, growth related oncogene KC (GRO KC), IFN Γ, leptin, granulocyte colony-stimulating factor (GCSF), and granulocyte-macrophage colony-stimulating factor (GMCSF).
Data Analysis
To determine the effect of FPI, ipsilateral, and contralateral cortical data from each machine were compared separately, using Student’s t-test. SPSS software (9.0) was used to perform the regression analysis and Microsoft excel (version 2007) was used for performing t-test. Datasets from MAGPIX and from Bio-Plex were compared using linear regression. One of the animals in the FPI group had a substantial hematoma and was excluded from the study, resulting in an n of 9 for FPI group, compared with n of 10 for the sham group.
Post Hoc ELISA Analysis of IL-10 and CCL3
In order to examine the possible differences in type 1 vs. type 2 error, the multiplex data generated from the two machines was further examined using a traditional ELISA for IL-10 (Ray Biotech Inc., ELR-IL-10) and CCL3 (Signosis, EA-3008). This analysis was performed using homogenates from the same rats as those used for the multiplex assays. A t-test was performed to analyze the data using Microsoft Excel (version 2007).
Results
Inflammatory Effects of FPI in the Ipsilateral Cortex
Fluid percussion injury resulted in significant alterations of cytokines in the ipsilateral cortex after 24 h (Figure 1). In most cases, the differences reported by both machines exhibited similar patterns and magnitudes of changes (Figure 1). More specifically, FPI resulted in a fourfold increase in CCL2 (p = 0.01 for Bio-Plex and MAGPIX; Figures 1A,C). Similarly, TNFα was significantly increased after FPI (p = 0.031 for Bio-Plex and p = 0.025 for MAGPIX; Figures 1B,D). A decrease in IL-1β was observed by both instruments (p = 0.006 for Bio-Plex and p = 0.012 for MAGPIX; Figures 1A,C). IFNΓ decreased in the data obtained from the Bio-Plex system (p = 0.03) and showed a trend toward decrease in the MAGPIX system (p = 0.089, NS; Figures 1B,D). On the other hand, IL-10 significantly decreased after FPI using the Bio-Plex system (p = 0.011; Figures 1A,C), but no significant difference was found using the MAGPIX. A trend toward increased CCL3 and IL-6 was observed using both instruments (p = 0.091 for Bio-Plex and p = 0.078 for MAGPIX) and (p = 0.072 for Bio-Plex and p = 0.067 for MAGPIX; Figures 1A,C), respectively. It should be further noted that for GCSF and VEGF, the multiplex instruments failed to report a value because the levels were below the detection threshold of both instruments. Therefore statistical analysis could not be performed in these cases.
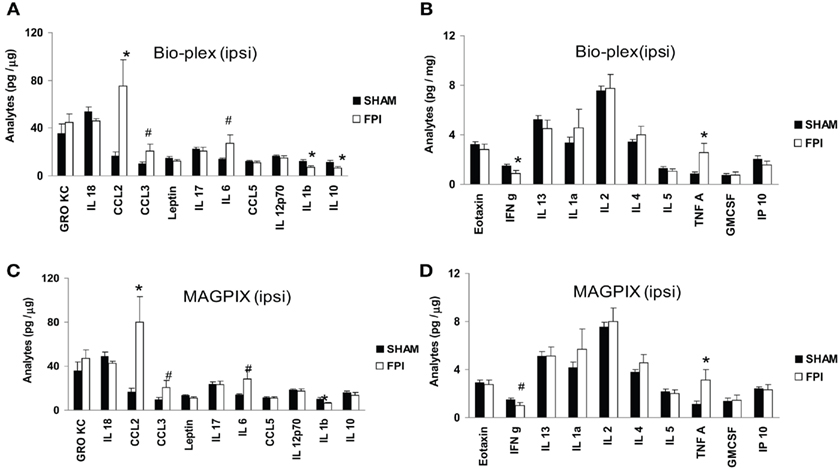
Figure 1. Effect of LFP on the ipsilateral cortex. (A,B) illustrate the results generated by the Bio-Plex instrument. (C,D) illustrate the results generated by the MAGPIX instrument. Black filled bars denote the value from sham group. The white bars denote the value from FPI group. Results were compared with Student’s t-test. Values: mean ± SEM; *p < 0.05 compared with sham group; # denotes trend toward significance. For details and p value, please see text.
Effect of FPI in the Contralateral Cortex
Similar to the ipsilateral cortex, a significant increase in CCL2 (p = 0.023 for Bio-Plex and p = 0.017 for MAGPIX) was observed in the contralateral cortex (Figures 2A,C). A significant increase in IL-18 (p = 0.023) both for Bio-Plex and MAGPIX also was observed after FPI (Figures 2A,C). CCL3 was significantly increased after FPI when analyzed with the Bio-Plex (p = 0.041), whereas the data obtained from MAGPIX were not significant (p = 0.12, NS; Figures 2A,C). A trend toward increased GRO KC (p = 0.073 for Bio-Plex and p = 0.072 for MAGPIX) and IL-1β (p = 0.084 for Bio-Plex and p = 0.069 for MAGPIX) was detected by both instruments Figures 2A,C). On the contrary, a trend toward decreased IL-17 (p = 0.087 for Bio-Plex and p = 0.081 for MAGPIX), IL-10 (p = 0.087 for Bio-Plex and p = 0.081 for MAGPIX), IL-5 (p = 0.089 for Bio-Plex and p = 0.073 for MAGPIX) and IP-10 (p = 0.089 for Bio-Plex and p = 0.061 for MAGPIX) was observed for both instruments (Figures 2A–D). A significant decrease in IFNΓ (p = 0.025 for Bio-Plex and p = 0.009 for MAGPIX) and GMCSF (p = 0.027 for Bio-Plex and p = 0.04 for MAGPIX) was observed after FPI (Figures 2B,D). A trend toward decreased IL-5 (p = 0.089 for Bio-Plex and p = 0.073 for MAGPIX) and IP-10 (p = 0.089 for Bio-Plex and p = 0.061 for MAGPIX) was also observed (Figures 2B,D).
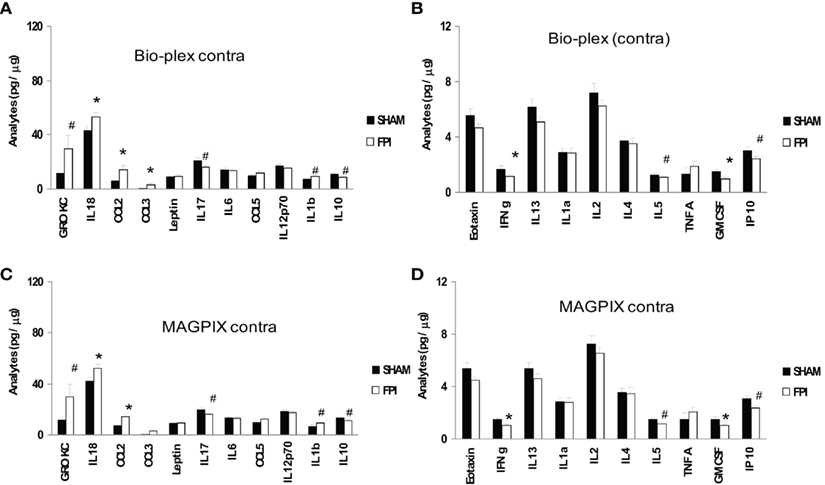
Figure 2. Effect of LFP on the contralateral cortex. (A,B) illustrate the data generated by the Bio-Plex instrument. (C,D) illustrate the results generated by MAGPIX instrument. Black filled bars denote the value from sham group. The white bars denote the value from LFP group. Results compared with Student’s t-test. Values: mean ± SEM; *p < 0.05 compared with sham group; # denotes trend toward the level of significance. For details and p value, please see text.
Because of the minor differences in the detection of IL-10 (significantly decreased in the ipsilateral cortex in Bio-Plex data only) and CCL3 (significantly increased in Bio-Plex data only in the contralateral cortex only) between the two machines, a traditional ELISA was performed for these two analytes to clarify the discrepancy. Result from the ELISA showed that in the ipsilateral cortex, IL-10 was significantly decreased in the FPI animals (80.9 ± 7.7 in the sham animals vs. 57.5 ± 4.8 in the FPI animals, p = 0.02), consistent with the result from Bio-Plex. Similarly, analysis of CCL3 using ELISA showed that FPI resulted in a significant increase in CCL3 (3.0 ± 0.3 in the sham vs. 3.9 ± 0.3, p = 0.033) in the contralateral cortex. This result was also consistent with the Bio-Plex analysis. In addition, ELISA showed no significant differences in CCL3 (3.0 ± 0.3 in the sham vs. 15.6 ± 9.2 in the FPI, p = 0.19) in the ipsilateral cortex, consistent with both machines. Similarly, the ELISA data for IL-10 in the contralateral cortex were also consistent with both machines, where no significant differences were detected (51.8 ± 5.4 in sham vs. 51.1 ± 3.9).
Similar Results Using Two Distinct Types of Detection
MAGPIX and Bio-Plex instruments generated similar data when compared using linear regression analysis (Tables 2 and 3). The means of a particular analyte generated by the Bio-Plex matches very closely with that generated by MAGPIX, as indicated by similar means and significant R2 values. Only, IL-5 and IFNΓ in contralateral FPI group showed relatively low regression values (R2 ∼ 0.45), despite the fact that the MAGPIX and Bio-Plex have almost identical means in these groups.
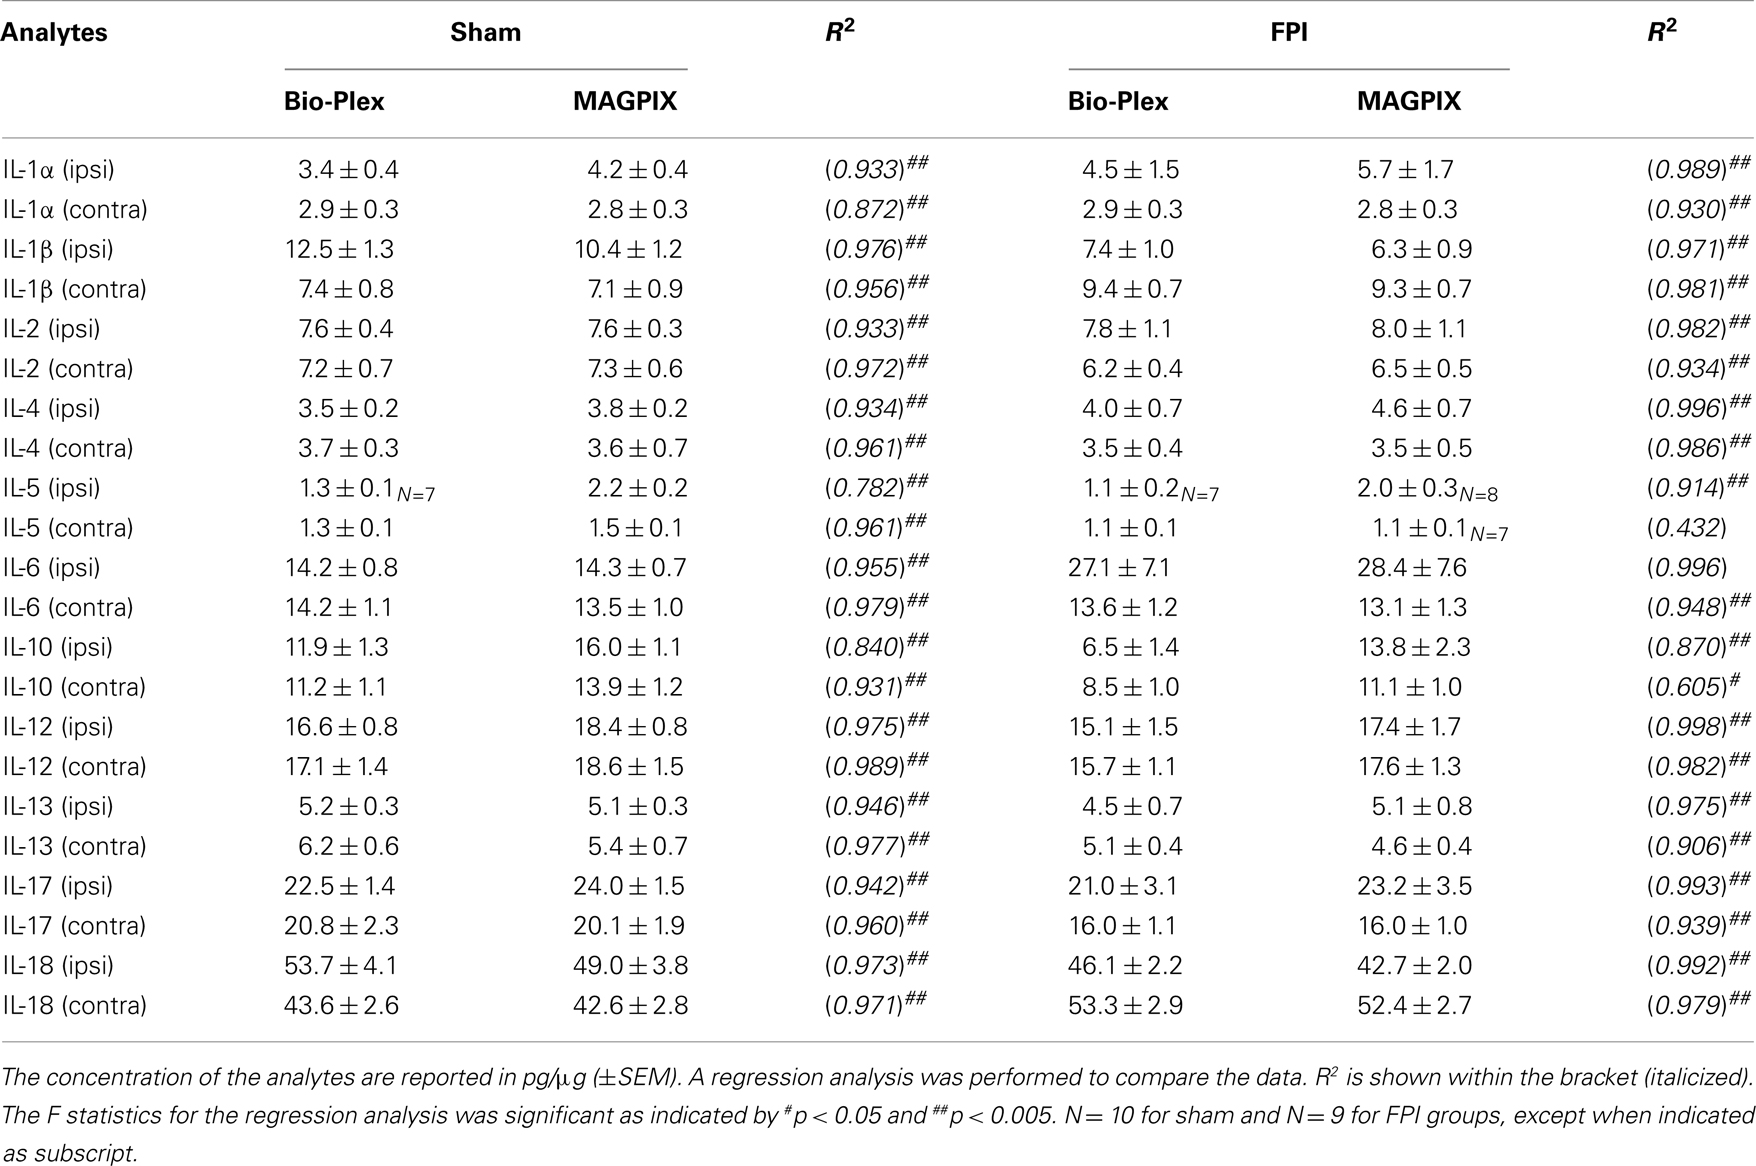
Table 2. Comparison of the level of analytes in the cortex detected by Bio-Plex vs. MAGPIX 24 h after FPI.
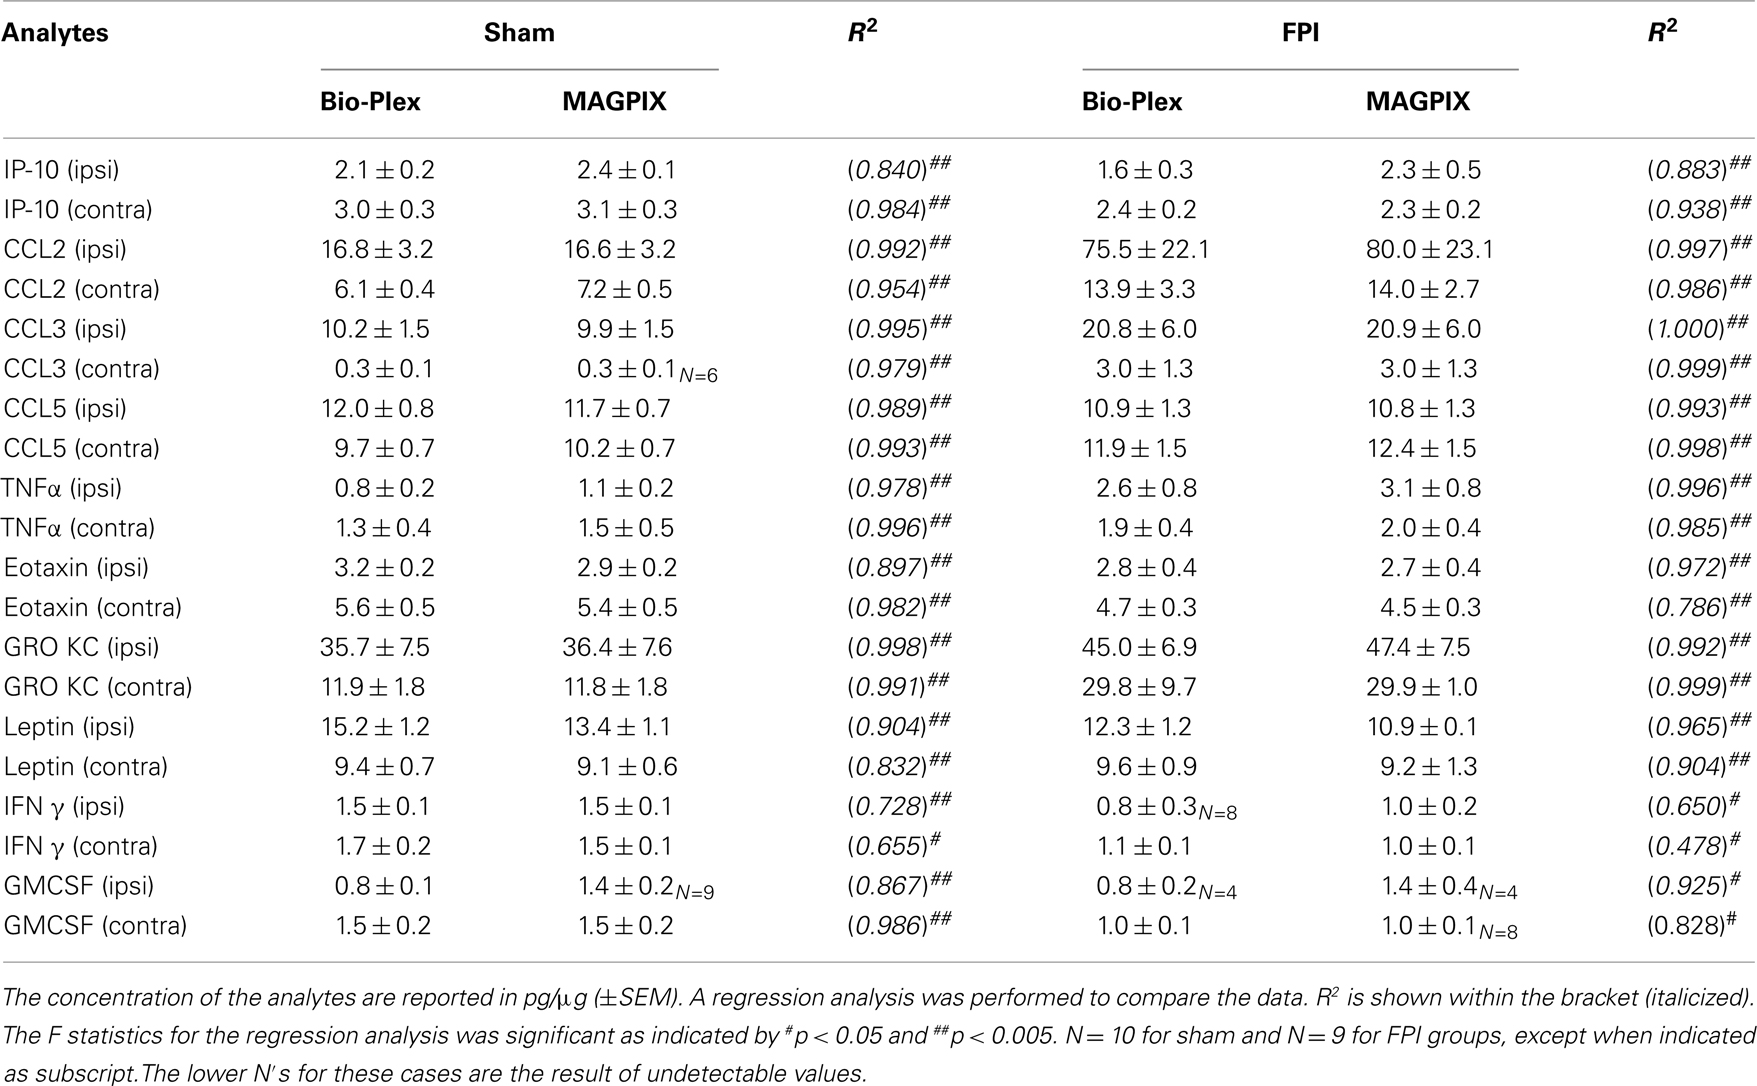
Table 3. Comparison of the level of analytes in the cortex detected by Bio-Plex vs. MAGPIX 24 h after FPI.
Discussion
The present study demonstrates that data obtained using newer LED and CCD technology (MAGPIX) is consistent with data obtained using more established laser and flow cytometry technology (Bio-Plex). In addition, when examining the patterns of changes in the ipsi and contralateral side, both machines similarly reported significant differences when comparing sham animals to FPI animals.
The Bio-Plex Manager software extrapolates data out of the standard curve to provide a value, whereas the MAGPIX uses a more stringent algorithm and does not report values at the extreme low-end of the detection spectrum. In the context of low detection concentrations, the Bio-Plex employs a more lenient algorithm system which could lend itself to type I errors. Alternatively, the MAGPIX instrument employs a more stringent algorithm and is more prone to type II errors. The fact that significant differences were detected by the Bio-Plex system for two of the analytes, CCL3 and IL-10, but not by the MAGPIX system supports the idea of type I vs. type II errors, respectively. The results from subsequent comparisons using ELISA were consistent with the data generated by the Bio-Plex system (Table 4). Despite these two exceptions, both machines provide detection technology that is sensitive enough to reliably detect analytes in the range of pg/μg of protein in brain samples. Therefore, both machines are highly adept at detecting small, albeit significant alterations to the inflammatory milieu. Such technology can lead to very precise treatment paradigms against specific inflammatory targets following brain injury.
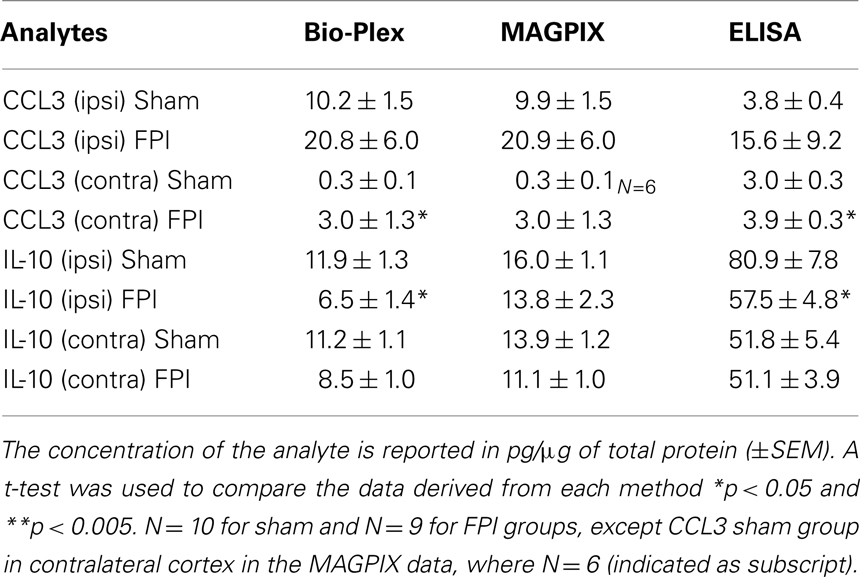
Table 4. Effects of FPI on the cortical levels of IL-10 and CCL3 as detected by Bio-Plex, MAGPIX, and traditional ELISA 24 h after FPI.
It should be noted that in addition to the differences in detection technology, both machines offer other distinctions that might be of interest to the end-user. For example, the MAGPIX system is cheaper to purchase and to maintain, but is limited to simultaneous analysis of a maximum of 50 analytes. Alternatively, the Bio-Plex system is capable of simultaneous analysis of up to 100 analytes. A recent comparison (Fu et al., 2010) between five different multiplex assay systems, but not including the MAGPIX system, concluded that Bio-Plex system was the most ideal for quantification. The current study shows that the MAGPIX provides data of equal reliability.
There are large gaps in our knowledge of the precise inflammatory response following brain injury. Certainly, these gaps will narrow as newer technology makes proteomic analysis more efficient and cost–effective. The present study demonstrates alteration of several cytokines 24 h after FPI. For example, a significant elevation of CCL2 was observed in both ipsilateral and contralateral cortex after FPI. CCL2 plays a crucial role in promotion of macrophage infiltration in damaged brain parenchyma and is observed to be increased in the cerebrospinal fluid (CSF) of human TBI patients for 10 days after injury (Semple et al., 2010). CCL2 and its receptor, CCR2, have been observed to be expressed in astrocytes and reactive microglia after experimental brain injury and seizures (Glabinski et al., 1996; Gourmala et al., 1997; Foresti et al., 2009). Considering that CCL2 is often used as a general marker for inflammation (Conductier et al., 2010), it is quite clear that brain injury results in a rapid and robust inflammatory response. Indeed, CCL2 also may be involved in mediating some of the secondary effects of brain injuries (Semple et al., 2010).
Conclusion
The results show that two distinct methods of multiplex assay consistently report cytokine levels with a high degree of sensitivity. The use of these technologies allows for large-scale proteomic analysis of the inflammatory response in the brain. Such technology can pave the way for future therapeutic interventions. In the context of brain injury, many cytokines were altered 24 h after FPI, but future studies are needed in multiple brain regions and at multiple time points after injury to elucidate its exact mechanisms and consequences.
Conflict of Interest Statement
The authors received discounted cytokine kits for analysis from Millipore. In addition, Luminex lent us the Magpix system for which the MAGPIX analysis was performed.
Acknowledgments
We are grateful for the support from Scott & White Hospital (RGP # 90347). We are thankful for the technical assistance and support from Amanda Ruch. We are also grateful to Luminex for providing the MAGPIX system for comparison with our Bio-Plex (Bio-Rad) system and to Millipore for assistance with the 23-plex inflammation kit. This material is the result of work supported with resources and the use of facilities at the Central Texas Veterans Health Care System, Temple, Texas.
References
Chen, S. F., Hsu, C. W., Huang, W. H., and Wang, J. Y. (2008). Post-injury baicalein improves histological and functional outcomes and reduces inflammatory cytokines after experimental traumatic brain injury. Br. J. Pharmacol. 155, 1279–1296.
Conductier, G., Blondeau, N., Guyon, A., Nahon, J. L., and Rovère, C. (2010). The role of monocyte chemoattractant protein MCP1/CCL2 in neuroinflammatory diseases. J. Neuroimmunol. 224, 93–100.
D’Ambrosio, R., Fairbanks, J. P., Fender, J. S., Born, D. E., Doyle, D., and Miller, J. W. (2004). Posttraumatic epilepsy following fluid percussion injury in the rat. Brain 127, 304–314.
Dempsey, K. E., Dorlac, W. C., Martin, K., Fang, R., Fox, C., Bennett, B., Williams, K., and Flaherty, S. (2009). Landstuhl Regional Medical Center: traumatic brain injury screening program. J. Trauma Nurs. 16, 6–7; 10–12.
Ellington, A. A., kullo, I. J., Bailey, K. R., and Klee, G. G. (2010). Antibody-based protein multiplex platforms: technical and operational challenges. Clin. Chem. 56, 186–193.
Foresti, M. L., Arisi, G., Katki, K., Montanez, A., Sanchez, R. M., and Shapiro, L. A. (2009). Chemokine CCL2 and it’s receptor CCR2 are increased in the hippocampus following pilocarpine-induced status epilepticus. J. Neuroinflammation 6, 40–50.
Fu, Q., Zhu, J., and Van Eyk, J. E. (2010). Comparison of multiplex immunoassay platforms. Clin. Chem. 56, 314–318.
Glabinski, A. R., Balasingam, V., Tani, M., Kunkel, S. L., Strieter, R. M., Yong, V. W., and Ransohoff, R. M. (1996). Chemokine monocyte chemoattractant protein-1 is expressed by astrocytes after mechanical injury to the brain. J. Immunol. 156, 4363–4368.
Gourmala, N. G., Buttini, M., Limonta, S., Sauter, A., and Boddeke, H. W. (1997). Differential and time-dependent expression of monocyte chemoattractant protein-1 mRNA by astrocytes and macrophages in rat brain: effects of ischemia and peripheral lipopolysaccharide administration. J. Neuroimmunol. 74, 35–44.
Harting, M. T., Jimenez, F., Adams, S. D., Mercer, D. W., and Coxm, C. S. Jr. (2008). Acute, regional inflammatory response after traumatic brain injury: implications for cellular therapy. Surgery 144, 803–813.
Kingsmore, S. F. (2006). Multiplexed protein measurement: technologies and applications of protein and antibody arrays. Nat. Rev. Drug Discov. 5, 310–321.
Knoblach, S. M., and Faden, A. (2000). Cortical interleukin-1b elevation after traumatic brain injury in therat: no effect of two selective antagonists on motor recovery. Neurosci. Lett. 289, 5–8.
Luo, Y., Chen, M., Wen, Q., Zhao, M., Zhang, B., Li, X., Wang, F., Huang, Q., Yao, C., Jiang, T., Cai, G., and Fu, W. (2006). Rapid and simultaneous quantification of 4 urinary proteins by piezoelectric quartz crystal microbalance immunosensor array. Clin. Chem. 52, 2273–2280.
Pleines, U. E., Morganti-Kossmann, M. C., Rancan, M., Joller, H., Trentz, O., and Kossmann, T. (2001). S-100β reflects the extent of injury and outcome, whereas neuronal specific enolase is a better indicator of neuroinflammation in patients with severe traumatic brain injury. J. Neurotrauma 18, 491–498.
Semple, B. D., Bye, N., Rancan, M., Ziebell, J. M., and Morganti-Kossmann, M. C. (2010). Role of CCL2 (MCP-1) in traumatic brain injury (TBI): evidence from severe TBI patients and CCL2 -/- mice. J. Cereb. Blood Flow Metab. 30, 769–782.
Urbanowska, T., Mangialaio, S., Zickler, C., Cheevapruk, S., Hasler, P., and Regenass, S. (2006). Legay F. Protein microarray platform for the multiplex analysis of biomarkers in human sera. J. Immunol. Methods 316, 1–7.
Keywords: cytokine, TBI, fluid percussion injury, multiplex assay
Citation: Mukherjee S, Katki K, Arisi GM, Foresti ML and Shapiro LA (2011) Early TBI-induced cytokine alterations are similarly detected by two distinct methods of multiplex assay. Front. Mol. Neurosci. 4:21. doi: 10.3389/fnmol.2011.00021
Received: 13 May 2011;
Paper pending published: 17 June 2011;
Accepted: 22 August 2011;
Published online: 16 September 2011.
Edited by:
Allan R. Jones, Allen Institute for Brain Science, USAReviewed by:
Ye He, University of California San Francisco, USASmita Jha, Baylor College of Medicine, USA
Copyright: © 2011 Mukherjee, Katki, Arisi, Foresti and Shapiro. This is an open-access article subject to a non-exclusive license between the authors and Frontiers Media SA, which permits use, distribution and reproduction in other forums, provided the original authors and source are credited and other Frontiers conditions are complied with.
*Correspondence: Lee A. Shapiro, College of Medicine, Texas A&M Health Science Center, Building 205, 1901 South 1st Street, Temple, TX 76504, USA. e-mail:bHNoYXBpcm9AbWVkaWNpbmUudGFtaHNjLmVkdQ==