 Gemma Navarro1
 Johannes Hradsky2
 Carmen Lluís1
 Vicent Casadó1
 Peter J. McCormick1
 Michael R. Kreutz2
 Marina Mikhaylova2*
- 1Faculty of Biology, Centro de Investigación Biomédica en Red Sobre Enfermedades Neurodegenerativas and Department of Biochemistry and Molecular Biology, University of Barcelona, Barcelona, Spain
- 2Research Group “Neuroplasticity”, Leibniz-Institute for Neurobiology, Magdeburg, Germany
Modulation of G protein-coupled receptor (GPCR) signaling by local changes in intracellular calcium concentration is an established function of Calmodulin (CaM) which is known to interact with many GPCRs. Less is known about the functional role of the closely related neuronal EF-hand Ca2+-sensor proteins that frequently associate with CaM targets with different functional outcome. In the present study we aimed to investigate if a target of CaM—the A2A adenosine receptor is able to associate with two other neuronal calcium binding proteins (nCaBPs), namely NCS-1 and caldendrin. Using bioluminescence resonance energy transfer (BRET) and co-immunoprecipitation experiments we show the existence of A2A—NCS-1 complexes in living cells whereas caldendrin did not associate with A2A receptors under the conditions tested. Interestingly, NCS-1 binding modulated downstream A2A receptor intracellular signaling in a Ca2+-dependent manner. Taken together this study provides further evidence that neuronal Ca2+-sensor proteins play an important role in modulation of GPCR signaling.
Introduction
Adenosine receptors belong to the GPCR family and have been classified on the basis of their molecular, biochemical, and pharmacological properties in four subtypes that are broadly distributed among different tissues including brain. The adenosine A2A receptor is a Gs coupled receptor (Kull et al., 2000; Vu, 2005) that modulates cAMP production mediated by adenylyl cyclase activation upon ligand binding. A2A receptors are particularly abundant in the basal ganglia and exhibit a somato-dendritic localization in GABAergic enkephalinergic neurons of the striatum (Schiffmann et al., 2007). However, they can also be found in several other brain regions including the olfactory bulb and hippocampus (Sebastião and Ribeiro, 2009). The current understanding of the role of A2A receptors in the brain emphasizes their ability to interact with GPCRs of other neuromodulatory or neurotransmitter systems, and to provide a fine tuning of neuronal activity (Sebastião and Ribeiro, 2009). A2A receptors mostly exist as either homodimers or heteromers (Canals et al., 2004; Sebastião and Ribeiro, 2009). A2A receptor activation facilitates opioid and CB1 receptor signaling in the striatum (Carriba et al., 2007; Sebastião and Ribeiro, 2009) and heterodimerization with the metabotropic glutamate receptor mGluR5 has a synergistic effect at the level of adenylate cyclase and MAPK activation upon A2A and mGluR5 receptor co-stimulation (Ferré et al., 2002; Nishi et al., 2005). The most studied receptor heteromer, however, is the heteromer of adenosine A2A and dopamine D2 receptor, where A2A receptors counteract D2 receptor activation (Ferré et al., 2008; Navarro et al., 2009).
We have previously reported the Ca2+-mediated modulation of the quaternary structure and function of A2A-D2 receptor heteromers (Navarro et al., 2009). Calmodulin (CaM) transduces a local change in Ca2+ concentrations to the receptor heteromer function via direct binding to the carboxy terminus of the A2A receptor in a A2A-D2 receptor heteromer, modulating thereby MAPK signaling upon agonist stimulation in a Ca2+-dependent manner (Navarro et al., 2009). The fine-tuning of other GPCRs via Ca2+/CaM interaction has been studied already in some detail (for review see Ferré et al., 2010; Mikhaylova et al., 2011). Interestingly, the third intracellular loop of many GPCRs is not only participating in binding of G proteins but also represents a motif that is predicted to bind CaM. Indeed CaM can interact in a Ca2+-sensitive manner with dopamine D2, μ opioid, muscarinergic, and other receptors (Ritter and Hall, 2009; Ferré et al., 2010). The functional consequences of the CaM interaction with GPCRs frequently include an attenuation of G protein coupling (Nickols et al., 2004; Ritter and Hall, 2009). Interaction of CaM with the carboxy-terminus has been demonstrated not only for the adenosine A2A receptor but for metabotropic glutamate receptors (mGluR5 and mGluR7) as well (Minakami et al., 1997; Nakajima et al., 1999; Ferré et al., 2010). However, interaction and modulation of GPCRs signaling is not an exclusive feature of CaM. Other calcium binding proteins from the CaM superfamily have been shown to interact with GPCRs directly or can attenuate receptor desensitization via association with the particular G protein-coupled receptor kinases (GRKs/Kabbani et al., 2002; Komolov et al., 2009). One of the classical examples is the interaction between the dopamine D2 receptor and NCS-1 where binding of NCS-1 to the cytoplasmic tail of the D2 receptor inhibits its phosphorylation and subsequent internalization after ligand binding (Kabbani et al., 2002). Therefore, it is conceivable that other calcium binding proteins from the CaM superfamily could also specifically interact with certain GPCRs. Evolutionary and historically the neuronal members of the CaM superfamily are divided into two large groups named neuronal calcium sensor proteins (NCS) and neuronal Calcium Binding proteins (nCaBPs/Mikhaylova et al., 2011). Both groups resemble the structure of their common ancestor (CaM) with four EF-hand Ca2+-binding motifs. However, not all EF-hands are able to bind Ca2+ ions although they still might be involved in protein-protein interactions. In the current study we aimed to investigate whether one of the most abundant and widely distributed members of the NCS group—NCS-1 (Burgoyne, 2007; Mikhaylova et al., 2011) and the founding member of the nCaBP group—caldendrin (Seidenbecher et al., 1998) are able to associate with the adenosine A2A receptor. All three proteins have overlap in their expression profiles and can be found in the same brain regions and the same type of neurons (Sebastião and Ribeiro, 1996; Martone et al., 1999; Laube et al., 2002; Bernstein et al., 2003; Rosin et al., 2003). To address this issue we implemented bioluminescence resonance energy transfer (BRET) and co-immunoprecipitation approaches and checked the functional role of the interaction by A2A receptor agonist induced MAPK and AKT signaling in co-transfected HEK293 cells.
Materials and Methods
cDNA Constructs and Antibodies
cDNA constructs encoding human adenosine A2A receptor (A2A in pEYFP-N1, A2A in pRluc-N1, and A2A in pGFP-2-N1 vectors) or human dopamine D2 receptor and CaM in pEYFP-N1 vector, were previously described (Navarro et al., 2009). NCS-1 in pEYFP-N1 vector was published previously (Zhao et al., 2001). NCS-1 in pTagRFP-N or pEGFP-N1 vectors was subcloned from the pNCS-1-YFP-N1 plasmid using XhoI and BamHI restriction sites. Caldendrin was subcloned from a caldendrin-EGFP-N1 plasmid (Dieterich et al., 2008) into a pEYFP-N1 vector using EcoRI and BamHI restriction sites. The identity of the newly cloned construct was confirmed by sequencing analysis. pEGFP-N1 (Clontech), pTagRFP-N (Evrogen, Moscow, Russia), and pcDNA3.1 (Invitrogen, Darmstadt, Germany) were used as a corresponding negative controls for co-immunoprecipitation experiments and in surface biotinylation studies.
The following primary antibodies were used: Anti-NCS-1 rabbit (Santa Cruz Biotechnology, Heidelberg, Germany), anti-GFP mouse (MMS-118R, HiSS Diagnostics, Freiburg, Germany), anti-Renilla Luciferase mouse (Millipore, Schwalbach, Germany), anti-phospho-ERK1/2 mouse (Sigma-Aldrich, Madrid, Spain), anti-ERK1/2 rabbit (Sigma-Aldrich, Madrid, Spain), and anti-phospho-AKT rabbit (SAB Signalway antibody, Madrid, Spain). The secondary antibodies were: goat anti-mouse immunoglobulins HRP conjugated (P0447, Dako, Hamburg, Germany), goat anti-rabbit IgG HRP conjugated (#7074, Cell Signaling, Frankfurt am Main, Germany), peroxidase-AffiniPure goat anti-mouse IgG, light chain* specific antibody (Jackson ImmunoResearch) and Alexa Fluor 568 goat anti-rabbit IgG (A11031, A11036, Invitrogen, Darmstadt, Germany).
Cell Culture and Transient Transfection
HEK293, HEK-293T cells, and COS-7 cells were grown in Dulbecco's modified Eagle's medium (DMEM) supplemented with 2 mM L-glutamine, 100 U/ml penicillin/streptomycin, and 5% (v/v) heat inactivated Fetal Bovine Serum (FBS) (Invitrogen, Paisley, Scotland, UK). For immunocytochemistry experiments HEK-293 and COS-7 cells were plated on 18 mm coverslips, grown for 24 h and then transfected with Lipofectamine 2000 (Invitrogen, Karlsruhe, Germany) according to the manufacturer's protocol. Twenty-four hours after transfection the cells were fixed with 4% paraformaldehyde (PFA) and processed for immunostaining as described below. For surface biotinylation experiments HEK293T cells were grown in 75 cm2 culture flasks and transfected with Polyfect (Qiagen) according to the manufacturer's protocol. HEK-293T cells for BRET experiments were transfected with the plasmids encoding CaM, NCS-1, caldendrin, and adenosine A2A receptor fusion proteins by PEI (PolyEthylenImine, Sigma, Steinheim, Germany) as previously described (Carriba et al., 2008).
Immunocytochemistry, Laser Scanning Microscopy, and Image Analysis
Coverslips with transfected HEK-293 and COS-7 were fixed with 4% PFA for 10 min at 37°C, extensively washed with PBS and immunostained for endogenous NCS-1 as described before (Mikhaylova et al., 2009) with anti-NCS-1 rabbit antibody in a dilution of 1:300. COS-7 cells transfected with A2A-Rluc construct were stained with anti-Renilla Luciferase mouse antibody in dilution 1:500. F-actin was stained with Alexa Fluor 568 phalloidin (Molecular probes, Life Technologies, Darmstadt, Germany) diluted in 1:1000 in PBS and incubated for 10 min at room temperature. Fluorescence images were obtained on a TCS SP5 II confocal laser scanning microscope (Leica, Germany) using a 63× oil objective and zoom factors in the range of 1–4×. A 405 laser line was used for visualizing DAPI staining, 488 for GFP/YFP, 568 for the Alexa 568, and TagRFP. Images were acquired as z-stacks with 0.3 μm z-step. Maximum projections of z-stack were created in the ImageJ program (ImageJ, NIH).
BRET Assays
HEK-293T cells were grown in six-well plates till about 60% confluence and then were transiently co-transfected with a constant amount of cDNA encoding for Rluc fusion protein and with increasing amounts of cDNA, corresponding to the protein fused to YFP. Two hours before quantifying fluorescence intensity, the supplemented medium (DMEM) was replaced by HBSS in the presence (1.26 mM) or in the absence of Ca2+. Cells supplemented with Ca2+ were treated with 1 μm of ionomycin 10 min prior to the fluorescence measurements. To quantify protein-YFP expression, cells (20 μg protein) were distributed in 96-well microplates (black plates with a transparent bottom), and fluorescence was read in a Mithras LB 940 using an excitation filter at 400 nm. Protein-fluorescence expression was determined as fluorescence of the sample minus the fluorescence of cells expressing the BRET donor alone. For BRET measurements, cell suspensions (20 μg protein) were distributed in 96-well microplates (Corning 3600, white plates; Sigma) and 5 μM coelenterazine H (Molecular Probes, Eugene, OR) was added. After 1 min, the readings were collected using a Mithras LB 940 that allows the integration of the signals detected in the short-wavelength filter at 485 nm (440–500 nm) and the long-wavelength filter at 530 nm (510–590 nm). To quantify protein-Rluc luminescence readings were also collected after 10 min of adding coelenterazine H. The net BRET is defined as [(long-wavelength emission)/(short-wavelength emission)]-Cf where Cf corresponds to [(long-wavelength emission)/(short-wavelength emission)] for the donor construct expressed alone in the same experiment. BRET is expressed as mili BRET units (mBU) determined as net BRET × 1000. A hyperbolic saturation curve showing an increase in BRET signal as a function of the acceptor fusion protein expression (acceptor protein expression relative to the donor protein expression, YFP/Rluc) is indicative of a specific interaction between the receptor-Rluc and Ca2+ sensor-YFP fusion constructs (Ayoub and Pfleger, 2010). BRET curves were fitted by using a non-linear regression equation, assuming a single phase with GraphPad Prism software (San Diego, CA, USA) to obtain the BRETmax and BRET50 values. The BRET50 parameter represents the acceptor/donor ratio giving 50% of the BRETmax and was used to estimate the relative affinity of the interaction. BRET data are expressed as means ± S.E.M. of 4–6 different experiments grouped as a function of the amount of BRET acceptor. Statistical differences in BRET parameters were analyzed with bifactorial ANOVA followed by post-hoc Bonferroni's tests (p = 0.05).
Co-Immunoprecipitation Assay (Co-IP) and Immunoblotting
Heterologous Co-IP was performed with extracts from HEK293T cells transiently expressing A2A-YFP, D2-YFP, GFP, and NCS-1-tagRFP. Endogenous NCS-1 was co-immunoprecipitated from HEK293T cells transfected only with A2A-YFP or GFP plasmids. YFP-tagged receptors and GFP control were immunoprecipitated for 12 h at 4°C with anti-GFP mouse antibody coupled to magnetic beads. Purification of antibody bound complexes was done using the μMACS™ GFP Isolation Kit (Miltenyi Biotec GmbH, Germany) according to the protocols supplied by manufactures, except that six washing steps were introduced to remove the unspecific binding to the beads. Another set of experiments was performed for A2A-YFP and GFP with overexpressed NCS-1-TagRFP. Extraction of proteins from HEK293T cells was done as described previously (Hradsky et al., 2011). NCS-1 was immunoprecipitated with anti-NCS-1 rabbit antibody coupled to Protein G sepharose (GE Healthcare) or corresponding rabbit IgG controls overnight at 4°C. In both cases, high Ca2+ and Ca2+-free conditions were achieved by addition of 0.5 mM of Ca2+ and 1 mM of Mg2+ or 2 mM EGTA and 1 mM Mg2+, respectively, to the cell extracts during immunoprecipitation as well as into the washing buffers. Beads with precipitated protein complexes were washed three times with corresponding extraction buffers and eluted with 2× SDS sample buffer. Eluted samples were checked on SDS-PAGE/WB using anti-NCS-1 and anti-GFP antibody. To measure the effect of Ca2+ on the efficiency of co-immunoprecipitation, the total amount of A2A receptor co-purified at different conditions was quantified using the “Gel Analyzer” plug-in provided in the ImageJ software (NIH, USA). The maximal binding observed with anti-NCS-1 antibody in the presence of Ca2+ was taken as 100% for each experiment individually and % deviations from this condition were measured for the other groups. Confidence interval was calculated and data were represented as averages of 4–5 independent experiments ± standard error mean (S.E.M).
Surface Biotinylation Assay
HEK293T cells overexpressing A2A-YFP alone or together with NCS-1-TagRFP and GFP control co-transfected with NCS-1-TagRFP were grown for 48 h in supplemented DMEM. Then growth medium was removed, cells were washed twice with HBSS and serum-free DMEM was added for another 2 h. Cells were labeled with Sulfo-NHS-SS-Biotin (Pierce) for 15 min at 4°C according to the manufacturers manual. Unbound biotin was sequestered and cells were harvested by scrapping, proteins were extracted with 1× TBS containing 1% Triton-X-100 over 1 h at 4°C. Equal amounts of extract were bound to Streptavidin beads (Life Technologies) and biotinylated proteins were eluted with 2× SDS and subjected to SDS-PAGE. A2A-YFP protein bands were detected with anti-GFP mouse antibody. NCS-1-TagRFP was visualized with anti-NCS-1 rabbit antibody on the same membrane. The efficiency of surface biotinylation for A2A–YFP in the presence or absence of NCS-1-TagRFP (n = 4) was quantified by measuring the optical densities of GFP signal as described above. Obtained values were compared between groups with and without overexpressed NCS-1 (the later one is taken as 100%). Statistical comparison was done with bifactorial ANOVA followed by post-hoc Bonferroni's tests.
MAPK and AKT Phosphorylation Assays
A detailed protocol for activation of adenosine A2A receptors in HEK293T cells by addition of the A2A receptor agonist CGS21680 (100 nM) has been described previously (Navarro et al., 2009). Briefly, HEK293T cells expressing A2A and NCS-1 or the corresponding controls were grown in 25 cm2 flasks to 50% confluence and cultured in serum-free medium overnight before the experiment. Two hours before the experiment, the cells medium was changed to HBSS buffer containing 1.26 mM Ca2+ and cells were treated or not with 1 μM ionomycin for 5 min before the addition of CGS21680. After cell lysis and estimation of protein concentration equal amounts of each sample (10 μg) were subjected to SDS-PAGE. To determine the level of ERK1/2 and pAKT phosphorylation, the membranes were then probed with a mouse anti-phospho-ERK1/2 antibody or phospho-AKT antibody. Total-ERK1/2 antibody was used as a loading control. The levels of phosphorylated ERK1/2 and phosphorylated AKT were normalized for differences in loading using the total ERK1/2 protein bands. Quantitative analysis of detected bands was performed by Odyssey V3.0 software. Statistical comparison was done with bifactorial ANOVA followed by post-hoc Bonferroni's tests (*p = 0.05).
Results
Molecular Interactions Between Adenosine A2A Receptor and Calcium Sensor Proteins in Living Cells
The BRET technique can be successfully used as a method to test a protein—protein interaction in living cells (De and Gambhir, 2005; Carriba et al., 2008). Particularly, previously reported direct binding between the carboxy terminus of the A2A receptor and CaM (Woods et al., 2008) was verified and extensively characterized using BRET (Navarro et al., 2009). This method is based on the fact that a luminescent donor (Rluc) oxidates the substrate coelenterazine H emitting bioluminescence that can be transferred to a fluorescent acceptor (YFP) when the distance between the donor and the acceptor is about 4.4 nm, (Dacres et al., 2010)—a typical distance between proteins interacting in a macro complex. The advantage of the BRET technique over classical techniques like co-immunoprecipitation is that it is performed in living cells and the protein concentrations of each protein can be carefully controlled with the interaction monitored over a range of protein concentrations and ratios. We have chosen BRET to test if the A2A receptor is capable of forming a complex with other members of the CaM superfamily, namely NCS-1 and caldendrin. We compared the BRET efficiency between HEK293T cells co-expressing A2A fused to Renilla luciferase (Rluc) and CaM, NCS-1 or caldendrin fused to YFP (Figures 1A–C). In agreement with our previous findings, the saturation curve obtained upon increasing CaM-YFP expression, indicated a specific interaction between CaM and A2A (BRETmax 60 ± 7 mBU and BRET50 41 ± 6). BRET occurred already at resting conditions but BRETmax was increased (p = 0.05) after 10 min of stimulation with 1 μM of ionomycin (BRETmax 78 ± 7 and BRET50 48 ± 8/Figure 1A). Interestingly, a clear and saturable BRET signal was also observed when increasing amounts of NCS-1-YFP were co-expressed with a constant amount of A2A-Rluc (BRETmax 43 ± 4 mBU and BRET50 11 ± 5, Figure 1B) again demonstrating a specific interaction. Elevation of intracellular Ca2+ concentration by preincubation of HEK293T cells with ionomycin (1 μM) for 10 min, increased (p = 0.05) both BRETmax (57 ± 6 mBU) and BRET50 (33 ± 9/Figure 1B). These results can be interpreted in two ways, neither of which is exclusive of the other. In one, Ca2+ led to conformational changes in the A2A-NCS-1 complex that reduces the distance between Rluc and YFP fused to the C-terminal domain of the two interacting fusion proteins. In the other, Ca2+ increases complex formation by increasing the affinity between the two proteins.
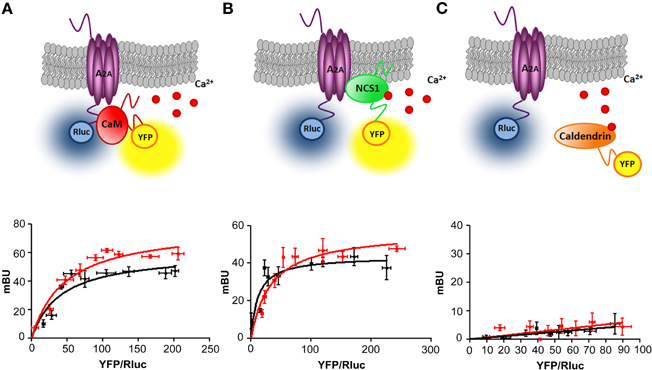
Figure 1. Adenosine A2A receptors interact with calmodulin and NCS-1 but not with caldendrin. BRET measurements were performed in HEK-293T cells co-transfected with 0.2 μg cDNA corresponding to the donor A2A-Rluc and increasing amounts of the cDNA (0.1–2 μg) corresponding to CaM-YFP (A), NCS-1-YFP (B) or caldendrin-YFP (C). In A and B a clear BRET saturation curves were seen. Both interactions occur at basal Ca2+ levels (black curve) but can be facilitated in the presence of Ca2+/ionomycin (red curve). No positive BRET interaction was seen for A2A-Rluc and caldendrin-YFP at either Ca2+ concentrations (C). Both fluorescence and luminescence of each sample were measured before every experiment to confirm similar donor expression (approximately 100,000 bioluminescence units) while monitoring the increase in acceptor expression (1000–35,000 fluorescence units). The relative amount of BRET is given as a function of 100× the ratio between the fluorescence of the acceptor (YFP) and the luciferase activity of the donor (Rluc). Average of 5–6 independent experiments measured in triplicates are plotted as mean value ± S.E.M. At the top images a schematic representation of BRET is given.
Next we investigated if A2A and caldendrin can form heteromers. A non-specific (linear) and low BRET signal was obtained in this case, a result consistent with two proteins not interacting (Figure 1C). An increase in intracellular Ca2+ levels had no effect on BRET efficiency either. Taken together these results suggest that caldendrin might not be an interaction partner of the A2A receptor and that not all EF-hand proteins produce a BRET signal indicative of an interaction.
To get more insight in this, we performed co-immunoprecipitation experiments with transfected HEK293T cells. Interestingly, we found that NCS-1 is expressed endogenously in this cell line (Figures 2A,B). Immunostaining with anti-NCS-1 antibody showed an extranuclear punctate pattern as expected for a N-terminal myristoylated protein that exhibits membrane localization. The co-localization between endogenous NCS-1 and overexpressed A2A-YFP was mostly restricted to the cell periphery (Figure 2A). We then performed co-immunoprecipitation experiments with HEK293T cells co-transfected with A2A-YFP and NCS-1-TagRFP or the corresponding control contructs (Figure 2C). Dopamine D2 receptor (D2-YFP) was included as a positive control since its interaction with NCS-1 is well established (Kabbani et al., 2002; Lian et al., 2011). The mouse anti-GFP antibody led to immunoprecipitation of receptor-YFP in complex with overexpressed (Figure 2C) or endogenous (Figure 2D) NCS-1. In the case of overexpression, the binding of NCS-1 to D2 and A2A receptors already occurred in the presence of EGTA (Figure 2C). Immunoprecipitation of overexpressed and endogenous NCS-1 with rabbit anti-NCS-1 bound to Protein G sepharose have shown that A2A-YFP was efficiently co-purified with NCS-1-TagRFP (Figure 2E). The corresponding controls with unspecific rabbit IgG showed again some unspecific binding of N-myristoylated NCS-1 to the beads but it was significantly lower as compared to immunoprecipitations done with the anti-NCS-1 antibody (Figures 2E,F). Interestingly, analogous to the BRET experiments the presence Ca2+ had a positive effect on the interaction (Figures 2D,E and F) and mostly a homomeric A2A-YFP receptor formed a complex with NCS-1 (Figure 2E).
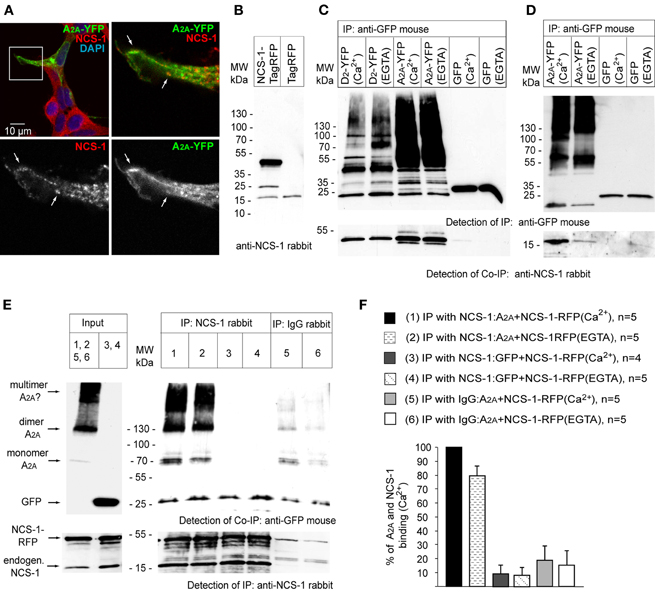
Figure 2. Adenosine A2A receptors form a complex with endogenous and the overexpressed NCS-1 in co-immunoprecipitation experiments. HEK293 cells express endogenous NCS-1 (A) that shows partial co-localization with overexpressed adenosine A2A receptor at the plasma membrane of transfected cells (low panel, white arrows indicate the co-localizing spots). (B) HEK293T cell transfected with NCS-1-TagRFP or Tag-RFP probed with anti-NCS-1 rabbit antibody. NCS-1-TagRFP band can bee seen in the range of 45 kDa. Note a weak 18 kDa band of endogenous NCS-1 present in both samples. Additional band about 25 kDa in the first lane could be a degradation product of NCS-1-TagRFP. (C) Overexpressed A2A-YFP and NCS-1-TagRFP can be co-immunoprecipitated from HEK293T cell extract. Dopamine D2 receptor with YFP-tag is included as a positive control. YFP-fused receptors or GFP control were detected with anti-GFP mouse antibody, detection of NCS-1-TagRFP was done with anti-NCS-1 rabbit antibody. (D) Endogenous NCS-1 is co-immunoprecipitated with A2A-YFP from HEK293T cell extract. (E) Immunoprecipitation (IP) is performed with anti-NCS-1 rabbit antibody. Anti-NCS-1 antibody show positive immunoprecipitation of the antigene (low panel). Note, that there is endogenous NCS-1 expressed in HEK293 cells but at much lower levels then overexpressed NCS-1. Mostly a homomeric form of A2A-YFP is detected with anti-GFP mouse antibody (upper panel). (F) The binding of A2A receptor to NCS-1 is enhanced in the presence of Ca2+. Quantification of immunoprecipitated A2A-YFP. Data represented as average of 4–5 independent experiments ± SEM.
Overexpression of NCS-1 has no Impact on Surface Expression of the A2A Receptor in Non-Stimulated Cells
NCS-1 is involved in regulation of vesicular trafficking from the trans-Golgi network (TGN) to the plasma membrane and associates with the Golgi membranes via its N-terminal myristoyl tail where it regulates activity of phosphatidylinositol 4-kinase IIIβ (PI-4KIIIβ), thus providing a Ca2+-dependent control for the regulated local synthesis of phosphatidylinositol 4-phosphate (PI(4)P) and for the exit of vesicles from TGN (Zhao et al., 2001; Haynes et al., 2005; Mikhaylova et al., 2009). At the plasma membrane NCS-1 is involved in transduction of Ca2+ signaling and regulating the activity of different kinases and surface receptors (for review see Mikhaylova et al., 2011). A2A receptor traverses the secretory trafficking pathway from the ER to the Golgi complex on the way to the plasma membrane. Therefore, we next asked how the presence of NCS-1 would affect the expression of A2A receptor at the plasma membrane and where in the cell the complex of A2A receptor and NCS-1 might occur. To address the first question, we performed a quantitative surface biotinylation assay to compare the surface expression of A2A receptor with and without co-transfection of NCS-1. Two major bands corresponding to the monomer and the dimer of A2A receptor were biotinylated and purified with streptavidin beads (Figure 3A). Additional bands appearing in streptavidin-bound fraction but not in whole-cell extract might represent a differentially modified (for example glycosilated, phosphorylated, etc.) plasma membrane receptor fraction. Although there we observed a slight increase in immunoreactivity of biotinylated A2A when co-expressed with NCS-1, we have not found any significant effect on surface receptor expression in non-stimulated HEK293T cells (Figure 3B). Next, for the co-localization study we have chosen COS-7 cells because they are significantly larger than HEK293T cells. After 24 h of overexpression, significant amounts of A2A-YFP fluorescence was still associated with the ER and the Golgi membranes. Considerable overlap of A2A-YFP and NCS-1-TagRFP fluorescence, however, was mostly seen close to the plasma membrane compartment (Figure 3C). Therefore, in another set of experiments we included phalloidin-568 staining to visualize a dense cortical actin cytoskeleton along the cell membranes. Additionally, since the excitation/emission spectrum of TagRFP is largely overlapping with Alexa Fluor 568, we replaced the fusion constructs by NCS-1-YFP and A2A-Rluc (Figure 3D). Again we could see a co-localization of A2A and NCS-1 fluorescence overlapping with F-actin at the edges of the cell membrane as well as in small clusters in the cytosol (Figure 3D). These clusters could represent post-Golgi transport carriers, endosomes or some other vesicular compartments.
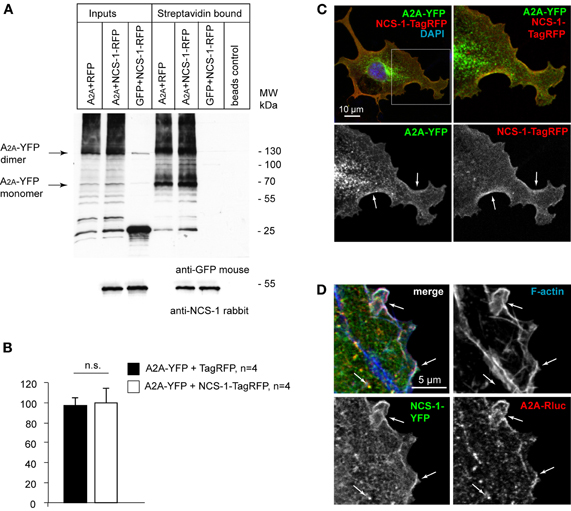
Figure 3. NCS-1 does not interfere with the trafficking and surface expression of adenosine A2A receptors in the basal conditions (no agonist stimulation). (A) HEK293T cells overexpressing A2A-YFP alone or together with NCS-1-TagRFP and GFP control co-transfected with NCS-1-TagRFP were labeled with Sulfo-NHS-SS-Biotin for 15 min at 4°C and biotinylated proteins were purified with Streptavidin beads. Detection was done with anti-GFP and anti-NCS-1 antibody. Note the SDS-resistant dimer of A2A-YFP. NCS-1-TagRFP is also co-purified with surface biotinylated proteins suggesting that there might be another binding partner of NCS-1 endogenously expressing in HEK293T cells. (B) Although there are slight differences in amount of surface labeled A2A-YFP between TagRFP and NCS-1-TagRFP expressing cells, no clear effect of NCS-1 overexpression can be seen. (C) Confocal image of a COS-7 cell co-expressing with A2A-YFP and NCS-1-TagRFP for 24 h shows co-localization of both proteins at the cell periphery (white arrows indicate co-localization). (D) A2A-Rluc co-localizes with NCS-1-YFP and cortical F-actin along the plasma membrane of transfected COS-7 cells. Note the intracellular vesicular structures showing overlapping fluorescence of A2A and NCS-1.
Binding of NCS-1 to the A2A Receptor Dimer has a Differential Effect on Agonist-Induced Intracellular Signaling
Homodimers of adenosine A2A receptor are the predominant form of the receptor at the cell membrane (Canals et al., 2004). Moreover, based on the co-immunprecipitation data, where mostly the homomeric form of A2A was co-purified with NCS-1, we questioned if NCS-1 could interact with the A2A homodimer. We performed BRET saturation curves in HEK293T cells expressing an A2A-Rluc and increasing amounts of A2A-YFP in the presence or absence of NCS-1 (Figure 4A). The presence of NCS-1 modified the BRETmax (p = 0.01) and BRET50 (p = 0.05) corresponding to the formation of a A2A homodimer (BRETmax 196 ± 10 mBU and BRET50 63 ± 7 in the absence of NCS-1; BRETmax 131 ± 9 mBU and BRET50 90 ± 10 in the presence of NCS-1). This result demonstrates that NCS-1 interacts with A2A receptor homodimers and induces changes in their quaternary structure in a manner that suggests a greater distance between donor and acceptor, a change in orientation, and/or a diminished number of heteromers. Another possibility that we cannot exclude would be a change in the density of adenosine A2A receptors at the plasma membrane upon overexpression of NCS-1. However, we have not found significant increases in the amount of A2A receptor associated with the plasma membrane using surface biotinylation assay (Figure 3A). BRET experiments were always carried out at constant amounts of receptors between compared groups. Since we performed our study in intact HEK293T cells, a small change in plasma membrane density of A2A receptors would presumably be compensated for by a change in density in other intracellular membranes. Thus, the changes measured in the BRET assay are most likely due to differences in receptor-receptor interaction. An elevation in Ca2+ levels by treating cells with ionomycin (1 μM) did not modify A2A–A2A homomerization but modified the BRET50 (p = 0.05) in the presence of NCS-1 (BRETmax 148 ± 10 mBU and BRET50 48 ± 7), indicating a change in the receptor association between NCS-1 and the A2A heteromer in the presence of Ca2+ (Figure 4A).
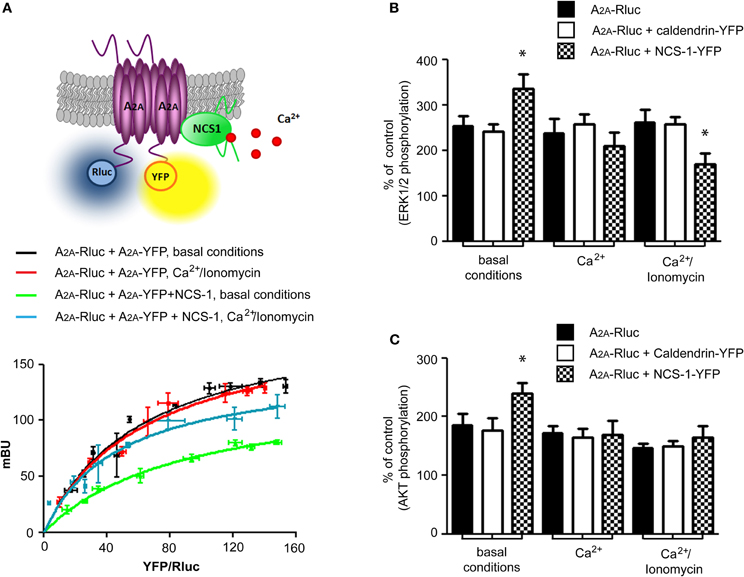
Figure 4. NCS-1 associates with a A2A–A2A homodimer and modulates the adenosine A2A receptor signaling in a Ca2+ dependent manner. (A) BRET saturation curves were obtained from HEK-293T cells co-transfected with 0.2 μg cDNA corresponding to A2A-Rluc fusion protein and increasing amounts of cDNA (0.05–1 μg) corresponding to A2A-YFP fusion protein without (black and red curves) or with 0.5 μg of the cDNA corresponding to NCS-1 (green and blue curves). Measurements were done either at basal conditions (black and green curves) or after treatment of cells with 1 μM of ionomycin for 10 min (red and blue curves). Ca2+ has no effect on A2A receptor homodimerization itself (red curve compared to the black one) but modifies A2A-A2A-NCS-1 heteromeric complex structure (blue curve compared to the green one). Both fluorescence and luminescence of each sample were measured before every experiment to confirm similar donor expression (approximately 100,000 bioluminescence units) while monitoring the increase in acceptor expression (1000–27,000 fluorescence units). The relative amount of BRET is given as a function of 100× the ratio between the fluorescence of the acceptor (YFP) and the luciferase activity of the donor (Rluc). Average of 5–6 independent experiments measured in triplicates are plotted as mean value ± S.E.M. A schematic representation of BRET is given at the top. In (B) and (C) HEK-293T cells transfected with 0.5 μg cDNA corresponding to adenosine A2A receptor alone or with cDNA corresponding to caldendrin-YFP (0.8 μg) or NCS-1-YFP (0.6 μg) were stimulated with 100 nM of CGS 2168 at the basal condition, in the presence of 1.26 mM of Ca2+ in HBSS buffer or in the presence of both 1.26 mM of Ca2+ and 1 μM of Ca2+ ionophore ionomycin. Equal amount of protein were analyzed by SDS-PAGE using phospho-ERK1/2 (B) or phospho-AKT (C) and total-ERK1/2 antibodies. Quantification of eight independent experiments indicates stimulatory effect on NCS-1 on MAPK signaling (B) or pAKT levels (C) at the basal Ca2+ conditions. *p = 0.05.
The adenosine A2A receptor is a Gs coupled receptor that regulates cAMP production. The activation of the A2A receptor regulates a number of protein and lipid kinases, including MAPK 1-3 (ERK1/2) phosphorylation and activity (Wyatt et al., 2002; Navarro et al., 2009) and V-akt murine thymoma viral oncogene homolog 1 (AKT, also called PKB/Mori et al., 2004). To test the effect of NCS-1 overexpression on A2A receptor function we analyzed MAPK and AKT signaling pathways. 2-[p-(2-carboxyethyl)phenylethylamino]-50 ethylcarboxamidoadenosine (CGS 21680) is a selective agonist of A2A type of adenosine receptors. CGS21680-induced ERK1/2 and AKT phosphorylation was assessed in transiently transfected HEK293T cells at basal conditions or at elevated calcium levels. Agonist stimulation of A2A in NCS-1-YFP transfected cells induced a significant increase in ERK1/2 phosphorylation at basal conditions and this effect was reversed when cells were pre-treated with Ca2+/Ionomycin (Figure 4B). As a negative control, overexpression of caldendrin-YFP, that showed no interaction with A2A receptors, had no effect on ERK1/2 activity at any condition tested, demonstrating further the specificity of the NCS-1-induced effects (Figure 4B). Finally, NCS-1 promoted the CGS21680-induced AKT phosphorylation at resting Ca2+ levels and again this effect was blocked when intracellular Ca2+ concentrations were increased with ionomycin (Figure 4C).
Discussion
Adenosine receptors cross talk has been established with other GPCRs, ionotropic receptors, and receptor kinases to regulate their function with most of the characterized interactions occur via the A2A receptor type (Sebastião and Ribeiro, 2009). Most important, the role of A2A receptors in the brain is related to their ability to interact with other receptor systems (Sebastião and Ribeiro, 2009). Indeed, cross talk between the A2A receptor and D2 type dopamine receptor, metabotropic glutamate receptor mGluR5 or endocanabinoid receptor CB1 in striatum modulates the signaling induced by these receptors and has important clinical implications for the treatment of Parkinson disease, schizophrenia, addiction, and potentially other brain disorders (Ferré et al., 2002; Carriba et al., 2007; Ferré et al., 2008).
Another level of complexity to the regulation of GPCRs signaling is added by cross talk between GPCRs system and intracellular Ca2+ signaling via CaM. Among a number of other GPCRs, CaM has been shown to bind to the carboxy-terminus adenosine A2A receptors in a A2A-D2 receptor heteromer. Elevation of intracellular Ca2+ levels then triggers conformational changes in this complex via CaM providing a selective modulation of A2A-D2 receptor heteromer-mediated activation of the MAPK pathway (Navarro et al., 2009). Evolutionary and based on the history of their discovery, calcium sensors from the CaM superfamily that are particularly abundant in brain are divided into two larger groups named NCS and nCaBPs (Mikhaylova et al., 2011). Although CaM is ubiquitously expressed in all eukaryotic cells, emerging evidence supports a role for NCS and nCaBPs other than CaM in the regulation of a number of effectors. For example, there are interactions that are specific for particular calcium sensors (hippocalcin—PSD95; caldendrin—LC3/Seidenbecher et al., 2004; Dieterich et al., 2008; Jo et al., 2010) and that cannot be competed by CaM. Moreover, many CaM targets can interact with more than one NCS or nCaBPs. Voltage-gated Ca2+ channels (CaV) (P/Q-, N-, and L-type), TRPC1/5 channels, GPCRs, IP3R, and PI-4KIIIβ are among them (for review see Mikhaylova et al., 2011). We have chosen two representative candidate proteins from each group of CaM-like calcium sensors. NCS-1 (also known as frequinin) is one of the first discovered and well-characterized NCS proteins. NCS-1, like other members of this family of proteins, has a widespread distribution in the brain and spinal cord (Martone et al., 1999). In terms of its structural organization, NCS-1 can associate with intracellular membranes via a N-terminal myristoyl tail and like CaM it has four EF-hand motifs where the first EF-hand is cryptic and does not coordinate Ca2+. Differently from CaM that displays a dumbbell conformation of the two EF-hand domains, NCS-1 exhibits a globular fold and NCS-1 can bind Ca2+ with higher affinity than CaM (in the range of 0.5–0.8 μM in Mg2+ bound form/Aravind et al., 2008; Mikhaylova et al., 2009). Ca2+ binding induces conformational changes and the exposure of hydrophobic surfaces for the interaction with the target protein or membrane. Caldendrin is the founding member of the nCaBP group of Ca2+ sensors (Seidenbecher et al., 1998). Most important, based on alignments of its carboxy terminal half that resembles the organization of CaM, caldendrin is the closest homolog of CaM in brain (Seidenbecher et al., 1998; Mikhaylova et al., 2006, 2011; McCue et al., 2010).
To test if NCS-1 and caldendrin are able to interact with A2A receptor in living cells we measured BRET between A2A—Rluc as the donor and calcium sensor—YFP as the acceptor. We observed a positive saturable signal only between A2A and NCS-1 but not caldendrin. This result was surprising, as caldendrin is more closely related to CaM than NCS-1. Like CaM, binding of NCS-1 occurred already under basal Ca2+-conditions and was further facilitated by increased intracellular Ca2+ levels. We were able to confirm these data by heterologous co-immunoprecipitations from HEK293T cells transiently expressing A2A or D2 receptors and NCS-1. These data suggest that NCS-1 is a novel interaction partner of A2A receptor. Both proteins associate with membranes and can be found along the secretory trafficking pathway but mainly co-localize at the post-Golgi trafficking compartments including the cell membrane. Although there was a slight increase in the amount of surface receptor when cells were overexpressing NCS-1, this might be due to the stimulatory effect of NCS-1 on the activity of the Golgi localized enzyme PI-4KIIIβ but not likely due to trafficking of A2A itself. Activation of PI-4KIIIβ leads to the increase in production of PI(4)P—rate limiting phosphoinositide in the TGN-to-plasma membrane trafficking (Zhao et al., 2001; Haynes et al., 2005; Mikhaylova et al., 2009) and would in general enhance the surface delivery of transmembrane proteins.
Using BRET we have found that NCS-1 is associated with a A2A homodimer. More than 90% of A2A overexpressed in HEK293T cells is functional only in dimeric form (Canals et al., 2004) and this indicates that NCS-1 associates with a functional A2A receptor. Interestingly, in a recent paper of Lian and colleagues (2011) the NMR structure of Ca2+-bound NCS-1 and the dopamine D2 receptor binding peptide have indicated that monomeric NCS-1 can simultaneously bind two D2 receptors. Similarly, Ca2+ stabilizes a A2A-A2A-NCS-1 heteromeric complex. It is tempting to speculate, that this might relate to conformational changes in monomeric NCS-1 which induces conformational changes in the heteromer which then has differential consequences in terms of agonist-induced intracellular signaling. At basal conditions, stimulation with the A2A receptor agonist CGS21680 had a positive effect on phosphorylation of ERK1/2 and AKT. In contrast, preincubation of cells with Ca2+/ionomycin reduced the agonist-induced ERK1/2 phosphorylation. Most important, this effect is specific for NCS-1 since overexpression of CaM had no effect on A2A receptor homomer signaling but instead was important for A2A—D2 induced ERK1/2 phosphorylation (Navarro et al., 2009). The contribution of endogenous NCS-1 from HEK293 cells is probably very minor since the expression levels are quite low and we have not seen any change induced by elevated Ca2+ in the cells overexpressing only A2A receptor alone.
In summary, in this study we provide the first evidence for a novel interaction between the adenosine A2A receptor and NCS-1. We demonstrate that Ca2+ modulates both the association and the intracellular signaling in living cells and that this effect is specific for NCS-1 in the sense that caldendrin does not bind and that the association of CaM has different functional consequences. Understanding the role of NCS-1 in heteromerization of GPCRs will provide further insights on the function of GPCRs and might have potential clinical applications.
Conflict of Interest Statement
The authors declare that the research was conducted in the absence of any commercial or financial relationships that could be construed as a potential conflict of interest.
Acknowledgments
We are grateful to C. Borutzki, M. Marunde, and S. Hochmuth for the professional technical assistance. This work was supported by research grants from the DFG (SFB 779 TPB8, SFB 854 TP7, Kr 1879/3-1), the DZNE Magdeburg and by SAF2010-18472 and SAF2011-23813 from Spanish Government.
References
Aravind, P., Chandra, K., Reddy, P. P., Jeromin, A., Chary, K. V., and Sharma, Y. (2008). Regulatory and structural EF-hand motifs of neuronal calcium sensor-1, Mg2+ modulates Ca2+ binding, Ca2+-induced conformational changes, and equilibrium unfolding transitions. J. Mol. Biol. 376, 1100–1115.
Ayoub, M. A., and Pfleger, K. D. (2010). Recent advances in bioluminescence resonance energy transfer technologies to study GPCR heteromerization. Curr. Opin. Pharmacol. 10, 44–52.
Bernstein, H. G., Seidenbecher, C. I., Smalla, K. H., Gundelfinger, E. D., Bogerts, B., and Kreutz, M. R. (2003). Distribution and cellular localization of caldendrin immunoreactivity in adult human forebrain. J. Histochem. Cytochem. 51, 1109–1112.
Burgoyne, R. D. (2007). Neuronal calcium sensor proteins: generating diversity in neuronal Ca2+ signalling. Nat. Rev. Neurosci. 8, 182–193.
Canals, M., Burgueño, J., Marcellino, D., Cabello, N., Canela, E. I., Mallol, J., Agnati, L., Ferré, S., Bouvier, M., Fuxe, K., Ciruela, F., Lluis, C., and Franco, R. (2004). Homodimerization of adenosine A2A receptors: qualitative and quantitative assessment by fluorescence and bioluminescence energy transfer. J. Neurochem. 88, 726–734.
Carriba, P., Navarro, G., Ciruela, F., Ferré, S., Casadó, V., Agnati, L., Cortés, A., Mallol, J., Fuxe, K., Canela, E. I., Lluís, C., and Franco, R. (2008). Detection of heteromerization of more than two proteins by sequential BRET-FRET. Nat. Methods 5, 727–733.
Carriba, P., Ortiz, O., Patkar, K., Justinova, Z., Stroik, J., Themann, A., Müller, C., Woods, A. S., Hope, B. T., Ciruela, F., Casadó, V., Canela, E. I., Lluis, C., Goldberg, S. R., Moratalla, R., Franco, R., and Ferré, S. (2007). Striatal adenosine A2A and cannabinoid CB1 receptors form functional heteromeric complexes that mediate the motor effects of cannabinoids. Neuropsychopharmacology 32, 2249–2259.
Dacres, H., Wang, J., Dumancic, M. M., and Trowell, S. C. (2010). Experimental determination of the Förster distance for two commonly used bioluminescent resonance energy transfer pairs. Anal. Chem. 82, 432–435.
De, A., and Gambhir, S. S. (2005). Noninvasive imaging of protein-protein interactions from live cells and living subjects using bioluminescence resonance energy transfer. FASEB J. 19, 2017–2019.
Dieterich, D. C., Karpova, A., Mikhaylova, M., Zdobnova, I., König, I., Landwehr, M., Kreutz, M., Smalla, K. H., Richter, K., Landgraf, P., Reissner, C., Boeckers, T. M., Zuschratter, W., Spilker, C., Seidenbecher, C. I., Garner, C. C., Gundelfinger, E. D., and Kreutz, M. R. (2008). Caldendrin-Jacob: a protein liaison that couples NMDA receptor signalling to the nucleus. PLoS Biol. 6:e34. doi: 10.1371/journal.pbio.0060034
Ferré, S., Karcz-Kubicha, M., Hope, B. T., Popoli, P., Burgueño, J., Gutiérrez, M. A., Casadó, V., Fuxe, K., Goldberg, S. R., Lluis, C., Franco, R., and Ciruela, F. (2002). Synergistic interaction between adenosine A2A and glutamate mGlu5 receptors: implications for striatal neuronal function. Proc. Natl. Acad. Sci. U.S.A. 99, 11940–11945.
Ferré, S., Quiroz, C., Woods, A. S., Cunha, R., Popoli, P., Ciruela, F., Lluis, C., Franco, R., Azdad, K., and Schiffmann, S. N. (2008). An update on adenosine A2A-dopamine D2 receptor interactions: implications for the function of G protein-coupled receptors. Curr. Pharm. Des. 14, 1468–1474.
Ferré, S., Woods, A. S., Navarro, G., Aymerich, M., Lluís, C., and Franco, R. (2010). Calcium-mediated modulation of the quaternary structure and function of adenosine A2A-dopamine D2 receptor heteromers. Curr. Opin. Pharmacol. 10, 67–72.
Haynes, L. P., Thomas, G. M., and Burgoyne, R. D. (2005). Interaction of neuronal calcium sensor-1 and ADP-ribosylation factor 1 allows bidirectional control of phosphatidylinositol 4-kinase beta and trans-Golgi network-plasma membrane traffic. J. Biol. Chem. 280, 6047–6054.
Hradsky, J., Raghuram, V., Reddy, P. P., Navarro, G., Hupe, M., Casado, V., McCormick, P. J., Sharma, Y., Kreutz, M. R., and Mikhaylova, M. (2011). Post-translational membrane insertion of tail-anchored transmembrane EF-hand Ca2+ sensor calneurons requires the TRC40/Asna1 protein chaperone. J. Biol. Chem. 286, 36762–36776.
Jo, J., Son, G. H., Winters, B. L., Kim, M. J., Whitcomb, D. J., Dickinson, B. A., Lee, Y. B., Futai, K., Amici, M., Sheng, M., Collingridge, G. L., and Cho, K. (2010). Muscarinic receptors induce LTD of NMDAR EPSCs via a mechanism involving hippocalcin, AP2 and PSD-95. Nat. Neurosci. 13, 1216–1224.
Kabbani, N., Negyessy, L., Lin, R., Goldman-Rakic, P., and Levenson, R. (2002). Interaction with neuronal calcium sensor NCS-1 mediates desensitization of the D2 dopamine receptor. J. Neurosci. 22, 8476–8486.
Komolov, K. E., Senin, I. I., Kovaleva, N. A., Christoph, M. P., Churumova, V. A., Grigoriev, I. I., Akhtar, M., Philippov, P. P., and Koch, K. W. (2009). Mechanism of rhodopsin kinase regulation by recoverin. J. Neurochem. 110, 72–79.
Kull, B., Svenningsson, P., and Fredholm, B. B. (2000). Adenosine A(2A) receptors are colocalized with and activate g(olf) in rat striatum. Mol. Pharmacol. 58, 771–777.
Laube, G., Seidenbecher, C. I., Richter, K., Dieterich, D. C., Hoffmann, B., Landwehr, M., Smalla, K. H., Winter, C., Böckers, T. M., Wolf, G., Gundelfinger, E. D., and Kreutz, M. R. (2002). The neuron-specific Ca2+-binding protein caldendrin: gene structure, splice isoforms, and expression in the rat central nervous system. Mol. Cell. Neurosci. 19, 459–475.
Lian, L. Y., Pandalaneni, S. R., Patel, P., McCue, H. V., Haynes, L. P., and Burgoyne, R. D. (2011). Characterisation of the interaction of the C-terminus of the dopamine D2 receptor with neuronal calcium sensor-1. PLoS One 6:e27779. doi: 10.1371/journal.pone.0027779
Martone, M. E., Edelmann, V. M., Ellisman, M. H., and Nef, P. (1999). Cellular and subcellular distribution of the calcium-binding protein NCS-1 in the central nervous system of the rat. Cell Tissue Res. 295, 395–407.
McCue, H. V., Haynes, L. P., and Burgoyne, R. D. (2010). Bioinformatic analysis of CaBP/calneuron proteins reveals a family of highly conserved vertebrate Ca2+-binding proteins. BMC Res. Notes 3, 118.
Mikhaylova, M., Hradsky, J., and Kreutz, M. R. (2011). Between promiscuity and specificity: novel roles of EF-hand calcium sensors in neuronal Ca2+ signalling. J. Neurochem. 118, 695–713.
Mikhaylova, M., Reddy, P. P., Munsch, T., Landgraf, P., Suman, S. K., Smalla, K. H., Gundelfinger, E. D., Sharma, Y., and Kreutz, M. R. (2009). Calneurons provide a calcium threshold for trans-Golgi network to plasma membrane trafficking. Proc. Natl. Acad. Sci. U.S.A. 106, 9093–9098.
Mikhaylova, M., Sharma, Y., Reissner, C., Nagel, F., Aravind, P., Rajini, B., Smalla, K. H., Gundelfinger, E. D., and Kreutz, M. R. (2006). Neuronal Ca2+ signaling via caldendrin and calneurons. Biochim. Biophys. Acta 1763, 1229–1237.
Minakami, R., Jinnai, N., and Sugiyama, H. (1997). Phosphorylation and calmodulin binding of the metabotropic glutamate receptor subtype 5 (mGluR5) are antagonistic in vitro. J. Biol. Chem. 272, 20291–20298.
Mori, Y., Higuchi, M., Masuyama, N., and Gotoh, Y. (2004). Adenosine A2A receptor facilitates calcium-dependent protein secretion through the activation of protein kinase A and phosphatidylinositol-3 kinase in PC12 cells. Cell Struct. Funct. 29, 101–110.
Nakajima, Y., Yamamoto, T., Nakayama, T., and Nakanishi, S. (1999). A relationship between protein kinase C phosphorylation and calmodulin binding to the metabotropic glutamate receptor subtype 7. J. Biol. Chem. 274, 27573–27577.
Navarro, G., Aymerich, M. S., Marcellino, D., Cortés, A., Casadó, V., Mallol, J., Canela, E. I., Agnati, L., Woods, A. S., Fuxe, K., Lluís, C., Lanciego, J. L., Ferré, S., and Franco, R. (2009). Interactions between calmodulin, adenosine A2A, and dopamine D2 receptors. J. Biol. Chem. 284, 28058–28068.
Nickols, H. H., Shah, V. N., Chazin, W. J., and Limbird, L. E. (2004). Calmodulin interacts with the V2 vasopressin receptor: elimination of binding to the C terminus also eliminates arginine vasopressin-stimulated elevation of intracellular calcium. J. Biol. Chem. 279, 46969–46980.
Nishi, A., Watanabe, Y., Higashi, H., Tanaka, M., Nairn, A. C., and Greengard, P. (2005). Glutamate regulation of DARPP-32 phosphorylation in neostriatal neurons involves activation of multiple signaling cascades. Proc. Natl. Acad. Sci. U.S.A. 102, 1199–1204.
Ritter, S. L., and Hall, R. A. (2009). Fine-tuning of GPCR activity by receptor-interacting proteins. Nat. Rev. Mol. Cell Biol. 10, 819–830.
Rosin, D. L., Hettinger, B. D., Lee, A., and Linden, J. (2003). Anatomy of adenosine A2A receptors in brain: morphological substrates for integration of striatal function. Neurology 61, S12–S18.
Schiffmann, S. N., Fisone, G., Moresco, R., Cunha, R. A., and Ferré, S. (2007). Adenosine A2A receptors and basal ganglia physiology. Prog. Neurobiol. 83, 277–292.
Sebastião, A. M., and Ribeiro, J. A. (1996). Adenosine A2 receptor-mediated excitatory actions on the nervous system. Prog. Neurobiol. 48, 167–189.
Sebastião, A. M., and Ribeiro, J. A. (2009). Tuning and fine-tuning of synapses with adenosine. Curr. Neuropharmacol. 7, 180–194.
Seidenbecher, C. I., Landwehr, M., Smalla, K. H., Kreutz, M., Dieterich, D. C., Zuschratter, W., Reissner, C., Hammarback, J. A., Böckers, T. M., Gundelfinger, E. D., and Kreutz, M. R. (2004). Caldendrin but not calmodulin binds to light chain 3 of MAP1A/B: an association with the microtubule cytoskeleton highlighting exclusive binding partners for neuronal Ca(2+)-sensor proteins. J. Mol. Biol. 336, 957–970.
Seidenbecher, C. I., Langnaese, K., Sanmartí-Vila, L., Boeckers, T. M., Smalla, K. H., Sabel, B. A., Garner, C. C., Gundelfinger, E. D., and Kreutz, M. R. (1998). Caldendrin, a novel neuronal calcium-binding protein confined to the somato-dendritic compartment. J. Biol. Chem. 273, 21324–21331.
Vu, C. B. (2005). Recent advances in the design and optimization of adenosine A2A receptor antagonists. Curr. Opin. Drug Discov. Devel. 8, 458–468.
Woods, A. S., Marcellino, D., Jackson, S. N., Franco, R., Ferré, S., Agnati, L. F., and Fuxe, K. (2008). How calmodulin interacts with the adenosine A(2A) and the dopamine D(2) receptors. J. Proteome Res. 7, 3428–3434.
Wyatt, A. W., Steinert, J. R., Wheeler-Jones, C. P., Morgan, A. J., Sugden, D., Pearson, J. D., Sobrevia, L., and Mann, G. E. (2002). Early activation of the p42/p44MAPK pathway mediates adenosine-induced nitric oxide production in human endothelial cells: a novel calcium-insensitive mechanism. FASEB J. 16, 1584–1594.
Zhao, X., Várnai, P., Tuymetova, G., Balla, A., Tóth, Z. E., Oker-Blom, C., Roder, J., Jeromin, A., and Balla, T. (2001). Interaction of neuronal calcium sensor-1 (NCS-1) with phosphatidylinositol 4-kinase beta stimulates lipid kinase activity and affects membrane trafficking in COS-7 cells. J. Biol. Chem. 276, 40183–40189.
Keywords: adenosine A2A receptor, GPCRs, NCS-1, caldendrin, calmodulin, calcium signaling, BRET
Citation: Navarro G, Hradsky J, Lluís C, Casado V, McCormick PJ, Kreutz MR and Mikhaylova M (2012) NCS-1 associates with adenosine A2A receptors and modulates receptor function. Front. Mol. Neurosci. 5:53. doi: 10.3389/fnmol.2012.00053
Received: 13 January 2012; Paper pending published: 25 January 2012;
Accepted: 02 April 2012; Published online: 18 April 2012.
Edited by:
Jose R. Naranjo, Centro Nacional de Biotecnologia/Consejo Superior de Investigaciones Cientificas, SpainCopyright: © 2012 Navarro, Hradsky, Lluís, Casado, McCormick, Kreutz and Mikhaylora. This is an open-access article distributed under the terms of the Creative Commons Attribution Non Commercial License, which permits non-commercial use, distribution, and reproduction in other forums, provided the original authors and source are credited.
*Correspondence: Marina Mikhaylova, Research Group “Neuroplasticity”, Leibniz Institute for Neurobiology, Brenneckestr. 6, 39118 Magdeburg, Germany. e-mail:bWlraGF5bG92YUBsaW4tbWFnZGVidXJnLmRl