 Alison J. Clare
 Hollie E. Wicky
 Ruth M. Empson
 Stephanie M. Hughes
- 1Department of Biochemistry, School of Biomedical Sciences, University of Otago, Dunedin, New Zealand
- 2Brain Health Research Centre, University of Otago, Dunedin, New Zealand
- 3Genetics Otago, University of Otago, Dunedin, New Zealand
- 4Department of Physiology, School of Biomedical Sciences, University of Otago, Dunedin, New Zealand
Forebrain embryonic zinc finger (Fezf2) encodes a transcription factor essential for the specification of layer 5 projection neurons (PNs) in the developing cerebral cortex. As with many developmental transcription factors, Fezf2 continues to be expressed into adulthood, suggesting it remains crucial to the maintenance of neuronal phenotypes. Despite the continued expression, a function has yet to be explored for Fezf2 in the PNs of the developed cortex. Here, we investigated the role of Fezf2 in mature neurons, using lentiviral-mediated delivery of a shRNA to conditionally knockdown the expression of Fezf2 in the mouse primary motor cortex (M1). RNA-sequencing analysis of Fezf2-reduced M1 revealed significant changes to the transcriptome, identifying a regulatory role for Fezf2 in the mature M1. Kyoto Encyclopedia Genes and Genomes (KEGG) pathway analyses of Fezf2-regulated genes indicated a role in neuronal signaling and plasticity, with significant enrichment of neuroactive ligand-receptor interaction, cell adhesion molecules and calcium signaling pathways. Gene Ontology analysis supported a functional role for Fezf2-regulated genes in neuronal transmission and additionally indicated an importance in the regulation of behavior. Using the mammalian phenotype ontology database, we identified a significant overrepresentation of Fezf2-regulated genes associated with specific behavior phenotypes, including associative learning, social interaction, locomotor activation and hyperactivity. These roles were distinct from that of Fezf2-regulated genes identified in development, indicating a dynamic transition in Fezf2 function. Together our findings demonstrate a regulatory role for Fezf2 in the mature brain, with Fezf2-regulated genes having functional roles in sustaining normal neuronal and behavioral phenotypes. These results support the hypothesis that developmental transcription factors are important for maintaining neuron transcriptomes and that disruption of their expression could contribute to the progression of disease phenotypes.
Introduction
The pyramidal projection neurons (PNs) of the mature cortex display vast diversity in their phenotypes and connections (Molyneaux et al., 2007; Spruston, 2008). These excitatory PNs encode messages that are critical for mediating higher cognitive function and behavioral output (Spruston, 2008). Often neurodegenerative disease preferentially affects specific neuronal subtypes, regardless of a universal role for the causative factors (Yang et al., 2014), highlighting that vulnerability can be unique to specific PN types. Therefore, broadening our knowledge of the regulatory factors that maintain neuronal function and diversity is critical to our understanding of the brain in health and disease.
Spatially restricted expression of transcription factors play an important role in directing the fate of distinct PN types in the cortex (Arlotta et al., 2005; Chen J.-G. et al., 2005; Chen B. et al., 2005; Molyneaux et al., 2005; Alcamo et al., 2008; Britanova et al., 2008; McKenna et al., 2011; Kwan et al., 2012; Lodato et al., 2014) and many have continued expression into adulthood (Inoue et al., 2004; Ozdinler et al., 2011; Deneris and Hobert, 2014; Zeisel et al., 2015). This raises the intriguing possibility that these factors play a role in maintaining adult neuronal identity. Certainly, recent studies in mammalian models have demonstrated roles for developmentally important transcription factors in maintaining several distinct neuronal subtypes (Kadkhodaei et al., 2009; Liu et al., 2010; Tsarovina et al., 2010; Song et al., 2011; Domanskyi et al., 2014). For example, the conditional knockdown of Nurr1, a key transcription factor for differentiation of midbrain dopaminergic neurons, resulted in a loss of midbrain dopaminergic neurons and striatal dopaminergic neuronal markers in the adult brain, accompanied by impaired motor behavior (Kadkhodaei et al., 2009). The developmental transcription factor, Pet-1, is required for 5-HT synthesis in the adult brain and conditional knockout of Pet-1 elevates anxiety behaviors in mice (Liu et al., 2010). Results such as these highlight the clinical implications of understanding maintenance of neuronal identity. However, despite the importance the cortex has for mediating higher-cognitive behavior, there has been no investigation of the potential regulatory factors maintaining neuronal diversity within the cortex.
During development, highly organized expression of transcription factors are essential to ensure the correct specification of PN types in the layered structure of the cortex (Arlotta et al., 2005; Han et al., 2011; Kwan et al., 2012; Srinivasan et al., 2012). One such transcription factor, Forebrain embryonic zinc finger 2 (Fezf2 also known as Zfp312, Fezl, Znf312), is expressed in the deep layer PNs (layer 5 and 6), where it is critical to the specification of corticospinal projection neurons (CSpPNs; Chen J.-G. et al., 2005; Molyneaux et al., 2005). The restricted expression of Fezf2 persists into adulthood (Inoue et al., 2004; Ozdinler et al., 2011; Tantirigama et al., 2016), where high levels of expression in layer 5 were thought to be a CSpPN specific marker (Ozdinler et al., 2011). However, recent work found that Fezf2-expression identifies a diverse group of PNs in layer 5 of the mature primary motor cortex (M1; Tantirigama et al., 2016). These comprised of intratelencephalic projection neurons (IT-PNs), which are affected in disorders such as schizophrenia (Shepherd, 2013) and pyramidal tract projection neurons (PT-PNs), including CSpPNs that are lost in the progression of amyotrophic lateral sclerosis (ALS; Ozdinler et al., 2011). The diversity of Fezf2 expression within layer 5 of M1 makes it an interesting target to investigate for the maintenance of layer-specific PNs in the adult cortex, with the potential to identify target factors with broad clinical implications.
Here, we explored a role for Fezf2 in maintaining the molecular profiles of mature neurons in the mouse M1. The effects of lentiviral-mediated conditional knockdown of Fezf2 in the mature M1 were analyzed by RNA-sequencing. We found significant changes in gene expression demonstrating a functional role for Fezf2 in the mature brain. Through comparison to Fezf2-regulated genes previously identified in development (Lodato et al., 2014), we discovered a distinct transition in Fezf2 function. Bioinformatic analyses of the differentially expressed genes in mature M1 revealed a functional role for Fezf2 in the regulation of ion flux and cell signaling. In particular, we found Fezf2 regulates an enrichment of genes important to the functional phenotypes of Fezf2-expressing neurons, including genes that regulate calcium transport at the cell membrane. Gene expression changes additionally implicate Fezf2 in regulating molecular expression profiles that are known to be important for the regulation of behavior. Together, these findings demonstrate an importance for Fezf2 in maintaining functionally important molecular expression profiles in the mature brain, distinct from its role in development.
Materials and Methods
Mice
All experiments were performed with male Swiss-Webster mice of either wild-type (non-transgenic) or hemizygous transgenic (Zfp312-EGFP)CO61GsatMmnc mouse line (Gong et al., 2003) bred on a Swiss-Webster background strain. The transgenic mice express green fluorescence protein (GFP) under the control of Fezf2 regulatory elements and are referred to from here on as Fezf2-Gfp mice. All animal husbandry, surgical procedures and use of animal tissue was approved by the University of Otago Animal Ethics Committee and the use of lentivirus (LV) in the mouse brain (in vivo) was approved by the Environmental Protection Authority (EPA), New Zealand under approval number GMD002851.
Lentiviral Vector Packaging
Lentiviral vectors were generated with approval from the EPA (GMD002849). The mouse Fezf2 shRNA and non-silencing shRNA were purchased from Open Biosystems (GE Healthcare, Dharmacon, CO, USA) and cloned into a HIV-1 derived lentiviral expression construct (Desmaris et al., 2001) downstream of a rat Synapsin I 1.1 kb promoter fragment (Dittgen et al., 2004) and mCherry reporter gene (pLV.SynI.mCherry.Fezf2shRNA or non-silencing shRNA). The shRNA sequences are flanked by endogenous mir-30 sequences, allowing both mCherry and shRNA to be transcribed by a Pol-II promoter (Fellmann et al., 2013), in this case SynI.
The lentiviral constructs were packaged using a second generation packaging system (Zufferey et al., 1997). Briefly, HEK293FT cells were plated at 5.4 × 10⁶ cells per T75 flask and transfected with 18.6 μg shRNA-expressing construct, 9.6 μg psPAX2 (gifted from Didier Trono; Addgene plasmid # 12260) and 4.8 μg pVSVG (ViraPower™ Lentiviral Packaging Mix, Invitrogen, New Zealand) in Opti-MEM (Life Technologies, New Zealand) containing Lipofectamine-2000 (Life Technologies, New Zealand). The virus-containing media was recovered 48 h post-transfection. Viral particles were concentrated by ultra-centrifugation in a Beckman L-70 (SW28 rotor; Beckman Coulter, Carlsbad, CA, USA) at 110,000 × g for 90 min at 4°C and the viral pellet was resuspended in lactose (40 mg/mL in Dulbecco’s phosphate buffered saline) and stored at −80°C (Schoderboeck et al., 2015). The viral genomic titres were determined using qPCR with primers for an enhancer incorporated into the lentiviral vectors; woodchuck posttranscriptional response element (Supplementary Table S1), as previously described in Best et al. (2017). The titres ranged from 7.02 × 10⁹ − 3.72 × 10¹⁰ genomes/mL.
Stereotaxic Surgeries for the Injection of Lentivirus
Male mice (P21–25) were anesthetized by a sub-cutaneous injection of 0.05 mg/kg atropine (Baxter Healthcare Ltd.), 0.5 mg/kg domitor (Novartis New Zealand Ltd.) and 70 mg/kg ketamine (Parnell Laboratories New Zealand Ltd.) and secured onto stereotaxic equipment using 45° non-rupture ear bars and a inserting nose clamp gently into the mouth (310037R, Kopf Instruments). A 10 μL Nanofil syringe and 33 G needle assembly (World Precision Instruments, Sarasota, FL, USA) was used to deliver 1 μL of LV through a craniotomy in the skull at two injection sites in the M1; 0.85 mm anterior from Bregma, 1.65 mm lateral from midline and 0.85 mm depth from the pial layer and 0.4 mm anterior from Bregma, 1.4 mm lateral from the midline and 0.6 mm depth from the pial layer.
Histology
Four weeks after lentiviral injections, mice (P49–53) were anesthetized with pentobarbitol (150 mg/kg) and perfused intracardially with 20 mL ice cold 0.9% (w/v) NaCl followed by 20 mL ice cold 4% (w/v) paraformaldehyde in 0.1 M phosphate buffer (pH 7.2). The brain was post-fixed overnight in 4% (w/v) PFA at 4°C, before cryoprotecting in 30% (w/v) sucrose for 2–3 days at 4°C. Tissue was frozen in optimal cutting temperature medium (OCT), Tissue-Tek® (Thermo Fisher Scientific, New Zealand) before cutting. Coronal sections 40 μm thick were cut at −20°C using a Leica CM3050 cryostat (Leica Biosystems, Lincolnshire, IL, USA). The sections were processed for immunohistochemistry (see Supplementary Methods) to enhance the GFP signal from Fezf2-Gfp mouse tissue and the LV reporter gene, mCherry.
Analysis of Transduction Efficiency In Vivo
For transduction efficiency analysis of Fezf2-GFP positive cells in vivo, three Fezf2-Gfp male mice were injected with pLenti.SynI.mCherry.non-silencingshRNA and analyzed 4 weeks later. GFP and mCherry images were overlaid and ImageJ cell counter extension used to count the total number of GFP-positive cells in a section and GFP/mCherry-positive cells. Transduction efficiency of GFP-positive cells was calculated as: (total number of GFP cells co-expressing mCherry/total number of GFP cells) × 100. Mean transduction efficiency was determined from five to six sections per animal. The final mean was calculated across the three biological replicates and presented with the standard error of the mean.
Dissection of M1 for RNA Extraction
Four weeks after surgery the lentiviral injected mice (P49–53) were anesthetized with pentobarbitol (150 mg/kg) and perfused intracardially with ice cold 0.9% (w/v) NaCl. One-millimetre coronal sections of the adult mouse brain were then made from Bregma 1.2–0 using a Ted Pella acrylic mold (Ted Pella Inc., Redding, CA, USA). Brain slices were transferred to L15 complete media containing phenol red free Leibovitz’s L15, 6% D-(+)-glucose (Sigma Aldrich, New Zealand) and 500 units penicillin/500 μg streptomyocin per mL (Invitrogen, New Zealand). A scalpel blade was used to dissect M1, including all layers and meninges, from coronal sections and an Olympus SZX12 with a Stereo Microscope Fluorescence Adapter with a 510–540 nm excitation lamp and 600 nm longpass emission filter (Nightsea, Lexington, MA, USA) used for the detection of mCherry-positive tissue. The dissected tissue was immediately flash frozen in liquid nitrogen.
Preparation of RNA Samples from Mouse M1 Tissue for Transcriptomic Analysis
Frozen tissue was homogenized in 1 mL TRI® reagent (Sigma-Aldrich, New Zealand) using an RNase free plastic pestle. Tissue debris was removed by centrifugation before adding chloroform (0.2 mL) to the supernatant and mixing vigorously for 15 s. After a 2–3 min incubation at room temperature, samples were centrifuged (12,000 × g) for 15 min at 4°C and the top aqueous phase removed to a fresh 1.5 mL eppendorf. This sample was then used as input to the Purelink® RNA extraction kit (Life Technologies, New Zealand) and RNA eluted in 30 μL of RNase/DNase free H2O.
Before library generation for RNA-seq, the RNA was further purified using the RNA clean and concentrator™-5 (Zymo Research, Irvine, CA, USA). RNA quality was assessed using an Agilent Bioanalyzer™ and all samples had RIN numbers of 8.1 or higher. Libraries were prepared and sequenced from RNA samples by the Otago Genomics and Bioinformatics Facility. A TruSeq Stranded Total RNA Library Prep Kit (Illumina) was used and paired-end RNA-sequencing was performed on a HiSeq 2500 Illumina platform.
Bioinformatics
Read quality was assessed using FastQC (Babraham Institute) and reads were trimmed of universal Illumina adapter sequence using fastq-mcf (Aronesty, 2011). Reads were mapped to the mouse genome build mm10 using tophat2 (Kim et al., 2013) and SAMTools (Li et al., 2009) was used to sort and index the resulting alignment bam files (mapped reads). Ensembl gene annotations were downloaded from the University of California Santa Cruz (UCSC) genome browser (January 2016) in BED format and read counts were assigned using BEDTools multiCov (Quinlan and Hall, 2010).
Differential expression analysis was performed using DESeq2 (version 1.10.1; Love et al., 2014) in R studio (R version 3.2.5; RStudio Team, 2015). First, genes with low coverage were filtered out using the cpm function of the edgeR package (Robinson et al., 2010). Only genes with >8 cpm in at least four samples were included in downstream differential expression analysis. Differentially expressed genes were selected with a false discovery rate (FDR) cutoff ≤0.05 and log fold change (LFC) cutoff ≥± 0.2.
Count data was transformed using the variance stabilizing transformation function in DESeq2 before clustering analysis. Unsupervised hierarchical clustering analysis was performed using R (version 3.2.5); first the top 8% most variable genes were identified across all eight samples, irrespective of treatment and a Euclidean distance matrix was produced using R package—Another Multidimensional Analysis Package (Lucas, 2009). The matrix was used as the input for unsupervised hierarchical clustering, which clusters samples according to the level of similarity identified by the distance matrix.
For heatmap generation the normalized counts were transformed using the DESeq2 variance stabilizing transformation and the z-score calculated for each sample. The heatmap was then generated using the heatmap.2 function in R’s (version 3.2.3) gplots package. The MA plot was created in R Studio (R version 3.2.3) by plotting the log10 normalized base mean output from DESeq2 against the LFC.
To represent the differentially repressed and activated genes in development (Lodato et al., 2014) and mature brain (our data), we used Network Analyst (Xia et al., 2015) to generate a chord diagram.
Gene Ontology Analysis
Gene ontology and functional clustering analysis of all differentially expressed genes in mature M1 was performed using the online Database for Annotation, Visualization and Integrated Discovery (DAVID v6.7) tool: functional annotation (Huang et al., 2007). Kyoto Encyclopedia of Genes and Genomes (KEGG) pathway analysis, gene ontology analysis of mature-specific and development-specific (Lodato et al., 2014) Fezf2-regulated genes and mammalian phenotype analysis was performed using WebGestalt (Wang et al., 2013). The details can be found in the Supplementary Methods.
Reverse Transcription and Quantitative PCR
RNA was treated with DNase I prior to cDNA synthesis. Five-hundred nanograms of RNA was added to 1 × DNase I buffer and 2 U of DNase I (Quantabio, Beverly, MA, USA) in a 10 μL reaction. After gentle mixing the reaction was incubated at 37°C for 30 min. One microliter of 10× stop buffer was added and incubated at 65°C for 10 min to inhibit DNase I activity. For cDNA synthesis, 60 μM of random hexamer primers were added to the DNase I treated RNA and incubated at 65°C for 10 min. A reaction mix was prepared with 200 nM dNTPs, 1× reaction buffer and 20 U RNase inhibitor (Roche, New Zealand) and added to each sample. Reverse transcriptase (RT; Roche, New Zealand) was then added (22 U) to each sample with the exception of the –RT negative control. Samples were then incubated at 55°C for 30 min then 85°C for 5 min before cooling samples to 4°C. The resulting cDNA was stored at −20°C.
Quantitative PCR was performed using a Roche LightCycler® 480 SYBR green system. For relative quantification, target genes were amplified from cDNA samples alongside three stable reference genes pre-validated using refFinder (Xie et al., 2012). All primers were designed to span an exon-exon boundary using Primer-BLAST (Ye et al., 2012; Supplementary Table S1). Each reaction contained 3 μL of cDNA (diluted 1:9 in RNase/DNase free H2O), 500 nM of each forward and reverse primer and 1 × LightCycler 480 SYBR Green I master mix (Roche, New Zealand) made to 10 μL with RNase/DNase free H2O. Reactions were loaded in triplicate in a LightCycler® 480 Multiwell −96 or −384 plate (Roche, New Zealand). A no template H2O and –RT negative control reaction was included on each plate for each primer set. The amplification protocol included enzyme activation 95°C for 5 min followed by 50 cycles of 95°C (5 s), 60°C (5 s), 72°C (10 s). Primer efficiencies (Supplementary Table S1) were determined from a standard curve of known cDNA input using the LightCycler® 480 software.
Before relative quantification, standard deviation (SD) was calculated for all triplicates and when a single outlier was >2 SD from the mean it was removed. Mean Cp values were then used for relative quantification using the Pfaffl’s (2001) method, with the ratio of the target gene expressed relative to the geomean of all reference genes.
Statistics
All statistical tests were performed using Prism 6 (Graphpad Software Inc., La Jolla, CA, USA). Unless stated otherwise, a two-tailed t-test was used for statistical analysis of mouse qPCR data. In the case of uneven variance a Mann-Whitney U test was applied. For all statistical analysis in the body of text the average is shown with standard error of the mean.
Results
Lentiviral-Mediated Delivery of shRNA Constructs to the Mouse Primary Motor Cortex (M1)
We recently identified Fezf2 expression in diverse pyramidal neuronal subtypes in layer 5 of the mature M1, including PT-PNs and IT-PNs (Tantirigama et al., 2016). We therefore wanted to reduce Fezf2 expression globally within the mature M1, in order to target all Fezf2-expressing neurons (Figure 1A). As FEZF2 plays an essential role in the developing forebrain (Molyneaux et al., 2005; Hirata et al., 2006; Srinivasan et al., 2012), it was necessary to conditionally disrupt expression in the mature brain. To spatially and temporally restrict Fezf2 knockdown to mature neurons of M1, we used lentiviral mediated-delivery of a mCherry-Fezf2 shRNA or a control mCherry-non-silencing shRNA construct under the regulation of the Synapsin I promoter (LV.SynI.mCherry.shRNA; Figures 1A,B). The spread of the virus and targeting of Fezf2-expressing neurons in vivo was first tested with the injection of LV.Syn.mCherry.non-silencingshRNA in three transgenic Fezf2-Gfp males. Brain sections were analyzed 4-weeks post-injection and the expression of mCherry was observed 1 mm (± 0.13, n = 3) rostral-caudal, inclusive of the two injection sites (Figure 1C). Of the Fezf2-GFP positive cells, 63% (± 1.65, n = 3) were transduced (mCherry-positive).
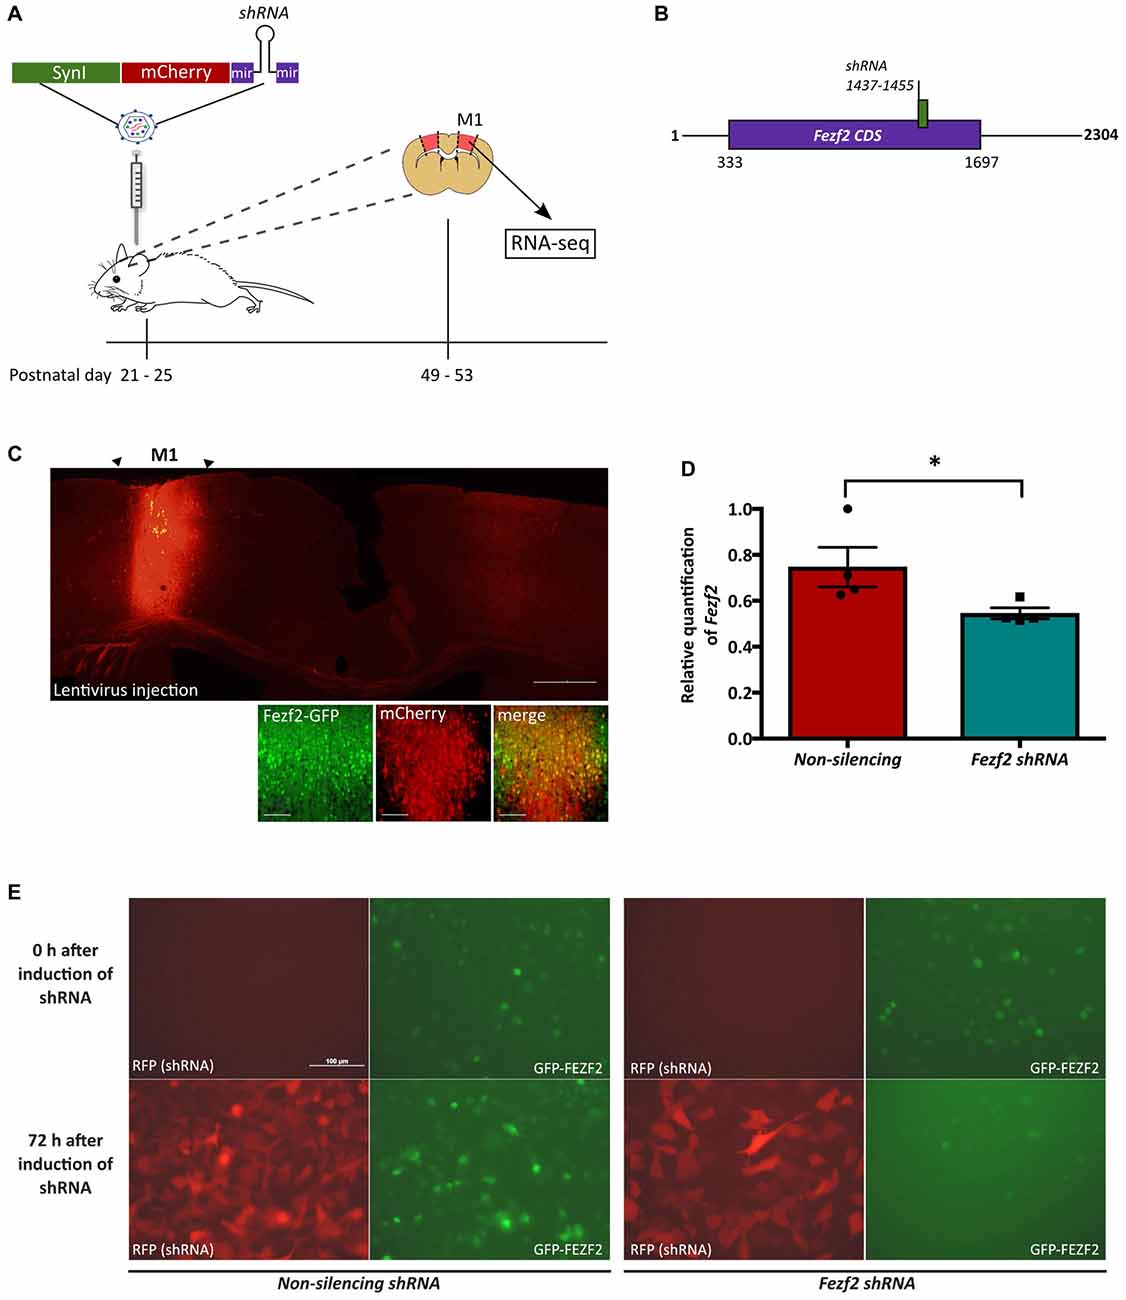
Figure 1. Lentiviral-mediated knockdown of Forebrain embryonic zinc finger 2 (Fezf2) in the mature motor cortex. (A) Male mice aged P21–25 were injected into the primary motor cortex (M1) with lentivirus (LV) expressing a mCherry reporter gene and either a Fezf2 shRNA or non-silencing shRNA. Four weeks post-injection M1 tissue was isolated according to mCherry expression and processed for RNA-seq analysis. (B) Schematic indicating the binding site for the Fezf2 shRNA in the Fezf2 mRNA. (C) Injection of LV.Syn.mCherry.non-silencingshRNA in M1 of Fezf2-Gfp mice validated the successful transduction of Fezf2-expressing neurons. Brain section is from Bregma +0.4. Scale bar is 500 μm or 50 μm (higher magnification images). (D) Quantitative PCR analysis was used to test the shRNA-mediated knockdown of Fezf2 expression in the mature M1 of wildtype male mice (n = 4, 4; *p < 0.05, unpaired one-tailed t-test). (E) Stable HT1080 cells transduced with a green fluorescence protein (GFP)-mFEZF2 fusion construct were induced to express either the Fezf2 shRNA or non-silencing shRNA (control). Images indicate shRNA expression according the RFP reporter and GFP-mFEZF2 expression (GFP) at 0 h and 72 h after the induction of shRNA expression. Scale bar is 100 μm.
When injecting the Fezf2 shRNA into the M1 of Fezf2-Gfp mice, no changes in Fezf2 expression were observed (data not shown). We previously demonstrated an increase in Fezf2 CDS expression in the Fezf2-Gfp mouse model (Tantirigama et al., 2016), which could have affected the shRNA efficiency. Therefore we chose to complete Fezf2 knockdown experiments in wildtype mice. Male Swiss Webster mice (P21–25) were injected in M1 with either LV.Syn.mCherry.Fezf2shRNA LV or LV.Syn.mCherry.non-silencingshRNA (n = 4 of each; Figure 1A). At 4 weeks post-injection, Fezf2-expression was significantly decreased by 27% from 0.75 ± 0.09 (n = 4) in the non-silencing shRNA-treated control M1 samples to 0.55 ± 0.02 (n = 4) in the Fezf2 shRNA-treated samples (p = 0.03, one-tailed t-test; Figure 1D).
The lack of a good FEZF2 antibody prevented direct analysis of decreased protein expression in the M1 tissue. We therefore transduced a GFP-mFEZF2 fusion protein into HT1080 cells to monitor the efficacy of the Fezf2 shRNA on reducing protein levels. Qualitative analysis demonstrates a clear reduction in GFP expression at 72 h after the induction of Fezf2 shRNA expression in cells, whilst no reduction was observed in cells expressing the control non-silencing shRNA (Figure 1E). Additionally, the induction of Fezf2 shRNA expression before transduction of GFP-mFEZF2 maintains reduced GFP levels between 24 h and 72 h of expression (Supplementary Figure S1).
To control for potential off-target effects, the shRNA was checked for specificity. The Fezf2 shRNA showed 100% homology match to mouse Fezf2 using basic local alignment search tool nucleotide (BLASTN, Altschul et al., 1997). There was additional alignment to mouse Zfp523 with a much lower query cover of 73% (Supplementary Table S2). It is considered that any sequence ≥16 nt match (84%) to an off-target sequence would need to be discarded (Moore et al., 2010). As this non-specific alignment has a lower percentage of query cover the shRNA is unlikely to be able to bind to and produce mRNA cleavage.
RNA-Sequencing of Fezf2 shRNA-Treated M1 Tissue Reveal Significant Changes in the Transcriptome Profiles
As Fezf2 is a transcription factor, if it continues to have a role in mature tissue, we hypothesized that even a small change to Fezf2 expression would result in changes to the gene expression profiles of Fezf2-reduced M1 tissue. In order to investigate this, we used RNA-seq to generate transcriptome profiles of the control and Fezf2 shRNA-treated M1 tissue (n = 4 of each). For each library ~55 million total reads were generated. Concordant pair mapping rates to the mouse genome (mm10) were >89% (Table 1), with <8% showing >20 multiple alignments. To ascertain whether Fezf2 knockdown could lead to reproducible changes in the M1 transcriptome, we then performed unsupervised hierarchical clustering analysis on the most variably expressed genes across all Fezf2 shRNA-treated and non-silencing shRNA treated M1 samples, irrespective of their treatment. Accordingly, two main sample clusters were identified, separating samples into knockdown and control groups (Figure 2A).
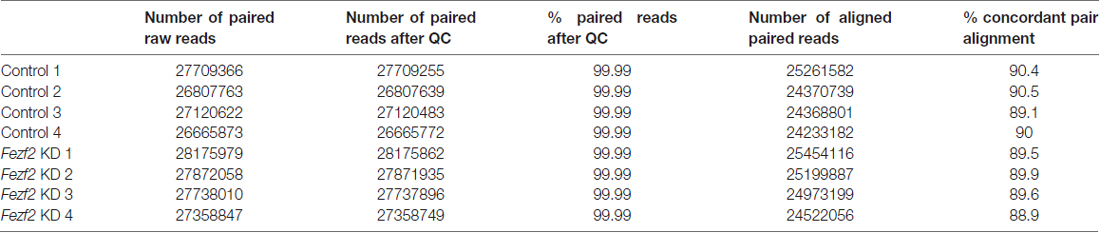
Table 1. Mapping rate of reads generated from RNA-sequencing of Fezf2 shRNA (Fezf2 KD) or non-silencing shRNA (control) treated tissue.
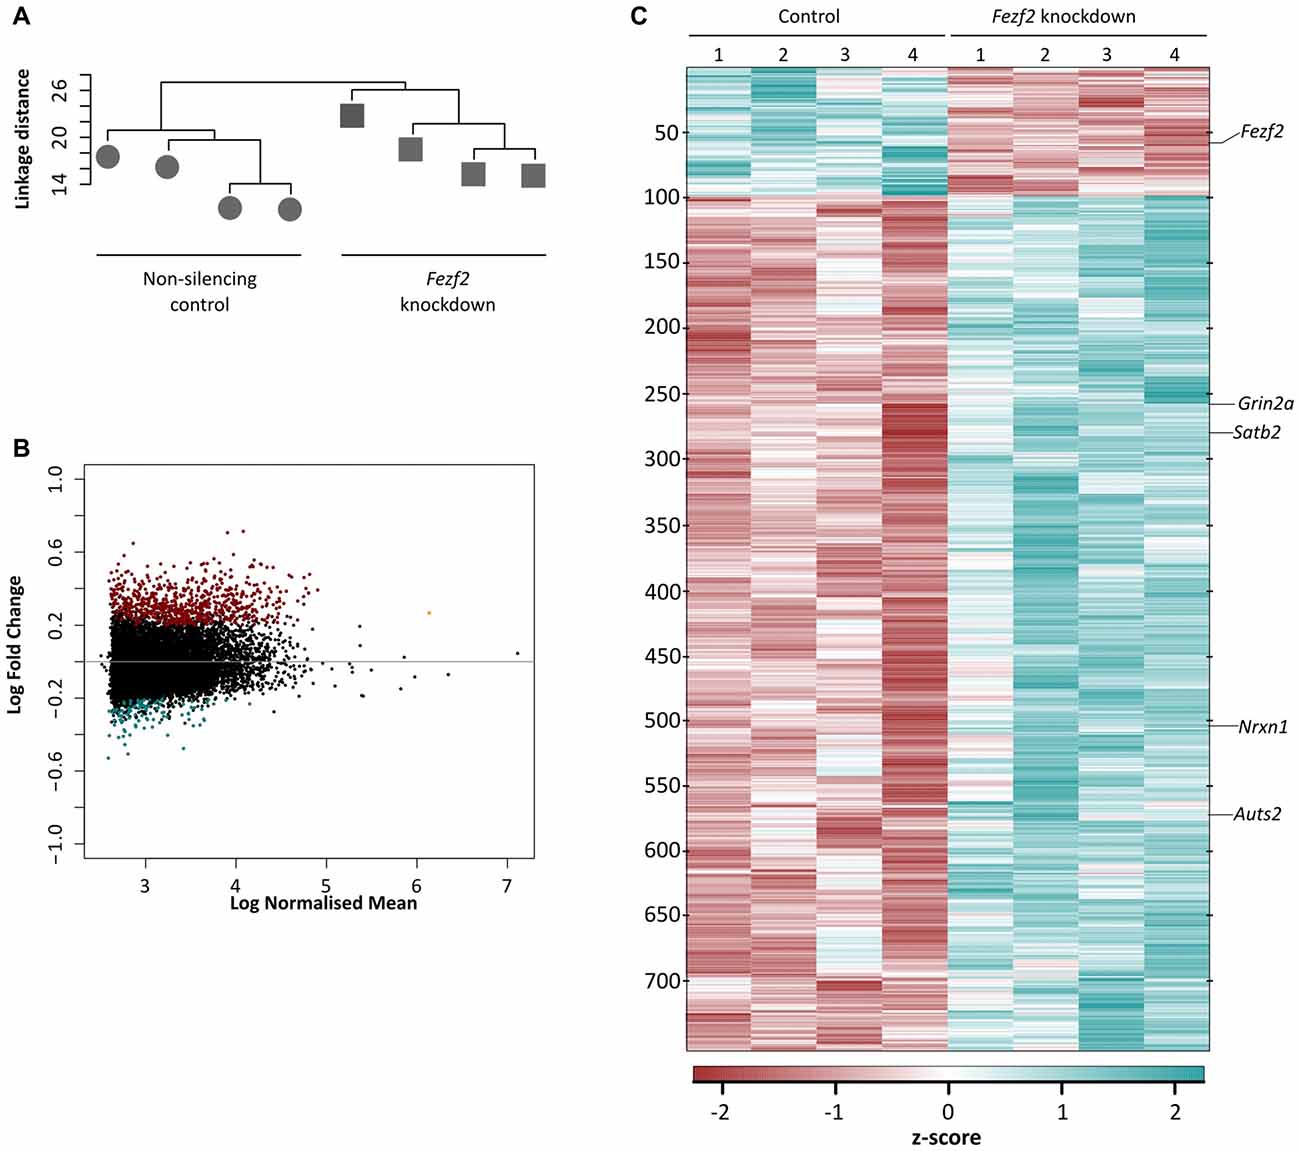
Figure 2. Conditional knockdown of Fezf2 leads to significant changes in the transcriptome profile of M1. (A) Unsupervised hierarchical clustering of the top 8% most variable genes separated the control (non-silencing shRNA; circle) and Fezf2-shRNA treated (square) M1 tissue samples. (B) Heatmap shows the z-score from the transformed counts of each individual sample replicate, for all differentially expressed genes (false discovery rate (FDR) ≤ 0.05; log fold change (LFC) ≥ ± 0.2) identified in Fezf2-reduced M1. (C) MA plot shows (log10) normalized mean of all genes expressed across the M1 samples, plotted against the LFC. Upregulated genes (FDR ≤ 0.05; LFC ≥ 0.2) are in red and downregulated genes (FDR ≤ 0.05; LFC ≥ −0.2) are in blue.
Having identified a clear separation in the transcriptome profiles of control (non-silencing shRNA-treated) and Fezf2 shRNA-treated M1 tissues, we next wanted to determine which gene changes underpinned the sample clustering. We performed DESeq2 differential expression analyses on the M1 transcriptomes and revealed 756 genes to have significantly changed gene expression with the knockdown of Fezf2 (FDR ≤ 0.05, LFC ≥ ± 0.2; Figure 2B heatmap; Supplementary Table S3), suggesting a regulatory role for Fezf2 in the mature M1. The MA plot shown in Figure 2C highlights the genes significantly up- and down-regulated with Fezf2 knockdown (FDR ≤ 0.05, LFC ≥ ± 0.2). For technical validation of RNA-seq, qPCR was used to analyze two randomly selected significantly changed genes, Nrxn1 (p = 0.0013) and Grin2a (p = 0.0571; Figure 3A), and one gene that did not show significant differential expression, Clint1 (p = 0.38). The LFC values obtained from the qPCR data of these three genes and Fezf2 together displayed a significant positive correlation with the LFCs identified from RNA-seq analysis (R2 = 0.97, p < 0.05; Figure 3B), demonstrating technical validation of the RNA-seq platform.
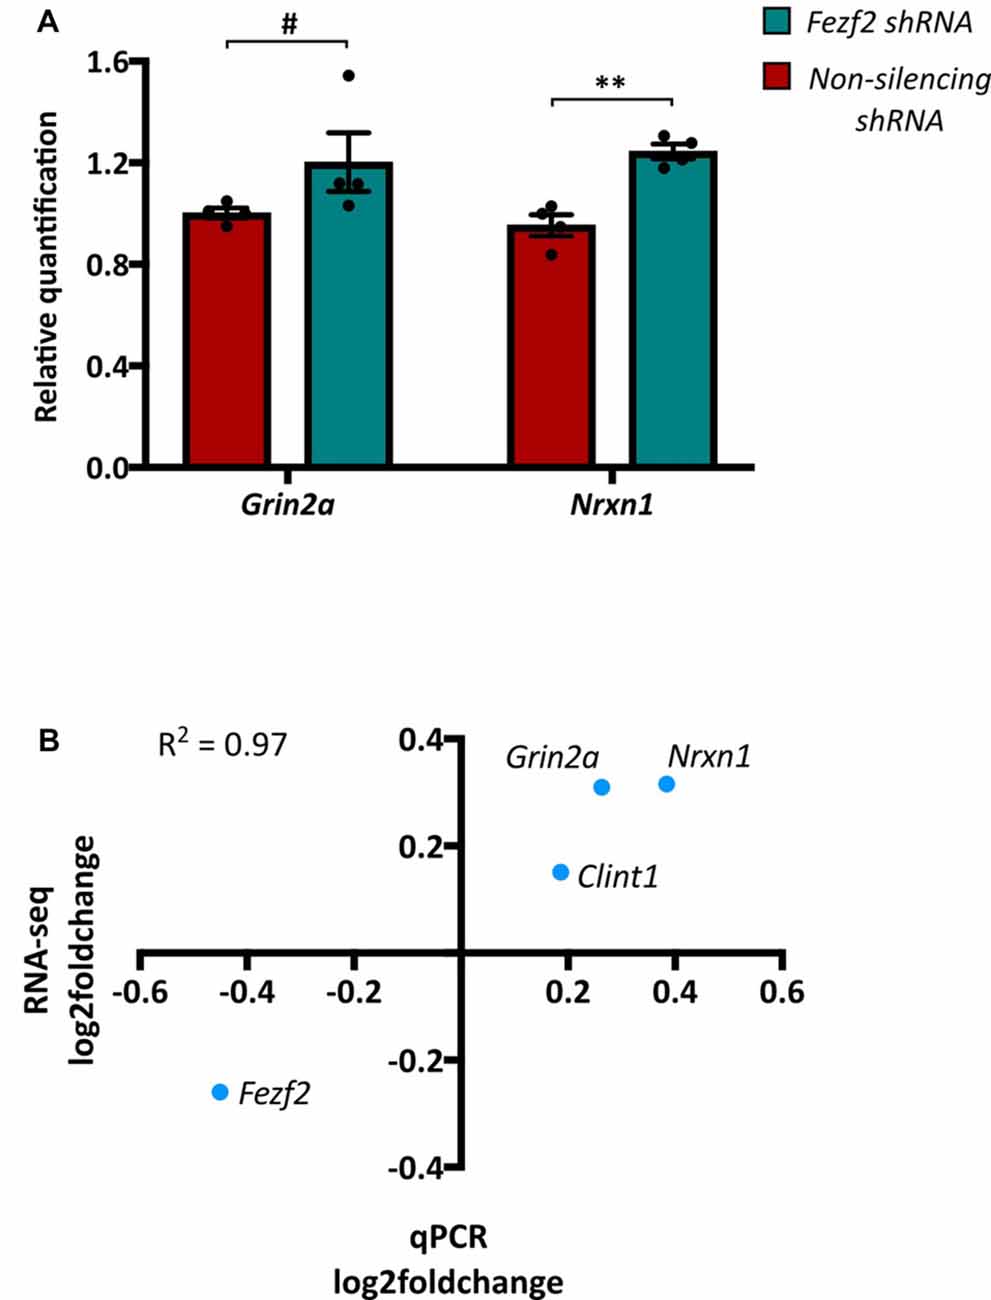
Figure 3. Quantitative PCR validation of RNA-seq data. (A) Two genes, Grin2a and Nrxn1, that were significantly changed between the Fezf2 shRNA and non-silencing shRNA treated M1 tissue, were validated using qPCR (n = 4, 4; **p < 0.01, unpaired two-tailed t-test; #p < 0.1, Mann-Whitney U test). (B) Pearson’s correlation analysis was used to determine the correlation between the LFC values of genes validated by qPCR and those identified by RNA-seq (R2 = 0.97; p < 0.05).
To further corroborate that the observed changes in gene expression were caused by the reduction of Fezf2, we compared our Fezf2-regulated gene list to previously identified direct targets of FEZF2 (Chromatin immunoprecipitation sequencing data; Lodato et al., 2014). Comparisons revealed 65% of the significantly changed genes in mature M1 (FDR ≤ 0.05, LFC ≥ ± 0.2) are direct targets of FEZF2 (Supplementary Table S4), this percentage was similar amongst the Fezf2-regulated genes identified in development (67%; Lodato et al., 2014). Amongst the differentially expressed genes there were known developmental targets of FEZF2, including Satb2 (LFC = 0.26, FDR = 0.02; Figure 2B) and Auts2 (LFC = 0.45, FDR = 0.001; (Srinivasan et al., 2012); Figure 2B). With a number of the deregulated genes in the Fezf2-shRNA treated M1 not known to be direct targets, and several such as Satb2 and Auts2, being transcription factors themselves, it is likely that many of the genes in this dataset could be indirectly affected by the knockdown of Fezf2 expression.
Comparison of Fezf2-Regulated Genes Identified in Developing and Mature Cortical Tissues Reveal a Change in Function
Intriguingly, of the significantly changed genes only 98 had decreased expression (13% of all genes), whilst 658 displayed an increase in expression (87%) after Fezf2 knockdown (Figure 4A). These results indicate that Fezf2 acts predominantly as a transcriptional repressor in the mature M1, whether directly or indirectly. Conversely, microarray analysis of Fezf2 overexpression in the developing cortex indicated a prominent activator role for Fezf2 (79% induced by Fezf2; Lodato et al., 2014). We were therefore interested in comparing our dataset of Fezf2-regulated genes (488 genes) to those identified previously in developing cortical neurons (496 genes; Lodato et al., 2014), focusing specifically on the known direct targets of FEZF2. Our comparison revealed an overlap of only 42 genes between these two datasets (Figure 4B; Supplementary Table S5). All genes activated by Fezf2 in development were repressed in mature tissue (Figure 4B) and of the genes repressed by Fezf2 in development only one became a target of transcriptional activation in mature tissue (Gas5; Figure 4B). The small overlap in Fezf2-regulated genes between developing and mature settings indicates a distinct change in role for FEZF2, which is further supported by the predominant switch in role from activator to repressor.
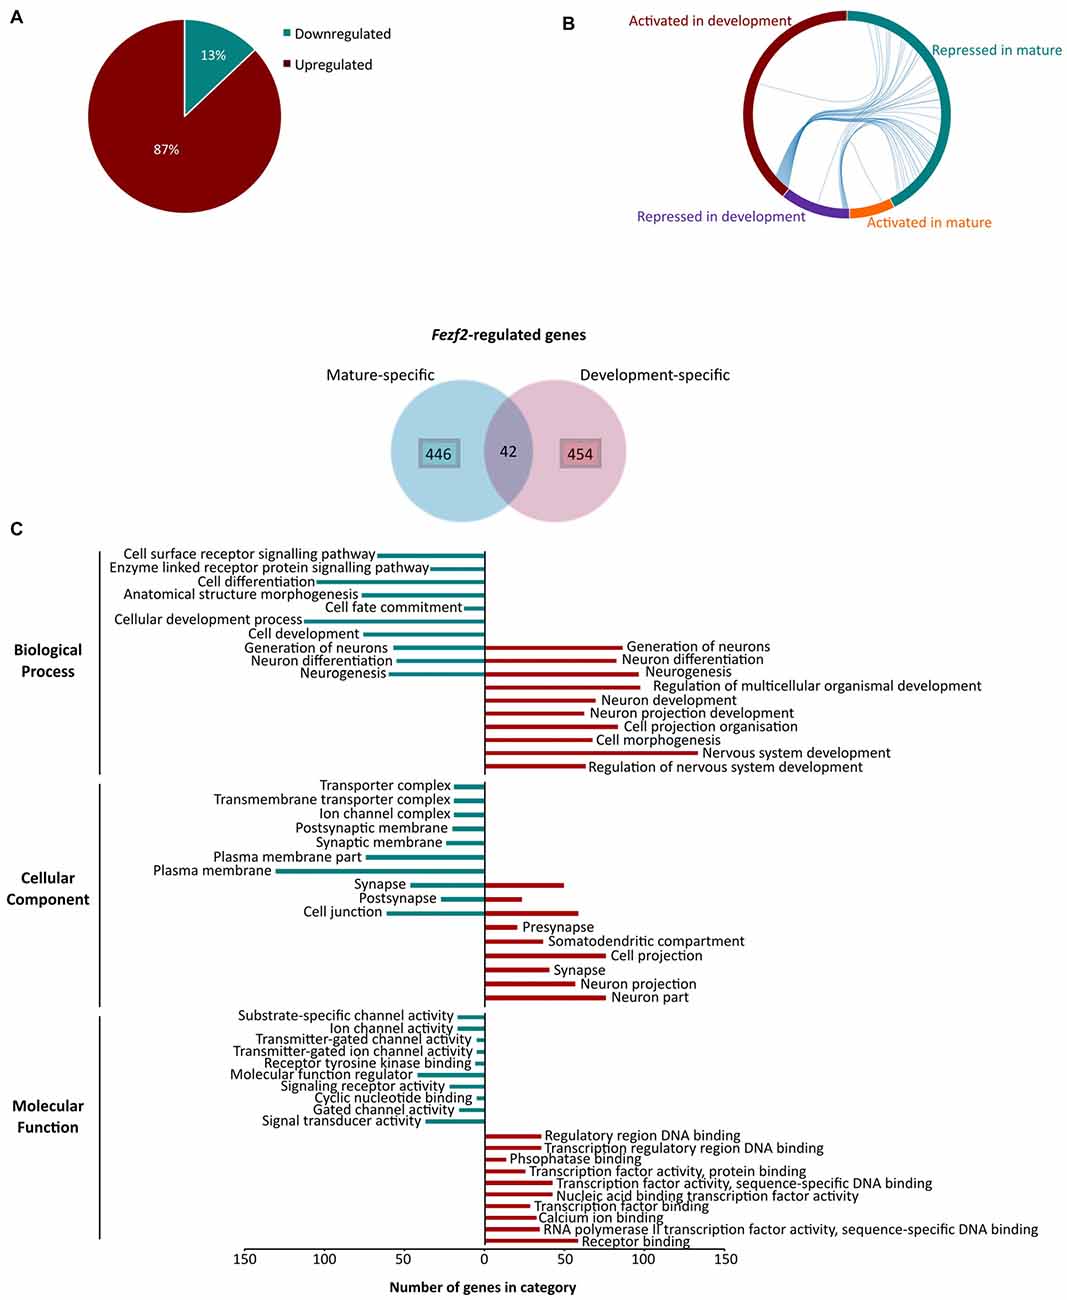
Figure 4. Changes in Fezf2-regulated genes between the developing and mature cortex indicate a switch in function for Fezf2. (A) Analysis of the differentially expressed gene list revealed that most were significantly upregulated (green) after Fezf2 knockdown. (B) Chord diagram shows Fezf2-regulated genes common to both developing (Lodato et al., 2014) and mature tissues. Each line represents a gene and connects the groups in which the gene is present (mature repressed, blue; mature activated, orange; development repressed, purple and development activated, red). (C) Venn diagram shows Fezf2-regulated genes in mature and developing tissue that are known direct targets of FEZF2 (Lodato et al., 2014). To look for differences in the temporal specific Fezf2-regulated genes, gene ontology analysis using WebGestalt was performed on the two groups individually. The number of genes associated with the top 10 significantly enriched GO terms are plotted for mature- (blue) and development-specific (red) genes.
As there was only a small overlap in the Fezf2-regulated genes, we were interested to investigate whether the uniquely expressed genes indicate a change in function, specific to developing or mature neurons. To do this, we performed GO analysis on the Fezf2-regulated genes changed only in development or mature tissue. The top 10 significant biological processes enriched in the development-specific genes indicated a function in nervous system development, including neuron projection development (Figure 4C; Supplementary Table S6). This was corroborated by the cellular component (CC) terms, which were significantly enriched for localization to neuron or cell projection part, suggesting an importance for axonal targeting (Figure 4C; Supplementary Table S6). Analysis of the top enriched molecular function (MF) terms revealed an enriched role for Fezf2-regulated genes in transcription factor activity (Figure 4C; Supplementary Table S6), including factors such as Ctip2 (Bcl11b) that are important for the specification of layer-restricted PN types. This highlights FEZF2’s known key role in the regulatory genetic networks, which direct the correct development of the layered cortex (Srinivasan et al., 2012).
Comparative analysis of the mature M1-specific genes revealed some overlap in the biological process terms of the development-specific genes (e.g., neuron differentiation, neurogenesis), however unique terms identified in this dataset included receptor signaling pathways (Figure 4C; Supplementary Table S6). Accordingly, analysis of the CC terms amongst the mature-specific genes revealed enrichment of localization to the synaptic and postsynaptic membranes as well as ion channel complexes (Figure 4C; Supplementary Table S6). Moreover, analysis of MF terms indicated a unique enrichment of roles in the regulation of ion channel activity amongst the mature-specific genes (Figure 4C; Supplementary Table S6). This term enrichment analysis indicates an important functional role for the Fezf2-regulated mature-specific genes in the transmission of signals and movement of ions, important functions for mature neuron activity.
Together these gene ontology analyses indicate a distinct role for unique Fezf2-regulated genes in the developing and mature cortex, relevant to the environmental setting. This could suggest that the divergence in Fezf2’s role is influenced by additional genetic or epigenetic factors that change between development and maturity.
KEGG Pathway Analysis of Fezf2-Regulated Genes
Having demonstrated significant molecular effects of reducing Fezf2 in the mature M1, and a unique role for the direct FEZF2 targets in mature tissue, we were interested in investigating further the functional role for all Fezf2-regulated genes. We first used the KEGG pathway database to investigate whether the Fezf2-regulated genes were statistically enriched for specific biochemical pathways. Amongst the 756 differentially expressed genes there was significant enrichment of seven KEGG pathways (adjusted p-value ≤ 0.05; Figure 5A; Table 2).
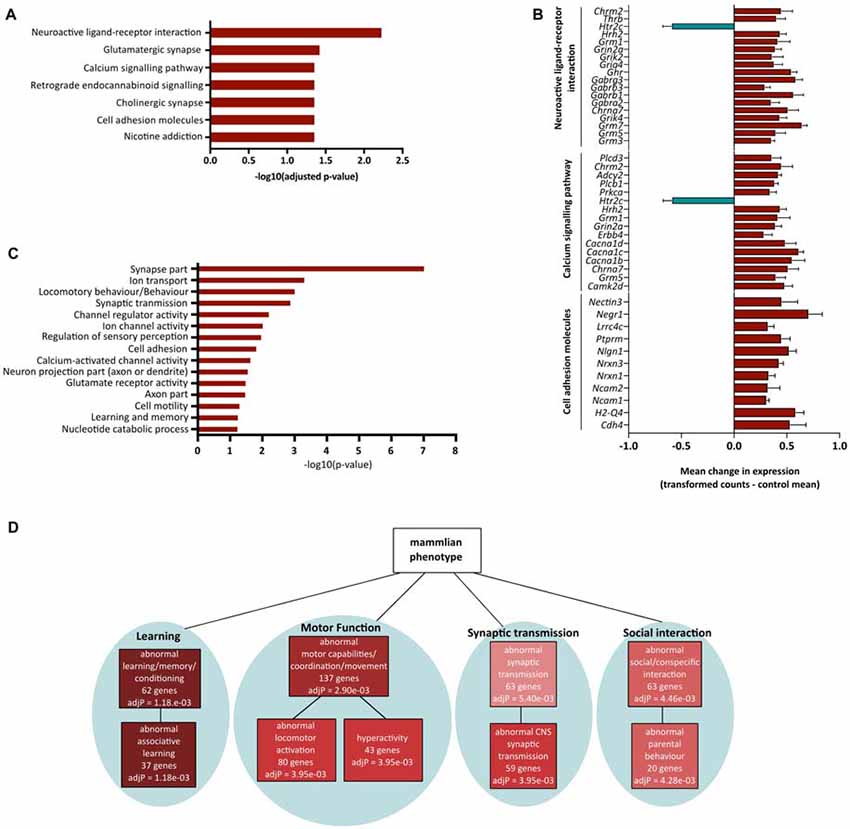
Figure 5. Functional annotation of significantly altered genes after Fezf2 knockdown in mouse M1. (A) KEGG pathway analysis of Fezf2-regulated genes. Seven pathways were significantly enriched (−log10 adjusted p-value ≥ 1.3). (B) Mean change in gene expression (±SEM) for pathway-associated (neuroactive ligand receptor interaction, calcium signaling pathway and cell adhesion molecules) genes differentially expressed in Fezf2-reduced M1. Relative expression is calculated as the transformed counts for each Fezf2-reduced M1 sample—the mean transformed counts of the control samples. (C) Analysis of all the Fezf2-regulated genes using Database for Annotation, Visualization and Integrated Discovery (DAVID) revealed 15 clusters with significant enrichment (−log10 p-value ≥ 1.3). Red dashed line indicates cut-off for significance. (D) Overrepresentation analysis of Fezf2-regulated genes using the mammalian phenotype ontology database. Of the top 10 significant phenotypes enriched four main groups were identified; learning, motor function, synaptic transmission and social behavior. Key indicates significance (adjusted p-value ≤ 0.05).
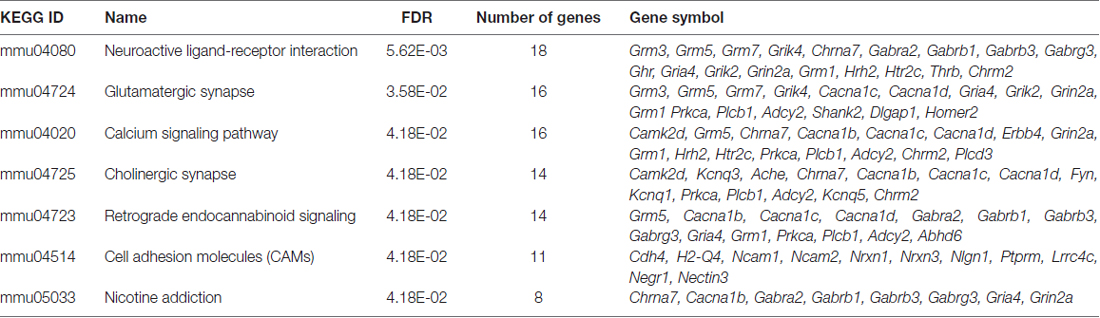
Table 2. Results from Kyoto Encyclopedia Genes and Genomes (KEGG) pathway analysis of Fezf2-regulated genes.
The top significantly overrepresented pathway was neuroactive ligand-receptor interaction (Figure 5A; Table 2). Similarly, there was significant enrichment of the glutamatergic synapse, cholinergic synapse, retrograde endocannabinoid signaling and nicotine addiction pathways (Figure 5A). Together, these pathways included genes important for neurotransmitter signaling, movement of ions at the membrane and synaptic scaffolding (Table 2). The enrichment of this group of pathways provides evidence of a functional role for Fezf2 in regulating neuronal signaling at the synapse.
In addition to the general role for Fezf2-regulated genes in neuronal transmission, two other pathways were significantly overrepresented in this gene set. Sixteen Fezf2-regulated genes were identified in the calcium-signaling pathway (Figure 5A; Table 2), with the dysregulated genes predominantly involved in the calcium transport at the membrane (5/16 genes; Cacna1b, c, d, Grin2a and Chrna7) or triggering intracellular calcium release (9/16 genes; Grm1, Erbb4, Grm5, Htr2c, Prkca, Plcb1, Adcy2, Chrm2 and Plcd3). The nature of the enriched genes in the calcium signaling pathway therefore suggests an importance for Fezf2 in the regulation of calcium flux in neurons, which is important to the plasticity of neurons (Adasme et al., 2011).
Finally, 11 genes were identified in the cell adhesion molecules pathway. Most cell adhesion molecules changed here after Fezf2 knockdown are associated with synaptic interactions (7/11; Ncam1, Ncam2, Nrxn1, Nrxn3, Nlgn1, Negr1 and Nectin3), providing further support to the role for Fezf2 in the regulation of neuronal transmission. The remaining genes were implicated in either neuronal growth cone and axon association (Ptprm and Lrrc4c) or the immune system (H2-Q4; Table 2).
Analysis of the gene expression changes in these pathways revealed nearly all but one of the Fezf2-regulated genes as up-regulated (Figure 5B). These analyses together indicate a negative regulatory role for Fezf2 in neuronal signaling and plasticity in the mature M1.
Gene Ontology Analysis of Fezf2-Regulated Genes
To further investigate enrichment of functional roles for the Fezf2-regulated genes in mature M1, we performed functional annotation clustering based on gene ontology classes using DAVID (Huang et al., 2007). Fifteen significantly overrepresented functional clusters were found (Figure 5C; Supplementary Table S7), which together additionally suggests a functional role for Fezf2 in mediating neuronal transmission and function. For example, clusters included an enrichment of genes involved in synaptic transmission, regulation of ion channel activity and encoding mRNAs that localize to the synapse or axon part (Figure 5C).
In addition to the generalized functional role for Fezf2 in neuronal activity, a significant functional cluster showed an enrichment of genes important for regulating behavior (locomotory, sensory perception and learning/memory; Figure 5C). To examine whether these behavior-related genes have a direct association with specific known phenotypes we performed overrepresentation analysis using the mammalian phenotype ontology database (Smith et al., 2004). Amongst the top 10 significantly overrepresented phenotypes four main groups were identified, abnormal learning/memory, abnormal motor capabilities, abnormal social interaction and abnormal synaptic transmission (Figure 5D; Supplementary Table S8), similar to the findings from the DAVID analysis. However, the use of this database also identified significant overrepresentation of specific behavioral phenotypes associated with these main groups, including abnormal associative learning, hyperactivity and abnormal locomotor activation (Figure 5D; Supplementary Table S8). Based on these results maintaining Fezf2 expression could therefore be functionally important to the normal regulation of behavior, particularly learning and motor behavior.
Discussion
During development, Fezf2 has a defined function regulating the expression of genes important to the correct specification of axonal projection and directing the excitatory fate of CSpPNs in layer 5 of the cortex (Chen B. et al., 2005; Chen J.-G. et al., 2005; Molyneaux et al., 2005; Lodato et al., 2014). Although there is significant understanding of the regulatory role FEZF2 plays in cortical development (Molyneaux et al., 2005; Srinivasan et al., 2012; Guo et al., 2013), the impact of changing Fezf2 gene expression levels in the mature brain has been largely neglected. In this study, we investigated the hypothesis that Fezf2 expression in the mature M1 continues to have an important functional role for the regulation of gene expression. Here, our results demonstrate that reducing Fezf2 expression, specifically in M1, causes significant changes to the transcriptome, altering the expression of genes that collectively have the potential to disrupt normal neuronal function and behavior.
Notably, our dataset reveals a predominant repressor role for Fezf2 in mature M1 (Figure 4A), which is in contrast to the previously observed activator role for Fezf2 in development (Lodato et al., 2014). In accordance with our findings, FEZF2 is a known tumor suppressor gene in mature tissue, with the silencing of FEZF2 expression causative of nasopharyngeal carcinoma and implicated in brain tumors (Shu et al., 2013). This contrast in regulatory function could indicate an important adaptive change for Fezf2 based on tissue state. Certainly, our analyses of the Fezf2-regulated genes identified in developing and mature tissues revealed only a small subset common to both datasets and two distinct sets of genes that together have unique functional roles specific to each environmental setting (Figure 4C). Such a distinctive transition in Fezf2 function could be indicative of an influence from changes in the chromatin landscape that are commonly observed through developing and differentiated cell states. For example, chromatin becomes more compact in differentiated cells (Chen and Dent, 2014), which could refine the binding sites available to FEZF2. However, of the Fezf2-regulated genes common to developing and mature tissue, there was a shift of all genes once activated by Fezf2 to be repressed (Figure 4B). FEZF2 itself could therefore be important for regulating changes to the chromatin state, to allow a switch in activation to repression of the same gene. Transcription factors, once bound to the DNA, can regulate active or repressive changes to chromatin remodeling, dependent on the factors recruited (Brettingham-Moore et al., 2015). For example, transcription factor RUNX1, essential to hematopoietic differentiation, recruits protein arginine methyltransferase 6 (PRMT6) in progenitor cells, which mediates repressive epigenetic modifications to the genes required for differentiation. Once the progenitor cells differentiate, the association of RUNX1 with PRMT6 is lost and a coactivator complex recruited in its place (Herglotz et al., 2013). Fezf2 interacts with members of the corepressor groucho family (Zhang et al., 2014), which can recruit additional factors such as PRMT5 to mediate repressive modifications to the chromatin (Patel et al., 2012). Increased availability and/or increased interaction with such cofactors could facilitate the FEZF2 repressor function in mature tissues.
Changes in gene expression are commonly observed in neurological disease (Wang et al., 2007; Satoh et al., 2014) and may represent negative changes in neural cells. For example, disruption to the expression of genes that dictate neuronal identity could contribute to the progression of neuropsychiatric and neurodegenerative disease (Kadkhodaei et al., 2009; Liu et al., 2010; Song et al., 2011; Deneris and Hobert, 2014; Jaitner et al., 2016). Our previous characterization of the functional phenotypes in Fezf2-expressing neurons of M1 identified a wider action potential in Fezf2-expressing neurons indicating an enhancement of calcium flux in these neurons (Tantirigama et al., 2014, 2016). It was therefore noteworthy to find an enrichment of Fezf2-regulated genes involved in the regulation of calcium flux (Figures 5A,B), a function directly relevant to Fezf2-expressing neuronal phenotypes. Nearly all the Fezf2-regulated genes identified in the calcium-signaling pathway here were upregulated with Fezf2 knockdown, suggesting that Fezf2 is a negative regulator of calcium flux. This negative regulation could have huge importance in maintaining healthy mature neurons, as excessive calcium signaling is a common trait in several neurodegenerative diseases, including ALS (Marambaud et al., 2009). Additional enriched pathways and Gene Ontology analysis also indicated a general functional importance for Fezf2-regulated genes in neuronal signaling and plasticity (Figures 5A,C). The regulation of synaptic transmission and cell signaling is essential to the phenotype of neurons and would therefore indicate a role for Fezf2 in sustaining neuronal phenotypes in the healthy mature M1. It will be interesting to investigate the effects of these gene changes on the functional phenotypes of Fezf2-expressing neurons in M1.
Gene Ontology and Phenotype Ontology analysis of Fezf2-regulated genes additionally indicated a functional role in regulating behavior (Figures 5C,D), with specific behavior phenotypes including abnormal associative learning, abnormal social interaction, abnormal locomotor activation and hyperactivity (Figure 5D). As our work is the first main study of Fezf2’s role in the mature brain, there is currently no research investigating the effects of Fezf2 disruption on adult behavior, though interestingly hyperactivity is a developmental behavioral phenotype observed in Fezf2−/− mice (Hirata et al., 2004). Our findings of enriched associations in the mature M1 Fezf2-regulated genes to highly specific behavior phenotypes indicate that temporal disruption to Fezf2 expression could negatively impact normal behavior.
Conclusion
Here we used lentiviral-mediated conditional knockdown and RNA-seq technologies to provide evidence of a regulatory role for Fezf2 in the mature mammalian brain. Our findings strengthen the idea that active expression of transcription factors is critical for the genetic networks in a healthy adult brain. Through the comparison of genes regulated by Fezf2 in developing and mature tissues we demonstrate dynamic changes in the functional role of Fezf2. Moreover, the overrepresentation analyses of pathway and phenotype datasets, for Fezf2-regulated genes in mature M1, emphasize the potential functional implications of disrupting these gene networks. Together this highlights an importance for identifying and understanding the role of regulatory factors in matured neuronal subtypes.
Accession Code
RNA-seq data, GSE102365.
Author Contributions
AJC, RME and SMH: study concept and design. AJC and HEW performed the experiments and acquired data. AJC, HEW, RME and SMH: analysis and interpretation of the data. AJC: drafting of the manuscript. AJC, SMH, RME and HEW: major critical revisions of the manuscript. All authors had full access to the manuscript and data for approval.
Funding
This research was supported by Royal Society of New Zealand Marsden Fund, UOO0908; University of Otago Research Grant and University of Otago Dean’s Bequest Fund (SMH and RME); University of Otago PhD scholarship to AJC.
Conflict of Interest Statement
The authors declare that the research was conducted in the absence of any commercial or financial relationships that could be construed as a potential conflict of interest.
Acknowledgments
The authors thank Dr. Aaron Jeffs, Dr. Monika Zavodna and Les McNoe from the Otago Genomics and Bioinformatics Facility (OGBF) for preparing and sequencing the cDNA libraries and Dr. Elizabeth Permina (OGBF) for her assistance in establishing a pipeline for analysis of the RNA-seq data. The authors would also like to thank Professor Peter Dearden for his comments on the manuscript.
Abbreviations
CSpPNs, corticospinal projection neurons; EPA, environmental protection agency; Fezf2, Forebrain embryonic zinc finger 2; GFP, green fluorescence protein; IT-PN, intratelencephalic projection neuron; KEGG, Kyoto encyclopedia of genes and genomes; LV, lentivirus; M1, primary motor cortex; PNs, projection neurons; PT-PN, pyramidal tract projection neuron.
Supplementary Material
The Supplementary Material for this article can be found online at: http://journal.frontiersin.org/article/10.3389/fnmol.2017.00283/full#supplementary-material
References
Adasme, T., Haeger, P., Paula-Lima, A. C., Espinoza, I., Casas-Alarcón, M. M., Carrasco, M. A., et al. (2011). Involvement of ryanodine receptors in neurotrophin-induced hippocampal synaptic plasticity and spatial memory formation. Proc. Natl. Acad. Sci. U S A 108, 3029–3034. doi: 10.1073/pnas.1013580108
Alcamo, E. A., Chirivella, L., Dautzenberg, M., Dobreva, G., Fariñas, I., Grosschedl, R., et al. (2008). Satb2 regulates callosal projection neuron identity in the developing cerebral cortex. Neuron 57, 364–377. doi: 10.1016/j.neuron.2007.12.012
Altschul, S. F., Madden, T. L., Schläffer, A. A., Zhang, J., Zhang, Z., Miller, W., et al. (1997). Gapped BLAST and PSI-BLAST: a new generation of protein database search programs. Nucleic Acids Res. 25, 3389–3402. doi: 10.1093/nar/25.17.3389
Arlotta, P., Molyneaux, B. J., Chen, J., Inoue, J., Kominami, R., and Macklis, J. D. (2005). Neuronal subtype-specific genes that control corticospinal motor neuron development in vivo. Neuron 45, 207–221. doi: 10.1016/j.neuron.2004.12.036
Aronesty, E. (2011). ea-utils: command-line tools for processing biological sequencing data. Available online at: https://expressionanalysis.github.io/ea-utils/
Best, H. L., Neverman, N. J., Wicky, H. E., Mitchell, N. L., Leitch, B., and Hughes, S. M. (2017). Characterisation of early changes in ovine CLN5 and CLN6 Batten disease neural cultures for the rapid screening of therapeutics. Neurobiol. Dis. 100, 62–74. doi: 10.1016/j.nbd.2017.01.001
Brettingham-Moore, K. H., Taberlay, P. C., and Holloway, A. F. (2015). Interplay between transcription factors and the epigenome: insight from the role of RUNX1 in leukemia. Front. Immunol. 6:499. doi: 10.3389/fimmu.2015.00499
Britanova, O., de Juan Romero, C., Cheung, A., Kwan, K. Y., Schwark, M., Gyorgy, A., et al. (2008). Satb2 is a postmitotic determinant for upper-layer neuron specification in the neocortex. Neuron 57, 378–392. doi: 10.1016/j.neuron.2007.12.028
Chen, T., and Dent, S. Y. R. (2014). Chromatin modifiers: regulators of cellular differentiation. Nat. Rev. Genet. 15, 93–106. doi: 10.1038/nrg3607
Chen, J.-G., Rasin, M.-R., Kwan, K. Y., and Šestan, N. (2005). Zfp312 is required for subcortical axonal projections and dendritic morphology of deep-layer pyramidal neurons of the cerebral cortex. Proc. Natl. Acad. Sci. U S A 102, 17792–17797. doi: 10.1073/pnas.0509032102
Chen, B., Schaevitz, L. R., and McConnell, S. K. (2005). Fezl regulates the differentiation and axon targeting of layer 5 subcortical projection neurons in cerebral cortex. Proc. Natl. Acad. Sci. U S A 102, 17184–17189. doi: 10.1073/pnas.0508732102
Deneris, E. S., and Hobert, O. (2014). Maintenance of postmitotic neuronal cell identity. Nat. Neurosci. 17, 899–907. doi: 10.1038/nn.3731
Desmaris, N., Bosch, A., Salaün, C., Petit, C., Prévost, M. C., Tordo, N., et al. (2001). Production and neurotropism of lentivirus vectors pseudotyped with lyssavirus envelope glycoproteins. Mol. Ther. 4, 149–156. doi: 10.1006/mthe.2001.0431
Dittgen, T., Nimmerjahn, A., Komai, S., Licznerski, P., Waters, J., Margrie, T. W., et al. (2004). Lentivirus-based genetic manipulations of cortical neurons and their optical and electrophysiological monitoring in vivo. Proc. Natl. Acad. Sci. U S A 101, 18206–18211. doi: 10.1073/pnas.0407976101
Domanskyi, A., Alter, H., Vogt, M. A., Gass, P., and Vinnikov, I. A. (2014). Transcription factors Foxa1 and Foxa2 are required for adult dopamine neurons maintenance. Front. Cell. Neurosci. 8:275. doi: 10.3389/fncel.2014.00275
Fellmann, C., Hoffmann, T., Sridhar, V., Hopfgartner, B., Muhar, M., Roth, M., et al. (2013). An optimized microRNA backbone for effective single-copy RNAi. Cell Rep. 5, 1704–1713. doi: 10.1016/j.celrep.2013.11.020
Gong, S., Zheng, C., Doughty, M. L., Losos, K., Didkovsky, N., Schambra, U. B., et al. (2003). A gene expression atlas of the central nervous system based on bacterial artificial chromosomes. Nature 425, 917–926. doi: 10.1038/nature02033
Guo, C., Eckler, M. J., McKenna, W. L., McKinsey, G. L., Rubenstein, J. L. R., and Bin, C. (2013). Fezf2 expression identifies a multipotent progenitor for neocortical projection neurons, astrocytes, and oligodendrocytes. Neuron 80, 1167–1174. doi: 10.1016/j.neuron.2013.09.037
Han, W., Kwan, K. Y., Shim, S., Lam, M. M., Shin, Y., Xu, X., et al. (2011). TBR1 directly represses Fezf2 to control the laminar origin and development of the corticospinal tract. Proc. Natl. Acad. Sci. U S A 108, 3041–3046. doi: 10.1073/pnas.1016723108
Herglotz, J., Kuvardina, O. N., Kolodziej, S., Kumar, A., Hussong, H., Grez, M., et al. (2013). Histone arginine methylation keeps RUNX1 target genes in an intermediate state. Oncogene 32, 2565–2575. doi: 10.1038/onc.2012.274
Hirata, T., Nakazawa, M., Muraoka, O., Nakayama, R., Suda, Y., and Hibi, M. (2006). Zinc-finger genes Fez and Fez-like function in the establishment of diencephalon subdivisions. Development 133, 3993–4004. doi: 10.1242/dev.02585
Hirata, T., Suda, Y., Nakao, K., Narimatsu, M., Hirano, T., and Hibi, M. (2004). Zinc finger gene fez-like functions in the formation of subplate neurons and thalamocortical axons. Dev. Dyn. 230, 546–556. doi: 10.1002/dvdy.20068
Huang, D. W., Sherman, B. T., Tan, Q., Collins, J. R., Alvord, W. G., Roayaei, J., et al. (2007). The DAVID gene functional classification tool: a novel biological module-centric algorithm to functionally analyse large gene sets. Genome Biol. 8:R183. doi: 10.1186/gb-2007-8-9-r183
Inoue, K., Terashima, T., Nishikawa, T., and Takumi, T. (2004). Fez1 is layer-specifically expressed in the adult mouse neocortex. Eur. J. Neurosci. 20, 2909–2916. doi: 10.1111/j.1460-9568.2004.03763.x
Jaitner, C., Reddy, C., Abentung, A., Whittle, N., Rieder, D., Delekate, A., et al. (2016). Satb2 determines miRNA expression and long-term memory in the adult central nervous system. Elife 5:e17361. doi: 10.7554/eLife.17361
Kadkhodaei, B., Ito, T., Joodmardi, E., Mattsson, B., Rouillard, C., Carta, M., et al. (2009). Nurr1 is required for maintenance of maturing and adult midbrain dopamine neurons. J. Neurosci. 29, 15923–15932. doi: 10.1523/JNEUROSCI.3910-09.2009
Kim, D., Pertea, G., Trapnell, C., Pimentel, H., Kelley, R., and Salzberg, S. L. (2013). TopHat2: accurate alignment of transcriptomes in the presence of insertions, deletions and gene fusions. Genome Biol. 14:R36. doi: 10.1186/gb-2013-14-4-r36
Kwan, K. Y., Šestan, N., and Anton, E. S. (2012). Transcriptional co-regulation of neuronal migration and laminar identity in the neocortex. Development 139, 1535–1546. doi: 10.1242/dev.069963
Li, H., Handsaker, B., Wysoker, A., Fennell, T., Ruan, J., Homer, N., et al. (2009). The sequence alignment/map format and SAMtools. Bioinformatics 25, 2078–2079. doi: 10.1093/bioinformatics/btp352
Linterman, K. S., Palmer, D. N., Kay, G. W., Barry, L. A., Mitchell, N. L., McFarlane, R. G., et al. (2011). Lentiviral-mediated gene transfer to the sheep brain: implications for gene therapy in Batten disease. Hum. Gene Ther. 22, 1011–1020. doi: 10.1089/hum.2011.026
Liu, C., Maejima, T., Wyler, S. C., Casadesus, G., Herlitze, S., and Deneris, E. S. (2010). Pet-1 is required across different stages of life to regulate serotonergic function. Nat. Neurosci. 13, 1190–1198. doi: 10.1038/nn.2623
Lodato, S., Molyneaux, B. J., Zuccaro, E., Goff, L. A., Chen, H.-H., Yuan, W., et al. (2014). Gene co-regulation by Fezf2 selects neurotransmitter identity and connectivity of corticospinal neurons. Nat. Neurosci. 17, 1046–1054. doi: 10.1038/nn.3757
Love, M. I., Huber, W., and Anders, S. (2014). Moderated estimation of fold change and dispersion for RNA-seq data with DESeq2. Genome Biol. 15:550. doi: 10.1186/s13059-014-0550-8
Lucas, A. (2009). Another multidimensional analysis package. Available online at: http://mulcyber.toulouse.inra.fr/projects/amap/
Marambaud, P., Dreses-Werringloer, U., and Vingtdeux, V. (2009). Calcium signaling in neurodegeneration. Mol. Neurodegener. 4:20. doi: 10.1186/1750-1326-4-20
McKenna, W. L., Betancourt, J., Larkin, K. A., Abrams, B., Guo, C., Rubenstein, J. L. R., et al. (2011). Tbr1 and Fezf2 regulate alternate corticofugal neuronal identities during neocortical development. J. Neurosci. 31, 549–564. doi: 10.1523/JNEUROSCI.4131-10.2011
Molyneaux, B. J., Arlotta, P., Hirata, T., Hibi, M., and Macklis, J. D. (2005). Fezl is required for the birth and specification of corticospinal motor neurons. Neuron 47, 817–831. doi: 10.1016/j.neuron.2005.08.030
Molyneaux, B. J., Arlotta, P., Menezes, J. R. L., and Macklis, J. D. (2007). Neuronal subtype specification in the cerebral cortex. Nat. Rev. Neurosci. 8, 427–437. doi: 10.1038/nrn2151
Moore, C. B., Guthrie, E. H., Huang, M. T. H., and Taxman, D. J. (2010). Short hairpin RNA (shRNA): design, delivery, and assessment of gene knockdown. Methods Mol. Biol. 629, 141–158. doi: 10.1007/978-1-60761-657-3_10
Ozdinler, P. H., Benn, S., Yamamoto, T. H., Guzel, M., Brown, R. H. Jr., and Macklis, J. D. (2011). Corticospinal motor neurons and related subcerebral projection neurons undergo early and specific neurodegeneration in hSOD1G93A transgenic ALS mice. J. Neurosci. 31, 4166–4177. doi: 10.1523/JNEUROSCI.4184-10.2011
Patel, S. R., Bhumbra, S. S., Paknikar, R. S., and Dressler, G. R. (2012). Epigenetic mechanisms of Groucho/Grg/TLE mediated transcriptional repression. Mol. Cell 45, 185–195. doi: 10.1016/j.molcel.2011.11.007
Pfaffl, M. W. (2001). A new mathematical model for relative quantification in real-time RT-PCR. Nucleic Acids Res. 29:e45. doi: 10.1093/nar/29.9.e45
Quinlan, A. R., and Hall, I. M. (2010). BEDTools: a flexible suite of utilities for comparing genomic features. Bioinformatics 26, 841–842. doi: 10.1093/bioinformatics/btq033
Robinson, M. D., McCarthy, D. J., and Smyth, G. K. (2010). edgeR: a Bioconductor package for differential expression analysis of digital gene expression data. Bioinformatics 26, 139–140. doi: 10.1093/bioinformatics/btp616
RStudio Team. (2015). RStudio: Integrated Development for R. Boston, MA: RStudio, Inc. Available online at: http://www.rstudio.com
Satoh, J. I., Yamamoto, Y., Asahina, N., Kitano, S., and Kino, Y. (2014). RNA-Seq data mining: downregulation of NeuroD6 serves as a possible biomarker for alzheimer’s disease brains. Dis. Markers 2014:123165. doi: 10.1155/2014/123165
Schoderboeck, L., Riad, S., Bokor, A. M., Wicky, H. E., Strauss, M., Bostina, M., et al. (2015). Chimeric rabies SADB19-VSVg-pseudotyped lentiviral vectors mediate long-range retrograde transduction from the mouse spinal cord. Gene Ther. 22, 357–364. doi: 10.1038/gt.2015.3
Shepherd, G. M. (2013). Corticostriatal connectivity and its role in disease. Nat. Rev. Neurosci. 14, 278–291. doi: 10.1038/nrn3469
Shu, X.-S., Li, L., Ji, M., Cheng, Y., Ying, J., Fan, Y., et al. (2013). FEZF2, a novel 3p14 tumor suppressor gene, represses oncogene EZH2 and MDM2 expression and is frequently methylated in nasopharyngeal carcinoma. Carcinogenesis 34, 1984–1993. doi: 10.1093/carcin/bgt165
Smith, C. L., Goldsmith, C. A. W., and Eppig, J. T. (2004). The mammalian phenotype ontology as a tool for annotating, analyzing and comparing phenotypic information. Genome Biol. 6:R7. doi: 10.1186/gb-2004-6-1-r7
Song, N.-N., Xiu, J.-B., Huang, Y., Chen, J.-Y., Zhang, L., Gutknecht, L., et al. (2011). Adult raphe-specific deletion of Lmx1b leads to central serotonin deficiency. PLoS One 6:e15998. doi: 10.1371/journal.pone.0015998
Spruston, N. (2008). Pyramidal neurons: dendritic structure and synaptic integration. Nat. Rev. Neurosci. 9, 206–221. doi: 10.1038/nrn2286
Srinivasan, K., Leone, D. P., Bateson, R. K., Dobreva, G., Kohwi, Y., Kohwi-Shigematsu, T., et al. (2012). A network of genetic repression and derepression specifies projection fates in the developing neocortex. Proc. Natl. Acad. Sci. U S A 109, 19071–19078. doi: 10.1073/pnas.1216793109
Tantirigama, M. L. S., Oswald, M. J., Clare, A. J., Wicky, H. E., Day, R. C., Hughes, S. M., et al. (2016). Fezf2 expression in layer 5 projection neurons of mature mouse motor cortex. J. Comp. Neurol. 524, 829–845. doi: 10.1002/cne.23875
Tantirigama, M. L. S., Oswald, M. J., Duynstee, C., Hughes, S. M., and Empson, R. M. (2014). Expression of the developmental transcription factor Fezf2 identifies a distinct subpopulation of layer 5 intratelencephalic-projection neurons in mature mouse motor cortex. J. Neurosci. 34, 4303–4308. doi: 10.1523/JNEUROSCI.3111-13.2014
Tsarovina, K., Reiff, T., Stubbusch, J., Kurek, D., Grosveld, F. G., Parlato, R., et al. (2010). The Gata3 transcription factor is required for the survival of embryonic and adult sympathetic neurons. J. Neurosci. 30, 10833–10843. doi: 10.1523/JNEUROSCI.0175-10.2010
Wang, J., Duncan, D., Shi, Z., and Zhang, B. (2013). WEB-based gene set analysis toolkit (WebGestalt): update 2013. Nucleic Acids Res. 41, W77–W83. doi: 10.1093/nar/gkt439
Wang, X.-S., Simmons, Z., Liu, W., Boyer, P. J., and Connor, J. R. (2007). Differential expression of genes in amyotrophic lateral sclerosis revealed by profiling of post mortem cortex. Amyotroph. Lateral Scler. 7, 201–216. doi: 10.1080/17482960600947689
Xia, J., Gill, E., and Hancock, R. E. W. (2015). NetworkAnalyst for statistical, visual and network-based approaches for meta-analysis of expression data. Nat. Protoc. 10, 823–844. doi: 10.1038/nprot.2015.052
Xie, F., Xiao, P., Chen, D., Xu, L., and Zhang, B. (2012). miRDeepFinder: a miRNA analysis tool for deep sequencing of plant small RNAs. Plant Mol. Biol. 80, 75–84. doi: 10.1007/s11103-012-9885-2
Yang, C., Wang, H., Qiao, T., Yang, B., Aliaga, L., Qiu, L., et al. (2014). Partial loss of TDP-43 function causes phenotypes of amyotrophic lateral sclerosis. Proc. Natl. Acad. Sci. U S A 111, E1121–E1129. doi: 10.1073/pnas.1322641111
Ye, J., Coulouris, G., Zaretskaya, I., Cutcutache, I., Rozen, S., and Madden, T. L. (2012). Primer-BLAST: a tool to design target-specific primers for polymerase chain reaction. BMC Bioinformatics 13:134. doi: 10.1186/1471-2105-13-134
Zeisel, A., Muñoz-Manchado, A. B., Codeluppi, S., Lönnerberg, P., La Manno, G., Juréus, A., et al. (2015). Cell types in the mouse cortex and hippocampus revealed by single-cell RNA-seq. Science 347, 1138–1142. doi: 10.1126/science.aaa1934
Zhang, S., Li, J., Lea, R., Vleminckx, K., and Amaya, E. (2014). Fezf2 promotes neuronal differentiation through localised activation of Wnt/β-catenin signalling during forebrain development. Development 141, 4794–4805. doi: 10.1242/dev.115691
Keywords: Fezf2, RNA-seq, motor cortex, mouse, lentivirus, shRNA
Citation: Clare AJ, Wicky HE, Empson RM and Hughes SM (2017) RNA-Sequencing Analysis Reveals a Regulatory Role for Transcription Factor Fezf2 in the Mature Motor Cortex. Front. Mol. Neurosci. 10:283. doi: 10.3389/fnmol.2017.00283
Received: 28 June 2017; Accepted: 22 August 2017;
Published: 07 September 2017.
Edited by:
Michael J. Schmeisser, Otto von Guericke University of Magdeburg, GermanyReviewed by:
Christoph Wiegreffe, University of Ulm, GermanySubhabrata Sanyal, California Life Company (Calico), United States
Copyright © 2017 Clare, Wicky, Empson and Hughes. This is an open-access article distributed under the terms of the Creative Commons Attribution License (CC BY). The use, distribution or reproduction in other forums is permitted, provided the original author(s) or licensor are credited and that the original publication in this journal is cited, in accordance with accepted academic practice. No use, distribution or reproduction is permitted which does not comply with these terms.
*Correspondence: Stephanie M. Hughes, c3RlcGhhbmllLmh1Z2hlc0BvdGFnby5hYy5ueg==