 Simone Mesman
 Marten P. Smidt*
- Swammerdam Institute for Life Sciences, FNWI University of Amsterdam, Amsterdam, Netherlands
The basic helix-loop-helix (bHLH) protein family has previously been shown to be involved in the development of mesodiencephalic dopaminergic (mdDA) neurons in the murine midbrain. Specifically, Ngn2 and Mash1 are known to have a role in the specification of neural progenitors in the ventricular zone (VZ) of the midbrain towards an mdDA neuronal cell-fate. Furthermore, other members of the bHLH protein family, the E-box factors, are expressed in the developing midbrain and are thought to have a role in neuronal differentiation. Here we show that the E-box factor Tcf12 is implicated in early and late development of mdDA neurons. Tcf12 is expressed in the midbrain and in young TH-expressing mdDA neurons throughout development. Tcf12lox/lox;En1cre/+ embryos, that lose Tcf12 at ~embryonic day (E)9 throughout the En1 expression domain, have a changed spatial expression of Lmx1a and Nurr1 and a consistent loss of rostral TH expression. Expression of the subset marker Ahd2 is initially delayed, but recovers during development, eventually showing an ~10% increase in AHD2-expressing cells at postnatal day (P)30. Tcf12lox/lox;Pitx3cre/+ embryos, that lose Tcf12 at ~E12 in post-mitotic mdDA neurons, show no effect on the amount of TH-expressing neurons in the developing midbrain. However, similar as to Tcf12lox/lox;En1cre/+ embryos, subset specification is delayed during development. Taken together, we have identified Tcf12 as a novel factor in mdDA neuronal development. It serves a dual function; one in early cell-fate commitment of neural progenitors and one late in subset specification.
Introduction
The mesodiencephalic dopaminergic (mdDA) system is involved in motor control, reward and motivation in the adult brain. Neurons that make up the mdDA system are thought to arise from neural progenitors present in the ventricular zone (VZ) of the floor plate (FP) and basal plate (BP) of the embryonic midbrain (Ono et al., 2007; Mesman et al., 2014). After birth mdDA neurons migrate towards their final location and acquire a subset-specific identity (Di Salvio et al., 2010; Jacobs et al., 2011; Hoekstra et al., 2013; Smits et al., 2013; Veenvliet et al., 2013), of which the neuroanatomically distinct substantia nigra (SNc) and ventral tegmental area (VTA) are best known, also due to the selective degeneration of the SNc during Parkinson’s Disease (PD; Barzilai and Melamed, 2003).
Signaling molecules, like members of the WNT-family and FGF8, are shown to be important for neural progenitors to acquire an mdDA neuronal fate, and early specification factors, like Lmx1a, Lmx1b, Nurr1 and En1, are known to be crucial to acquire the correct (subset) identity (Smits et al., 2006; Abeliovich and Hammond, 2007; Smidt and Burbach, 2007; Roybon et al., 2008; Allodi and Hedlund, 2014). One specific protein family that is involved in neuronal development is the basic helix-loop-helix (bHLH) protein family (Powell and Jarman, 2008). The bHLH protein family consists of transcription factors with a bHLH domain which allows them to bind DNA by the formation of homo- and heterodimers with other bHLH proteins (Murre et al., 1989; Powell and Jarman, 2008). The function of bHLH proteins depends on their interaction partner and spatio-temporal expression pattern (Powell and Jarman, 2008). Two members of this family, Ngn2 and Mash1, have been show to have a role in the onset of mdDA neuronal development (Andersson et al., 2006a; Kele et al., 2006). Deletion of Ngn2 leads to a delay of mdDA neuronal development, eventually resulting in an underdeveloped mdDA neuronal population with a loss of TH-expressing mdDA neurons in both VTA and SNc (Andersson et al., 2006a; Kele et al., 2006). This phenotype is partially compensated by its family-member Mash1 (Kele et al., 2006), indicating that bHLH proteins function together in mdDA neuronal development.
The bHLH protein family is an enormous family that can be subdivided into different smaller subfamilies (Skinner et al., 2010). One subfamily is the E-box protein family that consists out of three different genes: Tcf12 (Heb), Tcf3 (E2A) and Tcf4 (E2-2, Massari and Murre, 2000). Although these proteins have a broad expression pattern throughout the embryo, most research has been performed to their function in immune system development. E-box proteins have been implicated in differentiation and proliferation during T-cell development. They are important regulators in the coordination of differentiation and proliferation events in the pre-mature T-cell, before further development and fate-commitment (Wojciechowski et al., 2007). Tcf12 regulates the transition of CD4−CD8− double-negative precursor cells to the CD4+CD8+ double-positive stage of development, whereas Tcf3 inhibits the transition from the CD4+CD8+ double-positive to the CD4+ or CD8+ single-positive stage of development, which eventually become part of the different subsets of T-cells present in the immune system (Wojciechowski et al., 2007). In general, loss of one of these factors results in an early depletion of T-cell progenitors and a decrease of mature T-cells. Tcf4 on the other hand has only a minor role in thymocyte development and loss of this gene does not lead to gross effects on the T-cell population (Wojciechowski et al., 2007; Wikström et al., 2008).
During brain development, E-box proteins are thought to regulate common targets for neurogenesis and unique target genes for neuronal subtype development, dependent on their interaction partner and area of expression (Powell and Jarman, 2008). Although a complete loss of Tcf12 and Tcf3 leads to an overall reduction in brain size, the morphology of the brain is preserved in these mutants (Ravanpay and Olson, 2008). Other studies have implied that loss of Tcf12 leads to exencephaly and that, at least in the cortex, Tcf12 is likely involved in sustaining the undifferentiated state of proliferating progenitor cells during neurogenesis (Barndt et al., 2000; Uittenbogaard and Chiaramello, 2002). Loss of Tcf4 was shown to have a relative mild effect on development of a region in the pons (Flora et al., 2007). However, haplo-insufficiency of Tcf4 in humans leads to Pitt-Hopkins Syndrome (Flora et al., 2007; Sweatt, 2013), which is characterized by major defects in cortical development.
In this study, we show that both Tcf12 transcript and TCF12 protein are present in the VZ of the embryonic mesodiencephalic FP and co-localize with young TH-expressing neurons medial in the TH+ neuronal population. We investigated the role of Tcf12 in mdDA neuronal development, by means of conditional deletion of Tcf12 in the midbrain via use of two cre-drivers; the knock-out knock-in En1cre driver for early deletion (~E9) of Tcf12 throughout the En1 expression area (Kimmel et al., 2000), and the knock-out knock-in Pitx3cre driver for late deletion (~E12) of Tcf12 within post-mitotic mdDA neurons (Smidt et al., 2012). En1cre driven deletion of Tcf12 affects the expression of the early mdDA neuronal specification factors Lmx1a and Nurr1, but has no effect on the expression of Ngn2. We detected a loss of mdDA neurons and affected subset specification in the Tcf12lox/lox; En1cre/+ mutants, which continues into adult stages. Pitx3cre driven loss of Tcf12, on the other hand, has no effect on the TH-expressing neuronal population, but does result in a developmental delay of mdDA neuronal subset specification.
Taken together, our data show that the E-box protein Tcf12 is a novel factor involved in the development and specification of mdDA neurons. At early stages of development, it plays an important role in the onset of mdDA neuronal specification and development of TH-expressing neurons, whereas at late stages, it is involved in the start of subset specification and correct timing of expression.
Materials and Methods
Ethics Statement
All animal studies were performed in accordance with local animal welfare regulations, as this project has been approved by the animal experimental committee (Dier ethische commissie, Universiteit van Amsterdam, DEC-UvA), and international guidelines.
Animals
The Tcf12flox (Hebflox) mice strain was a kind gift of Prof Dr. Y. Zhuang from the Department of Immunology of the Duke University Medical Center in Durham, North Carolina (Wojciechowski et al., 2007). Embryos were generated by crossing with En1cre (Kimmel et al., 2000) and Pitx3cre (Smidt et al., 2012) mice strains. WT embryos, to investigate normal expression of Tcf12, were generated by crossing C57BL/6 mice. Pregnant (embryonic day 0.5 (E0.5) is defined as the morning of plug formation) and adult mice were sacrificed by cervical dislocation. Embryos and brains were collected in 1× PBS and immediately frozen on dry-ice, or fixed by immersion for 3–12 h in 4% paraformaldehyde (PFA) at 4°C. After PFA incubation, samples were washed in 1× PBS and cryoprotected O/N in 30% sucrose at 4°C. Embryos and brains were frozen on dry-ice and stored at −80°C. Cryosections were sliced at 16 μm, mounted on Superfrost Plus slides (Thermo Fisher Scientific), air-dried, and stored at −80°C until further use.
Genotyping
Genotyping of the Tcf12flox allele was performed as described (Wojciechowski et al., 2007). PCR was performed with 50 ng of genomic DNA together with FP 5′-CTGGGACAGAAGTTCAGCACTTAGTAC-3′ and RP 5′-CATTCCTATACATCAGCTTCTTGGACG-3′ resulting in a product at 1.1 kb for the WT allele and a product at 1.3 kb for the floxed allele (Supplementary Figure S1A).
Genotyping of the En1cre allele was performed with 50 ng of genomic DNA together with primer pair En1Cre 5UTR_F3 5′-CTTCGCTGAGGCTTCGCTTT-3′ and En1Cre Cre_R2 5′-AGTTTTTACTGCCAGACCGC-3′ resulting in a product at 240 bp for the cre-allele (Supplementary Figure S1B).
Genotyping of the Pitx3cre allele was performed as described (Smidt et al., 2012). PCR is performed in two reactions. The first reaction contained 50 ng of genomic DNA together with primer pair iCre-FP2 5′-GCATGATTTCAGGGATGGAC-3′ and iCre-RP2 5′-ATGCTCCTGTCTGTGTGCAG-3′ resulting in a product at 750 bp for the cre-allele. The second reaction contained 50 ng of genomic DNA together with primer pair Pitx3-exon2–3_FP 5′-CAAGGGGCAGGAGCACA-3′ and Pitx3-exon2-3_RP 5′-GTGAGGTTGGTCCACACCG-3′ resulting in a product at 400 bp for the WT allele (Supplementary Figure S1C).
In Situ Hybridization and Combined TH-DAB IHC
In situ hybridization with digoxigenin (DIG)-labeled probes was performed as described previously (Smidt et al., 2004). Fresh frozen sections were fixed in 4% PFA for 30 min and acetylated with 0.25% acetic anhydride in 0.1 M triethanolamine for 10 min. Probe hybridization was performed at 68°C O/N with a probe concentration of 0.4 ng/μl in a hybridization solution containing 50% deionized formamide, 5× SSC, 5× Denhardt’s solution, 250 μg/ml tRNA Baker’s yeast, and 500 μg/ml sonificated salmon sperm DNA. The following day slides were washed in 0.2 × SSC for 2 h at 68°C followed by blocking with 10% HIFCS in buffer 1 (100 mM TricHCl, pH = 7.4 and 150 mM NaCl) for 1 h at RT. DIG-labeled probes were detected by incubating with alkalin-phosphatase-labeled anti-DIG antibody (Roche, Mannheim), using NBT/BCIP as a substrate. DIG in situ hybridization was performed with the following probes: 965 bp Tcf12 fragment bp 1027–1992 of mouse cDNA, 491 bp Th fragment 252–743 of mouse cDNA, 359 bp Dat fragment bp 762–1127 of rat cDNA, 1796 bp Ahd2 fragment bp 5–1801 of mouse cDNA, 368 bp Cck fragment bp 263–630 of mouse cDNA, 1150 bp fragment Lmx1a bp 218–1366 of mouse cDNA, 2246 bp Nurr1 fragment bp 1–2247 of rat cDNA, and 707 bp Ngn2 fragment bp 98–1002 of mouse cDNA. Slides were washed 2 × 5 min in T10E5, dehydrated with ethanol, and embedded in Entellan.
After DIG in situ hybridization for Tcf12, E12.5, E14.5, and adult WT sections were immunostained for TH. Slides were incubated in 0.3% H2O2 in Tris-buffered saline (TBS) for 30 min at RT. Thereafter, blocking was performed with 4% heat-inactivated fetal calf serum (HIFCS) in TBS. Slides were incubated O/N with primary antibody Rb-TH (Pelfreeze, 1:1000) in TBS. The following day slides were incubated for 1 h with biotinylated goat-anti-rabbit and 1 h with avidin-biotin-peroxidase reagents (ABC Elite kit, Vector Laboratories 1:1000) in TBS. Slides were stained with 3,3′-diamino-benzidine (DAB) for a maximum of 10 min. Slides were dehydrated with ethanol and embedded with Entellan.
Immunohistochemistry
Fluorescence immunohistochemistry was performed as described previously (Kolk et al., 2009; Fenstermaker et al., 2010). Cryosections were blocked with 4% HIFCS or 5% normal donkey serum (for sheep primary antibodies) in 1× THZT and incubated O/N with a primary antibody (Rb-TH (Pelfreeze 1:1000), Sh-TH (Millipore AB1542, 1:1000), Rb-PITX3 ((Smidt et al., 2000) 1:1000), Rb-TCF12 (A-20, Santa Cruz sc-357, 1:250), Rb-Ki67 (Abcam ab15580, 1:500), Rb-PhosphoH3 (Abcam ab5176, 1:1000)). The next day sections were incubated with a secondary Alexafluor antibody (anti-rabbit, anti-sheep) diluted 1:1000 in 1× TBS for 2 h at RT. After washing with 1× PBS, slides were incubated with DAPI (1:3000) 5 min at RT and after extensive washing with 1× PBS embedded in Fluorsave (Calbiogen). Analysis was performed on a fluorescent microscope.
DAB immunohistochemistry on adult sections was performed with Rb-AHD2 (Abcam ab23375 1:1000) as described above, with some alterations. The AHD2 antibody required antigen retrieval as follows. Cryosections were incubated with 0.1 M citrate buffer pH6 for 3 min at 800 W and 9 min a 400 W, cooled down to RT in a water bath. Thereafter slides were blocked in 4% HIFCS in 1× THZT and incubated O/N with a primary antibody. The following day slides were incubated for 1 h with biotinylated goat-anti-rabbit and 1 h with avidin-biotin-peroxidase reagents (ABC Elite kit, Vector Laboratories 1:1000) in TBS. The slides were stained with DAB for a maximum of 10 min. Dehydration was performed with ethanol and embedding with Entellan.
Quantification of Immunohistochemistry
Quantification of TH-, PITX3- and P-H3-expressing cells was performed in ImageJ as follows. TH- and PITX3-expressing cells were counted in 5–10 (matching) sagittal sections of E12.5 and E14.5 embryos (n = 3 Tcf12+/+;En1cre/+/Tcf12+/+; Pitx3cre/+ n = 3 Tcf12lox/lox;En1cre/+/Tcf12lox/lox;Pitx3cre/+). P-H3 expressing cells were counted in 5 (matching) coronal sections of E12.5 embryos (n = 3 Tcf12+/+;En1cre/+ n = 3 Tcf12lox/lox;En1cre/+). Cells were counted as positive, if staining co-localized with a nuclear DAPI staining.
TH- and AHD2-expressing cells in the adult brain were quantified in 6–11 (matching) coronal sections of P30 adult brains (n = 3 Tcf12+/+;En1cre/+/Tcf12+/+;Pitx3cre/+ n = 3 Tcf12lox/lox;En1cre/+/Tcf12lox/lox;Pitx3cre/+). The SNc and VTA were determined based on anatomical landmarks for quantification of the TH-expressing cells. The SNc was clearly determined in sections rostral from the fasciculus retroflexus, whereas the mdDA neuronal population was divided in the VTA and SNc in sections containing and caudal from the fasciculus retroflexus. The distinction between the SNc and VTA was made based on the tracts of the medial lemniscus, positioned in between the SNc and VTA. TH-expressing cells were counted as positive when staining co-localized with nuclear DAPI staining. Quantification of AHD2+ cells performed on DAB-immunohistochemistry cells were counted as positive when they showed specific DAB staining in the cytoplasm.
Quantifications are expressed as percentages of the WT (with WT set at 100%) ± standard deviation. Parametric statistical analysis was performed through a student’s t-test. p < 0.05 was considered significant, and indicated using an asterisk (*).
Results
Tcf12 Is Expressed in the Embryonic Midbrain throughout Development, and Co-Localizes with Young TH-Expressing Neurons
As introduced above, Tcf12 is a member of the E-box protein family, a sub-family of the bHLH protein family. The bHLH protein family-members Ngn2 and Mash1 have been implicated in the development of mdDA neurons (Andersson et al., 2006a; Kele et al., 2006). To determine whether Tcf12 is expressed in the midbrain during mdDA development, we characterized its expression pattern by means of in situ hybridization (Figure 1A). Tcf12 is expressed in the VZ of the midbrain and shows a strong expression in the FP at E11.5 and E12.5. At E12.5, Tcf12 expression overlaps with the TH-expressing population in the most medial sections of the midbrain. At E14.5 the expression of Tcf12 becomes further restricted and, similarly to E12.5, overlaps with the most medial part of the TH-expressing population. In adult mdDA neurons Tcf12 transcript could not longer be detected.
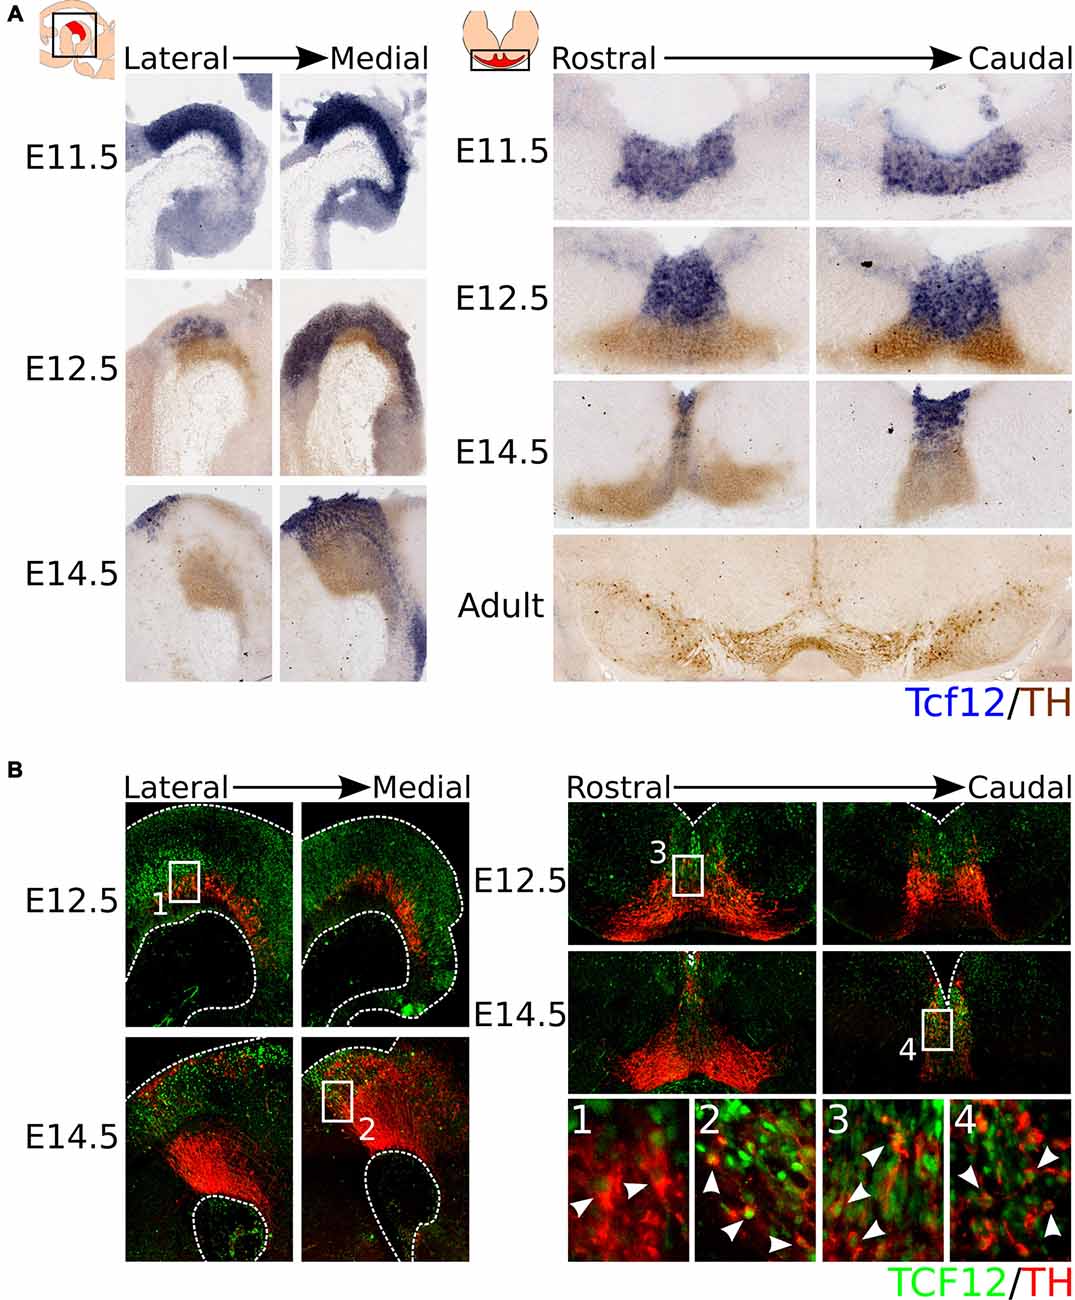
Figure 1. Tcf12 is expressed throughout development in the midbrain and overlaps with the medial TH-expressing population, reflected in TCF12 protein expression. (A) In situ hybridization of Tcf12 (blue) combined with immunohistochemistry for TH (brown) throughout development and in the adult midbrain. Tcf12 is expressed in the embryonic midbrain from E11.5 until E14.5, but expression is not detected in adult mesodiencephalic dopaminergic (mdDA) neurons. (B) Combined immunohistochemistry for TCF12 (green) and TH (red) in E12.5 and E14.5 midbrain. TCF12 protein expression is similar to Tcf12 transcript expression at E12.5 and E14.5. Expression of TCF12 co-localizes with medially located TH-expressing neurons at E12.5 (1,3, white arrowheads), which becomes further restricted to the most caudal and medial parts of the midbrain at E14.5 (2,4, white arrowheads).
In order to confirm the expression pattern of Tcf12, we performed immunohistochemistry for TCF12 protein in combination with TH at E12.5 and E14.5. TCF12 protein is present in a similar pattern as Tcf12 transcript and in concordance co-localizes with part of the medial TH-expressing population (Figure 1B). At E12.5, TCF12 is present in the VZ of the midbrain, and is highly expressed in the FP. Co-localization with TH is detected in both caudally and rostrally (Figures 1B1,3 respectively, white arrowheads) located TH+ neurons in the medial part of the midbrain. At E14.5 the expression of TCF12 becomes even more restricted to the medial part of the midbrain and shows co-localization with caudally localized TH+ neurons (Figures 1B2,4, white arrowheads).
Together, these data show that Tcf12 transcript and TCF12 protein are present within the midbrain region and co-localize with part of the TH-expressing neuronal population at E12.5 and E14.5. TH+/TCF12+ neurons are mostly located in the caudal-medial part of the midbrain area. Since TH-expressing neurons are thought to arise from the FP and BP from E10 onwards and then migrate to more lateral and rostral parts of the midbrain (Ono et al., 2007; Bye et al., 2012; Mesman et al., 2014), the expression pattern of TCF12 suggests that co-localization with TH only occurs in relative young TH+ neurons and that Tcf12 may serve a function in the initial phases of differentiation of neural progenitors towards the mdDA neuronal phenotype.
Early Loss of Tcf12 Affects the Expression of the Early mdDA Neuronal Specification Factors Lmx1a and Nurr1
As shown above, expression of Tcf12 is mainly present in the VZ and shows co-localization with relative young TH+ neurons, indicating that it coincides with the area in the midbrain that generates mdDA neurons. To confirm that Tcf12 could serve an early function in mdDA neuronal development, we examined whether the expression of Tcf12 resembles the expression of known early specification factors in the midbrain (Figure 2A).
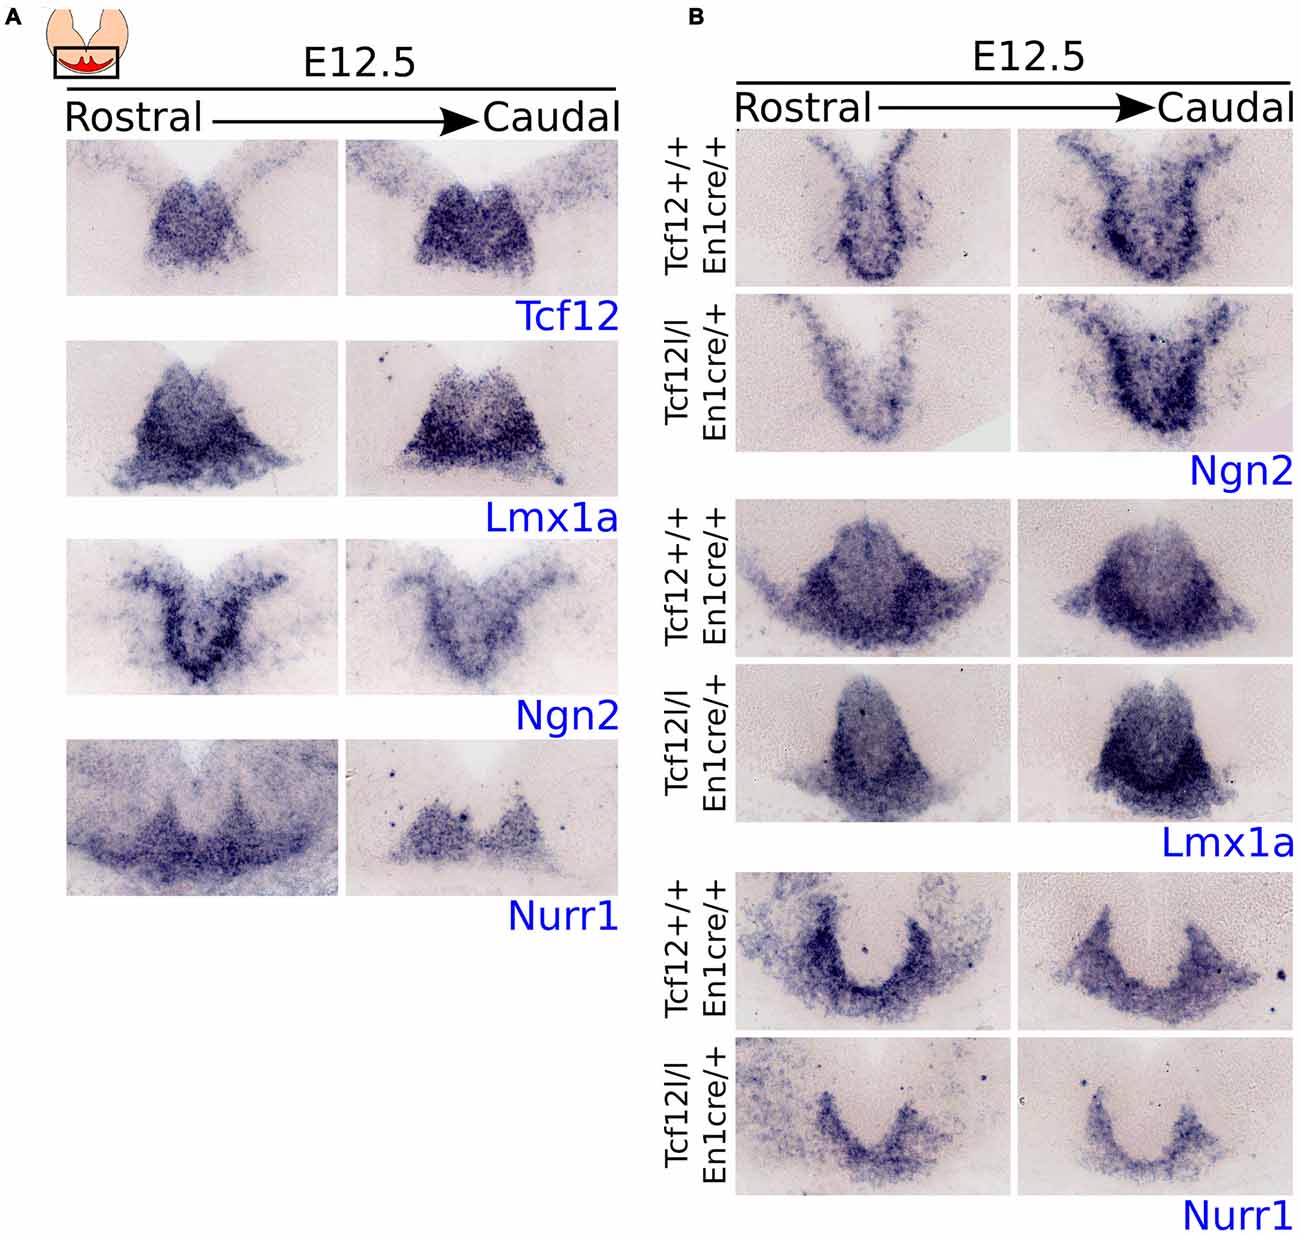
Figure 2. Tcf12 expression overlaps with the expression of early specification factors in the midbrain and En1cre driven deletion of Tcf12 affects the expression of Lmx1a and Nurr1 but not of Ngn2. (A) In situ hybridization of Tcf12 (blue), Lmx1a (blue), Ngn2 (blue) and Nurr1 (blue) at E12.5 in the midbrain. Tcf12 expression overlaps almost completely with the expression of Lmx1a and partially with Ngn2. The expression of Nurr1 overlaps only slightly in the medial parts with Tcf12. (B) In situ hybridization of Ngn2 (blue), Lmx1a (blue) and Nurr1 (blue) in Tcf12lox/lox;En1cre/+ mutants at E12.5. En1cre driven loss of Tcf12 does not affect the expression pattern of Ngn2, but spatially decreases the expression area of Lmx1a and Nurr1.
Expression of Tcf12 overlaps almost completely with the expression pattern of Lmx1a and partly with Ngn2, both important in the early specification of mdDA neurons (Andersson et al., 2006a; Kele et al., 2006; Yan et al., 2011), at E12.5 (adjacent sections). Both factors show a slightly larger area of expression than Tcf12, mainly in the ventral region of the expression area of Tcf12. Nurr1, an important intrinsic differentiation factor of mdDA neurons (Saucedo-Cardenas et al., 1998; Andersson et al., 2007; Kim et al., 2007), on the other hand, overlaps only minimally at the medial parts of Tcf12 expression at E12.5 (adjacent sections). This expression pattern supports the idea that Tcf12 is mainly involved in relative early events of the development of mdDA neurons.
The expression pattern of Tcf12 combined with the expression patterns of early specification factors strongly suggests a role for Tcf12 in relative early development of mdDA neurons. In order to examine the effect of early loss of Tcf12 on the expression of these factors we crossed the Tcf12flox with the En1cre driver (Tcf12lox/lox;En1cre/+). En1 is broadly expressed in the midbrain and R1 from ~E9 onwards (Wurst et al., 1994; Kouwenhoven et al., 2016), resulting in a broad and relative early loss of Tcf12. En1cre driven loss of Tcf12 does not display a difference in the expression of Ngn2 in the midbrain area at E12.5 (Figure 2B, upper panel), whereas in adjacent sections we detected a spatial difference in the expression pattern of both Lmx1a (Figure 2B, middle panel) and Nurr1 (Figure 2B, lower panel). This effect was seen in at least 2 different litters. The Lmx1a expression area is smaller in the midbrain of Tcf12lox/lox;En1cre/+ embryos compared to Tcf12+/+;En1cre/+ embryos and lacks lateral expression (Figure 2B, middle panel). The expression of Nurr1 shows a decrease in the area of expression, and similar to the expression of Lmx1a, the main effect on the expression of Nurr1 can be detected in the lateral parts (Figure 2B, lower panel). Together, these data suggest that Tcf12 influences the expression of other essential early specification factors in mdDA neuronal development.
En1cre Driven Loss of Tcf12 Results in a Delay of mdDA Neuronal Development
Above we have shown that En1cre driven deletion of Tcf12 results in a spatial difference in expression of Lmx1a and Nurr1, which are both essential determinants of mdDA neuronal differentiation and subset specification (Saucedo-Cardenas et al., 1998; Andersson et al., 2006b, 2007; Kim et al., 2007; Hoekstra et al., 2013). Since Nurr1 is expressed in mdDA neurons and deletion of Nurr1 results in a complete loss of TH-expression in mdDA neurons (Saucedo-Cardenas et al., 1998; Smits et al., 2003), we examined the effect of the loss of Tcf12 on the appearance of mdDA neurons in the Tcf12lox/lox;En1cre/+ mutant at E12.5 and E14.5, by examining the spatio-temporal protein levels of the mdDA neuronal markers TH and PITX3. At E12.5 the presence of TH (Figures 3A1,2) and PITX3 (Figures 3A3,4) is decreased with ~66% (n = 3; p < 0.001, one-tailed t-test; Figure 3C E12.5) and ~82% (n = 3; p < 0.001, one-tailed t-test; Figure 3D E12.5; Absolute numbers are represented in Supplementary Figures S2A–D), respectively. At E14.5 the loss of TH-expressing neurons has recuperated (Figure 3B) to a ~33% decrease (n = 3; p < 0.001, one-tailed t-test; Figure 3C E14.5), whereas the loss of PITX3+ neurons is recovered at E14.5 (n = 3; Figures 3B,3,4,D, E14.5). The decrease in TH+ neurons at E14.5 can mainly be detected in the rostral parts of the TH-expressing population (Figures 3B,1,2). Double-labeling of TH and PITX3 at E14.5 shows that the amount of TH+/PITX3+ neurons in the total PITX3-expressing population is ~68% in Tcf12+/+;En1cre/+ embryos and has decreased to ~50% in the Tcf12lox/lox;En1cre/+ embryos (n = 3; p < 0.01 one-tailed t-test; Figure 3E), showing that the population TH+/PITX3+ neurons has decreased in the mutant. This effect is most prominent in the rostral population of PITX3-expressing neurons (Supplementary Figure S3).
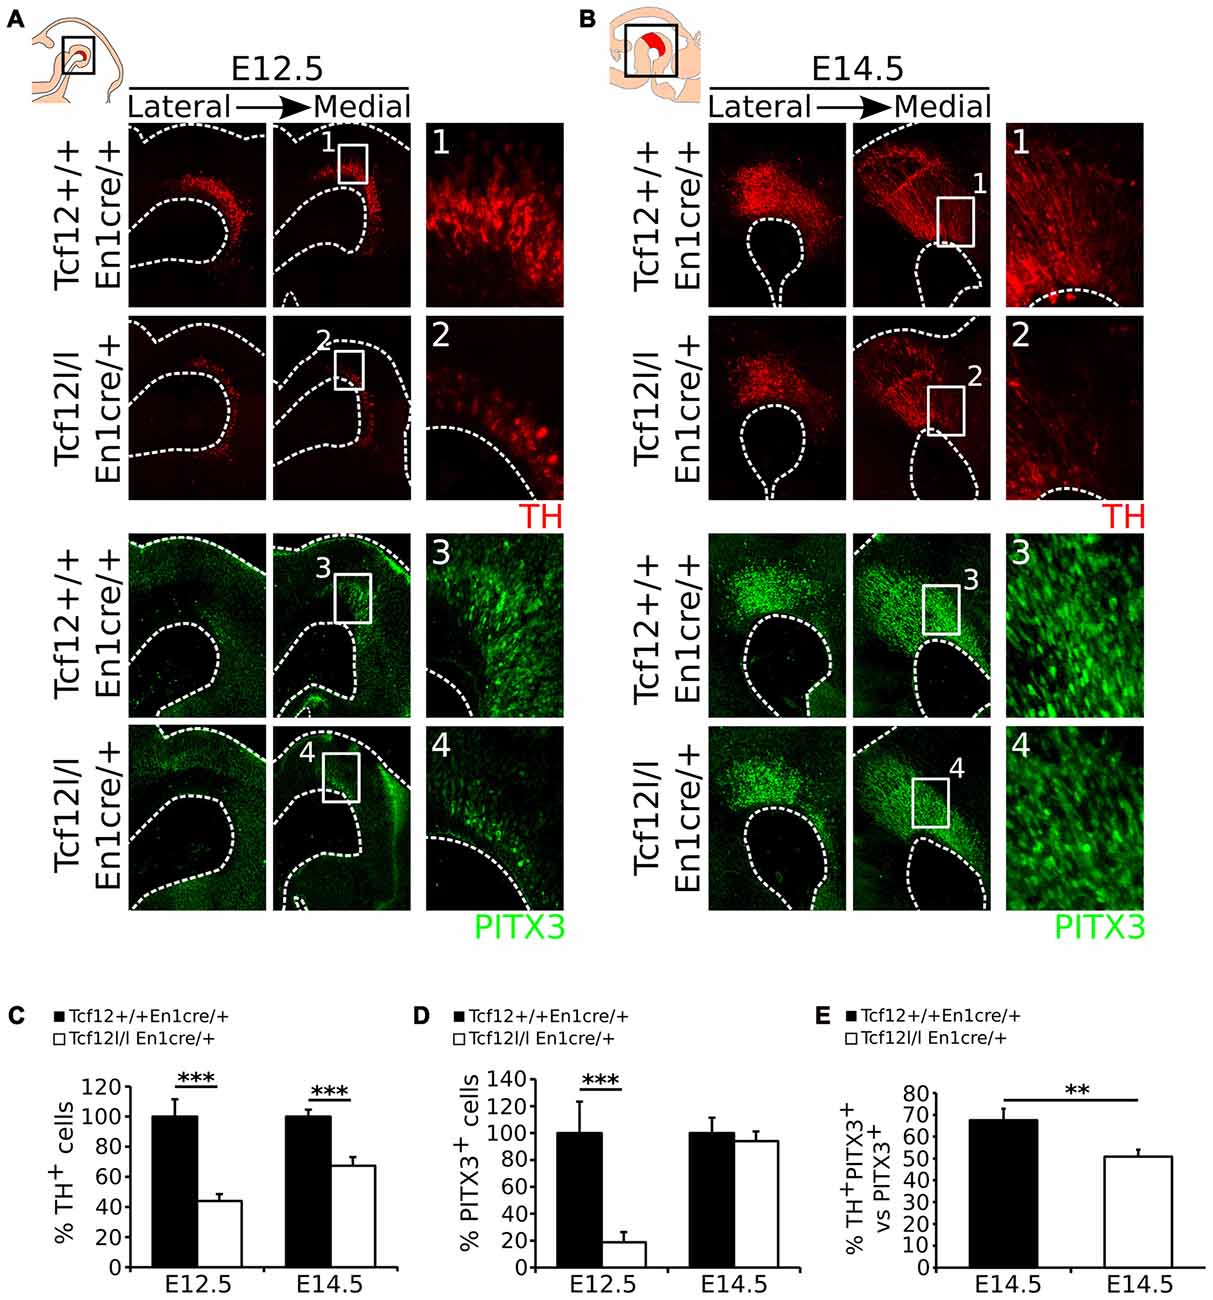
Figure 3. En1cre driven loss of Tcf12 results in a delay in mdDA neuronal cell-fate specification. (A) Immunohistochemistry for TH (red) (1,2) and PITX3 (green) (3,4) in Tcf12lox/lox;En1cre/+ E12.5 embryos shows a decrease of both markers. (B) Immunohistochemistry for TH (red) and PITX3 (green) in Tcf12lox/lox;En1cre/+ E14.5 embryos shows a rostral decrease in TH expression (1,2), although the population of PITX3+ neurons is recovered (3,4). (C) Quantification of the TH-expressing cell population at E12.5 and E14.5. The amount of TH-expressing cells is decreased with ~66% at E12.5 (n = 3; ***p < 0.001, one-tailed), which is recuperated to a ~33% decrease at E14.5 (n = 3; ***p < 0.001 one-tailed) in Tcf12lox/lox;En1cre/+ (white bars) compared to Tcf12+/+;En1cre/+ embryos (black bars). Tcf12+/+;En1cre/+ was set at 100%. (D) Quantification of the PITX3-expressing cell population at E12.5 and E14.5. The amount of PITX3-expressing cells is decreased with ~82% at E12.5 (n = 3; ***p < 0.001, one-tailed), which is completely recovered at E14.5 in the Tcf12lox/lox;En1cre/+ (white bars) compared to Tcf12+/+;En1cre/+ embryos (black bars). Tcf12+/+;En1cre/+ was set at 100%. (E) Quantification of TH+/PITX3+ cells compared to the total population of PITX3+ cells. The amount of TH+/PITX3+ cells is significantly decreased in Tcf12lox/lox;En1cre/+ embryos at E14.5. In Tcf12+/+;En1cre/+ embryos (black bar) the amount of TH+/PITX3+ neurons comprises ~68% of the total PITX3-expressing population, whereas in Tcf12lox/lox;En1cre/+ embryos (white bar) this is decreased to ~50% (n = 3; **p < 0.01, one-tailed).
Together, these data show that deletion of Tcf12 in the En1 expression domain results in a delay of expression of the mdDA markers TH and PITX3, which partly (TH) or even completely (PITX3) recovers during development.
Tcf12 Does Not Influence the Proliferative Capacity of the Midbrain Region
Since Tcf12 is known to be important in regulation of proliferation and differentiation of T-cells in the immune system and possibly cortical neurons (Uittenbogaard and Chiaramello, 2002; Wojciechowski et al., 2007) and we detected a delay in mdDA neuronal specification, we examined the effect on En1cre driven loss of Tcf12 on the proliferation of neural progenitors in the VZ. MdDA neurons are born from E10 onwards, with neuronal birth peaking at E11-E12 (Bayer et al., 1995; Bye et al., 2012). If the apparent delay in mdDA neuronal differentiation is the result in a delay of proliferation, we would expect that the level of cells that are positive for PhosphoH3 (P-H3) and/or Ki67, both markers for proliferation, would be increased in the mutant animals at E12.5. However, we were not able to detect a clear increase in either P-H3 (Figures 4A1,2,B, Supplementary Figure S2E) or Ki67 (Figures 4A3,4) in the midbrain area between the Tcf12lox/lox;En1cre/+ mutant and Tcf12+/+;En1cre/+ embryos at E12.5, suggesting that the effects found on TH and PITX3 protein are not a consequence of large changes in proliferation.
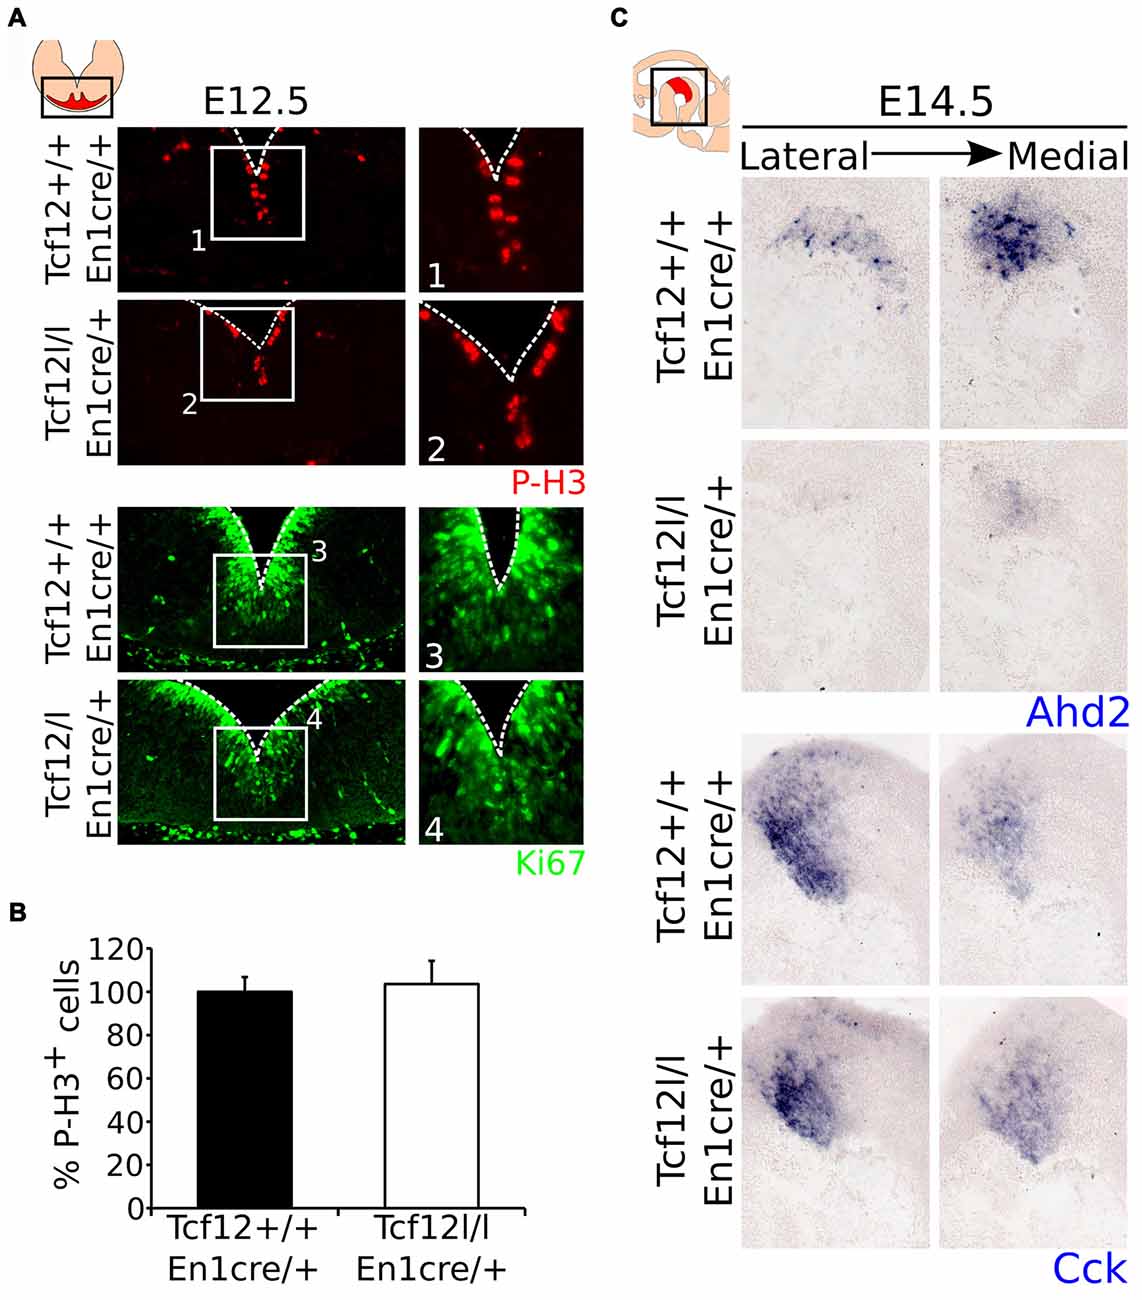
Figure 4. Proliferation is not affected in the ventricular zone (VZ) of the En1cre driven Tcf12 mutant and subset specification is mainly affected in the rostral mdDA population. (A) Immunohistochemistry of the proliferation markers P-H3 (red) and Ki67 (green) in the murine midbrain at E12.5 shows no apparent difference between Tcf12lox/lox;En1cre/+ and Tcf12+/+;En1cre/+ embryos (n = 3). (B) Quantification of the P-H3 expressing cells in the embryonic midbrain at E12.5 shows no difference between the Tcf12lox/lox;En1cre/+ (white bar) and the Tcf12+/+;En1cre/+ (black bar) embryos. Tcf12+/+;En1cre/+ was set at 100%. (C) In situ hybridization of Ahd2 and Cck in the mutant midbrain at E14.5. Expression of the subset marker Ahd2 (blue, upper panel) is heavily affected, whereas expression of Cck (blue, lower panel) is relatively unaffected in Tcf12lox/lox;En1cre/+ embryos.
Tcf12 Influences the Differentiation Program of mdDA Neurons
As described above, we detected a delay in the development of mdDA neurons unrelated to proliferation defects. This suggests that the differentiation of mdDA neurons is affected and the underlying genetic programming may be altered as well. Since rostral TH expression is still affected at E14.5, whereas the presence of PITX3 is restored, we examined the expression of Ahd2, a marker for the rostral mdDA neuronal population and involved in RA dependent Th gene activation (Jacobs et al., 2007, 2011), and Cck, a marker for the caudal mdDA neuronal population (Veenvliet et al., 2013), in order to validate the programming of emerging mdDA neurons in these mutants. Expression of Ahd2 is strongly decreased (Figure 4C, upper panel), whereas the expression of Cck is relatively unaffected at E14.5 in these mutants (Figure 4C, lower panel), suggesting that rostral mdDA neurons do not only lose expression of TH, but also do not express Ahd2 at this stage. Taken together, the presented data suggest that Tcf12 causes a delay in programming and affects the rostral subgroup by an absence of Ahd2 expression at E14.5. To further substantiate the initial programming defects observed at E14.5 we examined the expression of Ahd2 and Cck at E16.5 and of Th, Dat, Ahd2, and Cck at P30 (Figure 5). At E16.5 expression of Ahd2 (Figure 5A, left panel) is partially recovered compared to its expression at E14.5. However, the expression pattern is still affected compared to controls. Similar as described for E14.5, Cck is normally expressed in the E16.5 embryonic midbrain (Figure 5A, right panel).
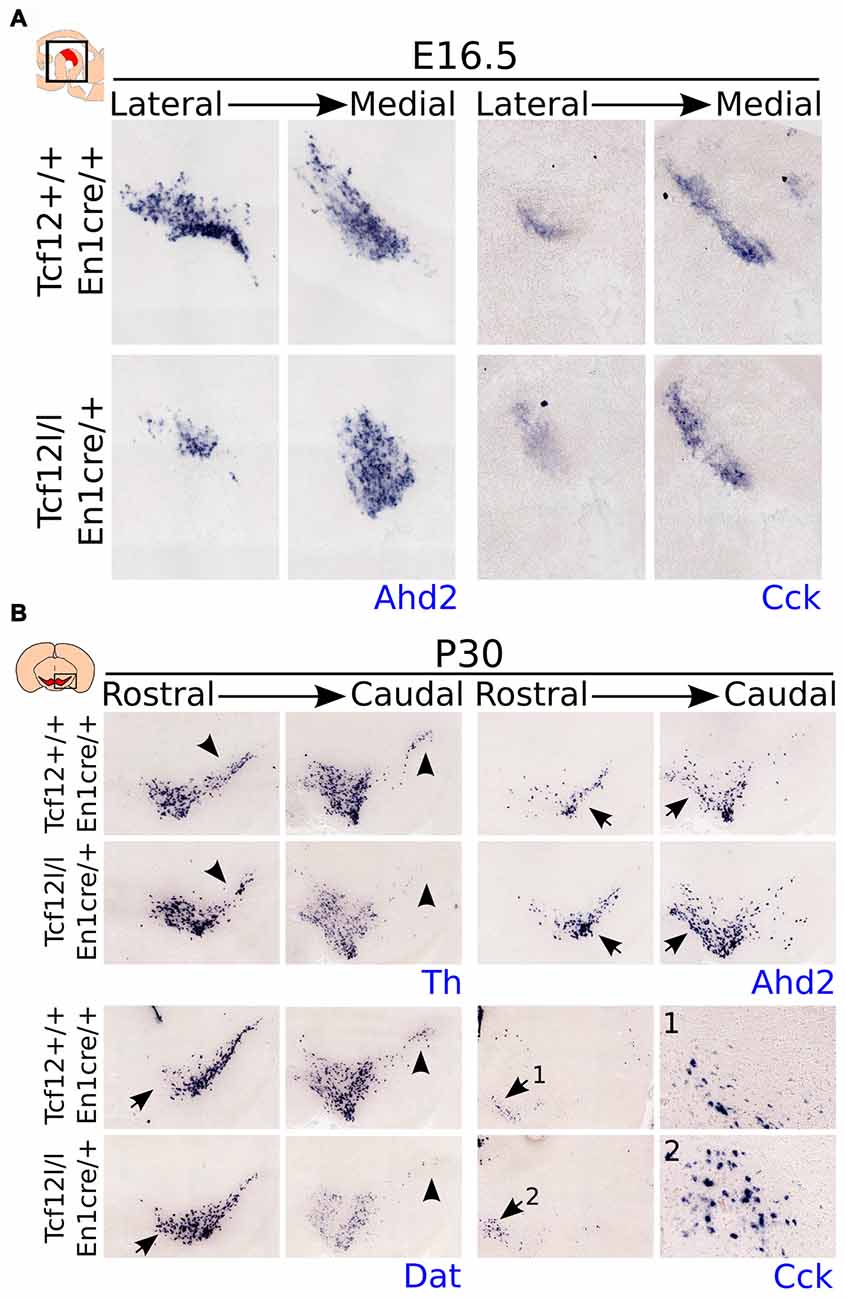
Figure 5. Expression of Ahd2 remains affected during development in the Tcf12lox/lox;En1cre/+ mutant midbrain. In the adult, Th and Dat show a decrease in expression, whereas Ahd2 and Cck expression appears to be increased. (A) In situ hybridization of Ahd2 (blue, left panel) and Cck (blue, right panel) at E16.5 in the mutant midbrain. Ahd2 expression is lost in the lateral parts of the midbrain, whereas medially its expression appears to be increased. Expression of Cck remains unaffected at E16.5. (B) In situ hybridization of Th (blue, upper left panel), Dat (blue, lower left panel), Ahd2 (blue, upper right panel) and Cck (blue, lower right panel) in the adult midbrain at P30. Expression of Th and Dat is decreased in the substantia nigra (SNc) of the adult midbrain (black arrowheads), although Dat expression appears to be increased in rostral-medial areas (black arrows), and an increase in expression is detected of Ahd2 and Cck (1,2) in caudal/medial parts of the midbrain (black arrows).
In the adult midbrain expression of the mdDA neuronal markers Th (Figure 5B, upper left panel) and Dat (Figure 5B, lower left panel) show a modest loss in expression in the lateral and caudal parts of the SNc (Figure 5B, black arrowheads). Interestingly, besides a loss of Dat and Th expression, the overall level of these markers appears to be affected in caudal parts of the midbrain, whereas in more medial parts of the SNc, an increase in Dat transcript level can be detected (black arrows). Expression of the subset markers Ahd2 (Figure 5B, upper right panel) and Cck (Figure 5B, lower right panel 1,2) appears to be increased in adjacent sections (Figure 5B, black arrows). The increase in expression of these subset markers is mainly detected in medial parts of the midbrain. These changes in transcript expression were seen in several adult animals.
To substantiate the expression data as described above, we aimed to quantify the amount of TH- and AHD2-expressing neurons in the adult mdDA neuronal population. In accordance to Th transcript, TH-expressing cells are specifically lost in the SNc region (Figures 6A1–4). The total amount of TH-expressing cells is ~14% lower in Tcf12lox/lox;En1cre/+ (n = 3; p < 0.05, one-tailed) than in Tcf12+/+;En1cre/+ littermates (Figure 6B, Supplementary Figure S2F). The reduction in TH-expressing cells is only observed in the SNc where the amount of TH+ neurons is reduced with ~31% (n = 3; p < 0.05, one tailed), whereas in the VTA the amount of TH+ neurons is not significantly changed in Tcf12lox/lox;En1cre/+ animals (n = 3; Figure 6B). Similar to the increased Ahd2 transcript expression area, an increase in AHD2-expressing cells (Figures 6C1–4) of ~10% (n = 3; p < 0.05, one-tailed) in Tcf12lox/lox; En1cre/+ animals (Figure 6D, Supplementary Figure S2G) is detected. Together, these data show that the population of TH-expressing neurons is specifically affected in the SNc in the adult stage. The observed increase in AHD2-containing neurons within the mdDA neuronal population suggests that the subset programming of the remaining mdDA neurons in the mutant is affected as well.
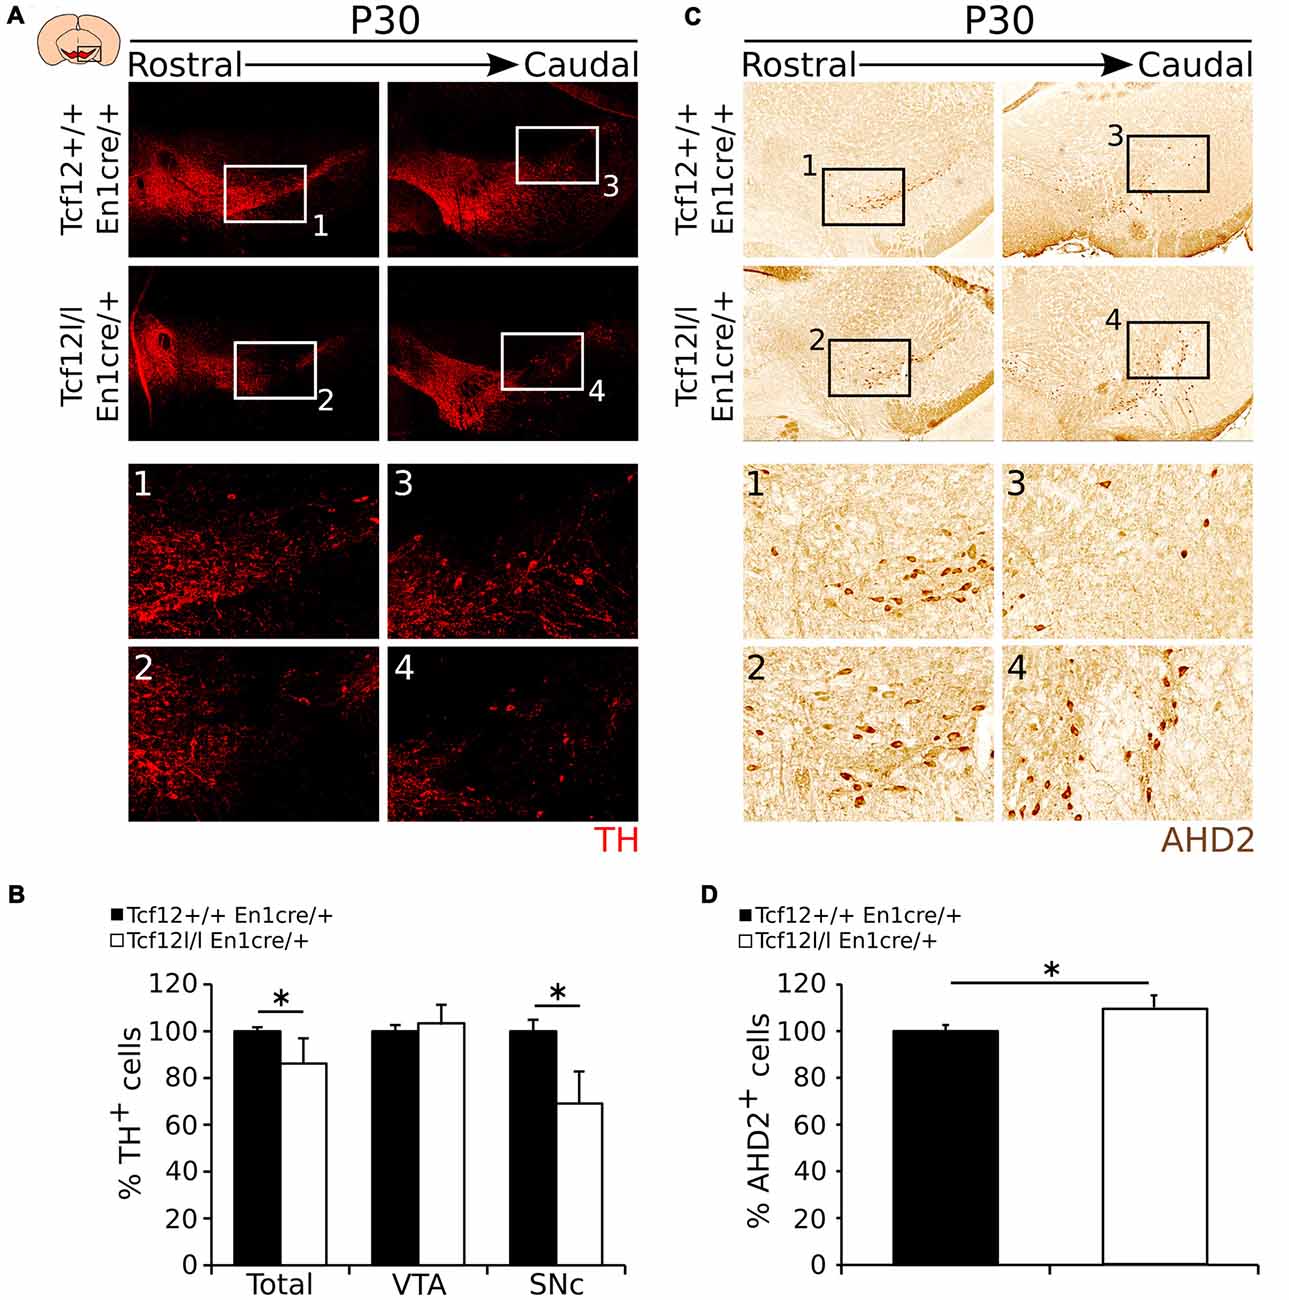
Figure 6. TH shows a decrease in expression in the adult Tcf12lox/lox;En1cre/+ mutant midbrain, whereas AHD2 expression is increased with ~10%. (A) Immunohistochemistry for TH (red) in the adult midbrain at P30. TH+ cells are lost in the SNc of the mutant midbrain at P30 compared to the WT (1–4). (B) Quantification of the number of TH+ cells in Tcf12lox/lox;En1cre/+ (white bars) compared to Tcf12+/+;En1cre/+ (black bars) midbrain at P30. The total amount of TH-expressing cells is decreased with ~14% in the midbrain (n = 3; *p < 0.05, one-tailed), which is represented in the SNc with a ~31% decreased (n = 3; *p < 0.05, one-tailed), but not in the ventral tegmental area (VTA; n = 3). Tcf12+/+;En1cre/+ was set at 100%. (C) Immunohistochemistry for AHD2 (brown) in the adult midbrain at P30. AHD2+ neurons show an increase in the mutant midbrain at P30 compared to the WT (1–4). (D) Quantification of the number of AHD2+ cells in the Tcf12lox/lox;En1cre/+ (white bar) compared to Tcf12+/+;En1cre/+ (black bar) midbrain at P30. The total amount of AHD2-expressing cells is increased with ~10% in the midbrain (n = 3; *p < 0.05, one-tailed). Tcf12+/+;En1cre/+ was set at 100%.
Pitx3cre Driven Ablation of Tcf12 Influences Programming of mdDA Neurons
Above we have shown that early deletion of Tcf12 under the En1cre driver results in a loss of TH expression in the SNc and overall programming defects. The latter suggests that Tcf12 may influence terminal differentiation of mdDA neurons. In order to validate this notion we created a Pitx3cre driven conditional ablation of Tcf12.
Contrary to a relative early deletion of Tcf12, Pitx3cre driven deletion of Tcf12 does not affect TH expression in mdDA neurons at E14.5 (Figure 7A, Supplementary Figure S2H, n = 3). Interestingly, expression of the subset marker Ahd2 is similarly lost in the Tcf12lox/lox;Pitx3cre/+ mutant at E14.5 (Figure 7B, left panel), whereas the spatial expression of Cck appears to be diminished in the rostral-medial expression area (Figure 7B, right panel). These data corroborate the initial finding that Tcf12 does influence the programming of mdDA neurons in the terminal differentiation state.
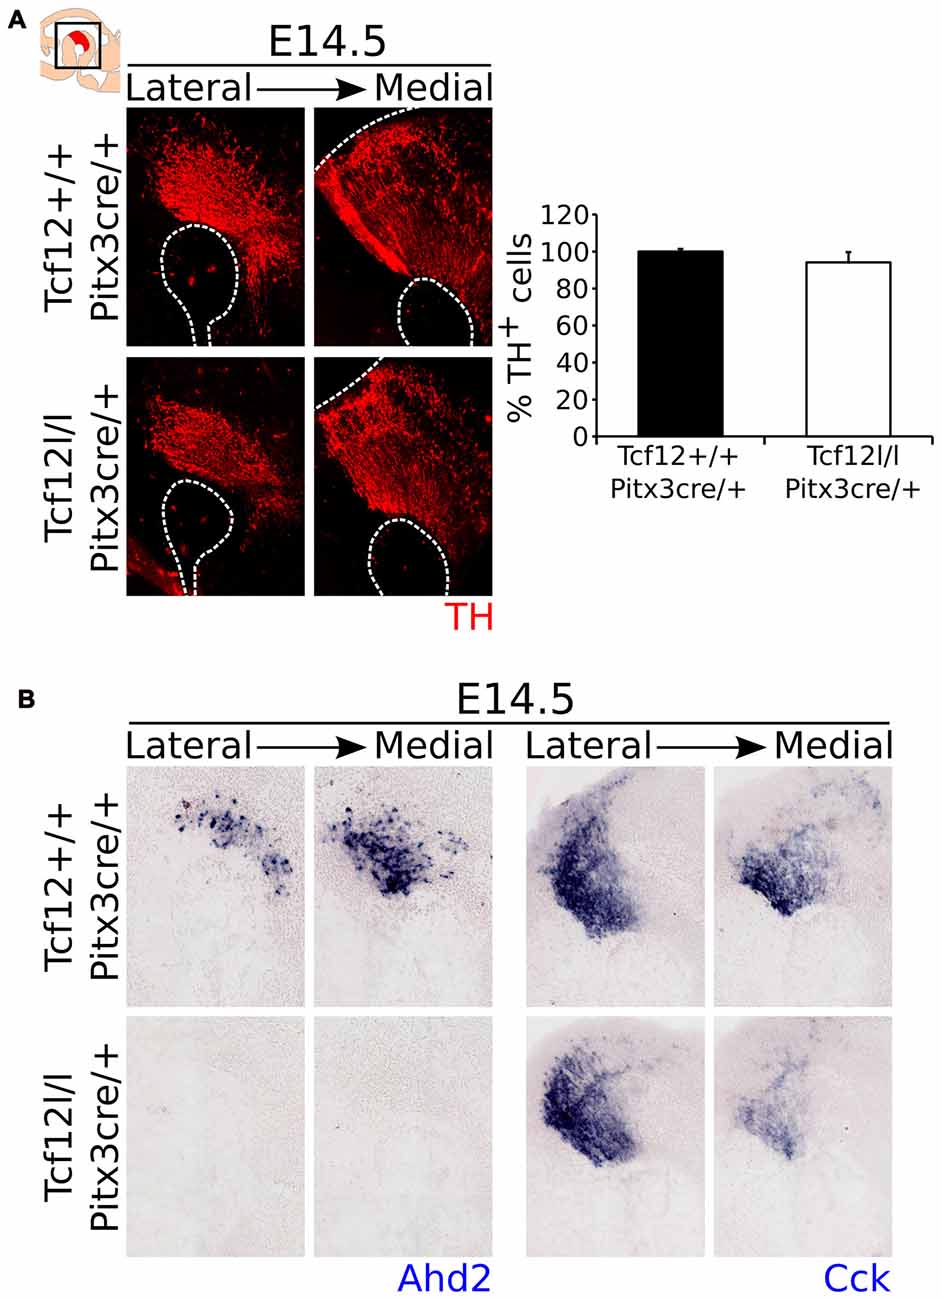
Figure 7. Pitx3cre driven loss of Tcf12 has no effect on the amount of TH-expressing cells, but results in a delay in subset specification at E14.5. (A) Immunohistochemistry for TH (red) in Tcf12lox/lox;Pitx3cre/+ (white bar) and Tcf12+/+;Pitx3cre/+ (black bar) embryos at E14.5 shows no difference in the distribution or amount of TH-expressing cells (n = 3). Tcf12+/+;Pitx3cre/+ was set at 100%. (B) In situ hybridization of the subset markers Ahd2 (blue, left panel) and Cck (blue, right panel) in the mutant midbrain at E14.5. Expression of Ahd2 is completely lost, whereas Cck appears to be only affected in the most medial sections of the midbrain in Tcf12lox/lox;Pitx3cre/+ embryos.
In order to follow the development of the system and confirm these programming defects in adult mutants, we quantified the amount of TH- (Figure 8A) and AHD2-expressing cells (Figure 8C). Quantification of the total amount of TH-expressing neurons and in the SNc and VTA separately, shows, in concordance to earlier time-points, that the amount of TH neurons is unaffected by late ablation of Tcf12 (Figures 8A1–4,B, Supplementary Figure S2I, n = 3). Noteworthy, although Ahd2 expression is completely lost in Tcf12lox/lox;Pitx3cre/+ embryos at E14.5, this effect is absent at P30 (Figures 8C1–4,D, Supplementary Figure S2J, n = 3). Not only could this be detected at the protein level, also transcript expression of Th, Ahd2 and Cck in the adult midbrain was unaffected in Tcf12lox/lox;Pitx3cre/+ animals (Supplementary Figure S4).
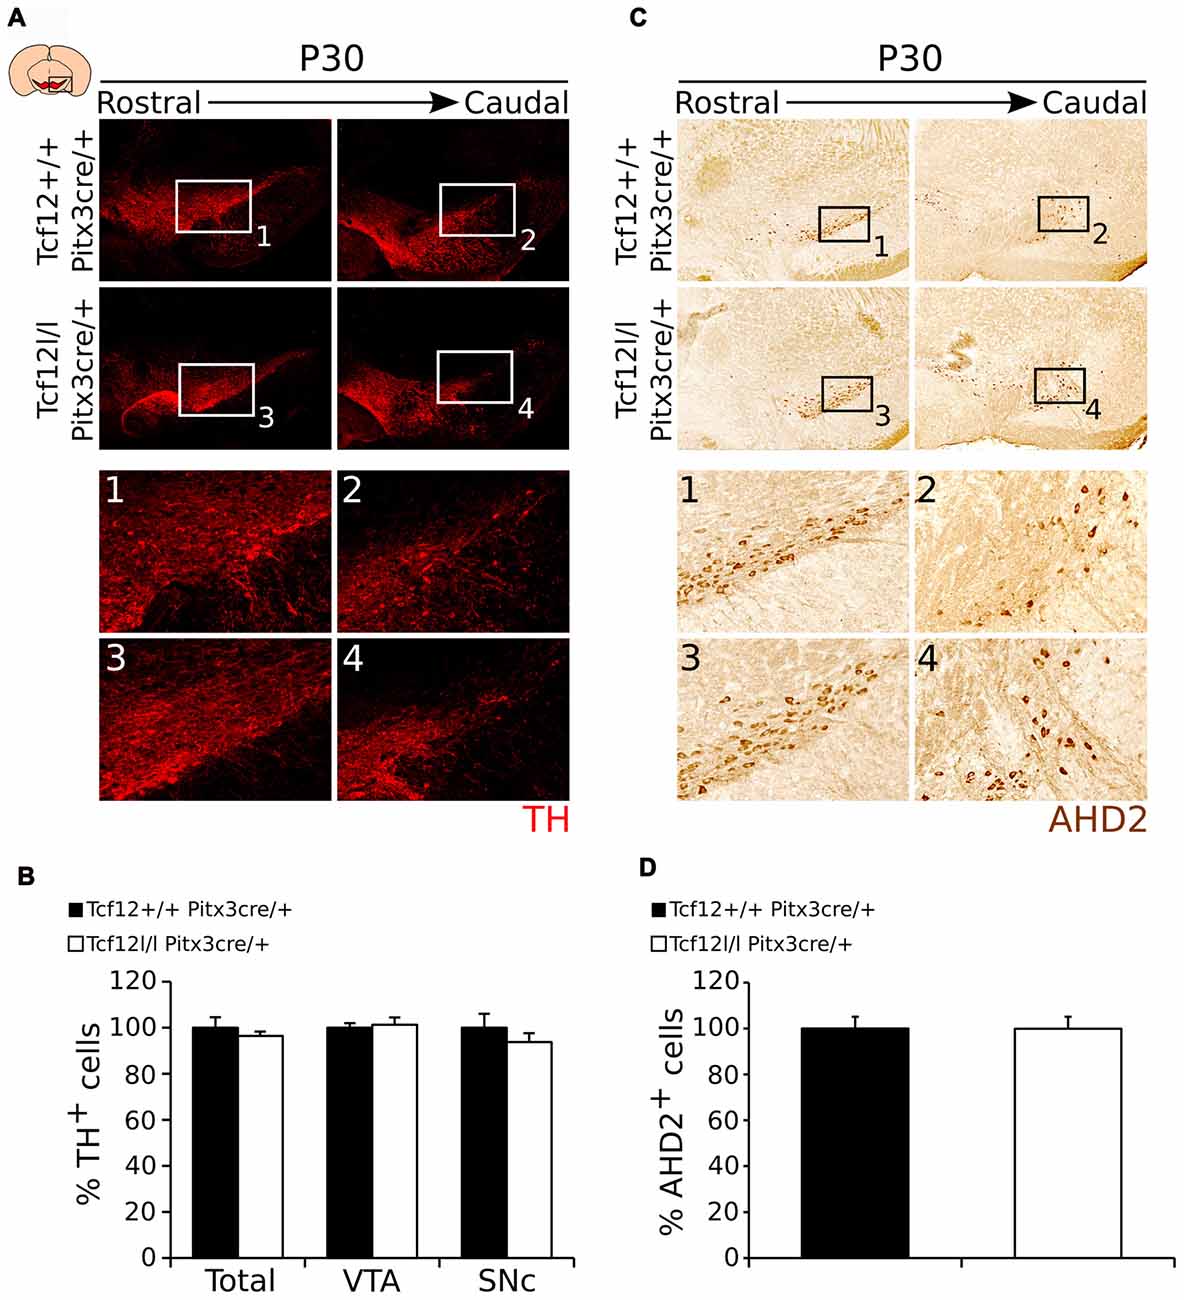
Figure 8. The mdDA neuronal population is normally present in the adult midbrain of Tcf12lox/lox;Pitx3cre/+ animals. (A) Immunohistochemistry of TH (red) in the midbrain of Tcf12lox/lox;Pitx3cre/+ and Tcf12+/+;Pitx3cre/+ animals. Expression of TH is not apparently affected in the mutant midbrain at P30 (1–4). (B) Quantification of TH in Tcf12lox/lox;Pitx3cre/+ (white bars) compared to Tcf12+/+;Pitx3cre/+ (black bars) animals at P30. The total amount and distribution between the SNc and VTA of TH-expressing neurons in the adult midbrain is not changed between the mutant and the WT animals (n = 3). Tcf12+/+;Pitx3cre/+ was set at 100%. (C) Immunohistochemistry of AHD2 (brown) in the midbrain of Tcf12lox/lox;Pitx3cre/+ and Tcf12+/+;Pitx3cre/+ animals. Expression of AHD2 is not apparently affected in the mutant midbrain at P30 (1–4). (D) Quantification of AHD2 in Tcf12lox/lox;Pitx3cre/+ (white bar) compared to Tcf12+/+;Pitx3cre/+ (black bar) animals at P30 shows no effect of the loss of Tcf12 in amount of AHD2+ neurons (n = 3). Tcf12+/+;Pitx3cre/+ was set at 100%.
Taken together these data show that Pitx3cre driven deletion of Tcf12 confirms the temporal delay in correct coding of mdDA neurons, which, in late ablation of Tcf12, is corrected in the adult system.
Discussion
The mdDA neuronal population develops from the VZ in the mesodiencephalic FP and BP from E10 onwards (Bayer et al., 1995). During this development proneural bHLH factors, like Ngn2 and Mash1, have been shown to be important in the development of the mdDA neuronal population (Andersson et al., 2006a; Kele et al., 2006). However, although many other bHLH factors are known to be expressed in the midbrain area, few studies have been performed to elucidate the possible role of these factors during mdDA neuronal differentiation. In this study, we have established the E-box protein Tcf12, which is part of the bHLH sub-family the E-box proteins, as an important factor both in early mdDA neuronal cell-fate commitment and in late subset formation.
Here, we have shown that Tcf12 transcript and protein are expressed in the VZ of the midbrain and partly co-localize with newly generated TH+ neurons and early mdDA specification factors like Lmx1a, Nurr1 and Ngn2. En1cre driven deletion of Tcf12 leads to a change in the spatial expression of Lmx1a and Nurr1, but not of Ngn2. Interestingly, Tcf12 expression slightly overlaps with the expression of Nurr1 in the midbrain, indicating that the effect on the Nurr1-expressing population is established earlier during development.
Besides its effect on the expression of early specification factors, Tcf12lox/lox;En1cre/+ embryos show a strong delay in the expression of the mdDA markers TH and PITX3. However, although PITX3 expression completely recovers during development, the rostral population of TH-expressing neurons remains affected during development until the adult stage. This delay in mdDA marker expression was not detected in Tcf12lox/lox;Pitx3cre/+ embryos, indicating that it is likely caused by a function of Tcf12 early in the specification of neural progenitor cells (NPCs). Interestingly, we did not detect a delay in proliferation, as the proliferation markers P-H3 and Ki67 were not noticeably altered in the mutant. Therefore, loss of Tcf12 under the En1cre driver likely leads to an affected differentiation, in which NPCs are normally initiated to leave their proliferating state and start differentiating, but cell-fate commitment into fully differentiated neurons is affected.
Besides the delay in expression of the mdDA neuronal markers TH and PITX3, Tcf12lox/lox;En1cre/+ mutants show a delay in expression of the subset marker Ahd2, which eventually results in an increase in AHD2-expressing cells at P30. Pitx3 has previously been shown to affect the expression of Ahd2 (Jacobs et al., 2011), indicating that the delay in PITX3 expression could in part be responsible for the delay in expression of Ahd2. However, expression of PITX3 was completely recovered at E14.5 in these mutants, which is around the time of initial expression of Ahd2 (McCaffery and Dräger, 1994). Hence, the initial loss of Ahd2 expression could not solely be due to the delay in PITX3 expression. Interestingly, the Tcf12lox/lox;Pitx3cre/+ mutants show a similar delay of Ahd2 expression, indicating that, besides an early role in mdDA neuronal differentiation, Tcf12 has a late role in subset specification which is possibly unrelated to Pitx3 function. This late role of Tcf12 is likely also responsible for the loss of Ahd2 expression in Tcf12lox/lox;En1cre/+ E14.5 embryos.
Although Ahd2 is not expressed in the same region as Tcf12, both conditional approaches showed a specific effect on Ahd2 expression. These data suggest that regulation of subset specification already starts in young TH+ neurons that express Tcf12 and further develops during neuronal migration. The delay in Ahd2 expression in Tcf12lox/lox;En1cre/+ midbrain could be responsible for the loss of the rostral TH-expressing group of neurons, since Ahd2 has been shown to be important in RA-dependent activation of Th in the midbrain (Jacobs et al., 2007, 2011). In combination with the early effects of Tcf12 deletion, this could lead to a loss of TH-expressing neurons and increase in caudally located AHD2+ cells. Interestingly, the loss of TH-expressing neurons in the SNc is similar to what can be detected in the mdDA neuronal population of patients suffering from PD. Since Tcf12 appears to be important in the correct differentiation of mdDA neurons and subset specification at later stages, this would be a possible candidate gene to study in relation to culturing correct SNc neuron from iPSCs in the use for cell replacement therapies in PD.
The difference in loss of mdDA neuronal markers between the En1cre-driven deletion and the Pitx3cre-driven deletion of Tcf12 may be due to two main differences between these two drivers. First of all there is a timing difference in the loss of Tcf12 with the use of these two drivers. En1 is expressed at an earlier stage than Pitx3 (~E9 and ~E12 respectively), meaning that Tcf12 is lost at least 2–3 days earlier in the En1cre-driven deletion than in the Pitx3cre-driven deletion. Second of all En1 is expressed in an area partly outside mdDA neurons, and can be detected in the FP at early stages (Wurst et al., 1994; Kouwenhoven et al., 2016), whereas Pitx3 expression is specific for mdDA neurons (Smidt et al., 2012). Taken together, based on the spatial-temporal difference in Tcf12 deletion, our data suggests that Tcf12 is possibly involved early in the FP of the midbrain in correct differentiation of DA progenitors to mdDA neurons, as detected in the En1cre driven deletion of Tcf12, whereas it has a later role within mdDA neurons to ensure the correct and timely subset specification, as detected in the Pitx3cre driven deletion of Tcf12.
This indicates that Tcf12 is a novel factor in mdDA neuronal development, and has a dual role in correct differentiation of mdDA neurons; an early role in cell-fate commitment and a late role mdDA subset specification.
Author Contributions
SM and MPS: conceived and designed the experiments; analyzed the data; contributed reagents/materials/analysis tools; wrote the article. SM: performed the experiments.
Funding
This work was sponsored by the Nederlandse Organisatie voor Wetenschappelijk Onderzoek-Aard en Levenswetenschappen (NWO-ALW) VICI grant (865.09.002) awarded to MPS. The funders had no role in study design, data collection and analysis, decision to publish, or preparation of the manuscript.
Conflict of Interest Statement
The authors declare that the research was conducted in the absence of any commercial or financial relationships that could be construed as a potential conflict of interest.
Acknowledgments
We would like to thank Prof Dr. Y. Zhuang from the Department of Immunology of the Duke University Medical Center in Durham, North Carolina for his generous gift of the Tcf12flox mouse strain.
Supplementary Material
The Supplementary Material for this article can be found online at: https://www.frontiersin.org/articles/10.3389/fnmol.2017.00353/full#supplementary-material
FIGURE S1 | Genotyping of Pitx3cre, En1cre and Tcf12flox alleles. (A) Genotyping of the Tcf12flox allele results in a clear PCR product at 1.1 kb for the WT allele and 1.3 kb for the cre-allele. (B) Genotyping of the En1cre allele results in a clear PCR product at 240 bp for the cre-allele. (C) Genotyping of the Pitx3cre allele results in a clear PCR product at 750 bp for the cre-allele, and a clear PCR product at 400 bp for the WT allele. m: DNA marker; (-): negative control; E1: example 1; E2: example 2; E3: example 3.
FIGURE S2 | Absolute quantifications of Tcf12flox animals. Note that numbers in this figure represent actual counted neurons and therefore give an under representation of the actual number of mesodiencephalic dopaminergic (mdDA) neurons in the mouse midbrain. (A) Absolute quantification of the amount of TH+ neurons in Tcf12+/+;En1cre/+ (black bars) compared to Tcf12lox/lox;En1cre/+ (white bars) embryos at E12.5 and E14.5. (B) Absolute quantification of the amount of PITX3+ neurons in Tcf12+/+;En1cre/+ (black bars) compared to Tcf12lox/lox;En1cre/+ (white bars) embryos at E12.5 and E14.5. (C) Absolute quantification of the amount of TH+ neurons in Tcf12+/+;En1cre/+ and Tcf12lox/lox;En1cre/+ embryos at E12.5 (black bars) compared to E14.5 (white bars). (D) Absolute quantification of the amount of PITX3+ neurons in Tcf12+/+;En1cre/+ and Tcf12lox/lox;En1cre/+ embryos at E12.5 (black bars) compared to E14.5 (white bars). (E) Absolute quantification of the amount of P-H3+ cells at E12.5 in Tcf12+/+;En1cre/+ (black bar) compared to Tcf12lox/lox;En1cre/+ white bar) embryos. (F) Absolute quantification of the amount of TH+ neurons in the ventral tegmental area (VTA), substantia nigra (SNc), and total mdDA population Tcf12+/+;En1cre/+ (black bars) and Tcf12lox/lox;En1cre/+ (white bars) mice at P30. (G) Absolute quantification of the amount of AHD2+ neurons in Tcf12+/+;En1cre/+ (black bar) and Tcf12lox/lox;En1cre/+ (white bar) mice at P30. (H) Absolute quantification of the amount of TH+ neurons in Tcf12+/+;Pitx3cre/+ (black bar) and Tcf12lox/lox;Pitx3cre/+ (white bar) embryos at E14.5. (I) Absolute quantification of the amount of TH+ neurons in the VTA, SNc and total mdDA population Tcf12+/+;Pitx3cre/+ (black bars) and Tcf12lox/lox;Pitx3cre/+ (white bars) mice at P30. (J) Absolute quantification of the amount of AHD2+ neurons in Tcf12+/+;Pitx3cre/+ (black bar) and Tcf12lox/lox;Pitx3cre/+ (white bar) mice at P30. p < 0.05 is represented by a * and p < 0.001 is represented by ***.
FIGURE S3 | Rostral TH−/PITX3+ expressing population in the Tcf12lox/lox;En1cre/+ mutant is increased when compared to the WT expression. Co-localization of TH (red) and PITX3 (green) is decreased in Tcf12lox/lox;En1cre/+ E14.5 embryos, resulting in an increase in the rostral PITX3-only expressing cells in the mdDA system (blow-ups 1,2, 1′,2′, and 1″,2″).
FIGURE S4 | Expression of Th, Ahd2 and Cck in the adult mdDA system is unaffected upon Pitx3cre driven loss of Tcf12. Expression of Th, Ahd2 and Cck is unaffected in Tcf12lox/lox;Pitx3cre/+ and Tcf12+/+;Pitx3cre/+ animals in the adult mdDA neuronal population.
References
Abeliovich, A., and Hammond, R. (2007). Midbrain dopamine neuron differentiation: factors and fates. Dev. Biol. 304, 447–454. doi: 10.1016/j.ydbio.2007.01.032
Allodi, I., and Hedlund, E. (2014). Directed midbrain and spinal cord neurogenesis from pluripotent stem cells to model development and disease in a dish. Front. Neurosci. 8:109. doi: 10.3389/fnins.2014.00109
Andersson, E. K. I., Irvin, D. K., Ahlsiö, J., and Parmar, M. (2007). Ngn2 and Nurr1 act in synergy to induce midbrain dopaminergic neurons from expanded neural stem and progenitor cells. Exp. Cell Res. 313, 1172–1180. doi: 10.1016/j.yexcr.2006.12.014
Andersson, E., Jensen, J. B., Parmar, M., Guillemot, F., and Björklund, A. (2006a). Development of the mesencephalic dopaminergic neuron system is compromised in the absence of neurogenin 2. Development 133, 507–516. doi: 10.1242/dev.02224
Andersson, E., Tryggvason, U., Deng, Q., Friling, S., Alekseenko, Z., Robert, B., et al. (2006b). Identification of intrinsic determinants of midbrain dopamine neurons. Cell 124, 393–405. doi: 10.1016/j.cell.2005.10.037
Barndt, R. J., Dai, M., and Zhuang, Y. (2000). Functions of E2A-HEB heterodimers in T-cell development revealed by a dominant negative mutation of HEB. Mol. Cell. Biol. 20, 6677–6685. doi: 10.1128/mcb.20.18.6677-6685.2000
Barzilai, A., and Melamed, E. (2003). Molecular mechanisms of selective dopaminergic neuronal death in Parkinson’s disease. Trends Mol. Med. 9, 126–132. doi: 10.1016/s1471-4914(03)00020-0
Bayer, S. A., Wills, K. V., Triarhou, L. C., and Ghetti, B. (1995). Time of neuron origin and gradients of neurogenesis in midbrain dopaminergic neurons in the mouse. Exp. Brain Res. 105, 191–199. doi: 10.1007/bf00240955
Bye, C. R., Thompson, L. H., and Parish, C. L. (2012). Birth dating of midbrain dopamine neurons identifies A9 enriched tissue for transplantation into Parkinsonian mice. Exp. Neurol. 236, 58–68. doi: 10.1016/j.expneurol.2012.04.002
Di Salvio, M., Di Giovannantonio, L. G., Acampora, D., Prosperi, R., Omodei, D., Prakash, N., et al. (2010). Otx2 controls neuron subtype identity in ventral tegmental area and antagonizes vulnerability to MPTP. Nat. Neurosci. 13, 1481–1488. doi: 10.1038/nn.2661
Fenstermaker, A. G., Prasad, A. A., Bechara, A., Adolfs, Y., Tissir, F., Goffinet, A., et al. (2010). Wnt/planar cell polarity signaling controls the anterior-posterior organization of monoaminergic axons in the brainstem. J. Neurosci. 30, 16053–16064. doi: 10.1523/JNEUROSCI.4508-10.2010
Flora, A., Garcia, J. J., Thaller, C., and Zoghbi, H. Y. (2007). The E-protein Tcf4 interacts with Math1 to regulate differentiation of a specific subset of neuronal progenitors. Proc. Natl. Acad. Sci. U S A 104, 15382–15387. doi: 10.1073/pnas.0707456104
Hoekstra, E. J., von Oerthel, L., van der Heide, L. P., Kouwenhoven, W. M., Veenvliet, J. V., Wever, I., et al. (2013). Lmx1a encodes a rostral set of mesodiencephalic dopaminergic neurons marked by the Wnt/B-catenin signaling activator R-spondin 2. PLoS One 8:e74049. doi: 10.1371/journal.pone.0074049
Jacobs, F. M. J., Smits, S. M., Noorlander, C. W., von Oerthel, L., van der Linden, A. J. A., Burbach, J. P. H., et al. (2007). Retinoic acid counteracts developmental defects in the substantia nigra caused by Pitx3 deficiency. Development 134, 2673–2684. doi: 10.1242/dev.02865
Jacobs, F. M. J., Veenvliet, J. V., Almirza, W. H., Hoekstra, E. J., von Oerthel, L., van der Linden, A. J. A., et al. (2011). Retinoic acid-dependent and -independent gene-regulatory pathways of Pitx3 in meso-diencephalic dopaminergic neurons. Development 138, 5213–5222. doi: 10.1242/dev.071704
Kele, J., Simplicio, N., Ferri, A. L. M., Mira, H., Guillemot, F., Arenas, E., et al. (2006). Neurogenin 2 is required for the development of ventral midbrain dopaminergic neurons. Development 133, 495–505. doi: 10.1242/dev.02223
Kim, H.-J., Sugimori, M., Nakafuku, M., and Svendsen, C. N. (2007). Control of neurogenesis and tyrosine hydroxylase expression in neural progenitor cells through bHLH proteins and Nurr1. Exp. Neurol. 203, 394–405. doi: 10.1016/j.expneurol.2006.08.029
Kimmel, R. A., Turnbull, D. H., Blanquet, V., Wurst, W., Loomis, C. A., and Joyner, A. L. (2000). Two lineage boundaries coordinate vertebrate apical ectodermal ridge formation. Genes Dev. 14, 1377–1389. doi: 10.1101/gad.14.11.1377
Kolk, S. M., Gunput, R.-A. F., Tran, T. S., van den Heuvel, D. M. A., Prasad, A. A., Hellemons, A. J. C. G. M., et al. (2009). Semaphorin 3F is a bifunctional guidance cue for dopaminergic axons and controls their fasciculation, channeling, rostral growth, and intracortical targeting. J. Neurosci. 29, 12542–12557. doi: 10.1523/JNEUROSCI.2521-09.2009
Kouwenhoven, W. M., Veenvliet, J. V., van Hooft, J. A., van der Heide, L. P., and Smidt, M. P. (2016). Engrailed 1 shapes the dopaminergic and serotonergic landscape through proper isthmic organizer maintenance and function. Biol. Open 5, 279–288. doi: 10.1242/bio.015032
Massari, M. E., and Murre, C. (2000). Helix-loop-helix proteins: regulators of transcription in eucaryotic organisms. Mol. Cell. Biol. 20, 429–440. doi: 10.1128/mcb.20.2.429-440.2000
McCaffery, P., and Dräger, U. C. (1994). High levels of a retinoic acid-generating dehydrogenase in the meso-telencephalic dopamine system. Proc. Natl. Acad. Sci. U S A 91, 7772–7776. doi: 10.1073/pnas.91.16.7772
Mesman, S., von Oerthel, L., and Smidt, M. P. (2014). Mesodiencephalic dopaminergic neuronal differentiation does not involve GLI2A-mediated SHH-signaling and is under the direct influence of canonical WNT signaling. PLoS One 9:e97926. doi: 10.1371/journal.pone.0097926
Murre, C., McCaw, P. S., Vaessin, H., Caudy, M., Jan, L. Y., Jan, Y. N., et al. (1989). Interactions between heterologous helix-loop-helix proteins generate complexes that bind specifically to a common DNA sequence. Cell 58, 537–544. doi: 10.1016/0092-8674(89)90434-0
Ono, Y., Nakatani, T., Sakamoto, Y., Mizuhara, E., Minaki, Y., Kumai, M., et al. (2007). Differences in neurogenic potential in floor plate cells along an anteroposterior location: midbrain dopaminergic neurons originate from mesencephalic floor plate cells. Development 134, 3213–3225. doi: 10.1242/dev.02879
Powell, L. M., and Jarman, A. P. (2008). Context dependence of proneural bHLH proteins. Curr. Opin. Genet. Dev. 18, 411–417. doi: 10.1016/j.gde.2008.07.012
Ravanpay, A. C., and Olson, J. M. (2008). E protein dosage influences brain development more than family member identity. J. Neurosci. Res. 86, 1472–1481. doi: 10.1002/jnr.21615
Roybon, L., Hjalt, T., Christophersen, N. S., Li, J.-Y., and Brundin, P. (2008). Effects on differentiation of embryonic ventral midbrain progenitors by Lmx1a, Msx1, Ngn2, and Pitx3. J. Neurosci. 28, 3644–3656. doi: 10.1523/JNEUROSCI.0311-08.2008
Saucedo-Cardenas, O., Quintana-Hau, J. D., Le, W. D., Smidt, M. P., Cox, J. J., De Mayo, F., et al. (1998). Nurr1 is essential for the induction of the dopaminergic phenotype and the survival of ventral mesencephalic late dopaminergic precursor neurons. Proc. Natl. Acad. Sci. U S A 95, 4013–4018. doi: 10.1073/pnas.95.7.4013
Skinner, M. K., Rawls, A., Wilson-Rawls, J., and Roalson, E. H. (2010). Basic helix-loop-helix transcription factor gene family phylogenetics and nomenclature. Differentiation 80, 1–8. doi: 10.1016/j.diff.2010.02.003
Smidt, M. P., Asbreuk, C. H. J., Cox, J. J., Chen, H., Johnson, R. L., and Burbach, J. P. H. (2000). A second independent pathway for development of mesencephalic dopaminergic neurons requires Lmx1b. Nat. Neurosci. 3, 337–341. doi: 10.1038/73902
Smidt, M. P., and Burbach, J. P. H. (2007). How to make a mesodiencephalic dopaminergic neuron. Nat. Rev. Neurosci. 8, 21–32. doi: 10.1038/nrn2039
Smidt, M. P., Smits, S. M., Bouwmeester, H., Hamers, F. P. T., van der Linden, A. J. A., Hellemons, A. J. C. G. M., et al. (2004). Early developmental failure of substantia nigra dopamine neurons in mice lacking the homeodomain gene Pitx3. Development 131, 1145–1155. doi: 10.1242/dev.01022
Smidt, M. P., von Oerthel, L., Hoekstra, E. J., Schellevis, R. D., and Hoekman, M. F. M. (2012). Spatial and temporal lineage analysis of a Pitx3-driven Cre-recombinase knock-in mouse model. PLoS One 7:e42641. doi: 10.1371/journal.pone.0042641
Smits, S. M., Burbach, J. P. H., and Smidt, M. P. (2006). Developmental origin and fate of meso-diencephalic dopamine neurons. Prog. Neurobiol. 78, 1–16. doi: 10.1016/j.pneurobio.2005.12.003
Smits, S. M., Ponnio, T., Conneely, O. M., Burbach, J. P. H., and Smidt, M. P. (2003). Involvement of Nurr1 in specifying the neurotransmitter identity of ventral midbrain dopaminergic neurons. Eur. J. Neurosci. 18, 1731–1738. doi: 10.1046/j.1460-9568.2003.02885.x
Smits, S. M., von Oerthel, L., Hoekstra, E. J., Burbach, J. P. H., and Smidt, M. P. (2013). Molecular marker differences relate to developmental position and subsets of mesodiencephalic dopaminergic neurons. PLoS One 8:e76037. doi: 10.1371/journal.pone.0076037
Sweatt, J. D. (2013). Pitt-Hopkins Syndrome: intellectual disability due to loss of TCF4-regulated gene transcription. Exp. Mol. Med. 45:e21. doi: 10.1038/emm.2013.32
Uittenbogaard, M., and Chiaramello, A. (2002). Expression of the bHLH transcription factor Tcf12 (ME1) gene is linked to the expansion of precursor cell populations during neurogenesis. Brain Res. Gene Expr. Patterns 1, 115–121. doi: 10.1016/s1567-133x(01)00022-9
Veenvliet, J. V., Dos Santos, M. T. M. A., Kouwenhoven, W. M., von Oerthel, L., Lim, J. L., van der Linden, A. J. A., et al. (2013). Specification of dopaminergic subsets involves interplay of En1 and Pitx3. Development 140, 3373–3384. doi: 10.1242/dev.094565
Wikström, I., Forssell, J., Penha-Goncalves, M. N., Bergqvist, I., and Holmberg, D. (2008). A role for E2–2 at the DN3 stage of early thymopoiesis. Mol. Immunol. 45, 3302–3311. doi: 10.1016/j.molimm.2008.02.012
Wojciechowski, J., Lai, A., Kondo, M., and Zhuang, Y. (2007). E2A and HEB are required to block thymocyte proliferation prior to pre-TCR expression. J. Immunol. 178, 5717–5726. doi: 10.4049/jimmunol.178.9.5717
Wurst, W., Auerbach, A. B., and Joyner, A. L. (1994). Multiple developmental defects in Engrailed-1 mutant mice: an early mid-hindbrain deletion and patterning defects in forelimbs and sternum. Development 120, 2065–2075.
Keywords: Tcf12, dopamine neuron, midbrain development, bHLH factors, early cell-fate commitment, subset specification
Citation: Mesman S and Smidt MP (2017) Tcf12 Is Involved in Early Cell-Fate Determination and Subset Specification of Midbrain Dopamine Neurons. Front. Mol. Neurosci. 10:353. doi: 10.3389/fnmol.2017.00353
Received: 14 August 2017; Accepted: 17 October 2017;
Published: 01 November 2017.
Edited by:
Björn Spittau, Universitätsmedizin Rostock, GermanyReviewed by:
Yunjong Lee, Sungkyunkwan University, South KoreaHui-Yun Chang, National Tsing Hua University, Taiwan
Copyright © 2017 Mesman and Smidt. This is an open-access article distributed under the terms of the Creative Commons Attribution License (CC BY). The use, distribution or reproduction in other forums is permitted, provided the original author(s) or licensor are credited and that the original publication in this journal is cited, in accordance with accepted academic practice. No use, distribution or reproduction is permitted which does not comply with these terms.
*Correspondence: Marten P. Smidt, bS5wLnNtaWR0QHV2YS5ubA==