Abstract
Neural crest cells arise in the embryo from the neural plate border and migrate throughout the body, giving rise to many different tissue types such as bones and cartilage of the face, smooth muscles, neurons, and melanocytes. While studied extensively in animal models, neural crest development and disease have been poorly described in humans due to the challenges in accessing embryonic tissues. In recent years, patient-derived human induced pluripotent stem cells (hiPSCs) have become easier to generate, and several streamlined protocols have enabled robust differentiation of hiPSCs to the neural crest lineage. Thus, a unique opportunity is offered for modeling neurocristopathies using patient specific stem cell lines. In this work, we make use of hiPSCs derived from patients affected by the Bardet–Biedl Syndrome (BBS) ciliopathy. BBS patients often exhibit subclinical craniofacial dysmorphisms that are likely to be associated with the neural crest-derived facial skeleton. We focus on hiPSCs carrying variants in the BBS10 gene, which encodes a protein forming part of a chaperonin-like complex associated with the cilium. Here, we establish a pipeline for profiling hiPSCs during differentiation toward the neural crest stem cell fate. This can be used to characterize the differentiation properties of the neural crest-like cells. Two different BBS10 mutant lines showed a reduction in expression of the characteristic neural crest gene expression profile. Further analysis of both BBS10 mutant lines highlighted the inability of these mutant lines to differentiate toward a neural crest fate, which was also characterized by a decreased WNT and BMP response. Altogether, our study suggests a requirement for wild-type BBS10 in human neural crest development. In the long term, approaches such as the one we describe will allow direct comparison of disease-specific cell lines. This will provide valuable insights into the relationships between genetic background and heterogeneity in cellular models. The possibility of integrating laboratory data with clinical phenotypes will move us toward precision medicine approaches.
Introduction
Neural crest cells are a highly migratory, multipotent stem cell population that contributes to a broad range of tissues, including craniofacial bone and cartilage, peripheral neurons, glia, pigment, and other cells during embryonic development (Trainor, 2014). Elucidating the cellular and molecular mechanisms of lineage specification and migration of neural crest stem cells is essential for understanding the pathogenesis of neurocristopathies, a family of diseases caused by anomalies in the migration or cell behavior of neural crest cells. Ciliopathies are a class of genetic disorders characterized by mutation of proteins affecting the structure or function of the cilium (Eggenschwiler and Anderson, 2007; Ishikawa and Marshall, 2011). The cilium is a microtubule-based cellular organelle crucial for cell signaling, mechanotransduction and fluid flow, such as in airways and brain ventricles. Loss of the cilium has been linked to craniofacial anomalies such as micrognathia and facial clefting (Cortés et al., 2015; Adel Al-Lami et al., 2016). Cranial ciliopathies are caused by mutations in ciliary genes that may result from altered neural crest cell development (Cortés et al., 2015). How neural crest cell migration (see Tobin et al., 2008; Schock et al., 2015) is affected by cilia defects remains to be fully explored. Bardet–Biedl Syndrome (BBS) is a prototypic ciliopathy that can affect neural crest-derived tissues.
BBS proteins can be categorized by their location and function within the primary cilia, with a subset of BBS proteins forming the BBSome (Figure 1A). The BBSome is an adaptor complex that is crucial for cilia function (Jin and Nachury, 2009; Suspitsin and Imyanitov, 2016). Clinical findings indicate that patients carrying BBS mutations often present with subclinical craniofacial changes including speech and oral phenotypes, mid-facial flattening and some mild retrognathia (Tobin et al., 2008; Panny et al., 2017). In addition, Bbs6 mutant mouse skulls showed a reduction in the size of the pre-maxillary and maxillary regions (Tobin et al., 2008). Similarly, zebrafish knockdowns of bbs4, bbs6, and bbs8 had shortened facial cartilages and mandibles correlating with a reduction in neural crest cell migration (Tobin et al., 2008).
FIGURE 1

BBS10 variant hiPSCs are pluripotent and can form cilia. (A) Schematic representation of the primary cilium. AX, axoneme; BB, basal body; IFT, intraflagellar transport. BBS1-20 proteins are depicted in their associated complex (BBSome and chaperonin) or by localization to other structures (scheme adapted from Suspitsin and Imyanitov, 2016). (B) Schematics showing BBS10 transcript and protein structure (723AA). Regions exhibiting homology with chaperonin domains are shown in the wildtype protein (scheme adapted from Álvarez-Satta et al., 2017). Variants from two BBS10 mutant lines XIRY (blue) and LAIG (red) are mapped onto protein domains with comparison to control (QOLG or KEGD). (C–E) Cells were immunostained for the pluripotency marker OCT3/4. Control (QOLG) cells and BBS10 mutants (XIRY and LAIG) all had positive staining in the nucleus. Merge with DNA dye Hoechst (C’–E’). All cells exhibit staining although there is some variability with less intense staining being seen in the central regions of the colonies. (F–H) Staining for the ciliary axoneme marker, ARL13B was performed. Control (KEGD) cells show positive staining for ARL13B (F). XIRY cells and LAIG cells (H) both express cilia. Merge with DNA dye Hoechst (F’–H’). Cilia frequency was quantitated by manual counting (I). LAIG cells had a moderate increase in percentage of cells with cilia compared to control cells. XIRY cells showed no significant difference although were more variable. P-values were determined using unpaired Student’s t-tests (*P ≤ 0.05). Scale bars (E’,H’) = 50 μm.
We focused on BBS10 due to the high prevalence of BBS10 mutations in humans, which comprises approximately 20% of the BBS population (Stoetzel et al., 2006; Forsythe and Beales, 2013). BBS10, along with BBS6 and 12, is part of a chaperonin-like complex which mediates the assembly of the BBSome (Stoetzel et al., 2006, 2007; Billingsley et al., 2010; Seo et al., 2010; Zhang et al., 2012). Phenotypes associated with BBS6, 10 and 12 are thought to be more severe than other commonly mutated BBS genes like BBS1 (Castro-Sánchez et al., 2015). Furthermore, bbs10 morphant zebrafish larvae exhibit shortened body axis and poor somitic definition among other more variable phenotypes, while a sub-phenotypic dose of bbs10 morpholino oligonucleotides (MO) exacerbates the phenotypes observed in other bbs morphants (Stoetzel et al., 2006). In alignment with the human disease, Bbs10 knockout mice are viable but exhibit obesity, retinal degeneration and cystic kidney phenotypes (Cognard et al., 2015).
Together, these studies in fish and mouse suggest that BBS10 is necessary for normal cilia function, and when mutated, causes a range of BBS phenotypes. The potential neural crest defects observed in the knockdowns also fit generally with observations linking ciliopathic mutations and craniofacial malformations in humans. It is unclear what specific alterations in neural crest cell (NCC) functions (e.g., differentiation, migration) are caused by mutations in BBS10. To define the pathogenic mechanisms of these mutations, we sought to model NCC induction in BBS10 mutant iPSCs.
Human induced pluripotent stem cells (hiPSC) are a powerful tool for the study of human developmental disorders as they can be used to model genotype-specific molecular and cellular phenotypes during differentiation. Over the last decade, several protocols have been developed for neural crest cell (NCC) induction from hiPSCs, using defined factors at specific time points to generate “purer” cell populations which can be used to study induction, migration and differentiation (Chambers et al., 2013; Menendez et al., 2013; Leung et al., 2016; reviewed in Zhu et al., 2016). The Human Induced Pluripotent Stem Cell Initiative (HipSci1) has generated and characterized a panel of hundreds of hiPSCs including from a significant cohort of BBS patients hosting a diverse spectrum of mutations in genes involved in BBS. Here, as a proof of concept, we use the recently described (Leung et al., 2016) protocol to obtain efficient neural crest induction and compare HipSci cell lines from healthy volunteers with two cell lines obtained from BBS patients carrying BBS10 mutations (Table 1). We show that both mutant cell lines have altered neural crest induction and differentiation, demonstrating the feasibility of using hiPSCs from ciliopathies to explore processes affecting neural crest induction. This approach will help us to define the human phenotypes and dissect the role of cilia during neural crest development.
TABLE 1
| Donor | Cell line | BBS10 variant 1 | BBS10 variant 2 | Age | Sex | Ethnicity |
| QOLG | Qolg_1 | Wildtype | Wildtype | 35–39 | Male | White, British |
| KEGD | Kegd_2 | Wildtype | Wildtype | 40–44 | Male | White, British |
| XIRY | Xiry_5 | c.989T>C/p.Val330Ala | c.235dup/p.Thr79Asnfs*17 | 35–39 | Male | White, British |
| LAIG | Laig_1 | c.285A>T/p.Arg95Ser | c.2119_2120del/p.Val707* | 25–29 | Female | White, European |
Cell lines used in this study.
Materials and Methods
Human Induced Pluripotent Cell Lines (hiPSC)
Control hiPSCs and BBS patient-derived hiPSC lines harboring mutations in BBS10, part of the ciliary chaperonin complex (Figure 1A) were obtained from the HipSci consortium (see Table 1). Ethical approval was obtained either from NRES Committee East of England – Cambridge Central, Study title: Generation of Induced Pluripotent Stem (iPS) Cells and Rare Diseases. REC Ref: 15/EE/0049, or from NRES Committee London-Bloomsbury, Study title: Molecular Genetics of Human Birth Defects – mapping and gene identification. REC Ref: 08/H0713/82. hiPSCs were maintained in Essential 8 media (Thermo Fisher Scientific, United States) on an extracellular matrix replacement, Matrigel (Corning). XIRY was initially obtained cultured on Matrigel whereas QOLG and LAIG, acquired on vitronectin, were cultured on Matrigel for several passages to ensure that all cell lines were comparable. Cells were typically passaged twice weekly using 0.5 mM EDTA, dissociated with gentle pipetting and analyzed between passages 30–60.
Neural Crest Induction
Neural crest induction was carried out as per (Leung et al., 2016), which is designed to mimic normal neural crest development (Figure 2). TrypLE Express (Thermo Fisher Scientific, United States) was used to detach hiPSCs into a single cell suspension. Next, 200,000 hiPSCs were plated in each well of a 6-well plate coated with Matrigel. At the start of the induction protocol (time = 0 h), wells were incubated with neural crest induction medium + 10 μM Y-27632 (Cell Guidance Systems) for the first 48 h (48 h) of culture, then in neural crest induction media alone for the indicated time. Samples were then fixed in 4% PFA in PBS for antibody staining or lysed in Trizol (Sigma) for RNA extraction. Neural crest induction media is as per (Leung et al., 2016): 50:50 DMEM:F12 (Sigma, United States), 2% B27 supplement (Life Technologies, United States), 1X L-glutamine (Invitrogen), 0.5% BSA (Sigma), 3 μM CHIR99021 (Sigma).
FIGURE 2

Neural crest induction in vivo and in human induced pluripotent stem cells. (A)In vivo neural crest induction occurs at the border (green) between the neural plate (blue) and the non-neural ectoderm (light pink). As neurulation progresses the neural folds begin to approximate and neural crest delaminate from the epithelium and begin migration. (B)In vitro neural crest induction in hiPSCs following the protocol from Leung et al., 2016. hiPSCs are plated on Matrigel and treated for 48 h in neural crest induction (NCI) media plus Rock inhibitor (RI). This is followed by incubation in neural crest induction media without RI until 120 h of culture. At the start, pluripotency markers (OCT3/4, NANOG, and CMYC) are expressed. By 2 days of culture, neural border markers are expressed (PAX3, PAX7, TFAP2A, ZIC1). By 5 days of culture, cells express markers of neural crest identity (FOXD3, SNAIL2, SOX10).
Immunofluorescent Antibody Staining
After fixation, cells were washed three times in 1X PBS and then permeabilised by incubation with 0.5% TritonX-100 (Sigma) in 1X PBS for 5 min at room temperature. Next, cells were blocked for 1 h at room temperature [in 3% BSA (Sigma) in 1X PBS, 0.01% Tween 20 (Sigma)]. Primary antibodies (see Table 2) were incubated overnight at 4°C in blocking solution. Three 15 min washes in PBS with 1% BSA, 0.01% Tween 20 were carried out. Fluorescent secondary antibodies were diluted in blocking solution and plates were incubated at room temperature for 1–2 h. Next, three 15 min washes in PBS with 1% BSA, 0.01% Tween 20 were carried out. Hoechst 33342 (Sigma), diluted at 1:1000 from a 20 mg/ml stock, was added to the first wash as a nuclear stain.
TABLE 2
| Antibody | Targets: | Concentration | Supplier (catalog number) |
| ARL13B | Ciliary axoneme | 1:500 | Proteintech (17711-1-AP) |
| SOX10 | Migratory neural crest | 1:500 | Santa Cruz (sc-365692) |
| OCT3/4 | Pluripotency | 1:200 | Santa Cruz (sc-5279) |
| P75NTR | Neurotrophin receptor/neural crest | 1:600 | Millipore (07-476) |
| Anti-mouse 488 | Secondary antibody | 1:500 | Invitrogen (A11001) |
| Anti-rabbit 568 | Secondary antibody | 1:500 | Invitrogen (A11011) |
| Anti-rabbit 488 | Secondary antibody | 1:500 | Invitrogen (A11008) |
Antibodies used in this study.
Microscopy and Imaging
Cells were routinely viewed and imaged by phase-contrast microscopy. Fluorescence imaging of immunostained samples was carried out using an inverted epifluorescence microscope (Zeiss or Olympus) with a plate stage adaptor. All image processing was carried out in Image J. Figures were made using Adobe Illustrator CS5.5.
Cilia quantification was manually carried out using the cell counter plug-in of ImageJ. For these quantifications the control line KEGD was used due to lack of QOLG line availability. In addition, these cells were cultured on vitronectin rather than Matrigel (Corning). The percentage of ciliated cells was calculated from total nuclei and cilia counts manually obtained from representative images (total number of control cells counted: KEGD = 2631, mutant cells: LAIG = 2293 and XIRY = 1742). Nuclei and cilia of cells touching the field edge were assessed from contrast adjustment of the ARL13B channel and excluded.
Quantitative Reverse Transcription Polymerase Chain Reaction (qRT-PCR)
RNA was extracted from hiPSCs, after 48 h of induction or 120 h of induction, using Trizol (Sigma) as per manufacturer’s instructions. RNA was then DNAse I (Promega, United States) treated. 500 ng to 1 μg of DNAse treated RNA was primed with random hexamers (Promega) and reverse transcription was carried out according to manufacturer’s protocol (M-MLV Reverse Transcriptase, Promega, M1701. All qRT-PCRs were performed using Bioline 2X Sensimix (QT605-05) using a Roche Lightcycler 480. Quantification of each PCR reaction was carried out using absolute standards, and normalized to β-actin levels. See Table 3 for primers used in this study. Statistical significance for all RT-qPCR data was analyzed using un-paired, Student’s t-tests.
TABLE 3
| Gene | Forward primer | Reverse primer |
| β-ACTIN | AGCCTCGCCTTTGCCG | CTCGTCGCCCACATAGGAAT |
| CMYC | TTTCTGAAGAGGACTTGTTGCGGAAACGAC | TCAGCCAAGGTTGTGAGGTTGCATTTGATC |
| NANOG | TCTCTCCTCTTCCTTCCTCCATG | CTGTTTGTAGCTGAGGTTCAGGATG |
| OCT3/4 | GACAGGGGGAGGGGAGGAGCTAGG | CTTCCCTCCAACCAGTTGCCCCAAAC |
| BRY | TATGAGCCTCGAATCCACATAGT | CCTCGTTCTGATAAGCAGTCAC |
| AXIN2 | AGTCAGCAGAGGGACAGGAA | AGCTCTGAGCCTTCAGCATC |
| PTC1 | CCCCTGTACGAAGTGGACACTCTC | AAGGAAGATCACCACTACCTTGGCT |
| SIX1 | TCAGCTCCAAGACTCTCTGC | ACAAGCTGCAAAAATGTTCC |
| SOX2 | TCAAGCGGCCCATGAATGCC | AGCCGCTTAGCCTCGTCGAT |
| TFAP2A | GATCCTCGCAGGGACTACAG | TACCCGGGTCTTCTACATGC |
| ZIC1 | GTCCTACACGCATCCCAGTT | GCGATAAGGAGCTTGTGGTC |
| MSX1 | CTGCACCCTCCGCAAACACA | AGGCTGAGCGAGCTGGAGAA |
| PAX3 | AATTACTCAAGGACGCGGTC | TTCTTCTCGCTTTCCTCTGC |
| PAX7 | TGACAGCTTCATGAATCCGG | GATGGAGAAGTCAGCCTGTG |
| FOXD3 | GCATCTGCGAGTTCATCAGC | CGTTGAGTGAGAGGTTGTGG |
| SOX10 | CTCTGGAGGCTGCTGAA | TGGGCTGGTACTTGTAGTC |
| SNAI2 | CAGACCCTGGTTGCTTCAAG | GAGCCCTCAGATTTGACCTG |
RT-qPCR primers used in this study.
Results
Comparable Culture Conditions for Pluripotent Stem Cells
We selected several lines from the HipSci cell bank: a control line, KEGD (cilia quantitation) and QOLG (used for the majority of our assays) and two BBS10 mutant lines, XIRY and LAIG. Both mutant lines carry compound heterozygous variants (Figure 1B and Table 1). The XIRY line carries two alleles: a non-synonymous change (V330A) on one allele, and a duplication on the other allele that leads to a frameshift and an early stop (T79Nfs*17), likely to result in a loss-of-function variant (Figure 1B). LAIG carries an allele with a synonymous mutation (R95S) and an allele with a 2-base pair deletion leading to a truncated protein lacking the final 16 amino acids (V707*) (Figure 1B). Based on these genotypes, we expect that the XIRY variants will have a more significant impact on protein function. Matrigel was used to wean lines for comparable results and all cell lines exhibited an embryonic stem (ES) cell-like state, forming tight colonies of packed cells (Figures 1C–E). Cultures were discarded if delaminating, if differentiated cells were present on greater than 25% of the colonies, or if large regions of non-colony bound cells were present. We confirmed that our culture conditions were suitable for maintaining pluripotency in all three hiPSC lines. Immunostaining for OCT3/4, one of the defining features of pluripotency, was carried out on all three lines after adaptation to Matrigel. All lines exhibited positive nuclear staining for OCT3/4 confirming the pluripotent nature of these cells, and no significant differences were observed in BBS10 mutants compared to controls (Figures 1C–E).
Reduced Primary Cilia Expression in BBS10 Mutant hiPSCs
Normally, a proportion of cells within hiPSC colonies express primary cilia (Nathwani et al., 2014). To confirm that BBS10 mutant cells are still able to generate cilia, we performed immunostaining on the hiPSCs with ARL13B, a marker of the ciliary axoneme. We found that both control lines expressed an abundance of cilia-specific ARL13B staining (KEGD, shown in Figure 1F; QOLG, data not shown). Both BBS10 mutant lines also had cells with positive staining (Figures 1G,H). Both mutant lines expressed cilia; interestingly, quantification indicated that LAIG and not XIRY had a slight but statistically significant increase in the number of cilia numbers compared to control (Figures 1F–I). Anecdotally, the percentage of cells with cilia in XIRY was very variable (Figures 1G,I). These data suggest that BBS10 is not strictly required for ciliogenesis, at least in the pluripotent state.
Differentiation of hiPSCs to Neural Crest Stem Cells
To confirm that both normal and BBS10 mutant hiPSCs could be differentiated toward the neural crest lineage, we used a 5-day induction protocol where activation of the WNT pathway [via inhibition of glycogen synthase kinase-3 (GSK-3)] induces neural border genes and neural crest markers mimicking normal neural crest development (Figure 2; Leung et al., 2016). Cells were monitored daily and unattached cells were washed away during media changes, leaving behind adherent colonie in control (Figures 3A–E) and mutant cells (Figures 3F–J,K–O). At initial plating, control and mutant cells formed small colonies with protrusions (Figures 3A,F,K). By 24 h of culture, cells are still present as small iPS-like colonies (Figures 3B,G,L). By 48 h of culture, a subset of cells in the control QOLG colonies have begun delaminating (Figure 3C, blue arrowhead). This was rarely seen in BBS10 mutant colonies at 48 h (Figures 3H,M). In contrast, mutant cell colonies showed delamination at 96 h of culture (Figures 3I,N, blue arrowheads). These results suggest a delay in neural crest induction in BBS10 mutants.
FIGURE 3

Neural crest induction is delayed in BBS10 mutant cells. Phase contrast images of taken during neural crest induction at specified time points. Control QOLG (A–E), mutant XIRY (F–J), and LAIG (K–O) cells. Discrete iPSC-like colonies can be seen at 24 h in all rows (B,G,L). In control cultures, cells are seen delaminating from colonies at 48 h (blue arrowhead, C); whereas mutant cultures start showing delamination at 96 h (blue arrowheads, I,N). By 120 h there are still some dense, colony-like regions present in all cultures (yellow arrowheads, E,J,O). Scale bars = 50 μm.
Furthermore, despite being initially plated at the same density, fewer cells were observed in the mutant cultures over the first 72 h of culture. By day 5, most areas of cultures had reached confluency; however, the control was visibly denser (Figure 3E). At 120 h dense areas (yellow arrowheads, Figures 3E,J,O) were present, and these resembled the morphology of colony-like arrangements seen throughout the cultures. Upon close inspection of the delaminating stage of QOLG and XIRY cells (48–96 h, Figure 4), it was noted that XIRY cells showed fewer protrusions from the colonies of cells at 48 and 72 h timepoints (Figures 4D,E). At 96 h mutant cells are seen delaminated from cell colonies (Figure 4F). These data indicate that some neural crest induction is taking place, with cells delaminating from control colonies earlier than mutants.
FIGURE 4

Delaminated neural crest cells have a mesenchymal morphology. Phase contrast images of differentiating hiPSCs cultures taken during neural crest induction at specified time points. Control QOLG (A–C), mutant XIRY (D–F). Note that control QOLG cells at 48 h (A) exhibit delaminated cells with mesenchymal morphology, in contrast to XIRY cells which do not show cell delamination until 96 h (F). Scale bars = 200 μm.
Decreased Expression of Neural Crest Markers in Mutant Cells
During embryogenesis, the transcription factor SOX10 and the p75 neurotrophin receptor (p75NTR) are expressed in migratory neural crest cells. In order to determine the identity of the induced cells, we carried out immunostaining for these markers. By 5 days of differentiation a majority of cells showed some level of SOX10 expression (Figure 5). The QOLG control line showed much higher levels of SOX10 and p75NTR expression compared to the mutant lines (Figures 5A–C). Consistent with SOX10 association with migratory neural crest cells, cells that most strongly expressed SOX10 were delaminated cells at the edge of colonies (Figure 5A). We also found cells co-expressing p75NTR and SOX10 around the periphery of control colonies (Figures 5A–A”). In contrast, both mutant cultures had markedly diminished expression of SOX10 and almost no evidence of p75NTR expression (Figures 5B–C”), although levels of SOX10 were still above background (compare Figures 5D,B–C).
FIGURE 5
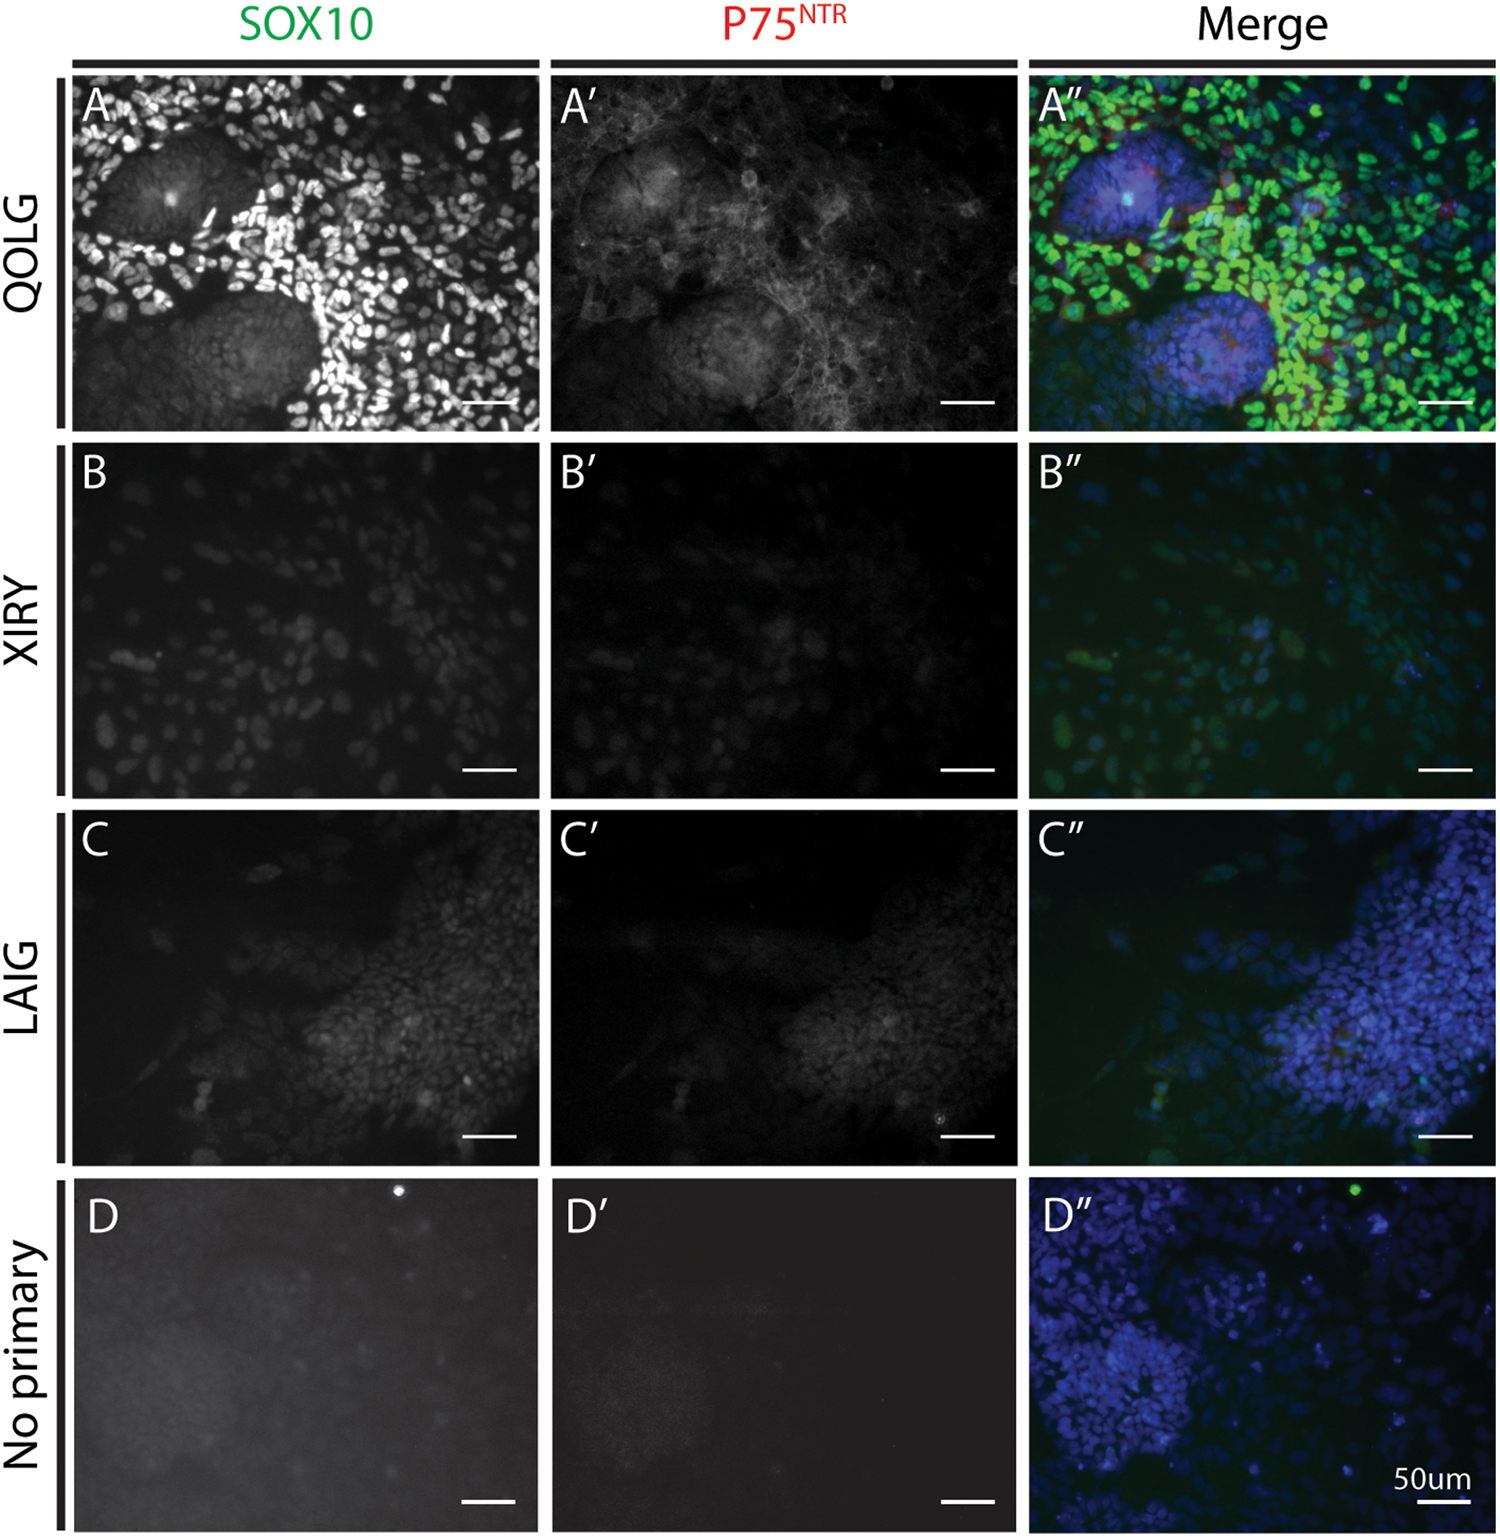
BBS10 mutant cells express lower levels of SOX10 and P75NTR after neural crest induction. Immunostaining for the neural crest markers SOX10 (A–C) and P75NTR (A’–C’). Control QOLG (A) cells had high levels of SOX10 and P75NTR. BBS10 mutant cells [XIRY (B) and LAIG (C)] had significantly lower levels of both markers. Merge with DNA dye Hoechst (A”–C”). No positive staining was observed in the no primary control for SOX10 or P75NTR (D–D”). Scale bars = 50 μm.
Gene Expression Analysis During Induction of the Neural Crest Lineage
As noted above, the neural crest protocol is designed to first induce a neural border state, which is necessary for subsequent neural crest induction. In order to determine the steps at which neural crest induction might be perturbed, we examined gene expression profiles over the 120 h protocol. We harvested mRNA for quantitative RT-PCR analysis at 0 h, where cells should be self-renewing hiPSCs, at 48 h induction, at the onset of neural border formation, and at 120 h, when cells should be expressing neural crest markers.
To confirm the exit from pluripotency, we first analyzed the expression of CMYC, NANOG, and OCT3/4, which should become progressively reduced during the 120 h period. Indeed, these markers diminished as predicted in both QOLG and XIRY; however, it is worth noting that XIRY cultures exhibited a significantly higher level of all three pluripotency markers at the outset, including surprisingly higher levels of NANOG and OCT3/4 at 48 h (Figures 6A–C). Interestingly, LAIG also expressed higher levels of OCT3/4 at the iPSC period but not NANOG or CMYC (Figure 6C). By 120 h of culture, both lines had almost no expression of pluripotency markers. Nevertheless, the delayed loss of pluripotency markers could be indicative of a failure to respond to signals that induce the neural plate border.
FIGURE 6

Dynamics of pluripotency, neural plate border and neural crest marker expression during neural crest induction. Neural crest induction was carried out on control QOLG (blue), mutant XIRY (purple), and LAIG (orange) hiPSC lines. Cells were harvested for RNA before plating (iPSC, time = 0 h), at 48 and 120 h of differentiation. RT-qPCR analysis was carried out for pluripotency markers [CMYC(A), NANOG(B), and OCT3/4(C)], neural border identity [PAX3(D), TFAP2A(E), and PAX7(F)] and subsequently markers of neural crest identity [FOXD3(G), SNAIL2(H), SOX10(I)]. P-values were determined using unpaired Student’s t-tests (*P ≤ 0.05, ∗∗P ≤ 0.001, ∗∗∗P ≤ 0.0001).
We then examined expression of neural plate border markers, including PAX3, PAX7, TFAP2A (Figures 6D–F). As expected, the control line showed an increase in all three neural plate border markers over time, with steadily increasing levels at 48 and 120 h. In contrast, while there was some increase in all three markers at 48 h in XIRY compared to the start of the induction, neither PAX3 nor PAX7 reached the higher levels achieved in QOLG at 120 h (Figures 6D–F). LAIG also fails to upregulate neural plate border markers PAX3 and TFAP2A (Figures 6D–E). For technical reasons, we were unable to assess PAX7 expression in LAIG. Together, this demonstrates that induction of the neural plate border genes is not delayed, and is instead unable to reach the levels attained in controls. Altogether these results are strongly indicative of a failure to respond appropriately to inductive signals.
When we examined expression of the neural crest markers FOXD3, SOX10, and SNAIL2 by qPCR, we found a profile similar to that of the neural border markers. While there was induction of all three genes during the differentiation protocol, expression levels in both mutant cell lines were significantly lower compared to control (Figures 6G–I). It is worth noting that prior to neural crest induction, LAIG expressed significantly higher levels of FOXD3 (Figure 6G), which was lost by 48 h of induction. This raised the possibility that the mutant cell lines responded to the differentiation protocol via induction of a non-neural crest state. Note that we see some moderate induction of neural border and neural crest markers in XIRY.
Surprisingly, we found that XIRY expressed significantly higher levels of the mesodermal marker Brachyury (BRY) by 2 days of culture (Figure 7A). SOX2 expression is an early marker of pluripotency (during the hiPSC stage) and then becomes a marker of neural tissues. Consistent with this, control QOLG cells express SOX2 initially (0 h), followed by a peak at neural border stages (48 h) and a dip as neural crest induction progresses. In contrast, we found that XIRY cells had normal levels of SOX2 initially, but this decreased significantly by day 5 of culture (Figure 7B). SOX2 expression in the mutant LAIG was significantly lower during pluripotency stages, but responded normally to induction.
FIGURE 7

BBS10 mutant line XIRY is skewed toward the mesodermal fate and has diminished WNT and BMP responsiveness. Neural crest induction was carried out on control QOLG (blue), mutant XIRY (purple), and LAIG (orange) hiPSC lines. Cells were harvested for RNA before plating (iPSC, time = 0 h), at 48 and 120 h of differentiation. (A–D) RT-qPCR analysis for a mesodermal marker, BRY(A), a neural marker, SOX2(B), neural border/pre-placodal marker, ZIC1(C) and pre-placodal marker SIX1(D). Note the increased levels of BRY(A) and decreased levels of ZIC1(C) and SIX1(D) in XIRY. (E–F) RT-qPCR analysis for AXIN2 a transcriptional target of WNT signaling (E), MSX1, a transcriptional target of BMP signaling (F) and PTC1, a transcriptional target of Hedgehog signaling (G). (E) Note transient increase in AXIN2 expression in XIRY from 0 to 48 h, but a decrease by 120 h. (F) Note a failure to activate MSX1 expression in XIRY and LAIG compared to control QOLG. (G) Note variability of PTC1 expression in XIRY at 0 h and both mutants at 48 h. P-values were determined using unpaired Student’s t-tests (*P ≤ 0.05, ∗∗P ≤ 0.001, ∗∗∗P ≤ 0.0001).
We next examined two markers of the pre-placodal ectoderm (PPE). Similar to the neural crest lineage, the pre-placodal ectoderm also relies on the appropriate induction of the neural border. ZIC1 marks both the neural border and subsequently the PPE, and in controls, can be seen increasing over the course of the 5-day protocol (Figure 7C). To our surprise, ZIC1 is significantly higher in XIRY mutant cells at 48 h but this trend is not continued, and levels of ZIC1 in the mutant are significantly lower by 5 days of culture (Figure 7C). At all stages throughout induction, expression of ZIC1 was significantly reduced in mutant LAIG. Sustained ZIC1 expression is necessary for activation of pre-placodal ectoderm genes such as SIX1 (Hong and Saint-Jeannet, 2007); consistent with this, in XIRY, there is only a minimal increase of SIX1 expression at 5 days compared to controls (Figure 7D). For technical reasons, we were unable to compare SIX1 levels in LAIG.
Given the importance of BMP and WNT signals during specification of the neural plate border and subsequently in induction of the neural crest and pre-placodal lineages, we hypothesized that the mutant line had a dampened response to these key signals. To test this, we examined expression of the Wnt-responsive gene Axin2 and the BMP-responsive gene MSX1 (Figures 7E,F, respectively). Consistent with reports from Leung et al. (2016) we saw a graded increase in AXIN2 expression in the control line QOLG during induction (Figure 7E). Both mutant lines showed drastically lower expression of AXIN2 by 5 days of culture (Figure 7E). Similarly, the BMP-responsive gene MSX1 failed to be up-regulated in the mutant lines (Figure 7F). Due to the crucial role for cilia in Hedgehog (Hh) signaling, we also examined the Hh target Patched1 (PTC1). There was generally no significant difference between control and mutant lines; however, mutants did show some variable increase early in induction (Figure 7G). This could indicate a lack of ciliary-mediated processing of the GLI repressors. Taken together, these data suggest that a failure in signal responsiveness in mutant cells underlies the observed neural crest induction phenotype.
Discussion
Neurocristopathies, or diseases of the neural crest lineage, were first considered collectively by Bolande (1974). Since then, it has become clear that these disorders encompass a broad variety of diseases (Vega-Lopez et al., 2018). Due to the diversity of neural crest derivatives, mutations affecting this lineage lead to many pleiotropic phenotypes. Furthermore, the assimilation of the neural crest lineage into multiple organ systems makes it particularly difficult to assess function of this lineage in vitro. Therefore, recent advances in human-derived cellular approaches offer new tools for the study of complex human conditions. To be able to best use these patient-derived cells, there is an acute need to establish streamlined, robust and reproducible assays to test each step of neural crest formation. In this work, we used the short neural crest induction protocol developed by Leung et al. (2016) to determine key requirements for a disease gene in neural crest stem cell pathology.
The long-term goal of a project such as this is the ability to model “disease in a dish,” using the patient’s own cells to understand the underlying cellular and molecular causes of pathology or using the patient’s cells to design new therapeutics. This approach complements existing animal models, which are very powerful for in vivo studies, but often do not entirely recapitulate the human condition. For example, genetic knock-outs of crucial genes frequently lead to embryonic lethality. However, it is clear from disorders such as BBS, that the human disease variants are often of unknown function and difficult to study without a clear cellular or molecular assay. Furthermore, genes such as BBS10 lead to a broad range of phenotypes in patients, including different manifestations from sibling to sibling (carrying the same variant). This variability also complicates our understanding of gene-function interactions.
To truly link gene identity to gene function using animal models, it would be necessary to generate “humanized” models: e.g., knock-ins of human disease gene variants. This is clearly not feasible in most cases, and, may not truly reflect the human condition due to genetic background. While use of hiPSCs to complement animal models has become more common in recent years [e.g., with CHD7 patients (Okuno et al., 2017)], there has not yet been an effort to systematically screen candidate neurocristopathy patients. Although this study is only focused on two BBS10 mutant lines, our work clearly illustrates the power of defined protocols to link gene variation to gene function.
Bardet–Biedl Syndrome 10 is a ciliopathy gene, and is one of the most common genes mutated in BBS. Despite our knowledge of multiple BBS human disease variants, it has been difficult to understand the direct causative mechanisms underlying the human condition. An established differentiation protocol such as the neural crest induction assay is an important tool that will allow us to dissect out the gene variants that are pathogenic. As the CRISPR/Cas9 approaches become more efficient, we should be able to selectively repair the BBS variants in these lines, or to generate “disease” variants in control lines. Alternatively, over-expression analysis with a wildtype construct might be sufficient to rescue this neural crest induction phenotype, while overexpression with different variants would allow us to test specific mutations for gain- or loss-of-function during neural crest induction. This will allow us to directly compare the effect of different variants on the same genetic background in order to help us begin to understand the pleiotropic effects seen in humans.
Applications of an assay such as this one are also broad. We can use this protocol to understand both the cellular and molecular profiles of patient specific cells. For example, when Leung et al. (2016) initially developed the short-term protocol, they tested the requirements of fibroblast growth factor (FGF) and bone morphogenetic protein (BMP) signaling during the induction phase. They noted that excessive levels of FGF led to increased mesodermal specification, while BMP4 supplementation led to increased non-neural ectoderm. In contrast, BMP inhibition reduced the levels of SOX10 positive neural crest cells. As BBS10 is a key ciliopathy gene, and the cilium can serve as a node for signal transduction, it was conceivable that the phenotypes seen in our BBS10 hiPSCs were due to an inability to respond to the appropriate inductive cues. As the main driver of the neural crest induction protocol in this assay is Wnt activation via GSK3 inhibition, our key finding here suggests that the ciliopathic hiPSCs have a diminished ability to respond to the GSK3 inhibitor CHIR99021, which is included throughout the induction protocol. Indeed, the XIRY line initially responded to CHIR99021 by upregulating the Wnt target gene AXIN2 modestly; however, further treatment did not recapitulate the upregulation seen in QOLG at 120 h (Figure 7E). XIRY also fails to activate expression of the BMP target gene MSX1. At this point, it is unclear whether XIRY is unable to respond, or whether there is another overriding signal. In the long-term, a molecular analysis such as RNAseq would be a more thorough way to compare responsiveness of wildtype and mutant cells. Nevertheless, our findings provide an intriguing starting point for understanding the inductive cues necessary for neural crest development.
To our knowledge, our study is the first exploration of the requirements for ciliopathy genes in human neural crest development. Our findings correlate with previous observations regarding BBS function in zebrafish models of neural crest development (Tobin et al., 2008), and suggests a potential role for cilia genes during establishment of the neural plate border and induction of the neural crest lineage. Having established this pipeline, these assays can be optimized to probe some key characteristics of neural crest cells. For example, two of the defining features of neural crest cells are the prodigious migratory capacity and the multipotency. Endpoint and live high-content imaging assays can be developed using these read outs. As we can already see from our studies, BBS10 mutant cells have very different morphology, protrusive activity and migratory capacity (data not shown). In fact, some ciliopathies, including BBS, have been associated with Hirschsprung’s disease, which is characterized by a failure of migration in neural crest-derived enteric neurons (de Pontual et al., 2009). We expect to be able to synchronize our cell populations to readily and directly compare the cellular behaviors (as in Wiseman et al., 2019). With regards to the differentiation capacity of neural crest, it should be immediately possible to adapt these cultures toward the differentiation of the diverse cell types produced by the neural crest, including bone, cartilage, adipocytes, neurons, pigment and other cell types.
Overall, the use of patient derived hiPSCs for the modeling of neurocristopathy phenotypes can elucidate the requirement of specific genes at crucial points of neural crest development. This human genetic background specific approach in combination with animal models will lead to a greater understanding of mammalian neural crest development and disease.
Statements
Author contributions
WB and KL designed the study, produced, collected and interpreted data, and wrote the manuscript. JG and J-LH performed the experiments and collected the data. AG provided help with experimental design and interpretation of findings. HipSci Consortium, DD, and PB provided the crucial reagents and expertise. All authors contributed to and approved the manuscript.
Funding
WB was supported by the EPSRC (1524932), KL was supported by BBSRC (BB/R015953/1), BHF (PG/17/79/33313), and MRC (MR/R014302/1). AG was supported by the Bone Cancer Research Trust. This study makes use of data generated by the HipSci Consortium, funded by The Wellcome Trust and the MRC.
Acknowledgments
We are grateful to Chloe Hurling, Nathalie Moens, Elizabeth Forsythe, Victor Hernandez-Hernandez, and Fiona Watt for advice and help throughout this project. We are also grateful to members of the Liu lab, especially Daniel Doro, for support and discussion. We thank Lorenzo Veschini for critical reading of the manuscript.
Conflict of interest
The authors declare that the research was conducted in the absence of any commercial or financial relationships that could be construed as a potential conflict of interest.
Footnotes
References
1
Adel Al-Lami H. Barrell W. B. Liu K. J. (2016). Micrognathia in mouse models of ciliopathies.Biochem. Soc. Trans.441753–1759. 10.1042/BST20160241
2
Álvarez-Satta M. Castro-Sánchez S. Valverde D. (2017). Bardet-Biedl syndrome as a chaperonopathy: dissecting the major role of Chaperonin-Like BBS proteins (BBS6-BBS10-BBS12).Front. Mol. Biosci.4:55. 10.3389/fmolb.2017.00055
3
Billingsley G. Bin J. Fieggen K. J. Duncan J. L. Gerth C. Ogata K. et al (2010). Mutations in chaperonin-like BBS genes are a major contributor to disease development in a multiethnic Bardet-Biedl syndrome patient population.J. Med. Genet.47453–463. 10.1136/jmg.2009.073205
4
Bolande R. P. (1974). The neurocristopathies: a unifying concept of disease arising in neural crest maldevelopment.Hum. Pathol.5409–429. 10.1016/S0046-8177(74)80021-3
5
Castro-Sánchez S. Álvarez-Satta M. Cortón M. Guillén E. Ayuso C. Valverde D. (2015). Exploring genotype-phenotype relationships in Bardet-Biedl syndrome families.J. Med. Genet.52503–513. 10.1136/jmedgenet-2015-103099
6
Chambers S. M. Mica Y. Lee G. Studer L. Tomishima M. J. (2013). Dual-SMAD Inhibition/WNT activation-based methods to induce neural crest and derivatives from human pluripotent stem cells.Methods Mol. Biol.1307329–343. 10.1007/7651_2013_59
7
Cognard N. Scerbo M. J. Obringer C. Yu X. Costa F. Haser E. et al (2015). Comparing the Bbs10 complete knockout phenotype with a specific renal epithelial knockout one highlights the link between renal defects and systemic inactivation in mice.Cilia4:10. 10.1186/s13630-015-0019-8
8
Cortés C. R. Metzis V. Wicking C. (2015). Unmasking the ciliopathies: craniofacial defects and the primary cilium.Wiley Interdiscip. Rev. Dev. Biol.4637–653. 10.1002/wdev.199
9
de Pontual L. Zaghloul N. A. Thomas S. Davis E. E. McGaughey D. M. Dollfus H. et al (2009). Epistasis between RET and BBS mutations modulates enteric innervation and causes syndromic Hirschsprung disease.Proc. Natl. Acad. Sci. U.S.A.10613921–13926. 10.1073/pnas.0901219106
10
Eggenschwiler J. T. Anderson K. V. (2007). Cilia and developmental signaling.Annu. Rev. Cell Dev. Biol.23345–373. 10.1146/annurev.cellbio.23.090506.123249
11
Forsythe E. Beales P. L. (2013). Bardet-Biedl syndrome.Eur. J. Hum. Genet.218–13. 10.1038/ejhg.2012.115
12
Hong C.-S. Saint-Jeannet J.-P. (2007). The activity of Pax3 and Zic1 regulates three distinct cell fates at the neural plate border.Mol. Biol. Cell182192–2202. 10.1091/mbc.e06-11-1047
13
Ishikawa H. Marshall W. F. (2011). Ciliogenesis: building the cell’s antenna.Nat. Rev. Mol. Cell Biol.12222–234. 10.1038/nrm3085
14
Jin H. Nachury M. V. (2009). The BBSome.Curr. Biol.19R472–R473. 10.1016/j.cub.2009.04.015
15
Leung A. W. Murdoch B. Salem A. F. Prasad M. S. Gomez G. A. García-Castro M. I. (2016). WNT/β-catenin signaling mediates human neural crest induction via a pre-neural border intermediate.Development143398–410. 10.1242/dev.130849
16
Menendez L. Kulik M. J. Page A. T. Park S. S. Lauderdale J. D. Cunningham M. L. et al (2013). Directed differentiation of human pluripotent cells to neural crest stem cells.Nat. Protoc.8203–212. 10.1038/nprot.2012.156
17
Nathwani B. B. Miller C. H. Yang T.-L. T. Solimano J. L. Liao J.-C. (2014). Morphological differences of primary cilia between human induced pluripotent stem cells and their parental somatic cells.Stem Cells Dev.23115–123. 10.1089/scd.2013.0162
18
Okuno H. Renault Mihara F. Ohta S. Fukuda K. Kurosawa K. Akamatsu W. et al (2017). CHARGE syndrome modeling using patient-iPSCs reveals defective migration of neural crest cells harboring CHD7 mutations.eLife61–26. 10.7554/eLife.21114
19
Panny A. Glurich I. Haws R. M. Acharya A. (2017). Oral and craniofacial anomalies of Bardet-Biedl syndrome: dental management in the context of a rare disease.J. Dent. Res.961361–1369. 10.1177/0022034517716913
20
Schock E. N. Chang C.-F. Struve J. N. Chang Y.-T. Chang J. Delany M. E. et al (2015). Using the avian mutant talpid2 as a disease model for understanding the oral-facial phenotypes of oral-facial-digital syndrome.Dis. Model. Mech.8855–866. 10.1242/dmm.020222
21
Seo S. Baye L. M. Schulz N. P. Beck J. S. Zhang Q. Slusarski D. C. et al (2010). BBS6, BBS10, and BBS12 form a complex with CCT/TRiC family chaperonins and mediate BBSome assembly.Proc. Natl. Acad. Sci. U.S.A.1071488–1493. 10.1073/pnas.0910268107
22
Stoetzel C. Laurier V. Davis E. E. Muller J. Rix S. Badano J. L. et al (2006). BBS10 encodes a vertebrate-specific chaperonin-like protein and is a major BBS locus.Nat. Genet.38521–524. 10.1038/ng1771
23
Stoetzel C. Muller J. Laurier V. Davis E. E. Zaghloul N. A. Vicaire S. et al (2007). Identification of a novel BBS gene (BBS12) highlights the major role of a vertebrate-specific branch of chaperonin-related proteins in Bardet-Biedl syndrome.Am. J. Hum. Genet.801–11. 10.1086/510256
24
Suspitsin E. N. Imyanitov E. N. (2016). Bardet-Biedl Syndrome.Mol. Syndromol.762–71. 10.1159/000445491
25
Tobin J. L. Di Franco M. Eichers E. May-Simera H. Garcia M. Yan J. et al (2008). Inhibition of neural crest migration underlies craniofacial dysmorphology and Hirschsprung’s disease in Bardet-Biedl syndrome.Proc. Natl. Acad. Sci. U.S.A.1056714–6719. 10.1073/pnas.0707057105
26
Trainor P. A. (ed.) (2014). Neural Crest Cells: Evolution, Development and Disease.Amsterdam: Elsevier.
27
Vega-Lopez G. A. Cerrizuela S. Tribulo C. Aybar M. J. (2018). Neurocristopathies: new insights 150 years after the neural crest discovery.Dev. Biol.444 (Suppl. 1), S110–S143. 10.1016/j.ydbio.2018.05.013
28
Wiseman E. Zamuner A. Tang Z. Rogers J. Munir S. Di Silvio L. et al (2019). Integrated multiparametric high-content profiling of endothelial cells.SLAS Discov.24264–273. 10.1177/2472555218820848
29
Zhang Q. Seo S. Bugge K. Stone E. M. Sheffield V. C. (2012). BBS proteins interact genetically with the IFT pathway to influence SHH-related phenotypes.Hum. Mol. Genet.211945–1953. 10.1093/hmg/dds004
30
Zhu Q. Lu Q. Gao R. Cao T. (2016). Prospect of human pluripotent stem cell-derived neural crest stem cells in clinical application.Stem Cells Int.20161–11. 10.1155/2016/7695836
Summary
Keywords
neural crest, human induced pluripotent stem cells, hiPSCs, Bardet–Biedl Syndrome, BBS
Citation
Barrell WB, Griffin JN, Harvey J-L, HipSci Consortium, Danovi D, Beales P, Grigoriadis AE and Liu KJ (2019) Induction of Neural Crest Stem Cells From Bardet–Biedl Syndrome Patient Derived hiPSCs. Front. Mol. Neurosci. 12:139. doi: 10.3389/fnmol.2019.00139
Received
17 January 2019
Accepted
13 May 2019
Published
21 June 2019
Volume
12 - 2019
Edited by
Sabine Wislet, University of Liège, Belgium
Reviewed by
Stephanie Michelle Willerth, University of Victoria, Canada; Gabsang Lee, Johns Hopkins University School of Medicine, United States; Diana Valverde, University of Vigo, Spain
Updates
Copyright
© 2019 Barrell, Griffin, Harvey, HipSci Consortium, Danovi, Beales, Grigoriadis and Liu.
This is an open-access article distributed under the terms of the Creative Commons Attribution License (CC BY). The use, distribution or reproduction in other forums is permitted, provided the original author(s) and the copyright owner(s) are credited and that the original publication in this journal is cited, in accordance with accepted academic practice. No use, distribution or reproduction is permitted which does not comply with these terms.
*Correspondence: Karen J. Liu, karen.liu@kcl.ac.uk
Disclaimer
All claims expressed in this article are solely those of the authors and do not necessarily represent those of their affiliated organizations, or those of the publisher, the editors and the reviewers. Any product that may be evaluated in this article or claim that may be made by its manufacturer is not guaranteed or endorsed by the publisher.