 Rong-Zheng Mu1,2†
 Yao-Jiang Huang
- 1Beijing Engineering Research Center of Food Environment and Public Health, Minzu University of China, Beijing, China
- 2College of Equipment Management and UAV Engineering, Air Force Engineering University, Xi'an, China
- 3College of Food Science and Engineering, Dalian Ocean University, Dalian, China
- 4Harvard T.H. Chan School of Public Health, Boston, MA, United States
Background: Studies suggest that neuron-specific enolase (NSE) levels in the cerebrospinal fluid (CSF) and serum play an important role in childhood epilepsy. However, these investigations remain controversial due to inconsistent clinical results. The present study aimed to quantitatively summarize and assess whether CSF and serum NSE levels are associated with epilepsy in children.
Methods : A systematic search of the Harvard Hollis+, Clinicaltrials, Open Gray, China National Knowledge Infrastructure, and Wanfang databases was performed. Studies investigating NSE and epilepsy were identified and retrieved. Original studies with data overlapping those from other investigations and those lacking the necessary data were excluded. The included studies were extracted and synthesized, and data were analyzed using a random-effects model in R Studio and Comprehensive Meta-Analysis version 3 (Biostat, Englewood, NJ, USA).
Results: Random-effects meta-analysis of 26 studies, including 1,360 patients, and 1,256 healthy control, revealed that childhood epilepsy exhibited meaningfully increased CSF and serum levels of NSE compared with controls [Hedges' g = 1.962 (95% confidence interval, 1.413–2.512); P < 0.001]. No single study meaningfully influenced the overall association between CSF and serum levels of NSE and epilepsy after sensitivity analysis. Subgroup analyses according to sample source and assay type revealed a significant association between NSE levels and epilepsy. Stratified analysis confirmed that NSE levels were significantly correlated with the severity of neurological compromise. Metaregression analyses revealed that sample size, mean age, and sex may contribute to effect-size reductions; however, sample source, assay type, and country did not moderate effect size. Funnel plots constructed using the trim-and-fill method confirmed that the outcome of the meta-analysis could not be due to publication bias.
Conclusion: The results demonstrated that childhood epilepsy exhibits significantly elevated levels of NSE in the CSF and serum, thus strengthening the association between increased NSE levels and epilepsy.
Background
Epilepsy affects more than 50 million individuals worldwide, and approximately 2.4 million new cases are diagnosed each year (http://www.who.int/en/news-room/fact-sheets/detail/epilepsy) (WHO, 2018). Biomarkers have innumerable potential applications for prevention, treatment, prediction, pharmacovigilance, and prognosis in epilepsy. Epilepsy prognosis and treatment are complex and costly for reasons including selection of subjects, length of follow-up, and selection of end points, for which biomarkers could serve as possible solutions. Development of reliable epilepsy biomarkers that facilitate in guiding diagnosis and therapy would be a major advance in management of the disease (Jain, 2010; Pitkänen et al., 2016). This is especially the case for seizure severity, pharmacoresistance (Hao et al., 2017), and predicting which patients will develop epilepsy after an initial injury. Cellular and molecular biomarkers play an important role in the evaluation of brain diseases, such as epilepsy (Pitkänen et al., 2016). Cellular and molecular biomarkers should ideally be derived from the blood, cerebrospinal fluid (CSF), urine, and/or sputum. They should be low in baseline variability in healthy conditions and exhibit large dynamic ranges such that levels are easily detected and measured using simple, technical, high-throughput methods that are cost-effective (Walker et al., 2016).
Neuron-specific enolase (NSE), a glycolytic enzyme found in the brain, is released from the neuronal cytoplasm and neuroendocrine cells. Neuron-specific enolase levels can be used as an index of neural maturation, which exist as γγ- and αγ-dimers (Isgro et al., 2015; Skolnick and Alves, 2017). Impairment of the integrity of the blood-brain barrier and neuronal damage can be reflected by the release of NSE into the CSF and blood (Isgro et al., 2015). Neuron-specific enolase is regarded to be a highly specific marker of damage to the peripheral or central nervous systems and a prognostic indicator in various disorders (Marangos and Schmechel, 1987; Maiti et al., 2017). Neuron-specific enolase has been demonstrated to provide quantitative measures of brain damage and used in outcome evaluation and to improve diagnosis in seizures, ischemic stroke, comatose patients after cardiopulmonary resuscitation for cardiac arrest, intracerebral hemorrhage, traumatic brain injury, and various neurological disorders (Marchi et al., 2004; Isgro et al., 2015; Wilkinson et al., 2017). Serum and CSF levels of NSE, elevated within the first 48 h after a seizure episode, are correlated with patient outcomes and the duration of epilepsy (DeGiorgio et al., 1995; Correale et al., 1998). Neuron-specific enolase levels can also be useful for diagnosis, prognosis, and follow-up of a variety of tumors and other diseases such as neuroendocrine tumors, neuroblastoma in newborns, and small cell lung cancer (Isgro et al., 2015; Mjønes et al., 2017; Furtado et al., 2019; Park et al., 2019).
Numerous studies have found that NSE levels in CSF and serum are associated with epilepsy in children (Gurnett et al., 2003; Tanuma et al., 2010; Guang, 2018). In contrast, however, others have reported that NSE levels demonstrate no significant difference between epilepsy and healthy control (HC) subjects (Miyata et al., 2012; Lei, 2014). Considering the inconsistent results among clinical studies, we aimed to systematically address and quantitatively summarize studies that analyzed CSF and serum levels of NSE in children with epilepsy and HCs. In the present study, we performed a meta-analysis of CSF and serum levels of NSE in children with epilepsy and HCs. We also performed subgroup analyses and metaregression to examine confounding factors and assessed the potential moderating effects of study heterogeneity. In addition, we used funnel plots constructed using the trim-and-fill method to evaluate publication bias.
Materials and Methods
Search Strategy and Study Selection
The present meta-analysis adhered to the Preferred Reporting Items for Systematic Reviews and Meta-Analyses (i.e., PRISMA) statement (Liberati et al., 2009). Two of the authors (S.L. and K.-G.L.) independently performed a systematic search of the peer-reviewed literature published in English and Chinese, including a search of the Harvard HOLLIS+ (Harvard HOLLIS+ includes databases such as PubMed, Web of Science, and PsycINFO), Clinicaltrials, Open Gray, and the China National Knowledge Infrastructure (CNKI) and Wanfang databases, from September 8, 2018, to April 6, 2019. The English literature search terms were as follows: (NSE OR neuron-specific enolase OR neuron specific enolase) and (Epilepsy OR Seizures) and (Childhood OR Children). The Chinese literature search terms were as follows: (NSE OR neuron-specific enolase OR 神经特异性烯醇化酶) and (Epilepsy OR Seizures OR 癫痫) and (Childhood OR Children OR 儿童). Original studies reporting data addressing CSF or serum levels of NSE in children with epilepsy and HCs were included. Original studies with data overlapping those from other studies and those lacking the necessary data were excluded.
Data Extraction
Data regarding mean NSE concentrations, standard deviation (SD), and sample sizes were extracted by two independent researchers. Information regarding potential moderator analyses of study type, region (country), publication year, mean age, diagnosis, sex distribution [male (%)], medication, disease duration, sample source, and assay type was also collected (Table 1).
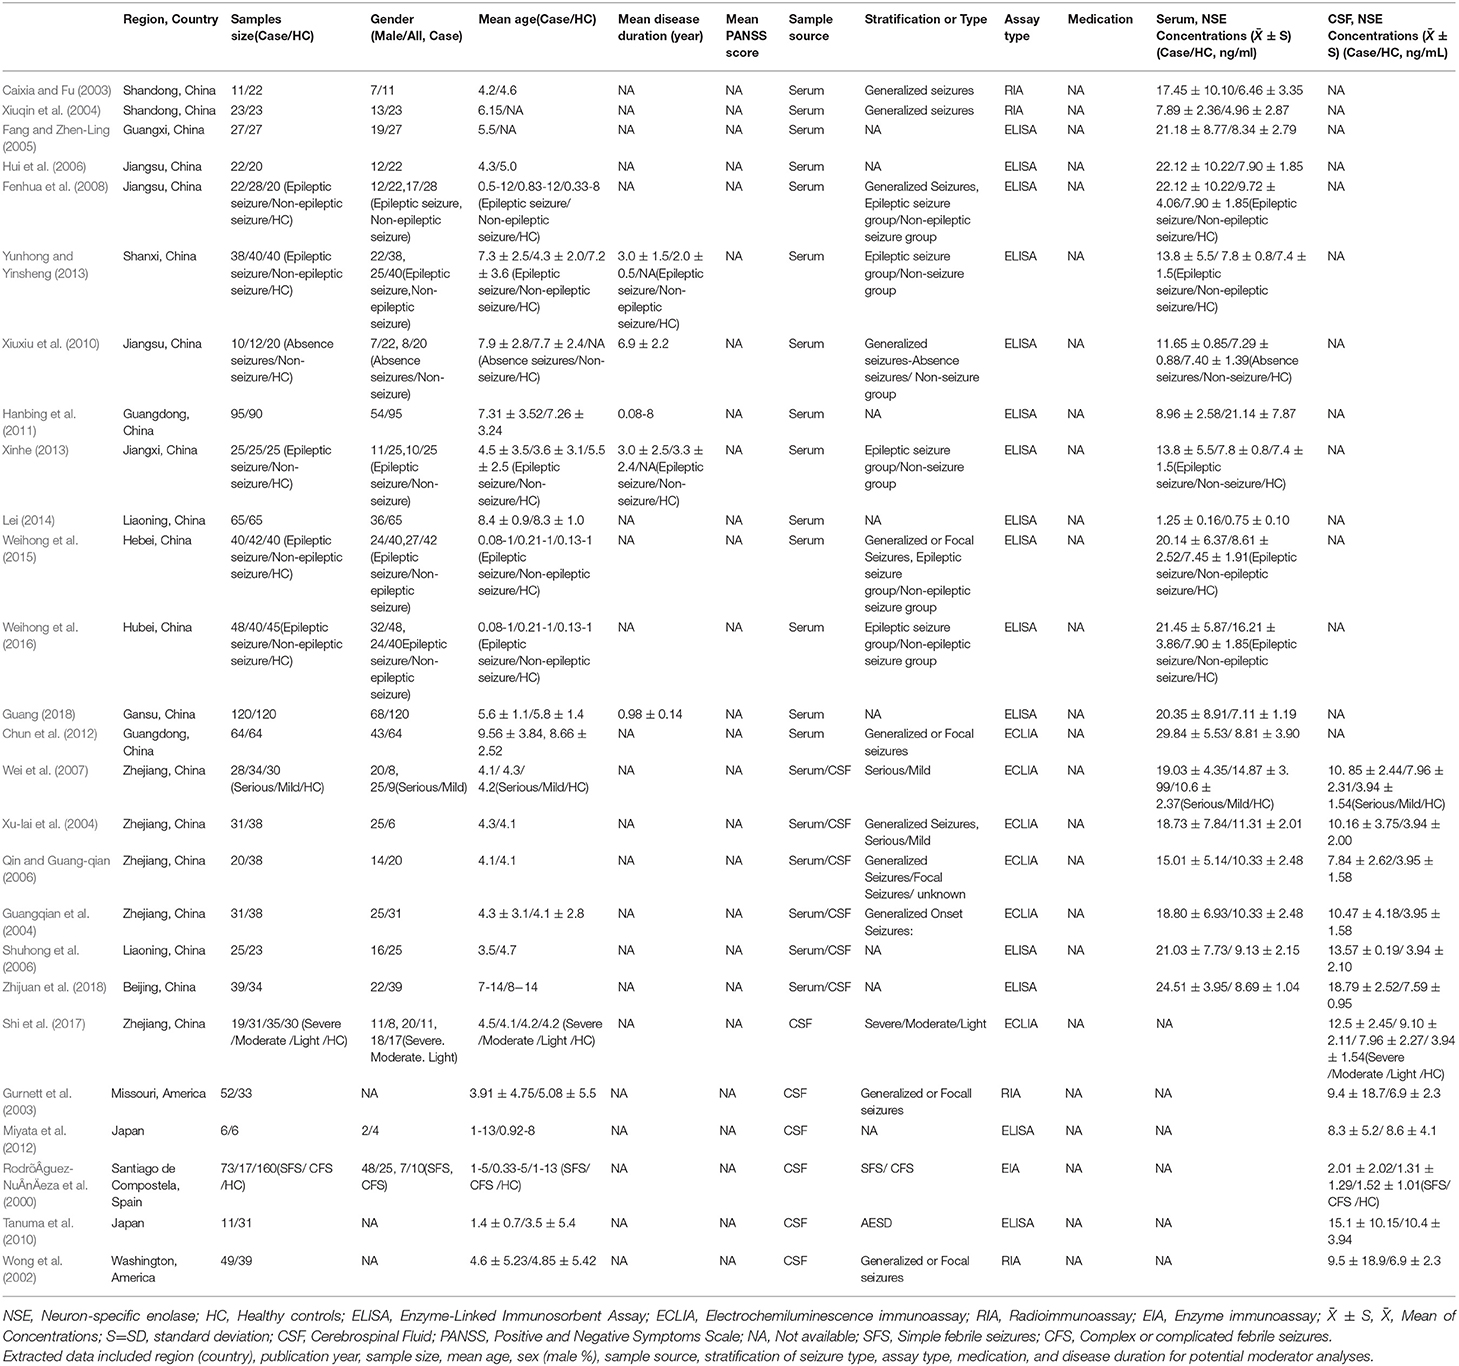
Table 1. Characteristics of the included studies.
Statistical Analysis
Statistical analyses were performed using RStudio version1.1.442 (RStudio, Inc., 2009–2018) (RStudio, 2015) and Comprehensive Meta-Analysis version 3 (Biostat, Englewood, NJ, USA) (CMA, 2014). Effect size (ES) was calculated according to mean NSE concentrations, SD, and sample sizes and expressed as standardized mean difference in NSE levels between patients and HCs, which were converted to Hedges' g value, which is an unbiased ES that provides a correction factor to adjust for sample size. Random-effects models were used to assess ES, and 95% confidence interval (CI) to evaluate the statistical differences in the pooled ES. Random-effect models are more conservative because they generate a wider CI if there is high heterogeneity between and/or among studies. Sensitivity analysis was performed using a “leave-one-out” (CMA, 2014) method to verify whether the results of a meta-analysis are influenced by an individual study.
Between-study heterogeneity was assessed using the Cochran Q test and the I2 statistic, with I2 values of 25, 50, and 75% indicating low, moderate, and high heterogeneity, respectively. The potential moderating effects of study heterogeneity was assessed using metaregression analyses, including sample size, mean age, sex, sample source, assay type, and country. Subgroup analyses were undertaken according to sample source and assay type.
Publication bias was evaluated using funnel plots and CMA version 3, and statistical significance was assessed using Egger's test. Publication bias was examined using the trim-and-fill method, and the potential effect of publication bias was evaluated using a classic fail-safe N test, which calculates the number of missing studies.
Results
The systematic search retrieved 430 studies from the English language databases (HOLLIS+, Clinicaltrials, and Open Gray), 233 from the Chinese databases (CNKI and Wanfang), and four dissertations from CNKI. Abstracts of the retrieved articles were reviewed to evaluate their eligibility for full-text review. Thirty-two studies were selected for full-text analysis, which, after careful scrutiny, resulted in the exclusion of six studies due to a lack of necessary data (Tumani et al., 1999; Tanabe et al., 2001; Palmio et al., 2008; Shiihara et al., 2012) or results overlapping data from other publications (Caixia et al., 2004; Shi, 2009). Finally, 26 studies, including 1,360 patients and 1,256 HCs, met the criteria for inclusion in the meta-analysis (RodrõÂguez-NuÂnÄeza et al., 2000; Wong et al., 2002; Caixia and Fu, 2003; Gurnett et al., 2003; Guangqian et al., 2004; Xiuqin et al., 2004; Xu-lai et al., 2004; Fang and Zhen-Ling, 2005; Hui et al., 2006; Qin and Guang-qian, 2006; Shuhong et al., 2006; Wei et al., 2007; Fenhua et al., 2008; Tanuma et al., 2010; Xiuxiu et al., 2010; Hanbing et al., 2011; Chun et al., 2012; Miyata et al., 2012; Xinhe, 2013; Yunhong and Yinsheng, 2013; Lei, 2014; Weihong et al., 2015, 2016; Shi et al., 2017; Guang, 2018; Zhijuan et al., 2018) (Figure 1).
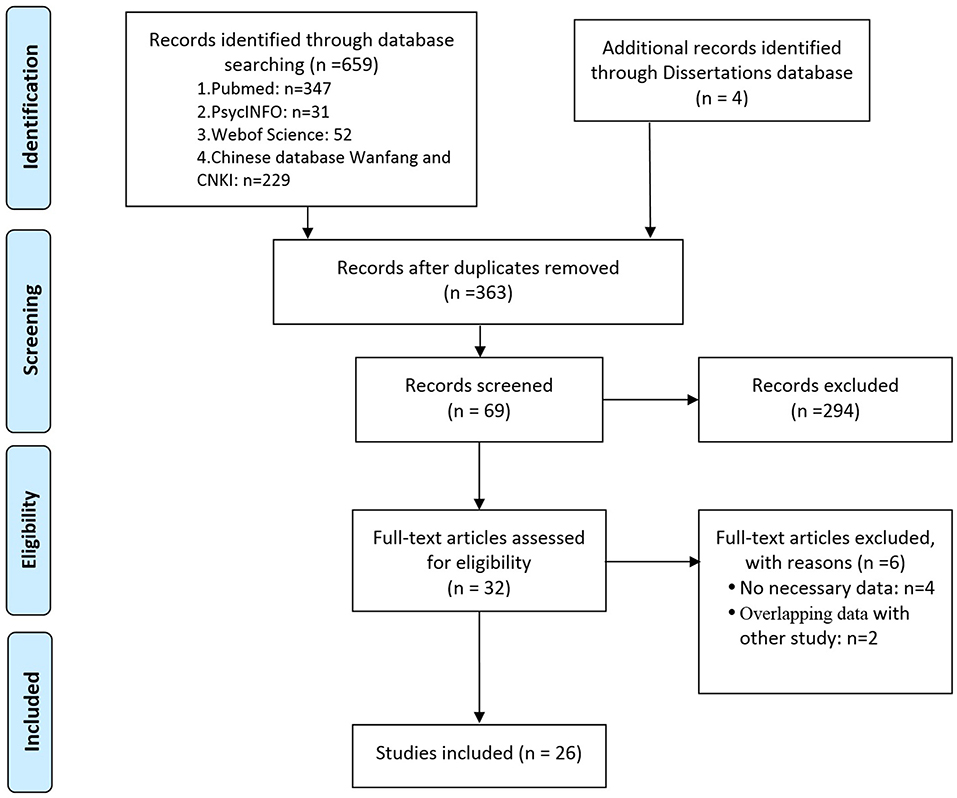
Figure 1. Preferred Reporting Items for Systematic Reviews and Meta-analyses (PRISMA) flow diagram illustrating the systematic literature search.
Main Association Between NSE Levels and Epilepsy
Random-effects meta-analysis was performed on the 26 included studies to generate a forest plot, which revealed that childhood epilepsy exhibited significantly increased CSF and serum levels of NSE compared with HCs [Hedges' g = 1.962 (95% CI = 1.413–2.512); P < 0.001] (Figure 2A). Neuron-specific enolase levels in CSF were significantly increased [Hedges' g = 2.005 (95% CI = 1.169–2.840); P < 0.001] (Figure 2B), as were serum levels [Hedges' g = 1.932 (95% CI = 1.189–2.675); P < 0.001] in childhood epilepsy (Figure 2C). Sensitivity analysis performed using the “leave-one-out” method revealed that no individual study meaningfully influenced the overall association between NSE levels and epilepsy (Figure 3). However, high between-study heterogeneity was found in the meta-analysis [Q = 437.746, degrees of freedom (df) = 26; I2 = 96.714; P < 0.001].
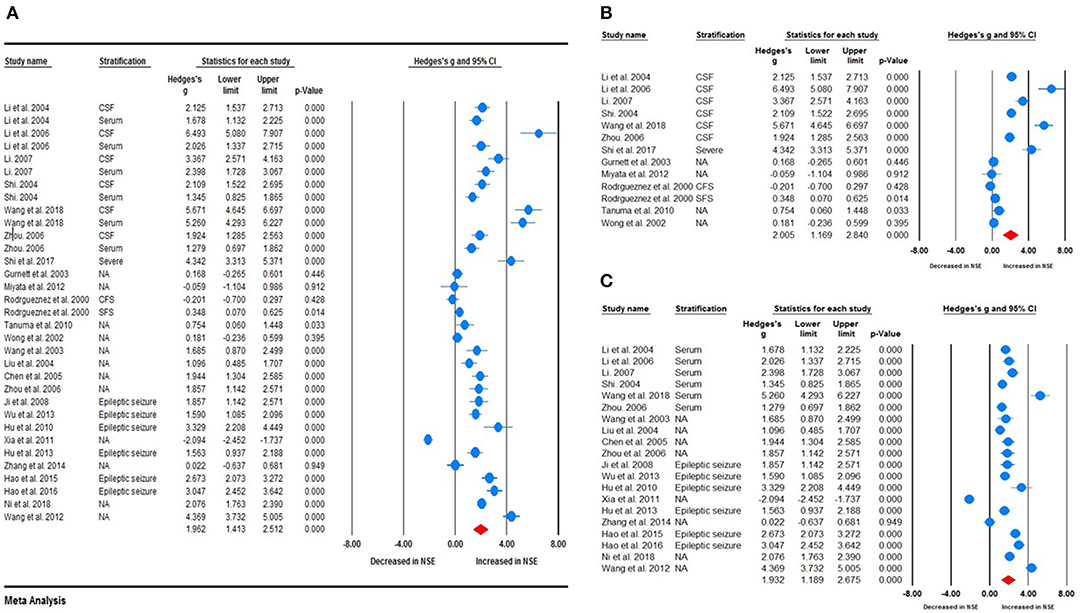
Figure 2. Forest plot illustrating the association between neuron-specific enolase (NSE) levels and epilepsy in children. (A) Forest plot illustrating the NSE levels in cerebrospinal fluid and serum in children with epilepsy. (B) Forest plot illustrating the association between NSE levels in cerebrospinal fluid (CSF) and epilepsy in children. (C) Forest plot illustrating the association between NSE levels in serum and epilepsy in children. The sizes of the circles are proportional to study weights. The diamond marker indicates pooled effect size (ES).
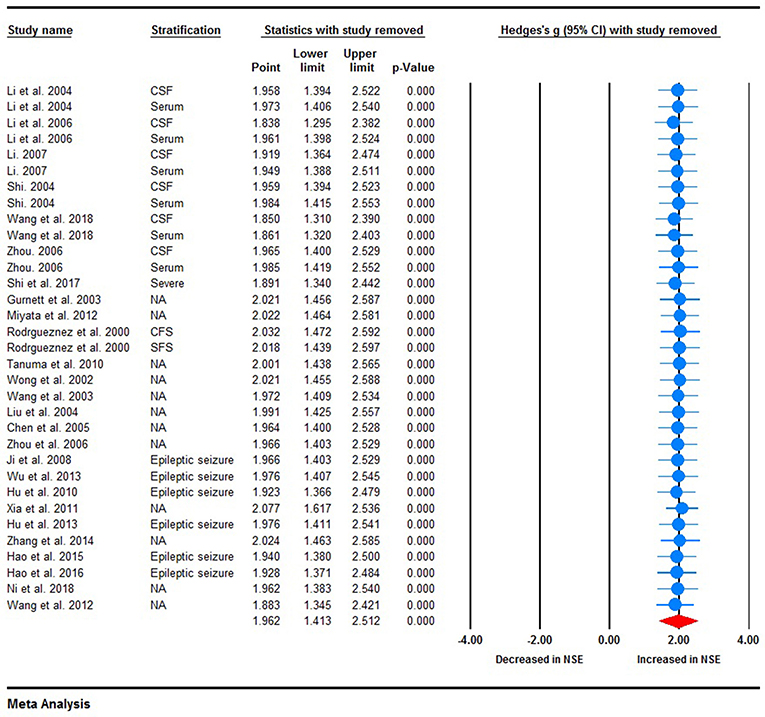
Figure 3. Sensitivity analysis. No individual study meaningfully influenced the overall association between neuron-specific enolase levels and epilepsy.
Subgroup Analyses
To investigate possible explanations for the high heterogeneity, subgroup analyses were performed to explore potential methodological and clinical moderators. Subgroup analysis according to assay type, such as enzyme-linked immunosorbent assay (ELISA) (Fang and Zhen-Ling, 2005; Qin and Guang-qian, 2006; Shuhong et al., 2006; Fenhua et al., 2008; Tanuma et al., 2010; Xiuxiu et al., 2010; Hanbing et al., 2011; Miyata et al., 2012; Xinhe, 2013; Yunhong and Yinsheng, 2013; Lei, 2014; Weihong et al., 2015, 2016; Guang, 2018; Zhijuan et al., 2018), electrochemiluminescence immunoassay (ECLIA) (Guangqian et al., 2004; Xu-lai et al., 2004; Qin and Guang-qian, 2006; Wei et al., 2007; Chun et al., 2012; Shi et al., 2017), or radioimmunoassay (RIA) (Wong et al., 2002; Caixia and Fu, 2003; Gurnett et al., 2003; Xiuqin et al., 2004), revealed that NSE levels were meaningfully increased in childhood epilepsy compared with HCs [Hedges' g = 2.194 (95% CI = 1.232–3.162), P < 0.001; Hedges' g = 2.455 (95% CI = 1.807–3.102), P < 0.001; and Hedges' g = 0.710 (95% CI = 0.082–1.337), P < 0.027, respectively] (Figure 4A). High heterogeneity was found between studies according to ELISA (Q = 358.601; df = 16; I2 = 97.571; P < 0.001), ECLIA (Q = 93.731, df = 9; I2 = 90.398, P < 0.001), enzyme immunoassay (Q = 3.554, df = 1; I2 = 71.864, P < 0.059), and RIA (Q = 16.416, df = 3; I2 = 81.725; P < 0.001). Subsequently, sample source subgroup analysis indicated a significant association between NSE levels in the CSF and epilepsy in children [Hedges' g = 2.005 (95% CI = 1.169–2.840); P < 0.001] (Figure 4B); similarly, studies using serum as the sample source indicated highly significant results [Hedges' g = 1.932 (95% CI = 1.189–2.675); P < 0.001]. High heterogeneity between studies was still observed in studies in which CSF was the sample source (Q = 225.462, df = 12, I2 = 96.313, P < 0.001) and from serum (Q = 324.994, df = 19, I2 = 96.960, P < 0.001). Furthermore, the pooled Hedges' g values for epileptic type subgroup analysis according to generalized seizures (Caixia and Fu, 2003; Guangqian et al., 2004; Xiuqin et al., 2004; Xu-lai et al., 2004; Fenhua et al., 2008; Xiuxiu et al., 2010), both types of seizure (mixed generalized and focal seizures) (Wong et al., 2002; Gurnett et al., 2003; Qin and Guang-qian, 2006; Chun et al., 2012; Weihong et al., 2015, 2016) and not available (RodrõÂguez-NuÂnÄeza et al., 2000; Fang and Zhen-Ling, 2005; Hui et al., 2006; Shuhong et al., 2006; Wei et al., 2007; Tanuma et al., 2010; Hanbing et al., 2011; Miyata et al., 2012; Xinhe, 2013; Yunhong and Yinsheng, 2013; Lei, 2014; Shi et al., 2017; Guang, 2018; Zhijuan et al., 2018) groups, were 1.811 (95% CI = 1.445–2.176), 1.937 (95% CI = 0.770–3.105), and 2.023 (95% CI = 1.151–2.896), respectively (Figure 4C). Again, high heterogeneity between studies was still observed in generalized seizure, both (generalized or focal seizure), and not available (Q = 17.684, df = 7, I2 = 80.415, P < 0.001; Q = 195.264, df = 6, I2 = 96.927, P < 0.001; and Q = 324.792, df = 17, I2 = 97.665, P < 0.001) groups.
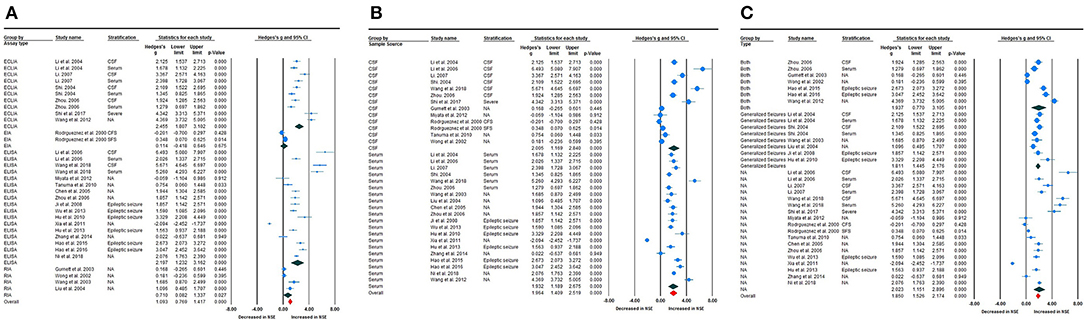
Figure 4. Subgroup analysis. (A) Assay-type subgroup analysis. (B) Sample source subgroup analysis. (C) Seizure-type subgroup analysis.
Stratified Analyses
Stratified analysis revealed a significant increase in NSE levels in epileptic seizure compared with non-epileptic seizure, and epileptic seizure compared with non-seizure (Figures 5A,B), although there was no statistically significant difference between the two groups given that the non-epileptic seizure and non-seizure P > 0.05. The ES value varied significantly according to disease severity, with severe, moderate, and light exhibiting clear changes in NSE levels, which were statistically different (Figure 5C). This subgroup analysis revealed that seizure type, such as generalized epileptic seizure, both (mixed generalized or focal seizures), and not available; ES; and NSE level demonstrated no clear differences (Figure 4C).
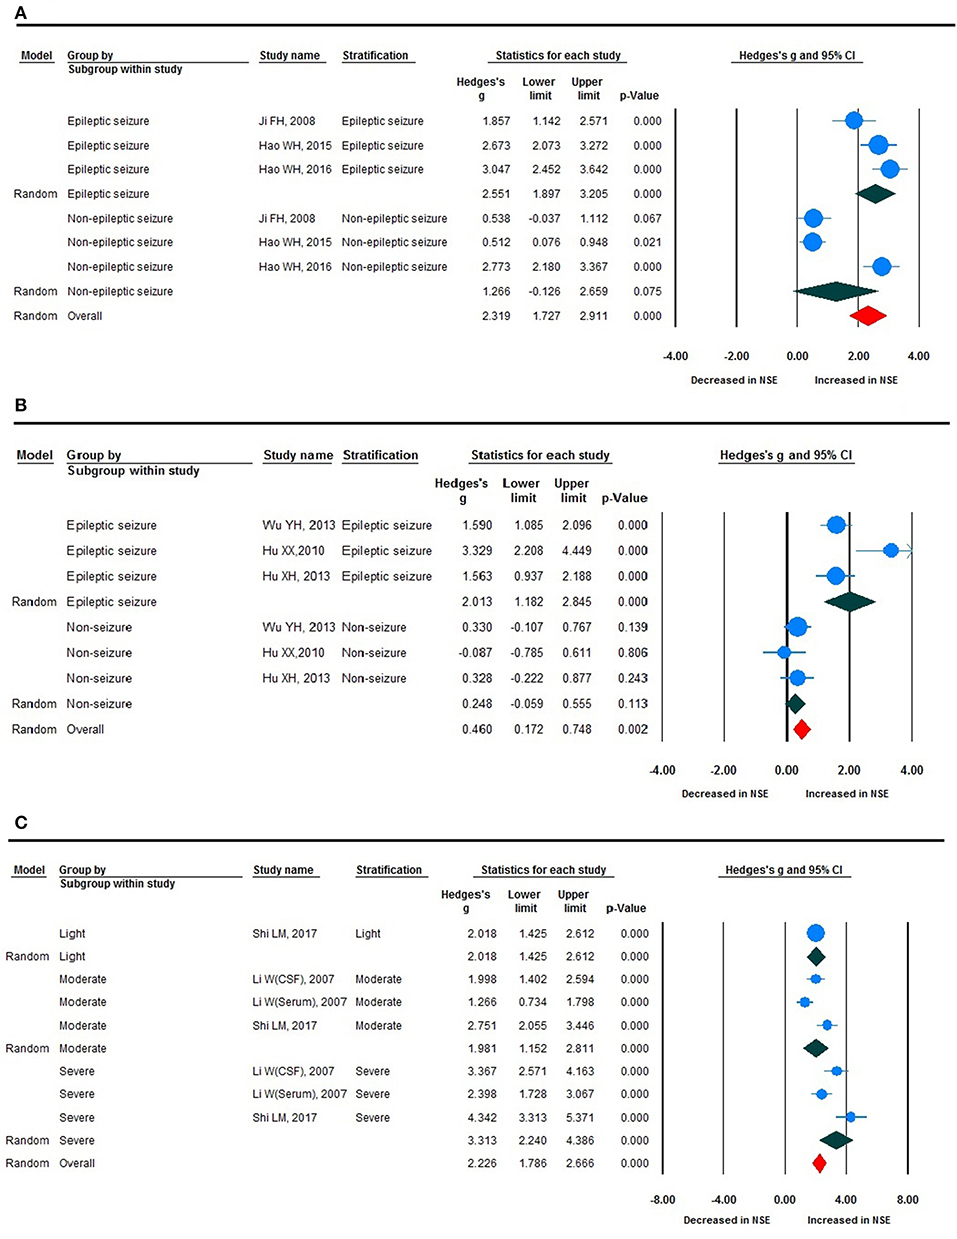
Figure 5. Forest plot for stratification analyses. (A) Forest plot for stratification analyses of epileptic and non-epileptic seizures. (B) Forest plot for stratification analyses of epileptic seizure and non-seizure. (C) Forest plot for stratification analyses of light, moderate, and severe disease severity.
Metaregression Analyses (Investigation of Heterogeneity)
Metaregression analysis was performed to investigate possible variables (sex, sample size, publication year, and mean age) that could explain the high heterogeneity in the meta-analysis. Sex (Figure 6A, regression coefficient [standard error (SE)] = −0.0343 [0.0319], 95% CI = −0.0969–0.0283), sample size [Figure 6B, regression coefficient (SE) = −0181 (0.0159), 95% CI = −0.0493–0.0130], and mean age [Figure 6C, regression coefficient (SE) = −0.1426 (0.2704), 95% CI = −0.6726 to −0.3875] demonstrated the moderating effects of ES were correlated with ES in the meta-analysis, indicating that sex, sample size, and mean age may influence reductions in NSE levels, although there was no statistically significant differences given that P > 0.05. Metaregression analysis of publication year, sample size, and mean age did not indicate moderating effects on the outcomes of ES.
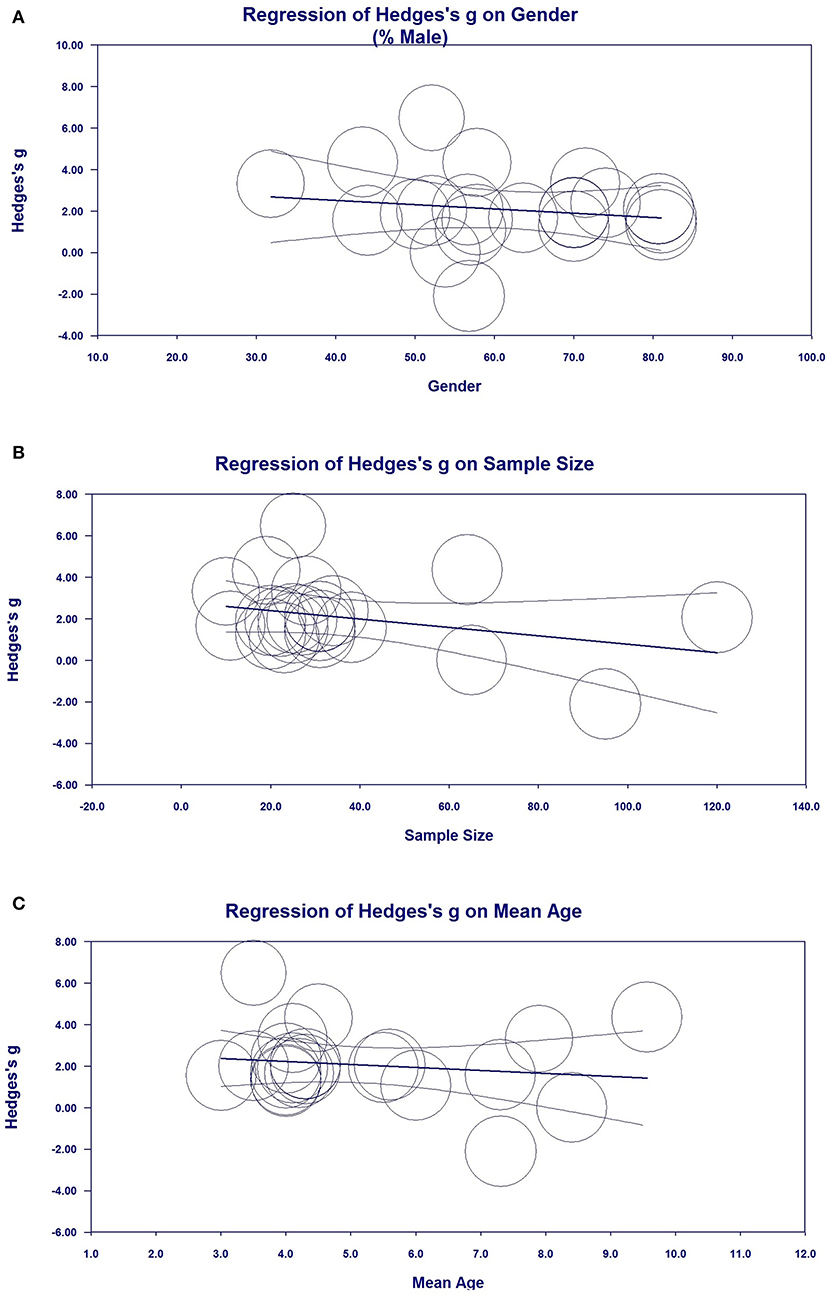
Figure 6. Metaregression analysis for neuron-specific enolase (NSE) in all studies. (A) Association between sex and Hedges' g. (B) Association between sample size and Hedges' g. (C) Association between mean age and Hedges' g.
Publication Bias
Visual inspection of the funnel plots revealed that the distribution of dots appeared to be non-symmetric, suggesting that there was a possibility of publication bias among studies (Figure 7A), which was confirmed by the Egger's test (P = 0.037). To adjust for funnel plot asymmetry, the trim-and-fill method was used in the meta-analysis, which yielded a Hedges' g = 0.6779 (95% CI = 0.106–1.250) (Figure 7B), confirming that the significant association between NSE levels and epilepsy in the meta-analysis was unlikely to be due to publication bias. The classic fail-safe N method was used to evaluate publication bias and indicated that for P > 0.05 in the meta-analysis would require 793 missing studies (with mean effect of zero), further supporting that the significant association between NSE levels and epilepsy demonstrated in the meta-analysis could not to be due to publication bias.
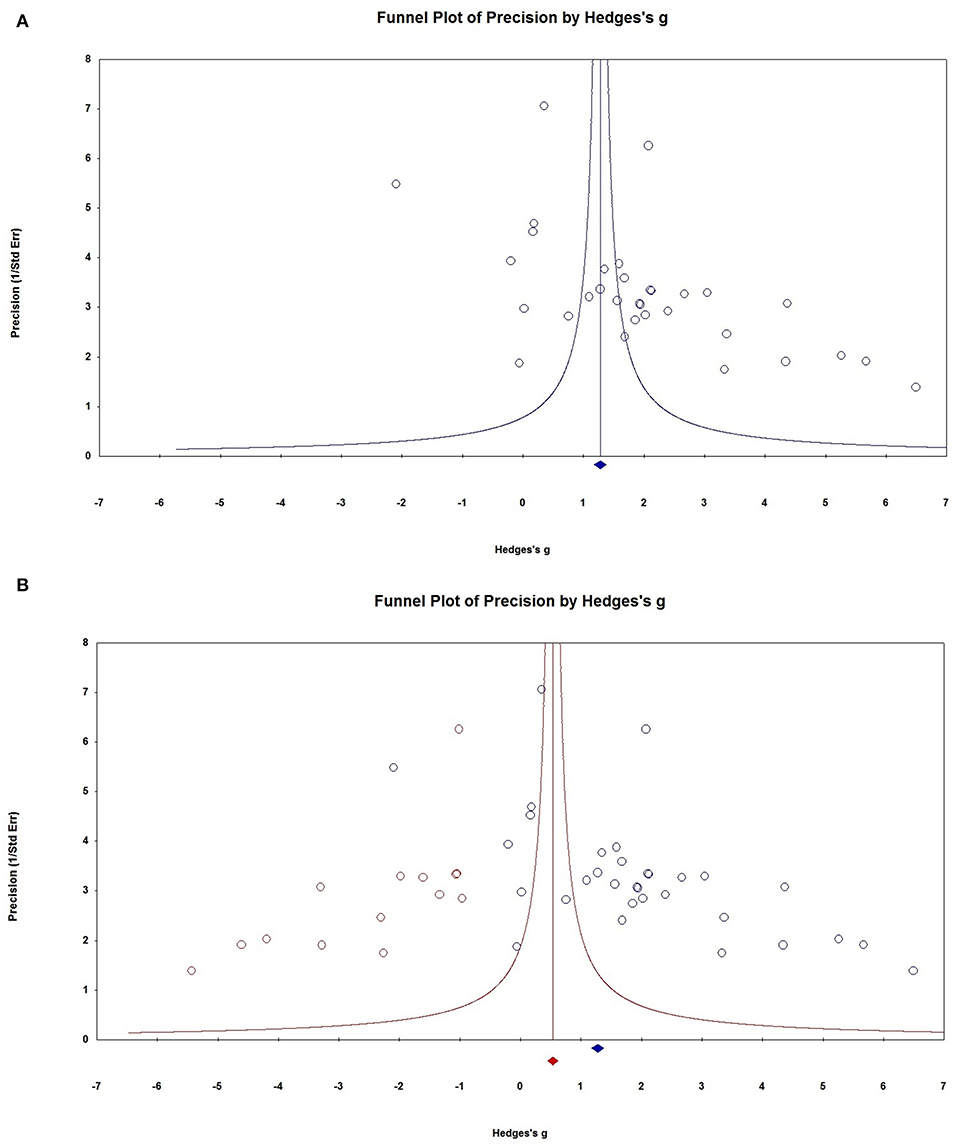
Figure 7. Publication bias. (A) Funnel plots for assessment of publication bias. (B) Funnel plot asymmetry assessing publication bias. The trim-and-fill method was used to adjust for funnel plot asymmetry.
Discussion
Neuron-specific enolase is released into the CSF and blood following impairment to the integrity of the blood-brain barrier and neuronal cell structural damage. Increases in NSE levels have been observed soon after brain injury and are followed by a sustained peak 48 h after injury (Berger et al., 2002). Neuron-specific enolase levels were elevated in both the CSF and serum, which appears to be a good marker reflecting the severity of neurological compromise and poorer outcomes in brain-injured patients (Berger et al., 2002; Chiaretti et al., 2009; Isgro et al., 2015). The International League Against Epilepsy defines an epileptogenesis biomarker as a measurable characteristic that reliably identifies the presence, development, progression, localization of an epileptogenic abnormality, or severity (Pitkänen et al., 2016). Neuron-specific enolase meets all of the clinical characteristics of an ideal biomarker (Walker et al., 2016). Some studies have found that oral antiepileptic agents reduce epileptic seizures and neuronal death, which are accompanied by a decrease in NSE levels (Xi et al., 2011; Ming and Yanping, 2012; Maiti et al., 2017; Tao and Yiming, 2017; Shijun, 2018). Neuron-specific enolase may play an important role due to its minimal invasiveness in early diagnosis, evaluation of therapeutic effects, prognosis, and crucial medical interventions in epilepsy.
The present meta-analysis integrated and analyzed 26 individual studies including 1,360 patients and 1,256 HCs and provided strong evidence supporting significantly increased NSE levels in the CSF and serum of children with epilepsy compared with HCs. Sensitivity analysis revealed that no single study significantly influenced the overall association between NSE levels and epilepsy according to the “leave-one-out” analysis. Stratified analysis demonstrated that NSE levels successively increased in patients with moderate and severe brain injury, which could predict computed tomography (CT) results of craniocerebral injury, thereby reducing the number of CT examinations and guiding treatment. Although publication bias among studies was revealed by funnel plots and Egger's tests, our analyses using the trim-and-fill method suggested that the significant association between NSE levels and epilepsy in our meta-analysis was unlikely to be caused by publication bias.
Large heterogeneity between studies was found in the present meta-analysis; however, sensitivity analysis indicated that no individual study could fully explain this heterogeneity. Subgroup analyses of study type, sample source, and assay type revealed a statistically significant association between NSE levels and epilepsy, although the high heterogeneity remained, and none of subgroups with relevant categorical variables fundamentally reduced or explained the heterogeneity. Stratified analysis confirmed that NSE levels were significantly correlated with clinical severity, and the ES value varied significantly according to different disease severities (i.e., severe, moderate, and light), as previously reported in the literature (Berger et al., 2002; Chiaretti et al., 2009). Metaregression analysis was used to assess confounding factors (sex, sample size, publication year, and mean age) that could account for the high heterogeneity. The results showed that sex, sample size, and mean age may influence reduction in NSE levels. Moreover, publication year, sample size, and mean age were not possible variables explaining the heterogeneity among the included studies.
The present meta-analysis had a few limitations, although its results significantly strengthened the association between increased NSE levels and epilepsy. First, metaregression analysis revealed that sex, sample size, and mean age may influence reductions in NSE levels, although the differences were not statistically significant (i.e., >0.05). Moreover, we attempted to adjust for more possible confounders; however, none of the relevant methodological and biological variables that we checked could explain the heterogeneity. Second, although we performed stratification analysis according to disease severity and type of epilepsy, only six studies provided detailed data regarding generalized or focal seizures. Furthermore, we did not perform stratification analysis of the pharmacological history of the patients due to a lack of data and studies, although some studies have reported pharmacological history in childhood epilepsy (Maiti et al., 2017; Tao and Yiming, 2017). Finally, data from the included studies may have been subject to measurement, selection, and interviewer biases because most were clinical investigations.
Further investigations of NSE levels and the influence of relevant confounding factors are needed to understand the molecular mechanisms driving changes in NSE levels in patients with epilepsy. Integrating electroencephalography and neuroimaging, molecular and cellular biomarkers, genomic information, and clinical information will be important in this regard.
Conclusion
This study provided supportive evidence that CSF and serum levels of NSE are significantly elevated in childhood epilepsy, which is helpful for early diagnosis, evaluation of therapeutic effects, prognosis, and crucial medical interventions for epilepsy.
Author Contributions
Y-JH: study conception and design. SL and R-ZM: data collection. R-ZM, SL, and Y-JH: analysis or interpretation of data. All authors drafted the manuscript, critical revision, and read and approved the final manuscript.
Funding
This study was supported by the Double Top University Plan, Minzu University of China and the Minzu University 985 Academic Team-building Fund (2018MDTD25C).
Conflict of Interest
The authors declare that the research was conducted in the absence of any commercial or financial relationships that could be construed as a potential conflict of interest.
Abbreviations
CSF, Cerebrospinal fluid; NSE, neuron-specific enolase; HC, healthy controls; ES, effect size; CNKI, China National Knowledge Infrastructure; df, degree of freedom; ELISA, enzyme-linked immunosorbent assay; ECLIA, electrochemiluminescence immunoassay; RIA, radioimmunoassay; CSF, cerebrospinal fluid; 95% CI, 95% confidence interval.
References
Berger, R. P., Pierce, M. C., Wisniewski, S. R., Adelson, P. D., Clark, R., Ruppel, R. A., et al. (2002). Neuron-specific enolase and S100B in cerebrospinal fluid after severe traumatic brain injury in infants and children. Pediatrics 109:E31. doi: 10.1542/peds.109.2.e31
Caixia, W., and Fu, L. (2003). The clinical change of neuron specific enolase in patients with epilepsy. Chin. J. Birth Heal. Heredity 11, 51–52. doi: 10.1212/wnl.53.8.1761
Caixia, W., Xiaoyan, Z., and Fu, L. (2004). A detection of Neuron-Specific Enolase level in Serum of Children with Epilepsy. Med. J. Qilu, 19, 242–243. doi: 10.3969/j.issn.1008-0341.2004.03.022
Chiaretti, A., Barone, G., Riccardi, R., Antonelli, A., Pezzotti, P., Genovese, O., et al. (2009). NGF, DCX, and NSE upregulation correlates with severity and outcome of head trauma in children. Neurology 72, 609–616. doi: 10.1212/01.wnl.0000342462.51073.06
Chun, W., Qiongxiang, Q., Zhihong, T., and Muqing, Z. (2012). Research of the serum level of neuron-specific enolase in children with various types of seizure. Chin. J. Contemp. Neurol. Neurosurg. 12, 573–577. doi: 10.3969/j.issn.1672-6731.2012.05.013
CMA (2014). “Comprehensive meta-analysis,” in Version 3.3. eds M. Borenstein, L. Hedges, J. Higgins, H. Rothstein (Biostat, Englewood, NJ: Biostat).
Correale, J., Rabinowicz, A., Heck, C., Smith, T., Loskota, W., and deGiorgio, C. (1998). Status epilepticus increases CSF levels of neuron-specific enolase and alters the blood-brain barrier. Neurology 50, 1388–1391. doi: 10.1212/WNL.50.5.1388
DeGiorgio, C., Correale, J., Gott, P., Ginsburg, D., Bracht, K., Smith, T., et al. (1995). Serum neuron-specific enolase in human status epilepticus. Neurology 45, 1134–1137. doi: 10.1212/WNL.45.6.1134
Fang, C., and Zhen-Ling, L. (2005). Changes and clinical significance of neuron specific enolase in the children of epilepsy. Guangxi Med. J. 27, 495–496. doi: 10.3969/j.issn.0253-4304.2005.04.017
Fenhua, J., Hui, Z., Bowen, Y., and Jianmei, Z. (2008). Diagnostic value of neuron-specific enolase in the children with seizure diseases. Jiang su Med. J 34, 1249–1250. doi: 10.19460/j.cnki.0253-3685.2008.12.024
Furtado, G. V., Oliveira, C. M., Bolzan, G., Saute, J. A. M., Saraiva-Pereira, M. L., and Jardim, L. B. (2019). State biomarkers for machado joseph disease: validation, feasibility and responsiveness to change. Genet. Mol. Biol. 42, (Suppl.1), 238–251. doi: 10.1590/1678-4685-gmb-2018-0103
Guang, N. (2018). Expression and clinical significance of NSE and IGF-1 in serum of epileptic children. China Foreign Med. Treatment 37, 37–39. doi: 10.16662/j.cnki.1674-0742.2018.01.037
Guangqian, L., Zhongdong, L., Ying, J., Xulai, S., Xiuyun, Y., and Hongwen, H. (2004). Changes of serum and cerebrospinal fluid neron-specific enolase, S-100β and myelin basic protein levels in children with epilepsy after seizures. Chin. J. Contemp. Pediatr. 6, 500–503. doi: 10.3969/j.issn.1008-8830.2004.06.014
Gurnett, C. A., Landt, M., and Wong, M. (2003). Analysis of cerebrospinal fluid glial fibrillary acidic protein after seizures in children. Epilepsia 44, 1455–1458. doi: 10.1046/j.1528-1157.2003.21603.x
Hanbing, X., Xi, L., Gang, Z., Fang, L., and Chunyi, L. (2011). Expression of serum BDNF and NSE in children with epilepsy and its clinical significance. Mater. Child Health Care of China 26, 1340–1341.
Hao, W., Jiang, H., and Ma, H. (2017). Levels of serum S100B protein BDNF and IGF-1 and clinical significance in infants with epilepsy. Chin. J. Clin. Res. 30, 1186–1188. doi: 10.13429/j.cnki.cjcr.2017.09.009
Hui, Z., Bowen, Y., Fenhua, J., Yude, Z., Jianmei, Z., Jie, X., et al. (2006). Changes and clinical significance of neuron-specific enolase in pediatric convulsion. Med. J. Commun. 20, 747–748. doi: 10.3969/j.issn.1006-2440.2006.06.075
Isgro, M. A., Bottoni, P., and Scatena, R. (2015). “Neuron-specific enolase as a biomarker: biochemical and clinical aspects,” in Advances in Cancer Biomarkers: From Biochemistry to Clinic for a Critical Revision, ed R. Scatena (Dordrecht: Springer), 125–143. doi: 10.1007/978-94-017-7215-0_9
Lei, Z. (2014). Detection value of serum NSE, Hcy, IGF-1 and cytokines in children with epilepsy. Guide China Med. 12:217. doi: 10.5912/j.cnki.gocm.2014.28.484
Liberati, A., Altman, D. G., Tetzlaff, J., Mulrow, C., Gøtzsche, P. C., Ioannidis, J. P. A., et al. (2009). The PRISMA statement for reporting systematic reviews and meta-analyses of studies that evaluate health care interventions: explanation and elaboration. PLoS Med. 6:e1000100. doi: 10.1371/journal.pmed.1000100
Maiti, R., Mishra, B. R., Sanyal, S., Mohapatra, D., Parida, S., and Mishra, A. (2017). Effect of carbamazepine and oxcarbazepine on serum neuron-specific enolase in focal seizures: a randomized controlled trial. Epilepsy Res. 138, 5–10. doi: 10.1016/j.eplepsyres.2017.10.003
Marangos, P. J., and Schmechel, D. E. (1987). Neuron specific enolase, a clinically useful marker for neurons and neuroendocrine cells. Annu. Rev. Neurosci.10, 269–295. doi: 10.1146/annurev.ne.10.030187.001413
Marchi, N., Cavaglia, M., Fazio, V., Bhudia, S., Hallene, K., and Janigro, D. (2004). Peripheral markers of blood-brain barrier damage. Clin. Chim. Acta. 342, 1–12. doi: 10.1016/j.cccn.2003.12.008
Ming, Z., and Yanping, Z. (2012). Changes of neuron-specific enolase in serum and cerebrospinal fluid after hyperbaric oxygen therapy for secondary epilepsy. Int. J. Lab. Med. 33, 1273–1274. doi: 10.3969/j.issn.1673-4130.2012.10.064
Miyata, R., Tanuma, N., Hayashi, M., Imamura, T., Takanashi, J., Nagata, R., et al. (2012). Oxidative stress in patients with clinically mild encephalitis/encephalopathy with a reversible splenial lesion (MERS). Brain Dev. 34, 124–127. doi: 10.1016/j.braindev.2011.04.004
Mjønes, P., Sagatun, L., Nordrum, I. S., and Waldum, H. L. (2017). Neuron-specific enolase as an immunohistochemical marker is better than its reputation. J. Histochem. Cytochem. 65, 687–703. doi: 10.1369/0022155417733676
Palmio, J., Keranen, T., Alapirtti, T., Hulkkonen, J., Makinen, R., Holm, P., et al. (2008). Elevated serum neuron-specific enolase in patients with temporal lobe epilepsy: a video-EEG study. Epilepsy Res. 81, 155–160. doi: 10.1016/j.eplepsyres.2008.05.006
Park, D. W., Park, S. H., and Hwang, S. K. (2019). Serial measurement of S100B and NSE in pediatric traumatic brain injury. Childs Nerv. Syst. 35, 343–348. doi: 10.1007/s00381-018-3955-y
Pitkänen, A., Löscher, W., Vezzani, A., Becker, A. J., Simonato, M., Lukasiuk, K., et al. (2016). Advances in the development of biomarkers for epilepsy. Lancet Neurol. 15, 843–856. doi: 10.1016/S1474-4422(16)00112-5
Qin, Z., and Guang-qian, L. (2006). Changes of serumand cerebrospinal fluid neuron-specific enolase, s-100β and myelin basic protein in children with epilepsy after single episodes. J. Appl. Clin. Pediatr. 21, 1417–1418. doi: 10.3969/j.issn.1003-515X.2006.20.027
RodrõÂguez-NuÂnÄeza, A., Cida, E., RodrõÂguez-GarcõÂab, J., CaminÄab, F., RodrõÂguez-Segadeb, S., and Castro-Gagoa, M. (2000). Cerebrospinal Fluid purine metabolite and neuron-specific enolase concentrations after febrile seizures. Brain Develop. 22, 427–431. doi: 10.1016/S0387-7604(00)00172-8
Shi, L. M. (2009). The Change and Significance of NSE IL-1β and EPO in Cerebrospinal Fluid with Epileptic Seizures in Childre. Wenzhou: Master Wenzhou Medical College.
Shi, L. M., Chen, R. J., Zhang, H., Jiang, C. M., and Gong, J. (2017). Cerebrospinal fluid neuron specific enolase, interleukin-1beta and erythropoietin concentrations in children after seizures. Childs Nerv. Syst. 33, 805–811. doi: 10.1007/s00381-017-3359-4
Shiihara, T., Miyake, T., Izumi, S., Watanabe, M., Kamayachi, K., Kodama, K., et al. (2012). Serum and cerebrospinal fluid S100B, neuron-specific enolase, and total tau protein in acute encephalopathy with biphasic seizures and late reduced diffusion: a diagnostic validity. Pediatr. Int. 54, 52–55. doi: 10.1111/j.1442-200X.2011.03454.x
Shijun, Z. (2018). Efficacy of edaravone and sodium valproate in the treatment of secondary epilepsy after stroke and its effect on NSE. Contemporary Med. 24, 108–109. doi: 10.3969/j.issn.1009-4393.2018.02.049
Shuhong, L., Daojian, R., and Yibin, Y. (2006). Neuron-specific enolase concentrations of serum and cerebrospinal fluid in human epilepsy. Liaoning Med. 20, 65–66. doi: 10.3969/j.issn.1001-1722.2006.02.005
Skolnick, B. E., and Alves, W. M. (2017). Handbook of Neuroemergency Clinical Trials. San Diego, CA: Academic Press.
Tanabe, T., Suzuki, S., Hara, K., Shimakawa, S., Wakamiya, E., and Tamai, H. (2001). Cerebrospinal fluid and serum neuron-specific enolase levels after febrile seizures. Epilepsia 42, 504–507. doi: 10.1046/j.1528-1157.2001.30100.x
Tanuma, N., Miyata, R., Kumada, S., Kubota, M., Takanashi, J., Okumura, A., et al. (2010). The axonal damage marker tau protein in the cerebrospinal fluid is increased in patients with acute encephalopathy with biphasic seizures and late reduced diffusion. Brain Dev. 32, 435–439. doi: 10.1016/j.braindev.2009.07.004
Tao, G., and Yiming, L. (2017). Effect of yuxianling granule combined with “Epilepsy three needles” on EEG and serum NSE and S100β levels in children with epilepsy. Moder. J. Integr. Tradition. Chinese and Western Med. 26, 3600–3602. doi: 10.3969/j.issn.1008-8849.2017.32.023
Tumani, H., Otto, M., Gefeller, O., Wiltfang, J., Herrendorf, G., Mogge, S., et al. (1999). Kinetics of serum patients neuron-specific enolase and prolactin in after single epileptic seizures. Epilepsia 40, 713–718. doi: 10.1111/j.1528-1157.1999.tb00768.x
Walker, L. E., Janigro, D., Heinemann, U., Riikonen, R., Bernard, C., and Patel, M. (2016). WONOEP appraisal: molecular and cellular biomarkers for epilepsy. Epilepsia 57, 1354–1362. doi: 10.1111/epi.13460
Wei, L., Qian, L. G., Zhong-dong, L., Ying, J., and Sheng-xin, J. (2007). Expressions of neuron - specific enolase and tumor necrosis factor-α concentrations of serum and cerebrospinal fluid in children with epilepsy and its significances. J. Appl. Clin. Pediatr. 22, 611–612.
Weihong, H., Baoyuan, X., and Lihua, W. (2016). The correlation of Serum NSE and BDNF with epileptic seizures and development in infants. J. Chengdu Med. College 11, 466–468. doi: 10.3969/j.issn.1674-2257.2016.04.018
Weihong, H., Jinfeng, R., Xiaoyan, L., Jie, Z., Huiping, M., Wei, T., et al. (2015). Correlation between serum NSE and BDNF and seizures in infants. Lab. Med. Clin. 12, 3736–3738.
WHO (2018). Epilepsy. Available online at: http://www.who.int/en/news-room/fact-sheets/detail/epilepsy. (accessed February 08, 2018).
Wilkinson, A. A., Dennis, M., Simic, N., Taylor, M. J., Morgan, B. R., Frndova, H., et al. (2017). Brain biomarkers and pre-injury cognition are associated with long-term cognitive outcome in children with traumatic brain injury. BMC Pediatr. 17:173. doi: 10.1186/s12887-017-0925-6
Wong, M., Ess, K., and Landt, M. (2002). Cerebrospinal fluid neuron-specific enolase following seizures in children: role of etiology. J. Child Neurol. 17, 261–264. doi: 10.1177/088307380201700404
Xi, C., Shoumei, D., Lixian, G., Xingping, L., Jun, B., Xiaoning, W., et al. (2011). Effects of valproic acid and carbamazepine on neuron-specific enolase in children with epilepsy. Chinese J. Pract. Pediatrics 26, 58–59.
Xinhe, H. (2013). Expression levels of serum NSE and IL-6 in children with refractory epilepsy and its clinical significance. Nat. Med. Front. China 8, 66–67. doi: 10.3969/j.issn.1673-5552.2013.18.0049
Xiuqin, L., Guanqi, W., and Ruopeng, S. (2004). The value of NSE and video-eeg for diagnosis of epilepsy and pseudo-epilepsy in childhood. J. Binzhou Med. Coll. 27, 336–337. doi: 10.3969/j.issn.1001-9510.2004.05.008
Xiuxiu, H., Jingde, D., Xiaoshan, W., Xiaopeng, L., and Zheng, H. (2010). Study of relationship between serum neuron-specific enolase and childhood absence epilepsy. Acta Universitatis Medicinalis Nanjing 30, 837–840.
Xu-lai, S., Hong-wen, H., and Guang-qian, L. (2004). Detection and significance of neuron-specific enolase, somatostatin and nitric oxide in children with epilepsy. J. Wenzhou Med. College 34, 352–354. doi: 10.13771/j.cnki.33-1386/r.2004.05.012
Yunhong, W., and Yinsheng, Y. (2013). The clinical study of neuron-specific enolase and interleukin-6 in children with intractable epilepsy. Chin. Remed. Clinic. 13, 501–502.
Keywords: epilepsy, CSF, serum, NSE, meta-analysis
Citation: Mu R-Z, Liu S, Liang K-G, Jiang D and Huang Y-J (2020) A Meta-Analysis of Neuron-Specific Enolase Levels in Cerebrospinal Fluid and Serum in Children With Epilepsy. Front. Mol. Neurosci. 13:24. doi: 10.3389/fnmol.2020.00024
Received: 13 November 2019; Accepted: 03 February 2020;
Published: 10 March 2020.
Edited by:
Fabrizio Michetti, Catholic University of the Sacred Heart, ItalyReviewed by:
Edward Haig Beamer, Royal College of Surgeons in Ireland, IrelandDongfeng Zhang, Qingdao University, China
Inga Zerr, Klinik für Neurologie, Universitätsmedizin Göttingen, Germany
Copyright © 2020 Mu, Liu, Liang, Jiang and Huang. This is an open-access article distributed under the terms of the Creative Commons Attribution License (CC BY). The use, distribution or reproduction in other forums is permitted, provided the original author(s) and the copyright owner(s) are credited and that the original publication in this journal is cited, in accordance with accepted academic practice. No use, distribution or reproduction is permitted which does not comply with these terms.
*Correspondence: Yao-Jiang Huang, eWFvamlhbmdAbXVjLmVkdS5jbg==; eWFvamlhbmdoQGhzcGguaGFydmFyZC5lZHU=
†These authors have contributed equally to this work