 Yeya Yu1,2†
 Xiaoyu Wei2,3†
 Qiuting Deng2,3†
 Qing Lan3Yiping Guo4Lei Han3Yue Yuan2,3Peng Fan5Peiying Wu3Shuncheng Shangguan6Yang Liu2,3Yiwei Lai7
 Giacomo Volpe7
 Miguel A. Esteban5,6,7,8
 Chuanyu Liu3,9
 Yong Hou3,10*
 Longqi Liu3,9*
- 1BGI College, Zhengzhou University, Zhengzhou, China
- 2BGI-Shenzhen, Shenzhen, China
- 3BGI Education Center, University of Chinese Academy of Sciences, Shenzhen, China
- 4CAS Key Laboratory of Regenerative Biology, Guangzhou Institutes of Biomedicine and Health, Chinese Academy of Sciences, Guangzhou, China
- 5College of Veterinary Medicine, Jilin University, Changchun, China
- 6Joint School of Life Sciences, Guangzhou Medical University and Guangzhou Institutes of Biomedicine and Health, Chinese Academy of Sciences, Guangzhou, China
- 7Laboratory of Integrative Biology, Guangzhou Institutes of Biomedicine and Health, Chinese Academy of Sciences, Guangzhou, China
- 8Bioland Laboratory, Guangzhou Regenerative Medicine and Health Guangdong 16 Laboratory, Guangzhou, China
- 9Shenzhen Bay Laboratory, Shenzhen, China
- 10Shenzhen Key Laboratory of Single-Cell Omics, BGI-Shenzhen, Shenzhen, China
Rats have been widely used as an experimental organism in psychological, pharmacological, and behavioral studies by modeling human diseases such as neurological disorders. It is critical to identify and characterize cell fate determinants and their regulatory mechanisms in single-cell resolutions across rat brain regions. Here, we applied droplet-based single-nucleus assay for transposase-accessible chromatin using sequencing (snATAC-seq) to systematically profile the single-cell chromatin accessibility across four dissected brain areas in adult Sprague–Dawley (SD) rats with a total of 59,023 single nuclei and identified 16 distinct cell types. Interestingly, we found that different cortex regions exhibit diversity in both cellular compositions and gene regulatory regions. Several cell-type-specific transcription factors (TFs), including SPI1, KLF4, KLF6, and NEUROD2, have been shown to play important roles during the pathogenesis of various neurological diseases, such as Alzheimer’s disease (AD), astrocytic gliomas, autism spectrum disorder (ASD), and intellectual disabilities. Therefore, our single-nucleus atlas of rat cortex could serve as an invaluable resource for dissecting the regulatory mechanisms underlying diverse cortex cell fates and further revealing the regulatory networks of neuropathogenesis.
Introduction
The rat, one of the most widely used model organisms, is invaluable for biomedical research by modeling human physiology and diseases (Grigoruţă et al., 2020; Ma et al., 2020). Compared to laboratory mice, rats have a larger body and organ size as, on average, adult rats weigh eight to ten times more than adult mice, making them more suitable for experimental surgeries (Nesbitt, 1974; Atchley et al., 1992; Pehrson et al., 2013; Ellenbroek and Youn, 2016). For example, the larger brain size of rats greatly facilitates sophisticated procedures such as in vivo electrophysiology, neurosurgery, and neuroimaging.
Besides the morphological differences, major functional differences are also identified and characterized between rat and mouse brains. For example, there is increasing evidence supporting a critical role of 5-hydroxytrypta-mine-6 (5-HT6) receptors in memory formation and cognitive functions during learning (Lindner et al., 2003). The 5-HT6 receptors are widely expressed in human and rat brains but are not detected in mouse brains (Meneses, 2001; Ohno et al., 2011). Moreover, the hippocampus neurogenesis (the process through which stem cells self-renew and generate new mature neurons) also exhibits a difference between mice and rats. Neural stem cells in the hippocampus are able to proliferate and differentiate into neurons even in adulthood, and this process is thought to be related to learning and memory (Lazarov and Hollands, 2016). Recent studies have shown that the neurogenesis rate in the hippocampus of adult rats is much greater than that of adult mice, revealing differences in the plasticity of neural cells between rats and mice (Snyder et al., 2009).
The rat has become a powerful model organism for studying neurological diseases like Parkinson’s disease (PD; Tiklova et al., 2020), Alzheimer’s disease (AD), astrocytic gliomas, and intellectual disability. The rat’s genomic and transcriptomic information have recently been made available to the community, including genome annotation from the Rat Genome Sequencing Project Consortium (Gibbs et al., 2004) and rat RNA-Seq transcriptomic BodyMap information (Yu et al., 2014). Furthermore, gene-editing technologies, including TALENs, ZFNs, and the CRISPR/Cas system, have been successfully applied to rats (Geurts et al., 2010; Tesson et al., 2011; Shao et al., 2014). With the advancement of genetics and genomics technologies, using a rat as an experimental model, several factors have been identified that play critical roles in both brain physiology and disease (Xu et al., 2019; Berg et al., 2020). To further characterize relationships among these key factors in neurological diseases and identify novel factors, a comprehensive regulatory network of rat brain tissue is of primary importance. An integrative analysis of expression and epigenetic datasets in disease-relevant cell types would be of great potential in dissecting disease pathways and mechanisms.
The cerebral cortex, the brain’s outer layer, is composed of many different regions. These regions are involved in complex brain functions that are not only related to various sensations and movements of the body but also to various cognitive abilities such as language and thinking. Here, we employed the droplet-based high-throughput snATAC-seq to comprehensively profiled the chromatin accessibility status on the rat auditory cortex (AC), primary visual cortex (V1), somatosensory cortex (SC), and motor cortex (MC). We obtained a total of 59,023 cells that passed the quality control (QC) from the rat cortex, creating a new single nucleus database that would serve as a helpful resource for future studies in neurological diseases.
Materials and Methods
Tissue Dissection and Preservation
The use of rats in relevant experimental studies was approved by the Institutional Review Board on the Ethics Committee of BGI (Permit No. BGI-IRB A20020). One 7–8-month-old healthy adult female Sprague–Dawley (SD) rat was used in this study and was purchased from Jiangsu Ailingfei Biotechnology Company Limited. The rat was transported by air to the Guangzhou Institute of Biomedicine and Health (GIBH) of the Chinese Academy of Sciences, where GIBH colleagues helped with tissue dissection. Upon arrival at GIBH, the rat was sacrificed by carbon dioxide asphyxiation and proceeded to dissection according to standard protocol (Paxinos and Watson, 2007; Yang et al., 2018). Each tissue type was stored in a cryopreservation tube. After being snap-frozen in liquid nitrogen, the dissected tissue was transported on dry ice to BGI-Shenzhen and was immediately stored in a liquid nitrogen tank upon arrival.
Nuclei Isolation From Dissected Tissue
In this study, we specifically focused on the dissected AC, V1, SC, and MC from rats, as shown in Figure 1A. Nuclei were isolated from the frozen cortex according to an established protocol with minor modifications (Bakken et al., 2018; Thrupp et al., 2020). The whole operation was carried out on ice. Briefly, frozen tissue was cut into pieces and transferred to a 2 mL KIMBLE Dounce tissue grinder (Sigma #D8938-1SET) with 2 mL of ice-cold homogenization buffer [20 mM Tris pH 8.0 (Thermo Fisher Scientific)], 500 mM sucrose (Sigma), 50 mM KCl (Thermo Fisher Scientific), 10 mM MgCl2 (Thermo Fisher Scientific), 0.1% NP-40 (Roche), 1× protease inhibitor cocktail (Roche), and 1% nuclease-free BSA, and 0.1 mM DTT). Tissues were homogenized by 15 strokes of the loose dounce pestle, and the homogenate was filtered through a 70 μM cell strainer (Falcon). Next, the filtered homogenate was homogenized by five strokes of the tight pestle to release nuclei, and it was again filtered through a 30 μM cell strainer (Sysmex) into a 15 mL centrifuge tube. Nuclei pellets were then obtained by centrifuging at 500 g for 5 min at 4°C. Nuclei were then washed twice with 1 ml of ice-cold blocking buffer (1× PBS supplemented with 1% BSA) followed by another step of centrifugation at 500 g for 5 min at 4°C. Finally, we resuspended the nuclei in 50 μL of 1× PBS containing 1% BSA and counted them with DAPI.

Figure 1. Schematic diagram for experimental and data analysis. (A) A total of four different cortex regions from adult rat brains were collected for single-nucleus assay for transposase-accessible chromatin using sequencing (snATAC-seq) profiling. (B) The analysis workflow for snATAC-seq profiles.
snATAC-Seq Library Preparation and Sequencing
To prepare single-nucleus ATAC-seq libraries, we used DNBelab C Series Single-Cell ATAC Library Prep Set (MGI, #1000021878; Han et al., 2020). In total, we generated 11 libraries, including two libraries from AC and three libraries each from the other types of cortices. Briefly, transposed single-nucleus suspensions were converted to barcoded snATAC-seq libraries, through procedures including droplet encapsulation, pre-amplification, emulsion breakage, capture beads collection, DNA amplification, and purification. Indexed sequencing libraries were prepared according to the user guide. Concentrations of sequencing libraries were measured with Qubit ssDNA Assay Kit (Thermo Fisher Scientific). All libraries were sequenced using a paired-end 50 sequencing scheme by the BGISEQ-500 platform at China National GeneBank (CNGB; Huang et al., 2017).
Preprocessing and QC of the snATAC-seq Datasets
Raw sequencing reads from BGISEQ-500 sequencer were filtered and demultiplexed using PISA and aligned to the rat genome (Rnor_6.01). The fragment file of each snATAC-seq library was used for downstream analysis (Figure 1B). The transcription start site (TSS) enrichment score and fragment number of each nucleus were calculated by using ArchR software (Granja et al., 2021). Nuclei with TSS enrichment score less than five and fragment number less than 1,000 were removed. We created an Arrow file to record all relevant information of each sample library such as metadata, and data matrices). Then we calculated the doublet score with addDoubletScores function in ArchR package and filtered doublets by filterDoublets function with parameter filterRatio = 2.
snATAC-Seq Latent Semantic Indexing (LSI) Clustering
An snATAC-seq clustering analysis was performed using ArchR software. To cluster our snATAC-seq data, we first identified a robust set of bins followed by iterative LSI method clustering (Granja et al., 2019; Satpathy et al., 2019). Briefly, we created 500 bp windows tiled across the genome and determined whether each cell was accessible within each window. Next, we performed an LSI dimensionality reduction on these windows with addIterativeLSI function in ArchR packages followed by Harmony batch correction (Korsunsky et al., 2019). We performed clustering by Seurat’s FindClusters function with parameters “reducedDims = ‘IterativeLSI’, method = ‘Seurat’, resolution = 0.8)”
snATAC-Seq Gene Activity Scores
Gene scores were calculated using ArchR with default parameters (Pliner et al., 2018; Lareau et al., 2019). Briefly, ArchR uses a distance-weighted accessibility model to infer gene activity scores, which can aggregate accessibility signals in genes and local genomic regions. We calculated the gene activity scores by addGeneScoreMatrix function of ArchR package with options addGeneScoreMatrix (geneModel = “exp(−abs(x)/5,000) + exp(−1)”, extendUpstream = c(1,000, 1e+05), extendDownstream = c(1,000, 1e+05), geneUpstream = 5,000, and geneDownstream = 0, tileSize = 500). The gene activity scores are based on the following observations. The accessibility of the entire gene body contributed to the gene scores. For putative distal regulatory elements, we used an exponential weighting function to calculate the score. We added gene boundaries to reduce the contribution of irrelevant regulatory elements to gene scores. The resulting gene activity scores were additionally imputed using MAGIC to reduce noise due to snATAC-seq data sparsity. The different gene scores between each cortex of each cell type were calculated by getMarkerFeatures function in ArchR software.
Identification of Cell Types From snATAC-Seq Data
We used gene activity scores to identified different cell types for various marker genes. Astrocytes (cluster 1) were annotated by accessibility near the Gfap, Slc1a2, and Aqp4 genes. Endothelial cells (cluster 2) were annotated by accessibility near the Cldn5 and Flt1 genes. Excitatory neurons (clusters 3, 4, 5, 6, and 7) were annotated by accessibility near the Slc17a7 genes. Inhibitory neurons (cluster 8) were annotated by accessibility near the Gad1 and Gad2 genes. PVALB neurons (cluster 14) were annotated by accessibility near the Pvalb gene. SST neurons (cluster 15) were annotated by accessibility near the Sst gene. VIP neurons (cluster 16) were identified based on accessibility near the Vip gene. Meningeal cells (cluster 9) were identified based on accessibility near the Six1 gene. Microglia (cluster 10) was annotated by accessibility near the Itgam, Adgre1, P2ry12, Tmem119, Tgfb1, and Apbb1ip genes. Oligodendrocyte precursor cells (OPC) (cluster 11) were annotated by accessibility near the Cspg4 and Pdgfra gene. Oligodendrocytes (cluster 12) were annotated by accessibility near the Opalin, Mog, Mobp, Mbp, and Cldn11 genes. Pericytes (cluster 13) were annotated by accessibility near the Pdgfrb genes. All neuron subsets were mainly determined primarily as neurons, according to the accessibility near the Nefh, Syt1, and Rbfox3 genes, and then subdivided according to the origin and accessibility near the other genes mentioned above.
snATAC-Seq Peak Calling
For each cell type, peak calling on the Tn5-corrected insertions (each end of the Tn5-corrected fragments) using the MACS2 callpeak command with the parameters (shift = −75, extsize = 150, cutoff = 0.1, additionalParams = “—nomodel —nolambda”). The peak summits were then extended by 250 bp on either side to a final width of 500 bp. Then the marker peaks of each cell type were defined by getMarkerFeatures function and the peak AnnoEnrichment function was used to enrich the motifs in the significant marker peaks (FDR <= 0.01, Log2FC >= 1). The scripts used for analysis are in the supplementary material (Supplementary Files 1–5).
Result and Discussion
snATAC-Seq Metrics for Quality Control of Individual Cells
In this study, we successfully prepared and sequenced 11 snATAC-seq libraries from four distinct rat AC, MC, V1, and SC samples. A total of 6,032 million raw reads were generated, and 59,023 cells were obtained after quality filtering (Supplementary Table 1). Nuclei with fragment numbers less than 1,000 were filtered out, and the median fragments per nucleus was 9,243 (Supplementary Table 1, Figure 2A). First, we evaluated the sequencing data quality for each library through several parameters, including the number of total reads, fraction of read pairs with a valid barcode, Q30 bases in reads, and Q30 bases in barcodes. Around 82.20% of the raw reads were filtered into a total of 4,960 million clean reads. The average of Q30 bases in reads and barcodes is 93.99% and 93.65%, respectively. Next, following data pre-processing via alignment, SAM to BAM conversion, and sorting, deconvolution was applied to generate fragment files.
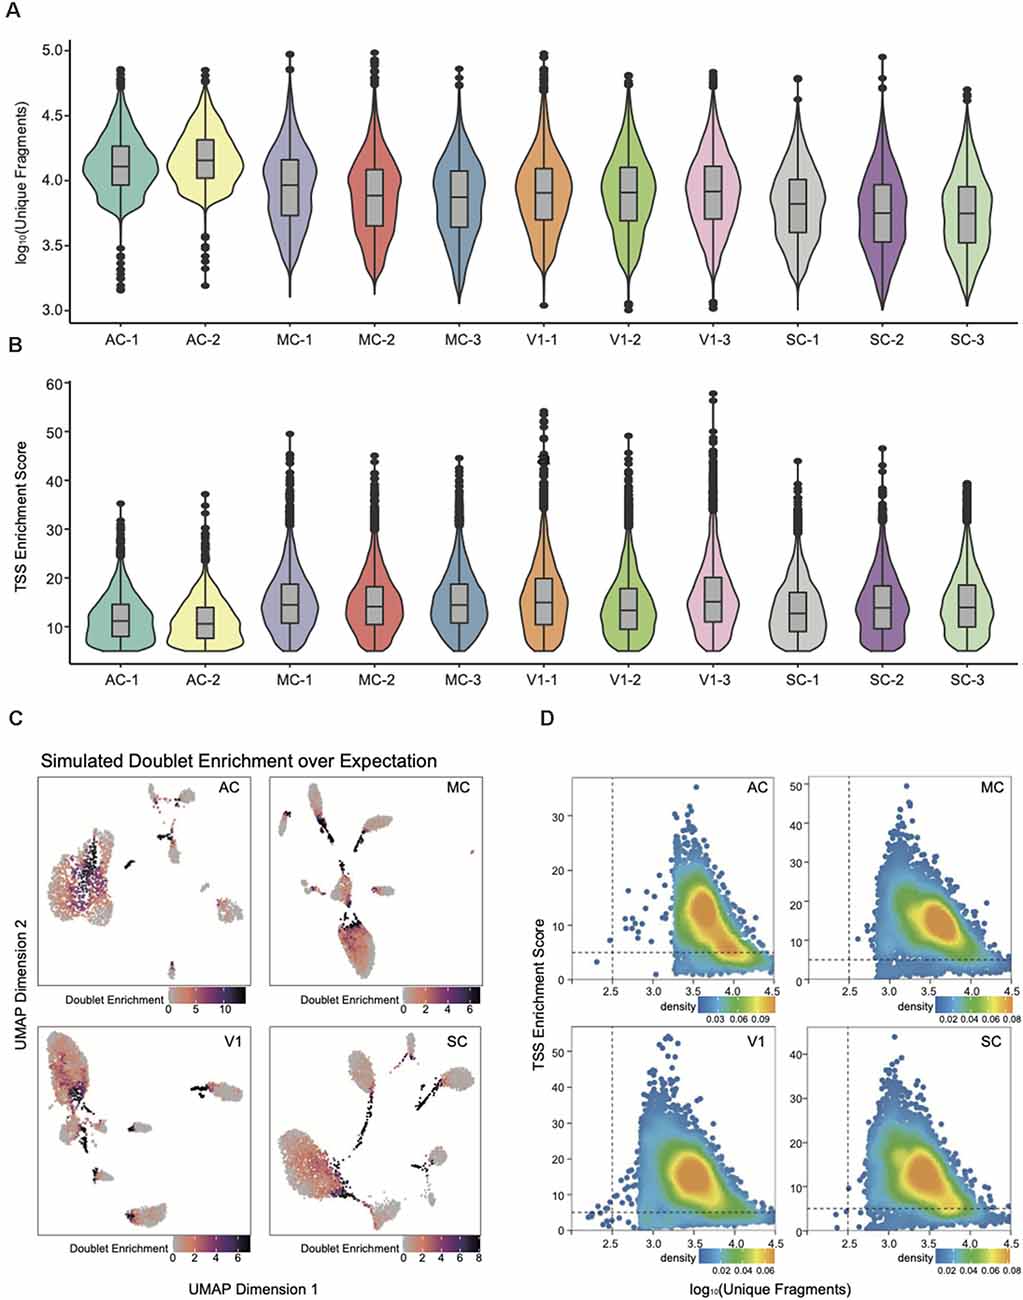
Figure 2. snATAC-seq data quality metrics. (A) Violin plot for the number of unique nuclear fragments per library. (B) Violin plot for the distribution of transcription start site (TSS) enrichment score per library. (C) UMAP of snATAC-seq data showing the simulated doublet enrichment over expectation based on genotyping information. (D) Quality control (QC) filtering plots for the auditory cortex (AC), motor cortex (MC), primary visual cortex (V1), and somatosensory cortex (SC) dataset showing the TSS enrichment score vs. unique nuclear fragments of each nucleus.
All subsequent QC and downstream analyses were performed with ArchR (Granja et al., 2020). The number of unique fragments and the TSS enrichment score were the most robust metrics for quality control (Fang et al., 2019). The paucity of unique fragments predicts less reliable analysis; the lower TSS enrichment score reflects a lower signal-to-background ratio. The violin plots in Figures 2A,B have demonstrated that each snATAC library is of high data quality by assessing parameters of unique fragment and TSS enrichment. We then integrated the data into four cortex categories, and removed poor quality nuclei with TSS enrichment score less than five and fragment number less than 1,000 for downstream analysis (Supplementary Table 1, Figure 2D).
To further improve the fidelity of downstream data analysis, we performed doublet detection to eliminate the false positives within cell clusters and interconnections among them (Figure 2C). The doublets generation occurred during droplet encapsulation, where more than one cell was captured within a droplet and thus labeled with the same cell barcode. After filtering out doublets with parameter filterRatio = 2, we then could reliably construct the single-nucleus chromatin landscapes of 59,023 for exploration of tissue-specific regulatory elements.
Cluster Identification and Comparative Analysis Between Regions
We grouped nuclei into 16 distinct clusters by an optimized iterative LSI method (Granja et al., 2019; Satpathy et al., 2019; Figure 3A). Then we annotated each cell cluster by key marker genes that were identified with gene scores (Cusanovich et al., 2018; Pliner et al., 2018; Lareau et al., 2019). The annotated nuclei types were mostly consistent with a previous study focusing on the cerebral cortex, and the number of neuronal nuclei was greater than non-neuronal nuclei (Zhang et al., 2014; Del-Aguila et al., 2019). These 16 cell clusters include nine types of neurons and seven types of non-neurons. These nine types of neurons include five types of excitatory neurons and four types of inhibitory neurons such as PVALB, SST, and VIP. These six types of non-neurons were the astrocytes, endothelial cells, microglia, OPC, oligodendrocytes, pericytes. Detailed information on cell type marker genes was available in Supplementary Figure 1, Supplementary Table 2. We have identified an additional cluster of meningeal cells, which is possibly due to minor sample contamination during tissue dissection.
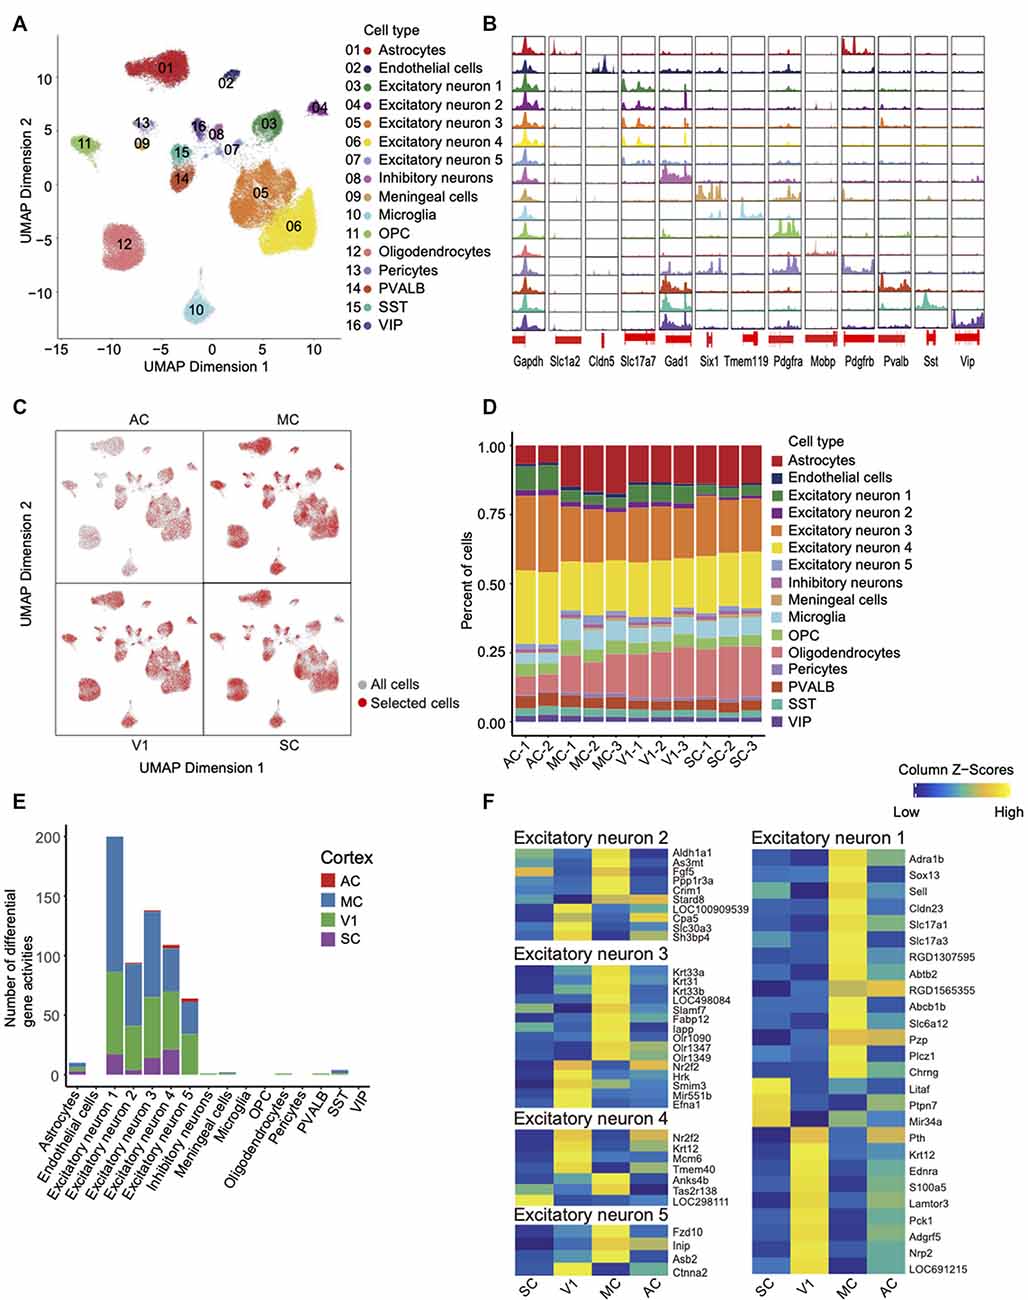
Figure 3. Single-cell chromatin accessibility of rat cortex and inter-regional diversity of excitatory neurons. (A) UMAP of snATAC-seq data showing 16 clusters. A total of 59,023 nuclei passed QC and were used for clustering rat cortices into neuronal and non-neuronal cell types. Each cluster is color-coded to distinguish specific cell types. (B) Genome browser views of snATAC-seq signal for the indicated housekeeping gene (Gapdh) and cell-type-specific genes. (C) UMAP expresses differences in cellular distribution across the four cortex regions, the red dots represent a specific region. (D) Histogram shows the number of cell types between each library in different cortices. (E) Histogram of the number of different genes between cortical regions within the same cell type. (F) Heatmap of gene activity scores for all genes in the four cortices of each excitatory neuron.
First, open chromatin peaks were called for each cell-type cluster. We have detected the open chromatin regions around TSSs of key marker genes for each cell type; these findings further validate the quality of our datasets (Figure 3B). For example, peaks were specifically called around the TSSs region of marker gene Tmem119 in microglia cells but not other cell types. After identifying the cell types, we explored the differences between the four cortex regions. UMAP initially showed that the four cortices share the same cell types but the number of them is different (Figure 3C, Supplementary Figure 2). Second, by comparison of cellular compositions across the four cortex regions, the red dots representing selected cells of each region (Figure 3C). The diversity of cellular compositions across cortex regions was summarized as shown in Figure 3D. We found that excitatory neurons accounted for the largest proportion. The overall proportion is consistent with the proportion of cell types found in the mouse and human brain (Supplementary Figure 3; Cusanovich et al., 2018; Del-Aguila et al., 2019). Third, the gene activity scores were calculated across four cortex regions in each cluster. We identified the differential gene activity with parameters (Log2FC > 0.5 and FDR < 0.05), and the results showed that the excitatory neurons owned most of the differential gene activities (Figure 3E, Supplementary Table 3). In Figure 3F, a heat map has illustrated the distinct differential gene activity specifically in each type of excitatory neurons with more stringent parameters (FDR <= 0.01 and Log2FC >= 1).
Inferring Cell Type-Specific TFs
In order to further characterize regulatory mechanisms underlying chromatin landscapes, we used ArchR to identify TFs that are highly correlated with cell type-specific open chromatin regions via unbiased motif finding (Figure 4, Supplementary Table 4). Interestingly, we have identified a group of TFs, which have been shown to be closely related to the pathogenesis and treatment of neurological diseases. The TF PU.1 was a protein encoded by the Spi1 gene in humans (Ray et al., 1990). PU.1 was highly expressed in the microglia of the brain. Recent evidence from genome-wide association studies suggests that the decrease of PU.1 may limit the neuro-inflammatory response, leading to the delayed onset of AD (Rustenhoven et al., 2018). KLF4, a member of the zinc finger TF family has a great effect on inflammation by mediating endothelial cells. New evidence shows that KLF4 has an important regulatory effect on the neurophysiological and neuropathological processes of AD, suggesting that KLF4 may be a potential therapeutic target for neurodegenerative diseases (Cheng et al., 2018). Glioma is the most common tumor of the central nervous system with an inferior prognosis, and mutations in the Klf6 gene have been shown to play a role in the pathogenesis of astroglioma (Jeng and Hsu, 2003). It was found that excitatory neuron-specific neurod2 deletion generalizes cellular and behavioral autism spectrum disorder (ASD) phenotypes in full KO mice (Runge et al., 2020). Neurod2 pathogenic mutations cause ASD and intellectual disability.
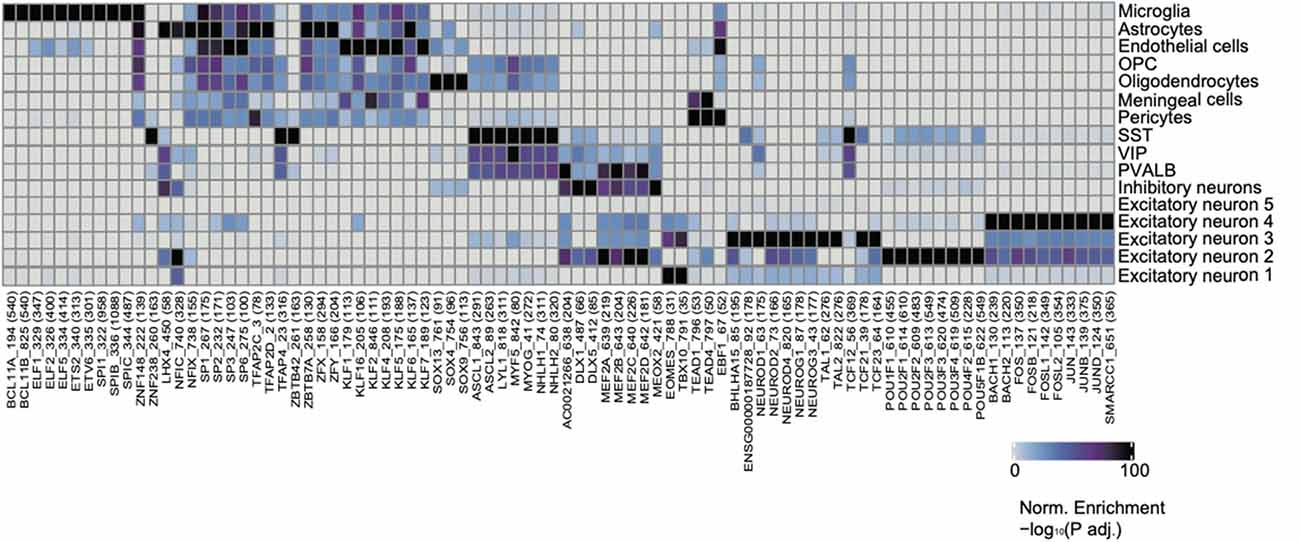
Figure 4. Identification of cell-type-specific chromatin transcription factors (TFs). Heatmap clustering showing the cell-type-specific TFs.
Conclusion
Together, in this study, the list of TF candidates identified from cell-type-specific chromatin landscapes would serve as a valuable resource for identifying novel players across distinct cortex regions, and this may further lay the foundation for characterizing the regulatory networks and dissecting mechanisms underlying neurological diseases.
Data Availability Statement
All raw data have been submitted to the CNGB [Nucleotide Sequence Archive] [https://db.cngb.org/search/project/CNP0001471/] and also the NCBI [SRA] [https://www.ncbi.nlm.nih.gov/search/all/?term=PRJNA684680].
Ethics Statement
The animal study was reviewed and approved by the Institutional Review Board on Ethics Committee of BGI.
Author Contributions
YYu, LL, XW and QD conceived the idea. PF and SS collected the samples. YYu and QD generated the data. YYuan and PW assisted with the experiments. XW analyzed the data with the assistance of YYu, YLiu. YYu wrote the manuscript with the input of XW and QL. CL and LL supervised the study and revised the manuscript. LH, YLai and GV provided helpful comments on this study. All authors contributed to the article and approved the submitted version.
Funding
ME was supported by the Strategic Priority Research Program of the Chinese Academy of Sciences (XDA16030502) and the Innovative Team Program of Guangzhou Regenerative Medicine and Health Guangdong Laboratory (2018GZR110103001). We thank Shenzhen Key Laboratory of Single-Cell Omics (ZDSYS20190902093613831).
Conflict of Interest
The authors declare that the research was conducted in the absence of any commercial or financial relationships that could be construed as a potential conflict of interest.
Acknowledgments
We thank all members of the Center for Digitizing Cells from the Institute of SuperCells (BGI) for helpful comments and Yu Jiang from Guangzhou Institutes of Biomedicine and Health, Chinese Academy of Sciences for assistance with sample collection.
Footnotes
Supplementary Material
The Supplementary Material for this article can be found online at: https://www.frontiersin.org/articles/10.3389/fnmol.2021.651355/full#supplementary-material.
SUPPLEMENTARY FIGURE 1 | Cell-type-specific marker genes visualized by UMAP.
SUPPLEMENTARY FIGURE 2 | Cluster UMAP of 11 libraries, each color represents a library in four cortical areas.
SUPPLEMENTARY FIGURE 3 | Pie chart comparing the proportions of cell types. Refer to the single-cell nuclear transcriptome data of the human cerebral cortex published by Del-Aguila et al. (2019).
SUPPLEMENTARY TABLE 1 | snATAC-seq metadata and mapping statistics. *Reads Pass QC: total number of reads minus number of unaligned reads.
SUPPLEMENTARY TABLE 2 | Cell type-specific marker genes list. All marker genes used for cell annotation in Figure 3A.
SUPPLEMENTARY TABLE 3 | Differential gene activity scores in each cell type.
SUPPLEMENTARY TABLE 4 | TF motif enrichment in each cell type.
References
Atchley, W. R., Cowley, D. E., Vogl, C., and Mclellan, T. (1992). Evolutionary divergence, shape change and genetic correlation structure in the rodent mandible. Sys. Biol. 41, 196–221. doi: 10.1093/sysbio/41.2.196
Bakken, T. E., Hodge, R. D., Miller, J. A., Yao, Z., Nguyen, T. N., Aevermann, B., et al. (2018). Single-nucleus and single-cell transcriptomes compared in matched cortical cell types. PLoS One 13:e0209648. doi: 10.1371/journal.pone.0209648
Berg, E., Pride, M., Petkova, S., Lee, R., Copping, N., Shen, Y., et al. (2020). Translational outcomes in a full gene deletion of ubiquitin protein ligase E3A rat model of angelman syndrome. Transl. Psychiatry 10:39. doi: 10.1038/s41398-020-0720-2
Cheng, Z., Zou, X., Jin, Y., Gao, S., Lv, J., Li, B., et al. (2018). The role of KLF(4) in Alzheimer’s disease. Front. Cell Neurosci. 12:325. doi: 10.3389/fncel.2018.00325
Cusanovich, D. A., Hill, A. J., Aghamirzaie, D., Daza, R. M., Pliner, H. A., Berletch, J. B., et al. (2018). A single-cell atlas of in vivo mammalian chromatin accessibility. Cell 174, e18.1309–e18.1324. doi: 10.1016/j.cell.2018.06.052
Del-Aguila, J. L., Li, Z., Dube, U., Mihindukulasuriya, K. A., Budde, J. P., Fernandez, M. V., et al. (2019). A single-nuclei RNA sequencing study of mendelian and sporadic AD in the human brain. Alzheimer’s Res. Ther. 11:71. doi: 10.1186/s13195-019-0524-x
Ellenbroek, B., and Youn, J. (2016). Rodent models in neuroscience research: is it a rat race. Dis. Model. Mech. 9, 1079–1087. doi: 10.1242/dmm.026120
Fang, R., Preissl, S., Hou, X., Lucero, J., Wang, X., Motamedi, A., et al. (2019). Fast and accurate clustering of single cell epigenomes reveals cis-regulatory elements in rare cell types. bioRxiv [Preprint]. doi: 10.1101/615179
Geurts, A. M., Cost, G. J., Remy, S., Cui, X., Tesson, L., Usal, C., et al. (2010). Generation of gene-specific mutated rats using zinc-finger nucleases. Methods Mol. Biol. 597, 211–225. doi: 10.1007/978-1-60327-389-3_15
Gibbs, R. A., Weinstock, G. M., Metzker, M. L., Muzny, D. M., Sodergren, E. J., Scherer, S., et al. (2004). Genome sequence of the Brown Norway rat yields insights into mammalian evolution. Nature 428, 493–521. doi: 10.1038/nature02426
Granja, J. M., Corces, M. R., Pierce, S. E., Bagdatli, S. T., Choudhry, H., Chang, H., et al. (2020). ArchR: an integrative and scalable software package for single-cell chromatin accessibility analysis. bioRxiv [Preprint]. doi: 10.1101/2020.04.28.066498
Granja, J. M., Corces, M. R., Pierce, S. E., Bagdatli, S. T., Choudhry, H., Chang, H. Y., et al. (2021). ArchR is a scalable software package for integrative single-cell chromatin accessibility analysis. Nat. Genet. 53, 403–411. doi: 10.1038/s41588-021-00790-6
Granja, J. M., Klemm, S., Mcginnis, L. M., Kathiria, A. S., Mezger, A., Corces, M. R., et al. (2019). Single-cell multiomic analysis identifies regulatory programs in mixed-phenotype acute leukemia. Nat. Biotechnol. 37, 1458–1465. doi: 10.1038/s41587-019-0332-7
Grigoruţă, M., Martínez-Martínez, A., Dagda, R. Y., and Dagda, R. K. (2020). Psychological stress phenocopies brain mitochondrial dysfunction and motor deficits as observed in a Parkinsonian rat model. Mol. Neurobiol. 57, 1781–1798. doi: 10.1007/s12035-019-01838-9
Han, L., Wei, X., Liu, C., Volpe, G., Wang, Z., Pan, T., et al. (2020). Single-cell atlas of a non-human primate reveals new pathogenic mechanisms of COVID-19. bioRxiv [Preprint]. doi: 10.1101/2020.04.10.022103
Huang, J., Liang, X., Xuan, Y., Geng, C., Li, Y., Lu, H., et al. (2017). A reference human genome dataset of the BGISEQ-500 sequencer. Gigascience 6, 1781–1798. doi: 10.1093/gigascience/gix024
Jeng, Y. M., and Hsu, H. C. (2003). KLF6, a putative tumor suppressor gene, is mutated in astrocytic gliomas. Int. J. Cancer 105, 625–629. doi: 10.1002/ijc.11123
Korsunsky, I., Millard, N., Fan, J., Slowikowski, K., Zhang, F., Wei, K., et al. (2019). Fast, sensitive and accurate integration of single-cell data with harmony. Nat. Methods 16, 1289–1296. doi: 10.1038/s41592-019-0619-0
Lareau, C. A., Duarte, F. M., Chew, J. G., Kartha, V. K., Burkett, Z. D., Kohlway, A. S., et al. (2019). Droplet-based combinatorial indexing for massive-scale single-cell chromatin accessibility. Nat. Biotechnol. 37, 916–924. doi: 10.1038/s41587-019-0147-6
Lazarov, O., and Hollands, C. (2016). Hippocampal neurogenesis: learning to remember. Prog. Neurobiol. 138, 1–18. doi: 10.1016/j.pneurobio.2015.12.006
Lindner, M. D., Hodges, D. B., Jr., Hogan, J. B., Orie, A. F., Corsa, J. A., Barten, D. M., et al. (2003). An assessment of the effects of serotonin 6 (5-HT6) receptor antagonists in rodent models of learning. J. Pharmacol. Exp. Ther. 307, 682–691. doi: 10.1124/jpet.103.056002
Ma, S., Sun, S., Geng, L., Song, M., Wang, W., Ye, Y., et al. (2020). Caloric restriction reprograms the single-cell transcriptional landscape of rattus norvegicus aging. Cell 180, e22.984–e22.1001. doi: 10.1016/j.cell.2020.02.008
Meneses, A. (2001). Role of 5-HT6 receptors in memory formation. Drug News Perspect. 14, 396–400. doi: 10.1358/dnp.2001.14.7.660941
Nesbitt, M. N. (1974). Evolutionary relationships between rat and mouse chromosomes. Chromosoma 46, 217–224. doi: 10.1007/BF00332519
Ohno, Y., Imaki, J., Mae, Y., Takahashi, T., and Tatara, A. (2011). Serotonergic modulation of extrapyramidal motor disorders in mice and rats: role of striatal 5-HT3 and 5-HT6 receptors. Neuropharmacology 60, 201–208. doi: 10.1016/j.neuropharm.2010.08.019
Paxinos, G., and Watson, C. (2007). The Rat Brain in Stereotaxic Coordinates. Amsterdam, Boston: Academic Press/Elsevier.
Pehrson, A. L., Cremers, T., Bétry, C., Van Der Hart, M. G. C., Jørgensen, L., Madsen, M., et al. (2013). Lu AA21004, a novel multimodal antidepressant, produces regionally selective increases of multiple neurotransmitters—A rat microdialysis and electrophysiology study. Eur. Neuropsychopharmacology 23, 133–145. doi: 10.1016/j.euroneuro.2012.04.006
Pliner, H. A., Packer, J. S., Mcfaline-Figueroa, J. L., Cusanovich, D. A., Daza, R. M., Aghamirzaie, D., et al. (2018). Cicero predicts cis-regulatory DNA interactions from single-cell chromatin accessibility data. Mol. Cell 71, e8.858–e8.871. doi: 10.1016/j.molcel.2018.06.044
Ray, D., Culine, S., Tavitain, A., and Moreau-Gachelin, F. (1990). The human homologue of the putative proto-oncogene Spi-1: characterization and expression in tumors. Oncogene 5, 663–668.
Runge, K., Mathieu, R., Bugeon, S., Lafi, S., Beurrier, C., Sahu, S., et al. (2020). Disruption of the transcription factor NEUROD2 causes an autism syndrome via cell-autonomous defects in cortical projection neurons. bioRxiv [Preprint]. doi: 10.1101/296889
Rustenhoven, J., Smith, A. M., Smyth, L. C., Jansson, D., Scotter, E. L., Swanson, M. E. V., et al. (2018). PU.1 regulates Alzheimer’s disease-associated genes in primary human microglia. Mol. Neurodegener. 13:44. doi: 10.1186/s13024-018-0277-1
Satpathy, A. T., Granja, J. M., Yost, K. E., Qi, Y., Meschi, F., Mcdermott, G. P., et al. (2019). Massively parallel single-cell chromatin landscapes of human immune cell development and intratumoral T cell exhaustion. Nat. Biotechnol. 37, 925–936. doi: 10.1038/s41587-019-0206-z
Shao, Y., Guan, Y., Wang, L., Qiu, Z., Liu, M., Chen, Y., et al. (2014). CRISPR/Cas-mediated genome editing in the rat via direct injection of one-cell embryos. Nat. Protoc. 9, 2493–2512. doi: 10.1038/nprot.2014.171
Snyder, J. S., Choe, J. S., Clifford, M. A., Jeurling, S. I., Hurley, P., Brown, A., et al. (2009). Adult-born hippocampal neurons are more numerous, faster maturing and more involved in behavior in rats than in mice. J. Neurosci. 29, 14484–14495. doi: 10.1523/JNEUROSCI.1768-09.2009
Tesson, L., Usal, C., Menoret, S., Leung, E., Niles, B. J., Remy, S., et al. (2011). Knockout rats generated by embryo microinjection of TALENs. Nat. Biotechnol. 29, 695–696. doi: 10.1038/nbt.1940
Thrupp, N., Sala Frigerio, C., Wolfs, L., Skene, N. G., Fattorelli, N., Poovathingal, S., et al. (2020). Single-Nucleus RNA-Seq is not suitable for detection of microglial activation genes in humans. Cell Rep. 32:108189. doi: 10.1016/j.celrep.2020.108189
Tiklova, K., Nolbrant, S., Fiorenzano, A., Bjorklund, A. K., Sharma, Y., Heuer, A., et al. (2020). Single cell transcriptomics identifies stem cell-derived graft composition in a model of Parkinson’s disease. Nat. Commun. 11:2434. doi: 10.1038/s41467-020-16225-5.
Xu, Y., Wu, Z., Liu, L., Liu, J., and Wang, Y. (2019). Rat model of cockayne syndrome neurological disease. Cell Rep. 29, e5.800–e5.809.
Yang, P., Wang, Z., Zhang, Z., Liu, D., Manolios, E. N., Chen, C., et al. (2018). The extended application of the rat brain in stereotaxic coordinates in rats of various body weight. J. Neurosci. Methods 307, 60–69. doi: 10.1016/j.jneumeth.2018.06.026
Yu, Y., Fuscoe, J. C., Zhao, C., Guo, C., Jia, M., Qing, T., et al. (2014). A rat RNA-Seq transcriptomic BodyMap across 11 organs and 4 developmental stages. Nat. Commun. 5:3230. doi: 10.1038/ncomms4230
Keywords: rat cerebral cortex, chromatin accessibility, snATAC-seq, regulatory element, transcription factor
Citation: Yu Y, Wei X, Deng Q, Lan Q, Guo Y, Han L, Yuan Y, Fan P, Wu P, Shangguan S, Liu Y, Lai Y, Volpe G, Esteban MA, Liu C, Hou Y and Liu L (2021) Single-Nucleus Chromatin Accessibility Landscape Reveals Diversity in Regulatory Regions Across Distinct Adult Rat Cortex. Front. Mol. Neurosci. 14:651355. doi: 10.3389/fnmol.2021.651355
Received: 09 January 2021; Accepted: 29 March 2021;
Published: 17 May 2021.
Edited by:
Lan Ma, Fudan University, ChinaCopyright © 2021 Yu, Wei, Deng, Lan, Guo, Han, Yuan, Fan, Wu, Shangguan, Liu, Lai, Volpe, Esteban, Liu, Hou and Liu. This is an open-access article distributed under the terms of the Creative Commons Attribution License (CC BY). The use, distribution or reproduction in other forums is permitted, provided the original author(s) and the copyright owner(s) are credited and that the original publication in this journal is cited, in accordance with accepted academic practice. No use, distribution or reproduction is permitted which does not comply with these terms.
*Correspondence: Yong Hou, aG91eW9uZ0BnZW5vbWljcy5jbg==; Longqi Liu, bGl1bG9uZ3FpQGdlbm9taWNzLmNu
† These authors have contributed equally to this work