 Birui Tian1†
 Meifeng Chen
- 1Key Laboratory of Information and Computing Science Guizhou Province, Guizhou Normal University, Guiyang, China
- 2Key Laboratory of National Forestry and Grassland Administration on Biodiversity Conservation in Karst Mountainous Areas of Southwestern China, Key Laboratory of Plant Physiology and Development Regulation, School of Life Science, Guizhou Normal University, Guiyang, China
- 3Eurofins Lancaster Laboratories Professional Scientific Services, Lancaster, PA, United States
- 4China Guizhou Science Data Center Gui’an Supercomputing Center, Guiyang, China
- 5College of Mathematics and Information Science, Guiyang University, Guiyang, China
13C metabolic flux analysis (13C-MFA) has emerged as a forceful tool for quantifying in vivo metabolic pathway activity of different biological systems. This technology plays an important role in understanding intracellular metabolism and revealing patho-physiology mechanism. Recently, it has evolved into a method family with great diversity in experiments, analytics, and mathematics. In this review, we classify and characterize the various branch of 13C-MFA from a unified perspective of mathematical modeling. By linking different parts in the model to each step of its workflow, the specific technologies of 13C-MFA are put into discussion, including the isotope labeling model (ILM), isotope pattern measuring technique, optimization algorithm and statistical method. Its application in physiological research in neural cell has also been reviewed.
Introduction
Metabolic flux refers to the in vivo conversion rate of metabolites, including the rate of the enzymatic reaction and the transport rate between different compartments (Hui et al., 2020). Flux information deepens our understanding of cell growth and maintenance in response to environmental changes (Becker and Wittmann, 2018; O’sullivan et al., 2019; Van Gastel and Carmeliet, 2021). It is also crucial for revealing the sites and mechanisms of metabolic regulation (Zamboni et al., 2015; Mei et al., 2021).
Accurately estimating flux within complex metabolic networks requires 13C metabolic fluxomics (Niedenführ et al., 2015; Varanasi et al., 2019; Lawson et al., 2021). 13C metabolic fluxomics has been applied to a number of important studies in recent years, strongly pushing forward the frontiers of metabolic research (Varanasi et al., 2019; Van Gastel and Carmeliet, 2021). This technique can identify changes in metabolic pathway activity and discover novel metabolic pathways (Zhang et al., 2018; Wang et al., 2020; Cobbold et al., 2021). Therefore, it is widely used to reveal metabolic changes in various pathogenic processes, such as colorectal adenocarcinomas (Wang et al., 2018), diabetes (Neinast et al., 2019), retinal degenerative disease (Yam et al., 2019) and immune cells (Varanasi et al., 2019). The technique can characterize the metabolic features of multiple plant organs, such as maize embryos (Cocuron et al., 2019), Arabidopsis leaves (Ma et al., 2014) and developing camelina seeds (Carey et al., 2020). It has also been applied in metabolic engineering to guide the optimization of the synthesis of target products, such as acetaldehyde (Cheah et al., 2020), isopropanol (Okahashi et al., 2017) and vitamin B2 (Schwechheimer et al., 2018).
In this review, metabolic fluxomics methods were first classified from the perspective of data modeling. Then, we introduced the components of fluxomics, including the modeling framework, experimental measuring technique, and optimization techniques. Finally, the application of 13C metabolic flux analysis (13C-MFA) in neural cell was reviewed.
Classification of 13C metabolic fluxomics
Recently, 13C-based metabolic fluxomics have evolved into a large family of diverse methods as shown in Figure 1 and Table 1 (Niedenführ et al., 2015). The major categories are as follows:
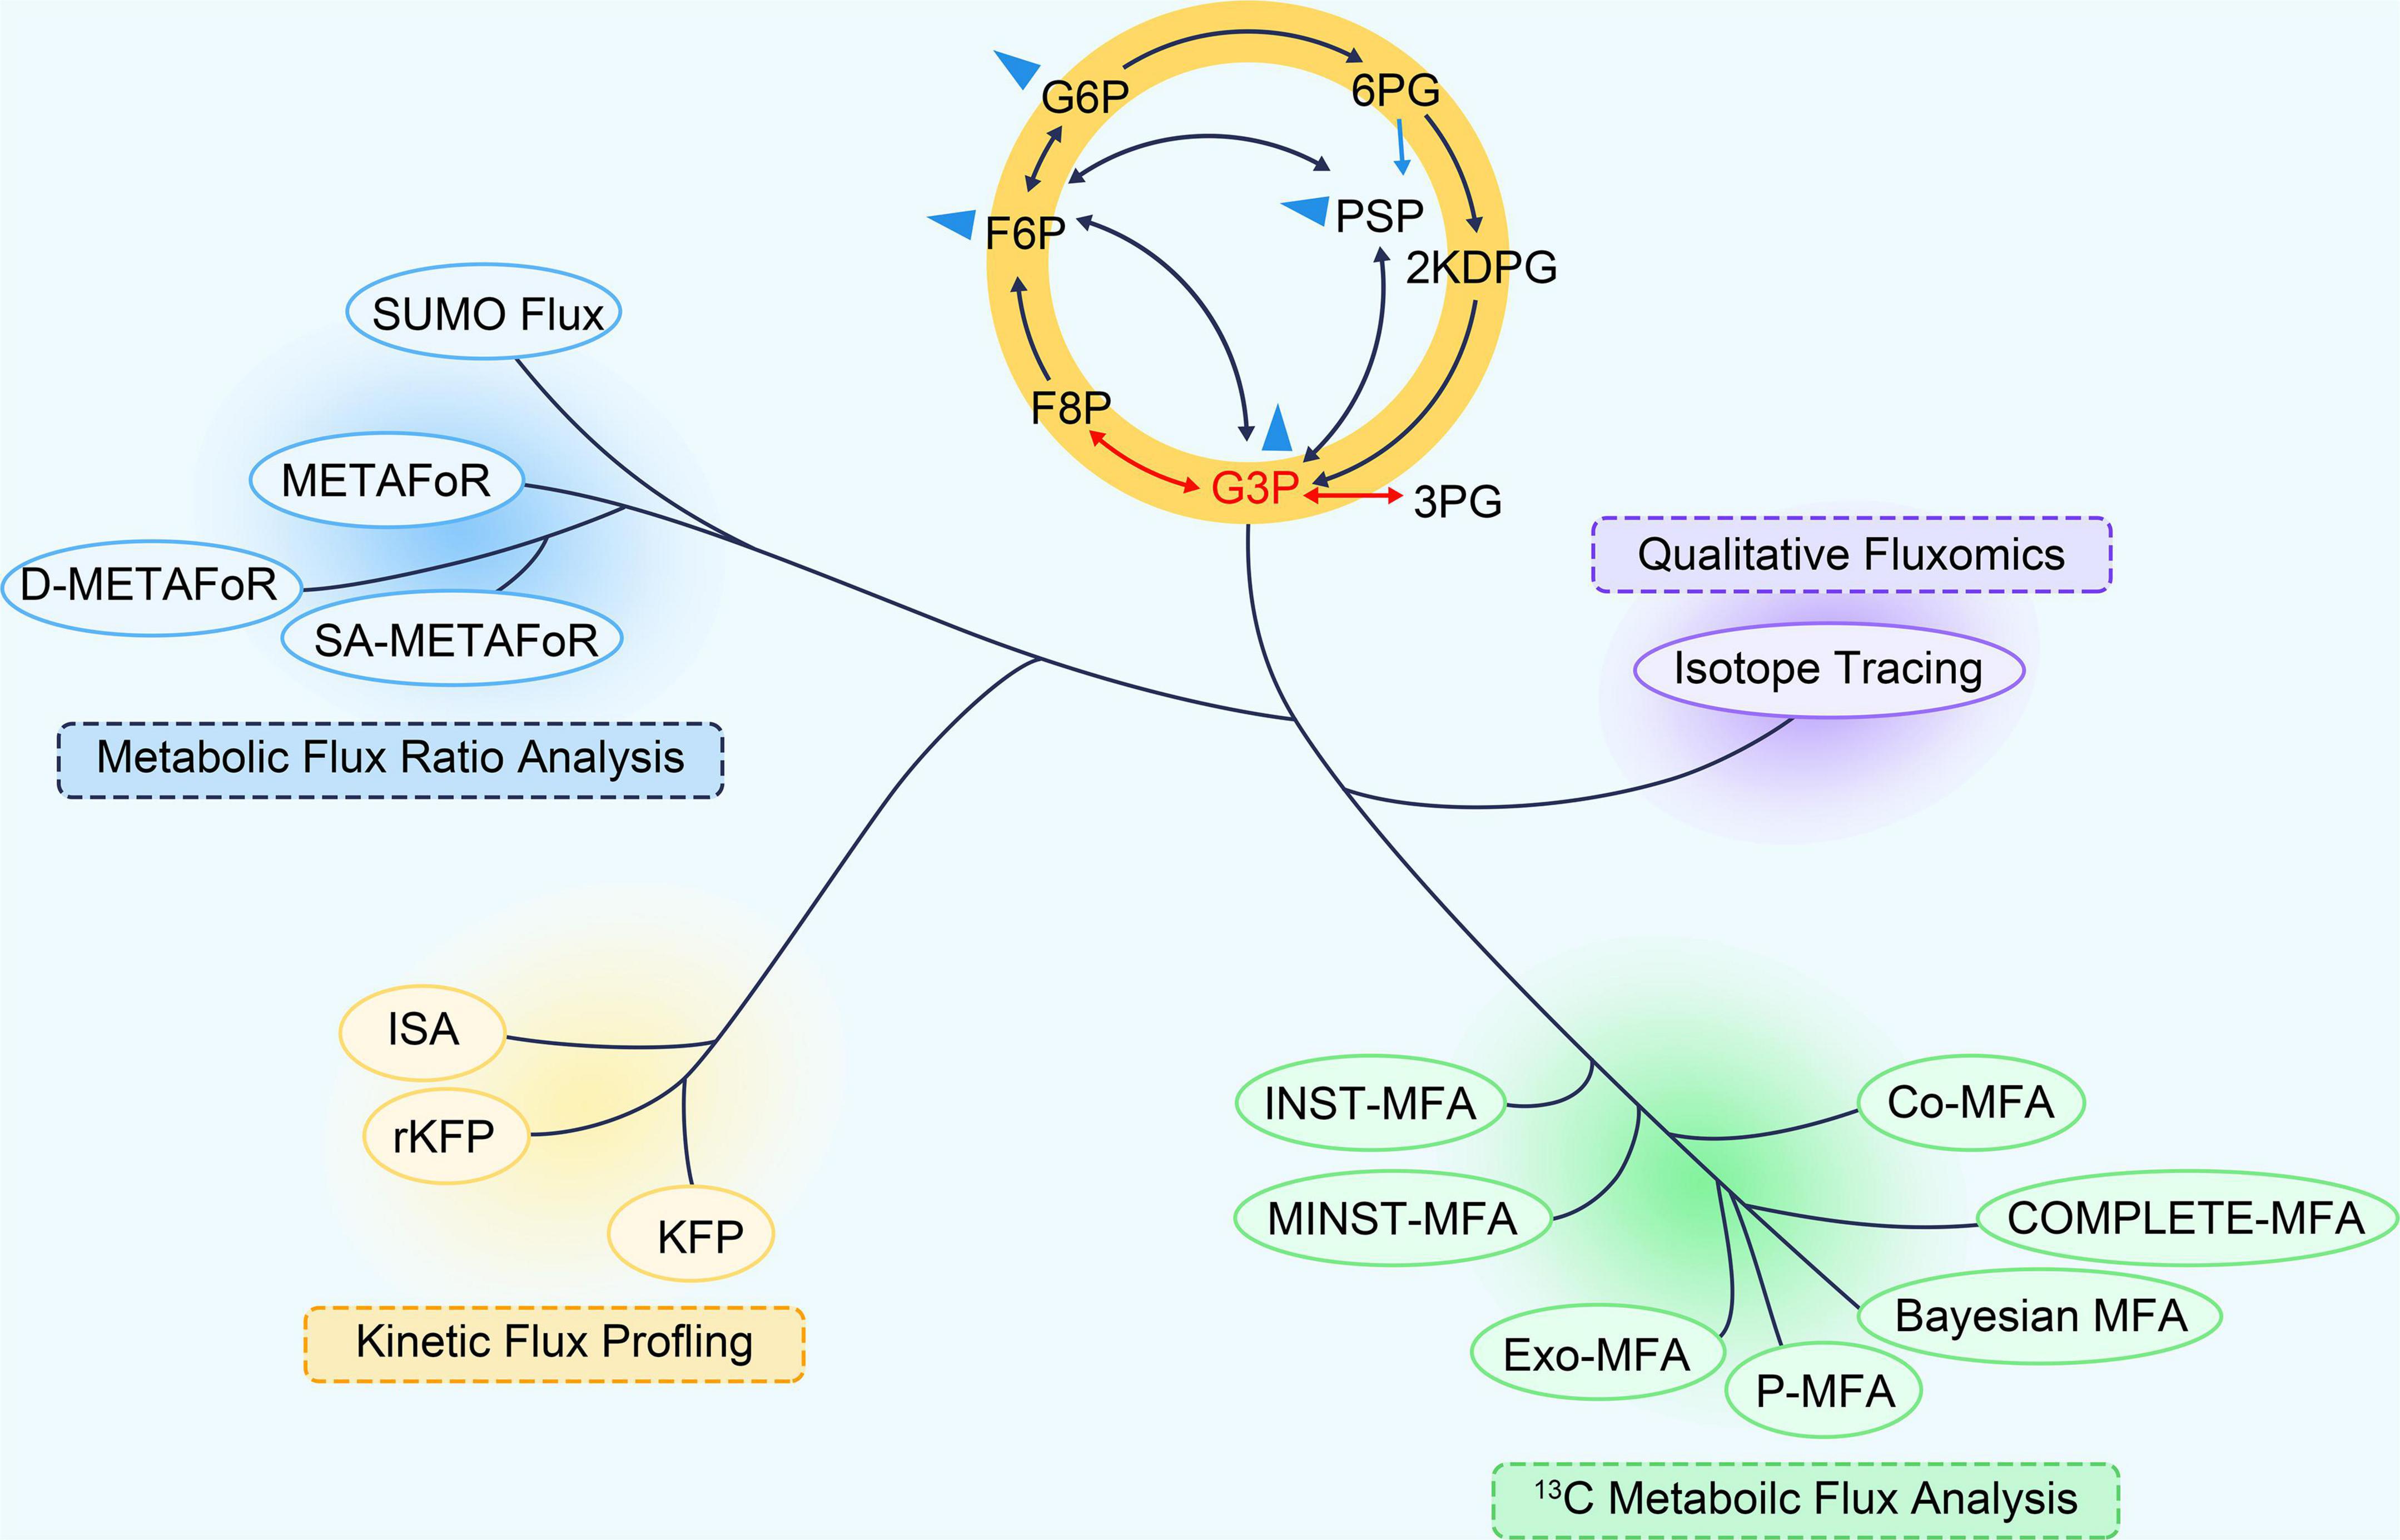
Figure 1. The “phylogeny” of 13C fluxomics methods. A phylogenetic tree can describe the relationship and application of these methods. Co-MFA, Co-culture Metabolic Flux Analysis; COMPLETE-MFA, Complementary parallel labeling experiments technique for Metabolic Flux Analysis; D-METAFoR, Dynamic Metabolic Flux Ratio Analysis; Exo-MFA, by Exosome-mediated Metabolic Flux Analysis; INST-MFA, Isotopically Non-stationary 13C Metabolic Flux Analysis; ISA, Isotopic Spectral Analysis; KFP, Kinetic Flux Profiling; METAFoR, Metabolic Flux Ratio Analysis; MNST-MFA, Metabolically non-stationary 13C metabolic flux analysis; P-MFA, Parsimonious Metabolic Flux Analysis; rKFP, relative Kinetic Flux Profiling; ScalaFlux, Scalable Metabolic Flux Analysis.
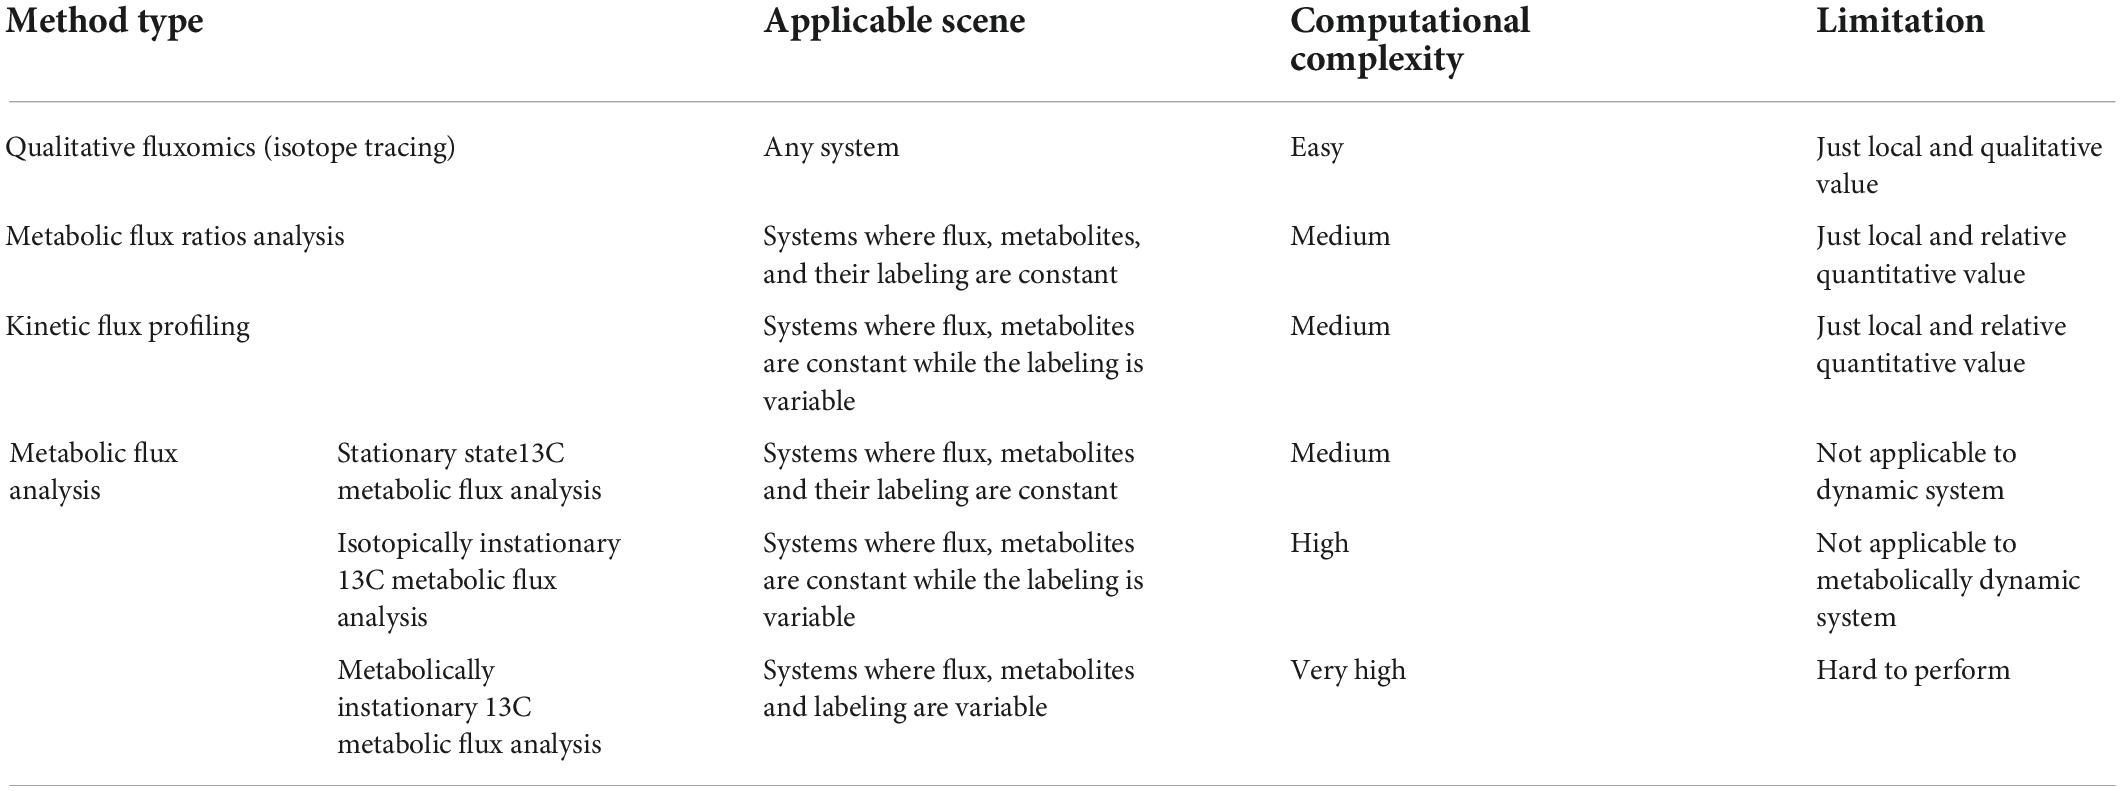
Table 1. Comparison of different fluxomics method.
Qualitative fluxomics (isotope tracing)
In qualitative fluxomics, an isotope-labeled tracer is incorporated into the metabolic system, leading to variation in the isotopic pattern of the metabolites (Faubert et al., 2017; Jang et al., 2018). Qualitative pathway activity changes can be deduced by comparing isotopic data (Ma et al., 2017; Liang et al., 2021). For instance, feeding labeled glucose results in M+3 triose phosphates. M+3 fructose bisphosphate reflects the reversibility of aldolase, while M+3 glucose-6-phosphate reflects fructose bisphosphatase activity (Hackett et al., 2016).
13C flux ratios
Based on the differences between the isotopic compositions of the metabolic precursor and the product, the relative fraction of metabolic fluxes converging to a node can be directly calculated (Sauer et al., 1999; Nanchen et al., 2007). A dozen such ratios can be identified from the isotope labeling patterns of amino acids or organic acids (Shen et al., 2013). This ratio estimation method can be performed when isotope labeling is dynamic (Hörl et al., 2013). Currently, the ratios can be estimated from 13C measurements by dedicated machine learning predictors (Kogadeeva and Zamboni, 2016). The metabolic flux ratio (FR) method has a unique advantage when the overall network topology is unclear and metabolite outflow rate measurements are difficult to detect and determine (Rantanen et al., 2008).
13C kinetic flux profiling
The kinetic flux profiling (KFP) method assumes that the labeled fraction of the metabolite pool changes exponentially during the labeling process. As long as the pool size is accurately measured, this method can estimate the absolute flux through sequential linear reactions according to the kinetic elution equation (Yuan et al., 2008). KFP is extended for quantifying fluxes within subnetworks encompassing convergent nodes and bounded by a unidirectional linear reaction (Szecowka et al., 2013; Heise et al., 2014). It was used to detect kinetic parameters such as the incorporation rate of [6-13C] glucose into phospholipids and the turnover rate of acylglycerol to determine the effect of deleting the cg6718 gene in Drosophila melanogaster (Schlame et al., 2020).
13C metabolic flux analysis
As a major component of metabolic fluxomics, 13C-MFA can accurately determine the absolute value of the flux of the global metabolic network (Antoniewicz, 2015), making it a unique tool for metabolic research. In the carbon labeling experiment, the isotopic distribution of these metabolites depends on the isotopic distribution of the substrate and metabolic flux values (Cheah and Young, 2018). Flux values can be estimated after the isotopic labeling values of measured metabolites are optimally fitted. The flux estimation process can be formalized as the following optimization problem:
v represents the vector of the metabolic flux, s represents the stoichiometric matrix of the metabolic network, and M⋅v ≥ b provides additional constraints from physiological parameters or excretion metabolite measurement. yiin represents vectors of the isotope labeled substrate. Xn is a matrix, and its rows are the vectors of the isotope labeling model (ILM) of the corresponding elementary metabolite unit (EMU) fragment with n carbon atoms. Yn is a matrix similar to Xn, in which its rows are the vectors of the ILM of the corresponding input substrate and/or the calculated EMU fragment with 1 ∼ (n-1) carbon atoms. In the objective function, x is the vector of the isotope-labeled molecules in X1,…, Xn, and xM is the experimental counterpart to x. An and Bn represent the system matrix determined by the corresponding metabolic reaction topology and atomic transfer relationship. Σe represents the covariance matrix of the measured values.
We briefly described the workflow and principles of 13C-MFA as depicted in Figure 2 and then discussed the technical details used in the process. The 13C-MFA method first involves a carbon labeling experiment (Hollinshead et al., 2019). Specific 13C-labeled substances are chosen as carbon sources for cell culture experiments, depending on the cell type. For example, early 13C-MFA approaches often used various mixtures of [1-13C] glucose, [U-13C] glucose and unlabeled glucose as substrates (Leighty and Antoniewicz, 2013). In carbon labeling experiments, the isotope label material is gradually distributed to various metabolites in the metabolic pathway. Since the amount and location of 13C in metabolites are closely related to metabolic flux, different metabolic flux distributions produce different isotope labeling levels. Then, the labeling status of the substrate is determined based on a specific mathematical relationship between the metabolic flux distribution and the isotopic labeling status of the metabolites in vivo (Wang et al., 2020), which can be described by formula (1). Based on this relationship, we can obtain the distribution of the metabolic flux by accurately measuring the isotope labeling levels of the metabolites. The accurate method used for determining the status of the 13C isotope label includes mass spectrometry (GC−MS and LC−MS) and nuclear magnetic resonance (NMR) spectroscopy (Rahim et al., 2022). Then, we can estimate the level of metabolic flux. Specifically, we can first determine the random distribution of the metabolic flux, and then, based on the value from formula (1), we can calculate the corresponding theoretical isotope labeling status of each metabolite. Then, the calculated labeling status is compared with the measured labeling status. According to the difference between the two, the given metabolic flux distribution can be repeatedly adjusted until the difference between the two is less than a specific threshold. The resulting metabolic flux distribution is the true distribution of the estimates (Weitzel et al., 2013).
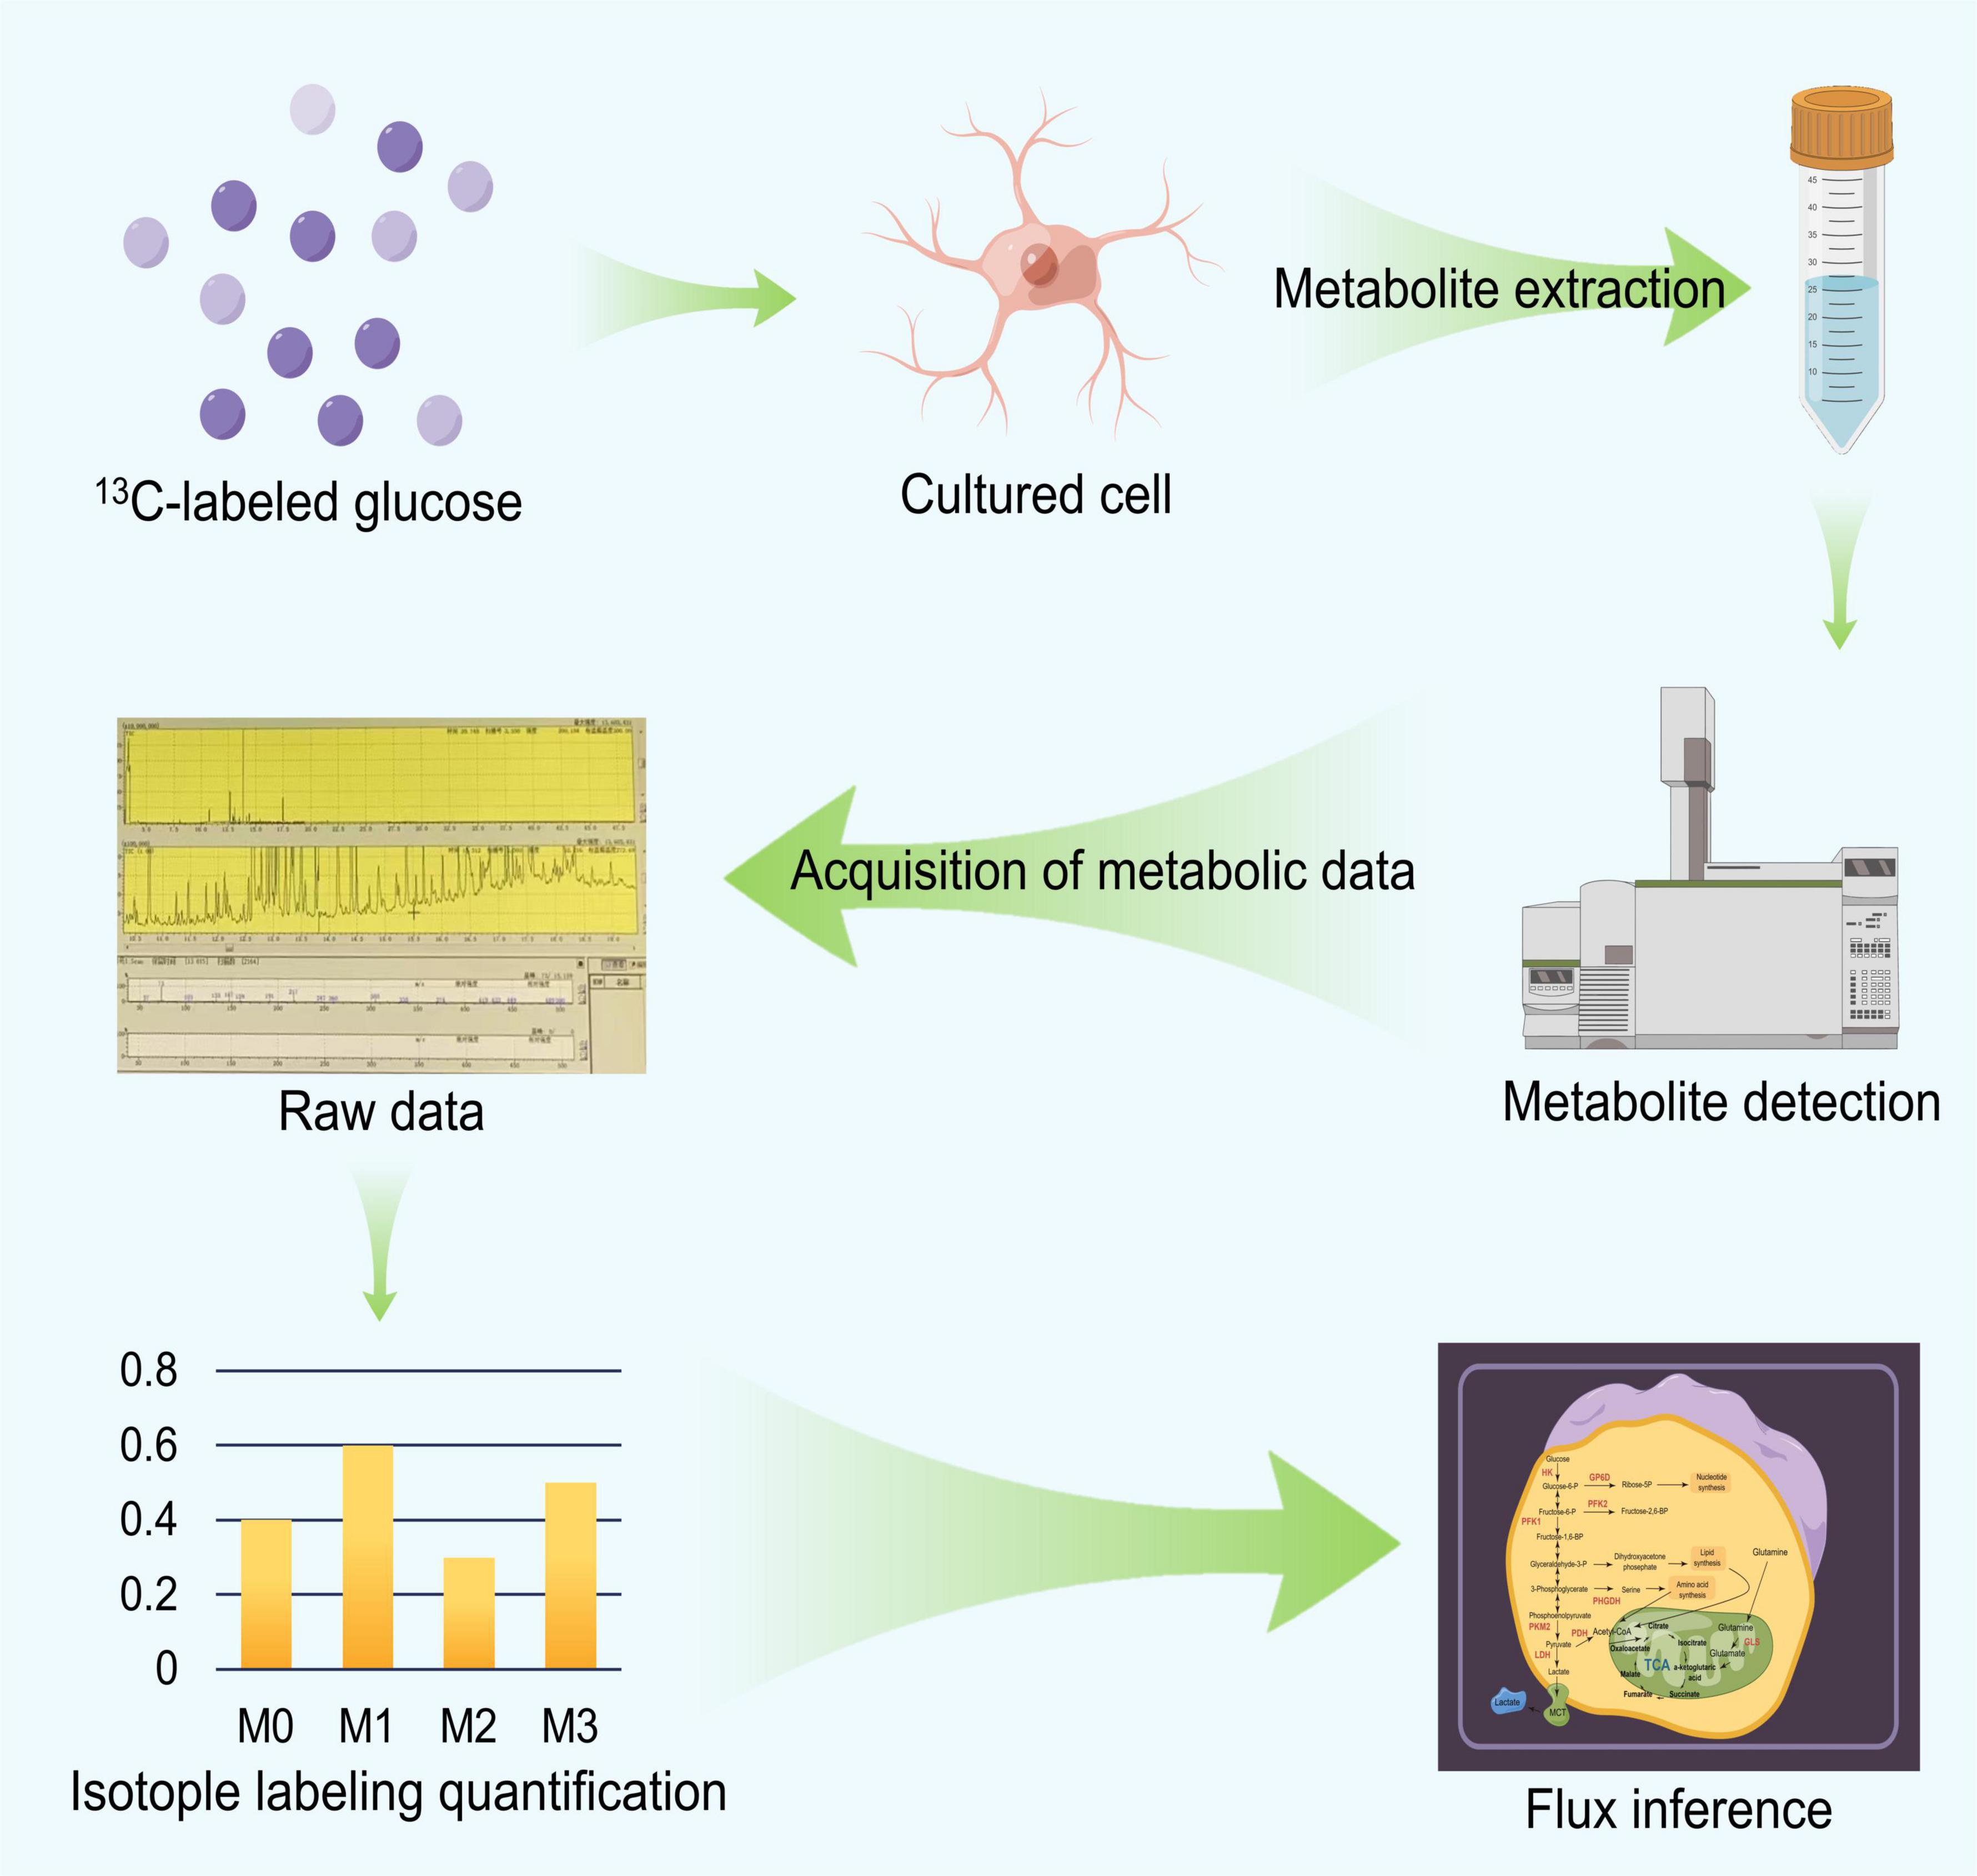
Figure 2. The flow chart of 13C Metabolic Flux Analysis (13C MFA).
Classification of 13C metabolic flux analysis
According to formula (1), metabolic flux analysis can be divided into three categories, stationary state13C metabolic flux analysis (SS-MFA) (Weitzel et al., 2013), isotopically instationary 13C metabolic flux analysis (INST-MFA) (Wahl et al., 2008; Young et al., 2008) and metabolically instationary 13C metabolic flux analysis (MNST-MFA) in Figure 3 (Abate et al., 2012; Van Heerden et al., 2014).
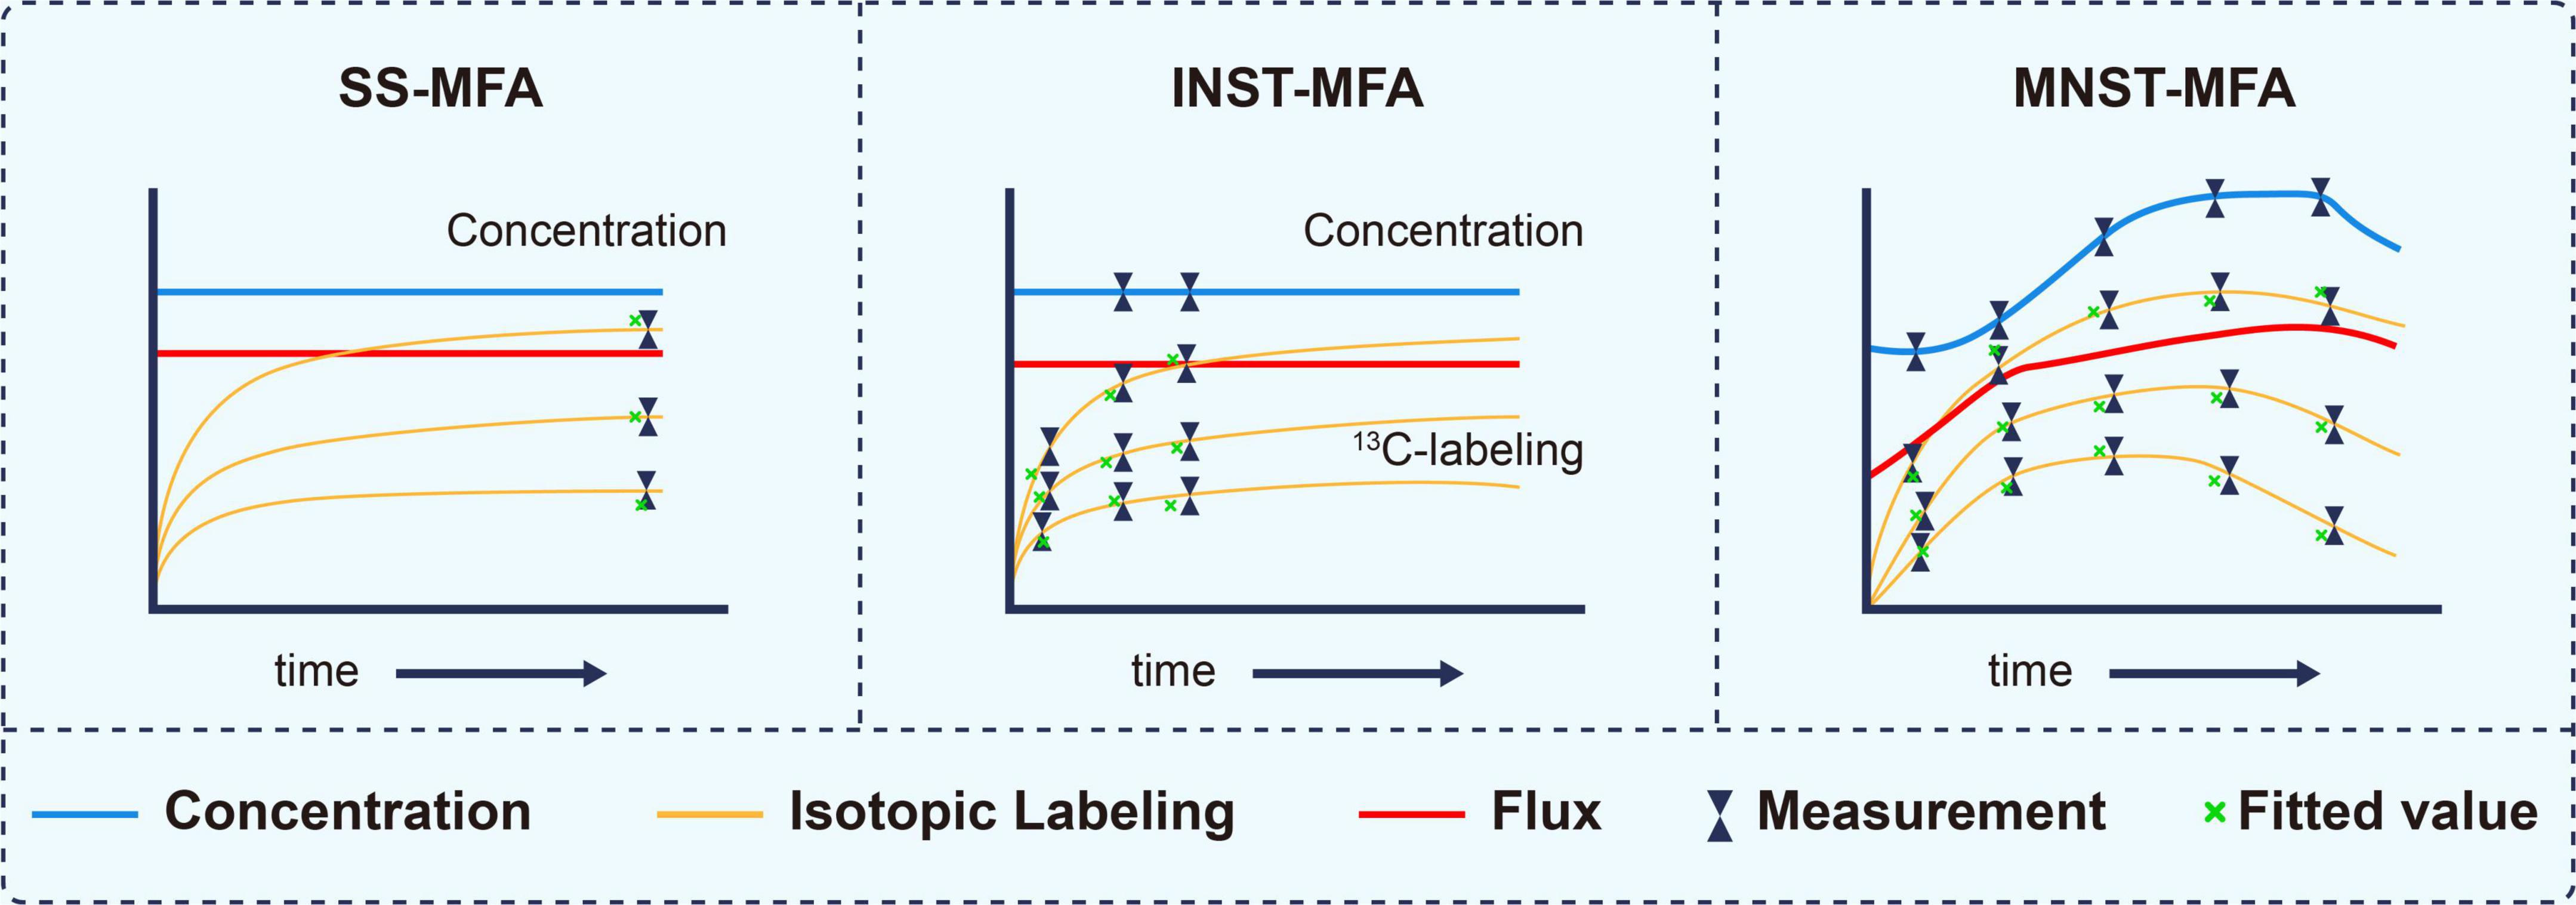
Figure 3. Characterization of different 13C metabolic flux analysis methods, modified from (37). The essential distinguishing feature between these methods are whether isotopically stationary state is reached and whether metabolic steady state is assumed. SS-MFA, Stationary State 13C Metabolic Flux Analysis; INST-MFA, Isotopically Non-stationary 13C Metabolic Flux Analysis; MNST-MFA, Metabolically non-stationary 13C metabolic flux analysis.
SS-MFA refers to the case when all dXi/dt of the constraint conditions in formula (1) are equal to 0 and v is constant. The method is suitable for systems in which metabolic flux and isotope labeling state do not change with time (Wiechert and Nöh, 2005). Such system is usually at end of a long-term labeling process and is also called stable labeling. The flux distribution can be deduced by measuring the isotopic labeling state of metabolites in the steady state.
INST-MFA refers to the case when not all dXi/dt in the constraint conditions in formula (1) are equal to 0 and v is constant. It can be applied to systems in which the metabolic flux and metabolite concentration do not change with time while the isotopic labeling fraction changes with time (Gopalakrishnan et al., 2018). In such a system, the isotope labeling process is in an early dynamic stage and does not reach a stationary state. Therefore, the labeling state is a function of not only the substrate labeling fraction and metabolic flux but also the labeling time. It is necessary to carry out multiple dynamic measurements and to solve the isotopic differential equations to deduce the metabolic flux.
MNST-MFA refers to the case when not all dXi/dt in the constraint conditions in formula (1) are equal to 0 and v is a time-varying function. This method fits well with systems in which the metabolite concentration, metabolic flux and isotope labeling fraction all change with time (Abate et al., 2012). Its output is not just a flux value but a flux profile over a period of time (Quek et al., 2020).
Technology of 13C metabolic flux analysis
The necessary technology of 13C-MFA includes isotope labeling modeling, isotope labeling state measurement, flux optimization and statistical analysis. The details are as follows:
Isotope labeling model
The quantitative interpretation of isotope-labeled data, that is, the estimation of metabolic flux, requires an algorithm that can describe the accurate relationship between metabolic flux and isotope-labeled fractions (Zamboni, 2011). We call this the ILM, that is, the content of X in formula (1). The same 13C labeling experiment can be simulated with different ILMs (Weitzel et al., 2007). Different ILMs characterize the same labeling system from different perspectives.
If there is any 13C incorporated into the molecule, the same compound will be distinguished due to the number and position of 13C. 13C isotopomer is any isomer of an organic compound differing only in the number and position of 13C (Table 2). Isotopomers corresponds to basic isotopically labeled molecules (Schmidt et al., 1997). The isotopomer I100 in Figure 3 represent a labeled molecule where the first carbon is 13C and the second and third carbons are 12C. Cumomers is another form of Isotopomer, and its coded appearance is exactly the same as that of Isotopomer. But the 0 in Isotopomer code means 12C, and the 0 in Cummer means “12C or 13C,” which is a collection where both 12C and 13C are allowed. Cumomers contain the same information as isotopomers, and the number of model particles is the same as that of isotopomers (Wiechert and De Graaf, 1997). The complete set of cumomers and the complete set of isotopomers are equivalent. The information of mass isotopomers and isotopic positional enrichment is coarser than that of isotopomers, and correspondingly, the number of model particles is lower than that of isotopomers (Hellerstein and Neese, 1992; Zupke and Stephanopoulos, 1994). Bondmer is an ILM in the case of uniformly labeled substrates. Each individual bondmer is a set of specific isotopomer whose fraction can calculated by a binomial distribution as shown in Figure 3 (Van Winden et al., 2002). The EMU framework is a framework suitable for simplifying and accelerating the simulation of various ILMs (Antoniewicz et al., 2007). It can accelerate various ILMs and has been widely adopted. Figure 4 shows the concept and corresponding relationship of various ILMs by taking a compound containing 3 carbon atoms as an example.
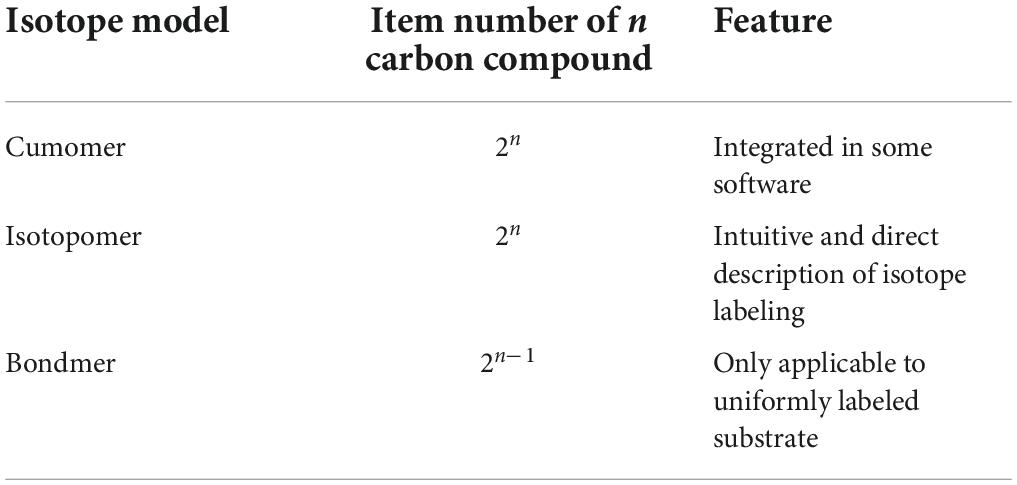
Table 2. Comparison of different isotope model.
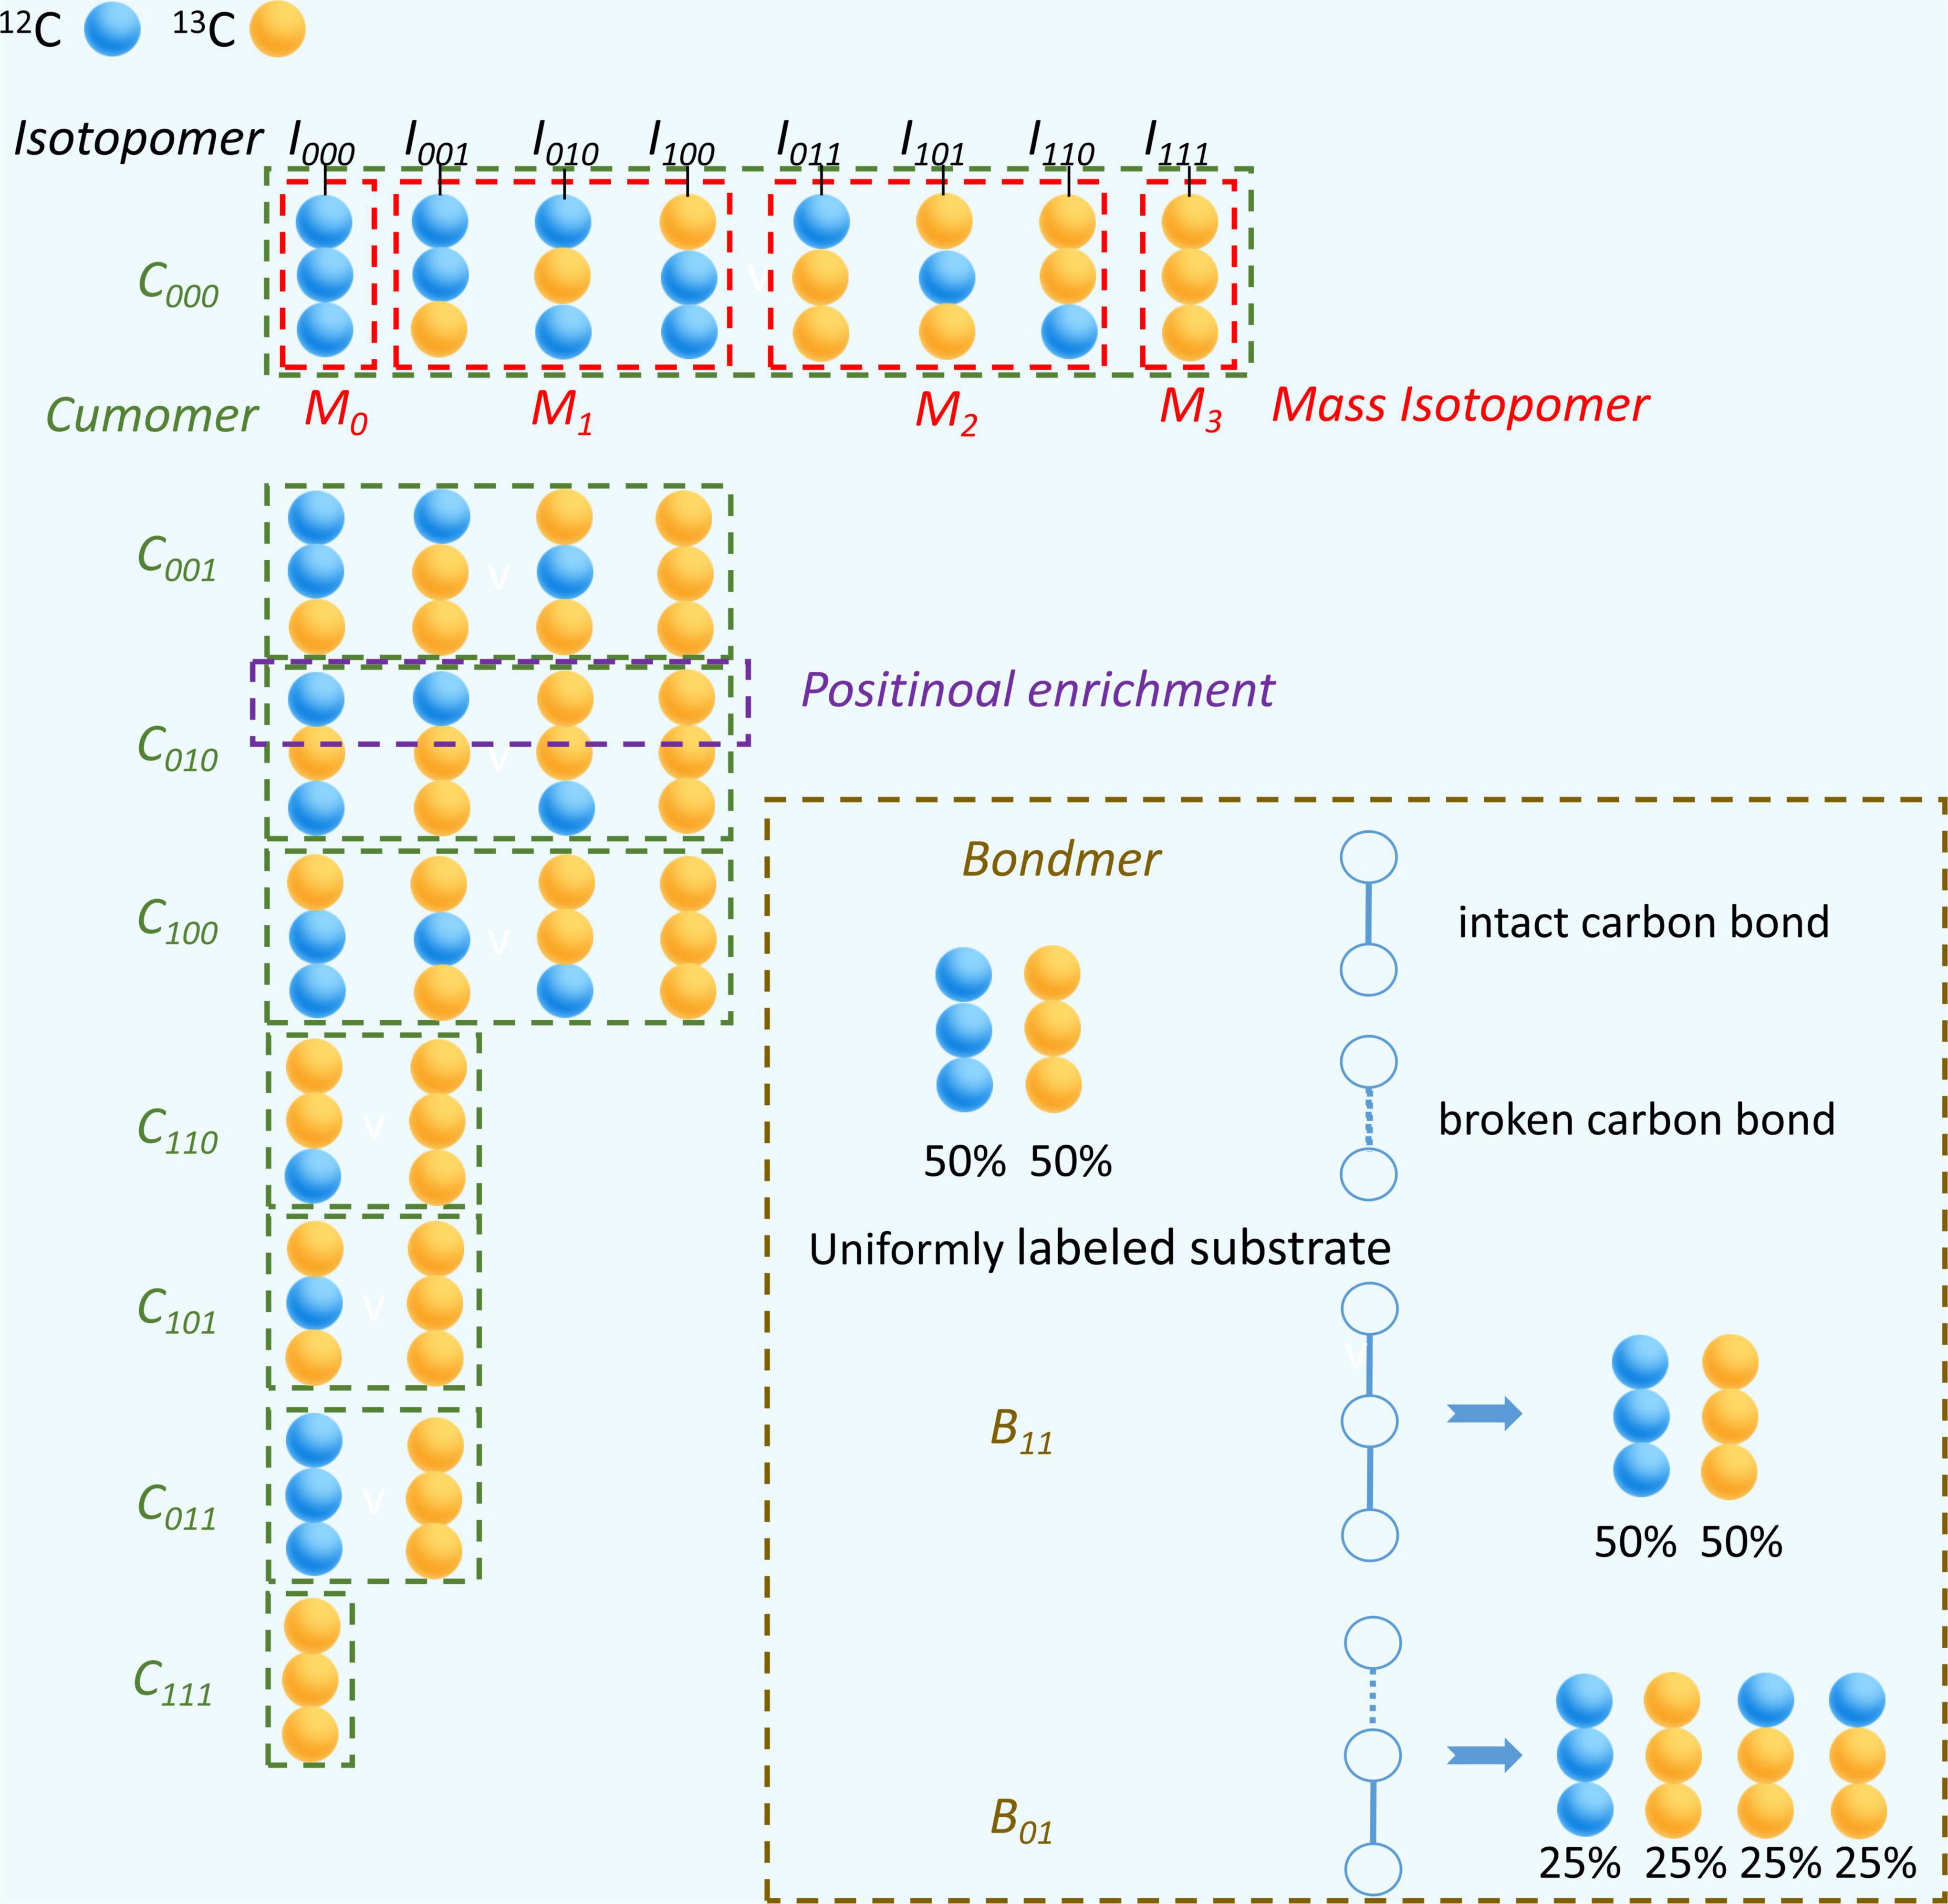
Figure 4. Characterization of different 13C isotope labeling model with a 3 carbon atoms metabolite. Blue ball represents 12C and yellow ball represents 13C. The isotope molecule associated with black line segment is specific type of isotopomer, such as I100. The isotope molecules in red dashed box belong to the same group of mass isotopomer, such as M1. The isotope molecules in green dashed box belong to the same group of cumomer, such as C100. In brown dashed box, white open circle represents a carbon position, blue represents a carbon-carbon bond that has never been broken by any reaction and blue dashed line represents a carbon-carbon bond that has been broken by a reaction and rejoined by another reaction. The percentage below a isotopic molecule is its abundance fraction.
The cascade equation solution can reduce the computational complexity and has been used until now (Wiechert et al., 1997). Isotopic differential equations were developed as a basic framework for isotopically instationary flux analysis (Wahl et al., 2008; Young et al., 2008), which significantly expanded the scope of flux analysis. The modeling of mass isotopomers can be rearranged like that of cumomers and gradually parallelized (Zhang et al., 2020). In addition, a framework for metabolically instationary flux analysis was proposed and applied to the temporal flux reconfiguration of the glucose pathway of adipocytes in response to insulin (Abate et al., 2012; Quek et al., 2020).
Isotope molecule measurement
The measurement of X in formula (1) determines the objective function. The appearance of 13C at different positions classifies a molecule as different isotopic molecules. Differences in the physical and chemical properties of 13C and 12C are the basis for discriminating these isotopic molecules. They have at least two differences. One is that 13C has a half integer nuclear spin, so it can be detected by NMR (Reardon et al., 2016). The other is that 13C has a greater mass number than 12C, so their difference can be detected by mass spectrometry.
1D NMR of 1H and 13C can provide information on positional labeling enrichment as stated in ILM (Vinaixa et al., 2017; Deja et al., 2020; see Figure 5). Correlation Spectroscopy (COSY) is a 2D NMR technique that displays correlations between J-coupled nuclear by stepping up the delay between two 90°-proton pulses. Two-dimensional heteronuclear correlation spectroscopy (2D-COSY) (Szyperski, 1995), three-dimensional heteronuclear correlation spectroscopy (3D-COSY) (Boisseau et al., 2013) and proton-detected 2D heteronuclear single-quantum coherence (HSQC) (Lane et al., 2019) can detect the fraction of a specific subset of isotopomers. The set is a fragment of 3 continuous carbon atoms. Its middle carbon is 13C, while the carbons on both sides are 12C or 13C. 2D heteronuclear multiple quantum coherence-total correlation spectroscopy (HMQC-TOCSY) (Carvalho et al., 1998) and 3D total correlation-heteronuclear single-quantum coherence (TOCSY-HSQC) can detect another type subset of isotopomers (Reardon et al., 2016). This set is a fragment of continuous carbon atoms in the same spin system. One of its ends is 13C, and the other may be 12C or 13C. A non-uniform sampling technique can be used to improve the sensitivity and resolution of the fine structure in NMR spectrometry (Lee et al., 2017).
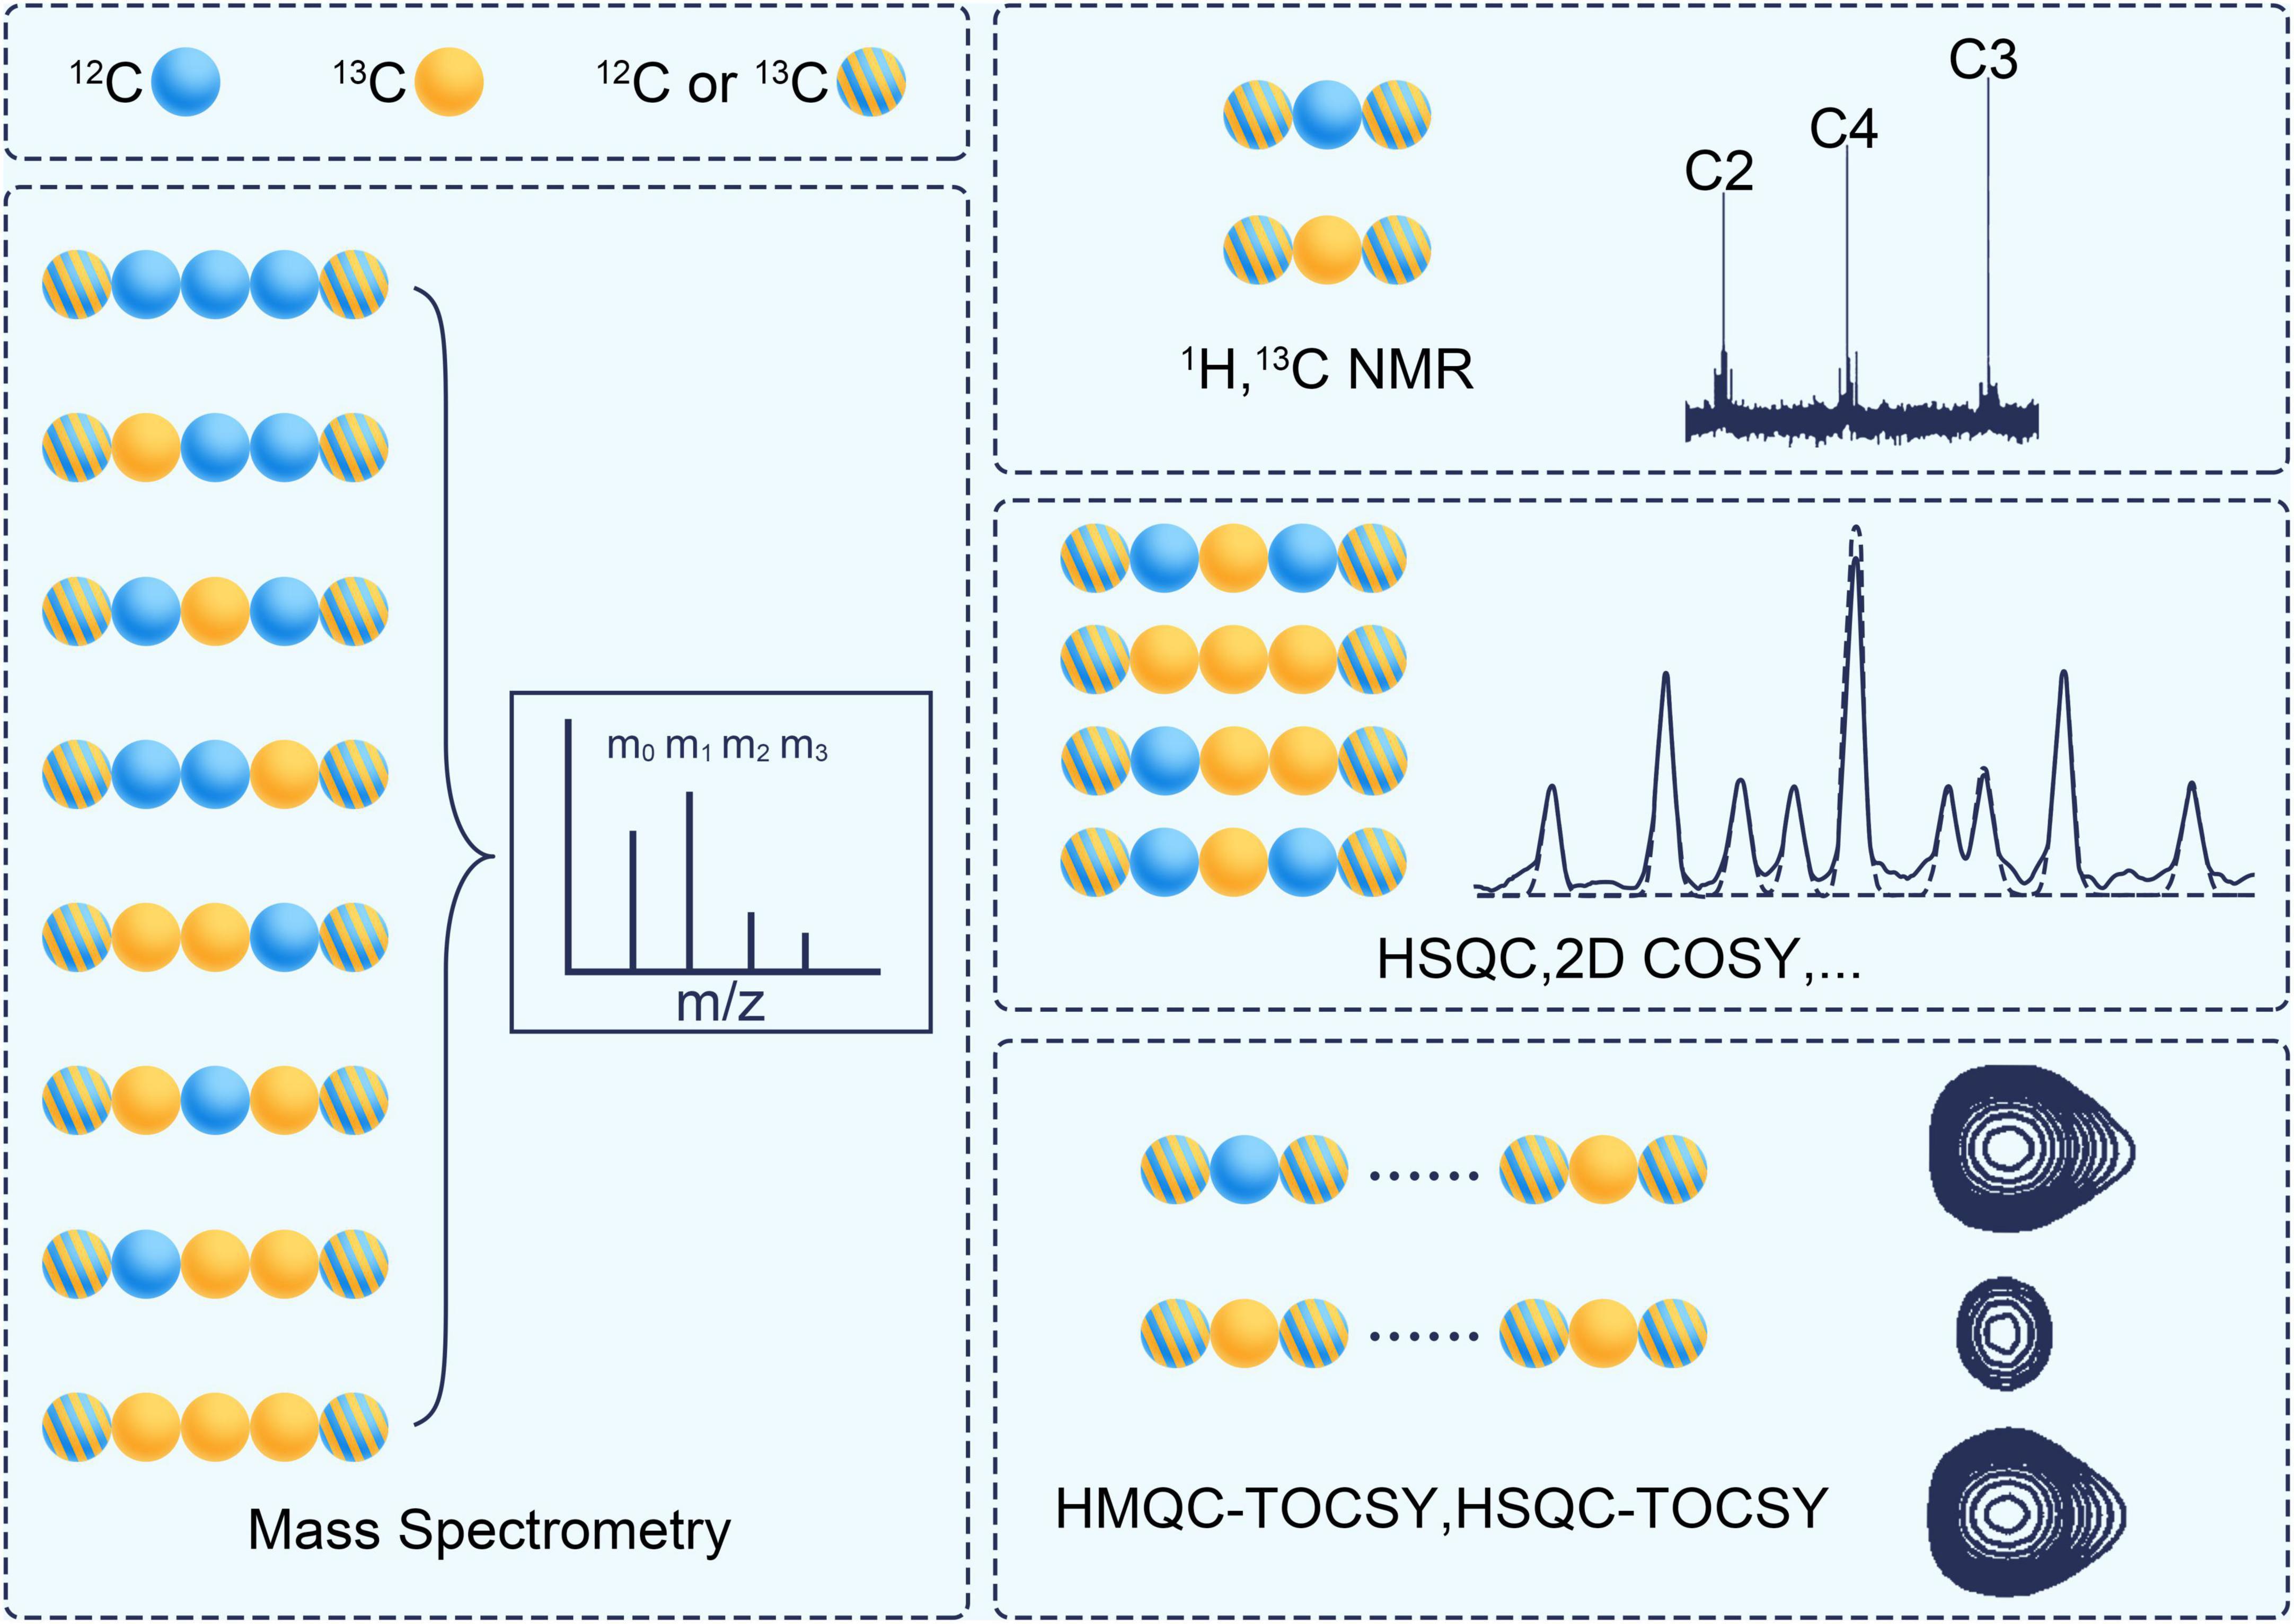
Figure 5. The analytical techniques for measuring the isotope labeling pattern. Blue ball represents 12C and yellow ball represents 13C. The stripped ball represents 12C or 13C. COSY, correlation spectroscopy; HSQC, heteronuclear single quantum coherence; HMQC, heteronuclear multiple quantum coherence; TCOSY, total correlation spectroscopy.
Gas chromatography-electron ionization (GC-EI)-quadrupole can quantify the mass isotopomers of amino acids (Dauner and Sauer, 2000), organic acids and phosphate sugars (Jung and Oh, 2015; Evers et al., 2021). With the development of tandem mass spectrometry, gas chromatography-electron ionization-triple quadrupole (GC-EI-tripleQ) (Okahashi et al., 2016), gas chromatography-chemical ionization- quadrupole time of flight (GC-CI-QToF) (Mairinger et al., 2015), liquid chromatography-electron spray ionization-triple quadrupole (LC-ESI-tripleQ) (Jeffrey et al., 2002; Rühl et al., 2012), and liquid chromatography-electron spray ionization-quadrupole time of flight (LC-ESI-QToF) (Kappelmann et al., 2017) have been used to measure position enrichment and mass isotopomers. Hundreds of metabolites can be detected, and more accurate results can be obtained. To simplify the sample processing, capillary electrophoresis QToF has also been added to the lineup (Toya et al., 2007). Gas chromatography-combination isotope ratio mass spectrometry (GC-C-IRMS) is suitable for the accurate determination of very low isotopic enrichment abundance (Yuan et al., 2010; Croyal et al., 2016). The data of mass spectrometry should be corrected for naturally occurring heavy isotopes before used by flux analysis (Jeong et al., 2021).
Optimization technique
Flux estimation solves the entire optimization problem of formula (1). This process depends on local or global optimization methods. As a heuristic method, an evolutionary algorithm was employed early in the optimization of S-MFA (Wiechert, 2001). Some of its derivatives, such as the convex evolutionary algorithm and adaptive evolutionary algorithm, were introduced later (Chen et al., 2007; Yang et al., 2007). Simulated annealing has also been successfully applied to S-MFA (Fu et al., 2015).
A hybrid algorithm combining the trust-region method and sequential quadratic programming (SQP) facilitates numerically stable and accurate flux estimation of S-MFA (Yang et al., 2008). The Levenberg Marquardt algorithm, one type of trust-region method, is widely used and can guarantee fast convergence for INST-MFA (Young, 2014).
The sum-of-squares residual error (SSE) between the measured and simulated data is the main form of the objective function in formula (1)(Wiechert, 2001). Additionally, the Akaike information criterion (AIC) can be used as an objective function in seeking the simplest candidate models sufficient to generate the observed data (Alger et al., 2021).
Flux uncertainty analysis
Since metabolic flux analysis is a parameter estimation problem, there are uncertainties in the obtained parameters. Flux uncertainty analysis should become part of routine analyses. Local linear error propagation based on the chain rule is an earlier method for determining the confidence interval of flux values (Wiechert et al., 1997). In contrast, a profile likelihood method would directly execute non-linear mapping over error propagation, which is preferred due to the corresponding high computational efficiency and accuracy (Antoniewicz et al., 2006). In addition to the error propagation method, another idea is to obtain the probability distribution of metabolic flux. The Monte Carlo method can be used to generate such a distribution based upon a Gaussian distribution or chi-square distribution assumption for the measurement error (Wittmann and Heinzle, 2002). In some experiments, the shape of this distribution can be posteriorly calculated using Markov chain Monte Carlo (MCMC) from isotopic data (Kadirkamanathan et al., 2006; Theorell et al., 2017).
Derivative method
Different constraints can be introduced in formula (1) to generate a new derivative of MFA, which can expand the scope of metabolic flux analysis or make it more accurate in some cases. Compartment-specific metabolic flux in mitochondria and cytosol can be quantified by a spatial-flux analysis with rapid subcellular fractionation and quenching of metabolism (Lee et al., 2019). A flux analysis method for local subnetworks was recently proposed and needs only the information of the subnetwork of interest, requiring no additional knowledge of the surrounding networks (Millard et al., 2020). 13C MFA has also been extended to solve metabolic networks at the genome scale by incorporating a large set of secondary metabolic reactions (Blank et al., 2005; Martín et al., 2015; Gopalakrishnan et al., 2018). In addition, flux analysis goes beyond the scope of cells (Hui et al., 2020; Liu et al., 2020). The flux from source cells to recipient cells through vesicles can be accessed by exosome-mediated metabolic flux analysis (Exo-MFA) (Achreja et al., 2017). Gebreselassie and Antoniewicz (2015) proposed a framework determining the metabolic flux of multiple bacteria coexisting in a mixed system. 13CO2 and 15NH4 labeling strategies can be used to unravel the short-term flux of plant-assimilated C and fungal-obtained N through an in situ ectomycorrhiza system (Gorka et al., 2019).
Parsimonious MFA utilized a dual optimization minimizing both the SSE and the sum of the flux values. This minimization can be weighted by gene expression to integrate gene expression data with 13C data (Foguet et al., 2019). In COMPLETE-MFA, multiple substrates are used in parallel to generate complementary labeling information to improve the accuracy of the flux estimation. Generally, the accuracy can be significantly improved by utilizing 2–3 parallel data (Leighty and Antoniewicz, 2013). A truncated multi-model MCMC method was adopted to infer the in vivo probability of bidirectional reactions and to determine whether they are unidirectional or bidirectional (Theorell and Nöh, 2020). This can expand the range of 13C MFA from parameter inference to structure inference.
The reaction thermodynamic information from metabonomic and physiological data can restrict the solution space of flux and avoid a priori hypotheses about the flux direction (Saldida et al., 2020). With this tool, higher-precision inference of the network structure and flux values can be achieved, and some new flux patterns can be identified. Conversely, the Gibbs free energy of the reaction can be deduced from the metabolic flux values (Park et al., 2016).
Application in neural cell research
Neurons and glial cells are the major cells of the nervous system. Neurons are a kind of specially differentiated cells with the ability to sense stimulation and conduct excitation, and is important to the functioning of the nervous system. Glial cells are not able to conduct impulses but nourish, insulate and protect neurons. Neurons provide electrical signaling to glial cells to fuel oxidative metabolism in the brain, while glial cells provide metabolic substrates to neurons. Metabolic activity in the brain requires a lot of energy. Cognitive phenotypes are related to neural metabolism, including neuronal mitochondrial mutation and neuron-glia metabolic crosstalk (Watts et al., 2018). Metabolic flux through both cell types is a factor modulating higher order phenotypes. Hence, it is rather interesting to discover how metabolic flux and neural cell function are related.
As outlined in Table 3, different types of 13C metabolic fluxomics have been successfully applied to study the metabolic reprogramming and its regulatory mechanism of neural cell (Lanz et al., 2013). INST-MFA was utilized to assess the metabolism shift upon differentiation of Neural Stem Cells (NSCs) into astrocytes, discovering an extensive decrease of central carbon metabolism and conversion of flux through TCA cycle to lac pathway during astrocytic differentiation (Sá et al., 2017). Isotope-tracing has been used to quantify the fraction of labeled monosaccharides in the glycans and glycosphingolipids of both pluripotent and neural NTERA-2 cells. It revealed that exogenous monosaccharide utilization would vary noticeably according to the cell differentiation state and different glycan structures (Wong et al., 2020). FR analysis and steady-state flux analysis was combined to find that more of glucose flux was channeled by glycolysis than that by pentose cycle of adherent cerebellar granule neurons. Meanwhile, it determined that 16% of glucose used by mitochondria comparing to 46% by lactate dehydrogenase (Gebril et al., 2016). By revising bi-directional reaction of the non-oxidative PPP pathway and TCA cycle, this method became more broadly applicable to different cell types (Jekabsons et al., 2017). Patel et al. (2021) investigated TCA cycle and neurotransmitter cycle fluxes ratio by FR method from a steady-state [2-13C] acetate experiment and the 13C turnover rates of neurotransmitter by a KFP-like fitting on labeling kinetics of amino acids in 13C glucose infusion experiment. The mitochondrial TCA flux of glutamatergic neurons and glutamate-glutamine cycle flux was declined in the cerebral cortex of aged mice. Isotope-tracing allows investigation of astrocyte-specific metabolic networks affected by Apolipoprotein (APOE) and observes an increase in flux through the pentose phosphate pathway, with subsequent increases in gluconeogenesis and lipid biosynthesis pathway in Apolipoprotein E4 astrocytes (Williams et al., 2020).
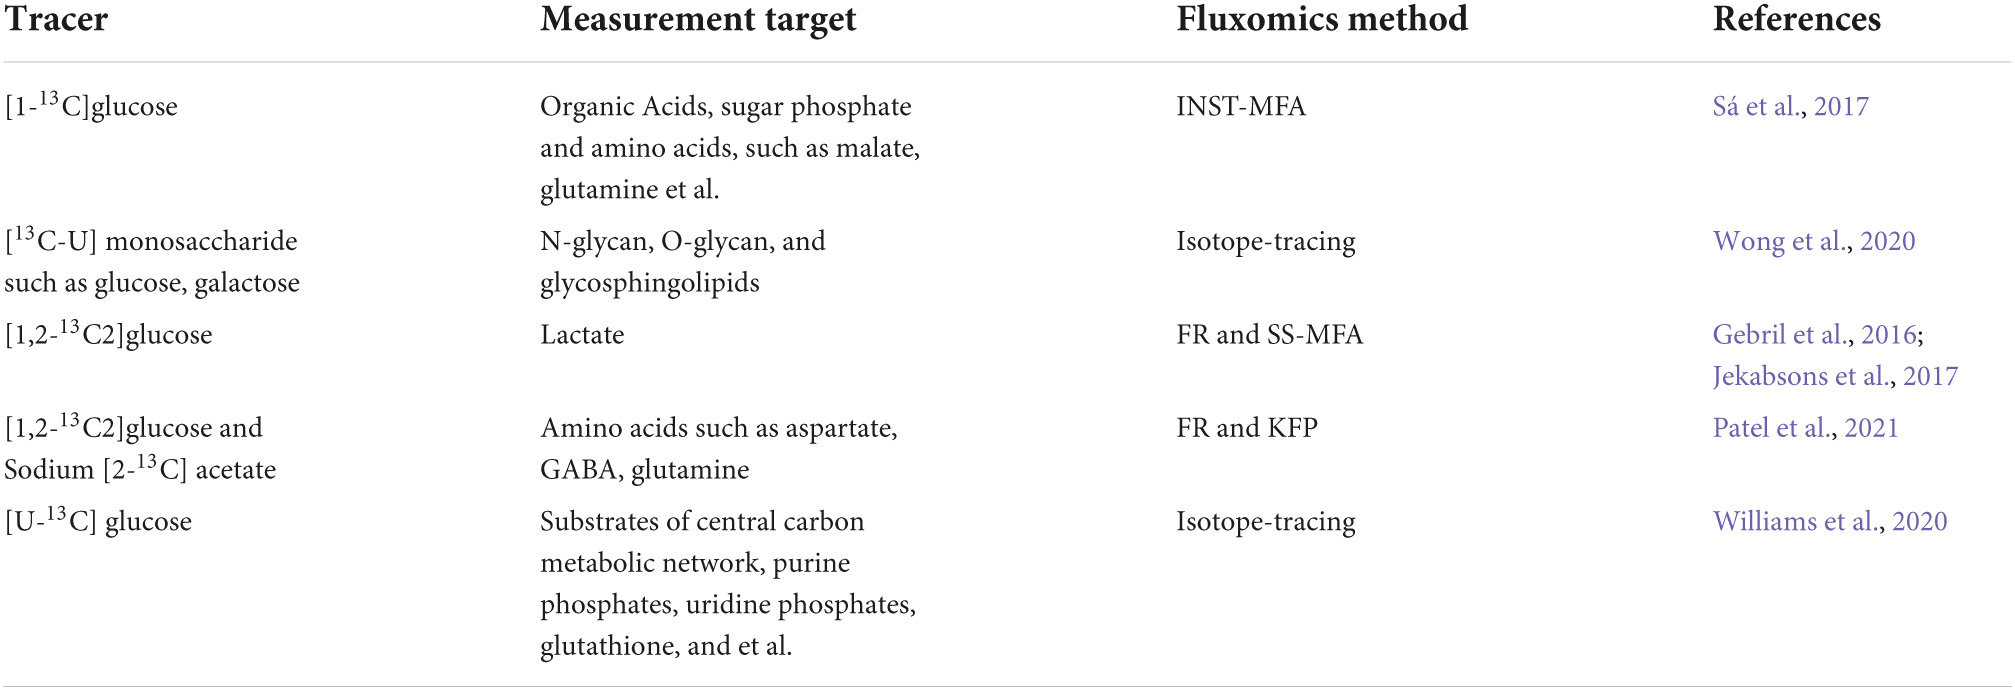
Table 3. Outline of neural cell studies using fluxomics method.
Conclusion
Stable isotope metabolic flux analysis has been successfully used in applications from homogeneous cell systems to heterogeneous cell systems, even at the level of animal and plant organs. It has now become the gold standard for measuring metabolic flux values. Several technologies that it includes are also developing rapidly, so the metabolic fluxomics method is evolving into a family with different members that have higher accuracy, wider coverage, more application scenarios, and shorter time consumption.
At present, the development of stable isotope metabolic flux analysis should focus on improving the temporal and spatial resolution. This requires the continuous introduction of updated detection technology.
Author contributions
BT, MC, and LL drafted the manuscript. TS and ZZ conceived of the study. TS, ZD, and BR helped to draft the manuscript. All authors read and approved the final manuscript.
Funding
This work was supported by the Guizhou Provincial Science and Technology Projects (grant no. QI ANKEHEJICHU-ZK[2021] Key 038), the National Science Foundation of China NSFC (grant no. 31760254), the Joint Fund of the Natural Science Foundation of China and the Karst Science Research Center of Guizhou Province (Grant No. U1812401), and the Provincial Program on Platform and Talent Development of the Department of Science and Technology of Guizhou China (grant no. [2019]5617, [2019]5655).
Conflict of interest
BR was employed by company Eurofins Lancaster Laboratories Professional Scientific Services.
The remaining authors declare that the research was conducted in the absence of any commercial or financial relationships that could be construed as a potential conflict of interest.
Publisher’s note
All claims expressed in this article are solely those of the authors and do not necessarily represent those of their affiliated organizations, or those of the publisher, the editors and the reviewers. Any product that may be evaluated in this article, or claim that may be made by its manufacturer, is not guaranteed or endorsed by the publisher.
References
Abate, A., Hillen, R. C., and Wahl, S. A. (2012). Piecewise affine approximations of fluxes and enzyme kinetics from in vivo 13C labeling experiments. Int. J. Robust Nonlinear. Control 22, 1120–1139.
Achreja, A., Zhao, H., Yang, L., Yun, T. H., Marini, J., and Nagrath, D. (2017). Exo-MFA - A 13C metabolic flux analysis framework to dissect tumor microenvironment-secreted exosome contributions towards cancer cell metabolism. Metab. Eng. 43, 156–172. doi: 10.1016/j.ymben.2017.01.001
Alger, J. R., Minhajuddin, A., Dean Sherry, A., and Malloy, C. R. (2021). Analysis of steady-state carbon tracer experiments using akaike information criteria. Metabolomics 17:61. doi: 10.1007/s11306-021-01807-1
Antoniewicz, M. R. (2015). Methods and advances in metabolic flux analysis: A mini-review. J. Ind. Microbiol. Biotechnol. 42, 317–325. doi: 10.1007/s10295-015-1585-x
Antoniewicz, M. R., Kelleher, J. K., and Stephanopoulos, G. (2006). Determination of confidence intervals of metabolic fluxes estimated from stable isotope measurements. Metab. Eng. 8, 324–337.
Antoniewicz, M. R., Kelleher, J. K., and Stephanopoulos, G. (2007). Elementary metabolite units (EMU): A novel framework for modeling isotopic distributions. Metab. Eng. 9, 68–86. doi: 10.1016/j.ymben.2006.09.001
Becker, J., and Wittmann, C. (2018). From systems biology to metabolically engineered cells-an omics perspective on the development of industrial microbes. Curr. Opin. Microbiol. 45, 180–188. doi: 10.1016/j.mib.2018.06.001
Blank, L. M., Kuepfer, L., and Sauer, U. (2005). Large-scale 13C-flux analysis reveals mechanistic principles of metabolic network robustness to null mutations in yeast. Genome Biol. 6:R49. doi: 10.1186/gb-2005-6-6-r49
Boisseau, R., Charrier, B., Massou, S., Portais, J. C., Akoka, S., and Giraudeau, P. (2013). Fast spatially encoded 3D NMR strategies for (13)C-based metabolic flux analysis. Anal. Chem. 85, 9751–9757. doi: 10.1021/ac402155w
Carey, L. M., Clark, T. J., Deshpande, R. R., Cocuron, J. C., Rustad, E. K., and Shachar-Hill, Y. (2020). High Flux Through the Oxidative Pentose Phosphate Pathway Lowers Efficiency in Developing Camelina Seeds. Plant Physiol. 182, 493–506. doi: 10.1104/pp.19.00740
Carvalho, R. A., Jeffrey, F. M., Sherry, A. D., and Malloy, C. R. (1998). C isotopomer analysis of glutamate by heteronuclear multiple quantum coherence-total correlation spectroscopy (HMQC-TOCSY). FEBS Lett. 440, 382–386. doi: 10.1016/s0014-5793(98)01491-4
Cheah, Y. E., Xu, Y., Sacco, S. A., Babele, P. K., Zheng, A. O., Johnson, C. H., et al. (2020). Systematic identification and elimination of flux bottlenecks in the aldehyde production pathway of Synechococcus elongatus PCC 7942. Metab. Eng. 60, 56–65. doi: 10.1016/j.ymben.2020.03.007
Cheah, Y. E., and Young, J. D. (2018). Isotopically nonstationary metabolic flux analysis (INST-MFA): Putting theory into practice. Curr. Opin. Biotechnol. 54, 80–87. doi: 10.1016/j.copbio.2018.02.013
Chen, J., Zheng, H., Liu, H., Niu, J., Liu, J., Shen, T., et al. (2007). Improving metabolic flux estimation via evolutionary optimization for convex solution space. Bioinformatics 23, 1115–1123. doi: 10.1093/bioinformatics/btm050
Cobbold, S. A., Frasse, P., Mchugh, E., Karnthaler, M., Creek, D. J., Odom John, A., et al. (2021). Non-canonical metabolic pathways in the malaria parasite detected by isotope-tracing metabolomics. Mol. Syst. Biol. 17:e10023. doi: 10.15252/msb.202010023
Cocuron, J. C., Koubaa, M., Kimmelfield, R., Ross, Z., and Alonso, A. P. (2019). A Combined Metabolomics and Fluxomics Analysis Identifies Steps Limiting Oil Synthesis in Maize Embryos. Plant Physiol. 181, 961–975. doi: 10.1104/pp.19.00920
Croyal, M., Bourgeois, R., Ouguerram, K., Billon-Crossouard, S., Aguesse, A., Nguyen, P., et al. (2016). Comparison of gas chromatography-mass spectrometry and gas chromatography-combustion-isotope ratio mass spectrometry analysis for in vivo estimates of metabolic fluxes. Anal. Biochem. 500, 63–65. doi: 10.1016/j.ab.2016.02.005
Dauner, M., and Sauer, U. (2000). GC-MS analysis of amino acids rapidly provides rich information for isotopomer balancing. Biotechnol. Prog. 16, 642–649. doi: 10.1021/bp000058h
Deja, S., Fu, X., Fletcher, J. A., Kucejova, B., Browning, J. D., Young, J. D., et al. (2020). Simultaneous tracers and a unified model of positional and mass isotopomers for quantification of metabolic flux in liver. Metab. Eng. 59, 1–14. doi: 10.1016/j.ymben.2019.12.005
Evers, B., Gerding, A., Boer, T., Heiner-Fokkema, M. R., Jalving, M., Wahl, S. A., et al. (2021). Simultaneous Quantification of the Concentration and Carbon Isotopologue Distribution of Polar Metabolites in a Single Analysis by Gas Chromatography and Mass Spectrometry. Anal. Chem. 93, 8248–8256. doi: 10.1021/acs.analchem.1c01040
Faubert, B., Li, K. Y., Cai, L., Hensley, C. T., Kim, J., Zacharias, L. G., et al. (2017). Lactate Metabolism in Human Lung Tumors. Cell 171:358-371.e9.
Foguet, C., Jayaraman, A., Marin, S., Selivanov, V. A., Moreno, P., Messeguer, R., et al. (2019). p13CMFA: Parsimonious 13C metabolic flux analysis. PLoS Comput. Biol. 15:e1007310. doi: 10.1371/journal.pcbi.1007310
Fu, Y., Yoon, J. M., Jarboe, L., and Shanks, J. V. (2015). Metabolic flux analysis of Escherichia coli MG1655 under octanoic acid (C8) stress. Appl. Microbiol. Biotechnol. 99, 4397–4408. doi: 10.1007/s00253-015-6387-6
Gebreselassie, N. A., and Antoniewicz, M. R. (2015). (13)C-metabolic flux analysis of co-cultures: A novel approach. Metab. Eng. 31, 132–139. doi: 10.1016/j.ymben.2015.07.005
Gebril, H. M., Avula, B., Wang, Y. H., Khan, I. A., and Jekabsons, M. B. (2016). (13)C metabolic flux analysis in neurons utilizing a model that accounts for hexose phosphate recycling within the pentose phosphate pathway. Neurochem. Int. 93, 26–39. doi: 10.1016/j.neuint.2015.12.008
Gopalakrishnan, S., Pakrasi, H. B., and Maranas, C. D. (2018). Elucidation of photoautotrophic carbon flux topology in Synechocystis PCC 6803 using genome-scale carbon mapping models. Metab. Eng. 47, 190–199. doi: 10.1016/j.ymben.2018.03.008
Gorka, S., Dietrich, M., Mayerhofer, W., Gabriel, R., Wiesenbauer, J., Martin, V., et al. (2019). Rapid Transfer of Plant Photosynthates to Soil Bacteria via Ectomycorrhizal Hyphae and Its Interaction With Nitrogen Availability. Front. Microbiol. 10:168. doi: 10.3389/fmicb.2019.00168
Hackett, S. R., Zanotelli, V. R. T., Xu, W., Goya, J., Park, J. O., Perlman, D. H., et al. (2016). Systems-level analysis of mechanisms regulating yeast metabolic flux. Science 354, aaf2786.
Heise, R., Arrivault, S., Szecowka, M., Tohge, T., Nunes-Nesi, A., Stitt, M., et al. (2014). Flux profiling of photosynthetic carbon metabolism in intact plants. Nat. Protoc. 9, 1803–1824.
Hellerstein, M. K., and Neese, R. A. (1992). Mass isotopomer distribution analysis: A technique for measuring biosynthesis and turnover of polymers. Am. J. Physiol. 263:E988–E1001.
Hollinshead, W. D., He, L., and Tang, Y. J. (2019). 13C-Fingerprinting and Metabolic Flux Analysis of Bacterial Metabolisms. Methods Mol. Biol. 1927, 215–230. doi: 10.1007/978-1-4939-9142-6_15
Hörl, M., Schnidder, J., Sauer, U., and Zamboni, N. (2013). Non-stationary (13)C-metabolic flux ratio analysis. Biotechnol Bioeng 110, 3164–3176. doi: 10.1002/bit.25004
Hui, S., Cowan, A. J., Zeng, X., Yang, L., Teslaa, T., Li, X., et al. (2020). Quantitative Fluxomics of Circulating Metabolites. Cell Metab. 32:676–688.e4.
Jang, C., Chen, L., and Rabinowitz, J. D. (2018). Metabolomics and Isotope Tracing. Cell 173, 822–837.
Jeffrey, F. M., Roach, J. S., Storey, C. J., Sherry, A. D., and Malloy, C. R. (2002). 13C isotopomer analysis of glutamate by tandem mass spectrometry. Anal. Biochem. 300, 192–205.
Jekabsons, M. B., Gebril, H., Wang, Y.-H., Avula, B., and Khan, I. A. (2017). Updates to a 13C metabolic flux analysis model for evaluating energy metabolism in cultured cerebellar granule neurons from neonatal rats. Neurochem. Int. 109, 54–67. doi: 10.1016/j.neuint.2017.03.020
Jeong, H., Yu, Y., Johansson, H. J., Schroeder, F. C., Lehtiö, J., and Vacanti, N. M. (2021). Correcting for Naturally Occurring Mass Isotopologue Abundances in Stable-Isotope Tracing Experiments with PolyMID. Metabolites 11:310. doi: 10.3390/metabo11050310
Jung, J. Y., and Oh, M. K. (2015). Isotope labeling pattern study of central carbon metabolites using GC/MS. J. Chromatogr. B. Analyt. Technol. Biomed. Life Sci. 974, 101–108.
Kadirkamanathan, V., Yang, J., Billings, S. A., and Wright, P. C. (2006). Markov Chain Monte Carlo Algorithm based metabolic flux distribution analysis on Corynebacterium glutamicum. Bioinformatics 22, 2681–2687. doi: 10.1093/bioinformatics/btl445
Kappelmann, J., Klein, B., Geilenkirchen, P., and Noack, S. (2017). Comprehensive and accurate tracking of carbon origin of LC-tandem mass spectrometry collisional fragments for (13)C-MFA. Anal. Bioanal. Chem. 409, 2309–2326. doi: 10.1007/s00216-016-0174-9
Kogadeeva, M., and Zamboni, N. (2016). SUMOFLUX: A Generalized Method for Targeted 13C Metabolic Flux Ratio Analysis. PLoS Comput. Biol. 12:e1005109. doi: 10.1371/journal.pcbi.1005109
Lane, D., Skinner, T. E., Gershenzon, N. I., Bermel, W., Soong, R., Dutta Majumdar, R., et al. (2019). Assessing the potential of quantitative 2D HSQC NMR in (13)C enriched living organisms. J. Biomol. NMR 73, 31–42. doi: 10.1007/s10858-018-0221-2
Lanz, B., Gruetter, R., and Duarte, J. M. (2013). Metabolic Flux and Compartmentation Analysis in the Brain In vivo. Front. Endocrinol. 4:156. doi: 10.3389/fendo.2013.00156
Lawson, C. E., Nuijten, G. H. L., De Graaf, R. M., Jacobson, T. B., Pabst, M., Stevenson, D. M., et al. (2021). Autotrophic and mixotrophic metabolism of an anammox bacterium revealed by in vivo (13)C and (2)H metabolic network mapping. Isme. J. 15, 673–687. doi: 10.1038/s41396-020-00805-w
Lee, S., Wen, H., An, Y. J., Cha, J. W., Ko, Y. J., Hyberts, S. G., et al. (2017). Carbon Isotopomer Analysis with Non-Unifom Sampling HSQC NMR for Cell Extract and Live Cell Metabolomics Studies. Anal. Chem. 89, 1078–1085. doi: 10.1021/acs.analchem.6b02107
Lee, W. D., Mukha, D., Aizenshtein, E., and Shlomi, T. (2019). Spatial-fluxomics provides a subcellular-compartmentalized view of reductive glutamine metabolism in cancer cells. Nat. Commun. 10:1351. doi: 10.1038/s41467-019-09352-1
Leighty, R. W., and Antoniewicz, M. R. (2013). COMPLETE-MFA: Complementary parallel labeling experiments technique for metabolic flux analysis. Metab. Eng. 20, 49–55.
Liang, L., Sun, F., Wang, H., and Hu, Z. (2021). Metabolomics, metabolic flux analysis and cancer pharmacology. Pharmacol. Ther. 224:107827.
Liu, S., Dai, Z., Cooper, D. E., Kirsch, D. G., and Locasale, J. W. (2020). Quantitative Analysis of the Physiological Contributions of Glucose to the TCA Cycle. Cell Metab. 32:619–628.e21. doi: 10.1016/j.cmet.2020.09.005
Ma, F., Jazmin, L. J., Young, J. D., and Allen, D. K. (2014). Isotopically nonstationary 13C flux analysis of changes in Arabidopsis thaliana leaf metabolism due to high light acclimation. Proc. Natl. Acad. Sci. U.S.A.111, 16967–16972. doi: 10.1073/pnas.1319485111
Ma, X., Wang, L., Huang, D., Li, Y., Yang, D., Li, T., et al. (2017). Polo-like kinase 1 coordinates biosynthesis during cell cycle progression by directly activating pentose phosphate pathway. Nat. Commun. 8:1506. doi: 10.1038/s41467-017-01647-5
Mairinger, T., Steiger, M., Nocon, J., Mattanovich, D., Koellensperger, G., and Hann, S. (2015). Gas Chromatography-Quadrupole Time-of-Flight Mass Spectrometry-Based Determination of Isotopologue and Tandem Mass Isotopomer Fractions of Primary Metabolites for (13)C-Metabolic Flux Analysis. Anal. Chem. 87, 11792–11802. doi: 10.1021/acs.analchem.5b03173
Martín, H. G., Kumar, V. S., Weaver, D., Ghosh, A., Chubukov, V., Mukhopadhyay, A., et al. (2015). A Method to Constrain Genome-Scale Models with 13C Labeling Data. PLoS Comput. Biol. 11:e1004363. doi: 10.1371/journal.pcbi.1004363
Mei, X., Guo, Y., Xie, Z., Zhong, Y., Wu, X., Xu, D., et al. (2021). RIPK1 regulates starvation resistance by modulating aspartate catabolism. Nat. Commun. 12:6144. doi: 10.1038/s41467-021-26423-4
Millard, P., Schmitt, U., Kiefer, P., Vorholt, J. A., Heux, S., and Portais, J. C. (2020). ScalaFlux: A scalable approach to quantify fluxes in metabolic subnetworks. PLoS Comput. Biol. 16:e1007799. doi: 10.1371/journal.pcbi.1007799
Nanchen, A., Fuhrer, T., and Sauer, U. (2007). Determination of metabolic flux ratios from 13C-experiments and gas chromatography-mass spectrometry data: Protocol and principles. Methods Mol. Biol. 358, 177–197. doi: 10.1007/978-1-59745-244-1_11
Neinast, M. D., Jang, C., Hui, S., Murashige, D. S., Chu, Q., Morscher, R. J., et al. (2019). Quantitative Analysis of the Whole-Body Metabolic Fate of Branched-Chain Amino Acids. Cell Metab. 29:417–429.e4. doi: 10.1016/j.cmet.2018.10.013
Niedenführ, S., Wiechert, W., and Nöh, K. (2015). How to measure metabolic fluxes: A taxonomic guide for (13)C fluxomics. Curr. Opin. Biotechnol. 34, 82–90. doi: 10.1016/j.copbio.2014.12.003
Okahashi, N., Kawana, S., Iida, J., Shimizu, H., and Matsuda, F. (2016). GC-MS/MS survey of collision-induced dissociation of tert-butyldimethylsilyl-derivatized amino acids and its application to (13)C-metabolic flux analysis of Escherichia coli central metabolism. Anal. Bioanal. Chem. 408, 6133–6140. doi: 10.1007/s00216-016-9724-4
Okahashi, N., Matsuda, F., Yoshikawa, K., Shirai, T., Matsumoto, Y., Wada, M., et al. (2017). Metabolic engineering of isopropyl alcohol-producing Escherichia coli strains with (13) C-metabolic flux analysis. Biotechnol. Bioeng 114, 2782–2793. doi: 10.1002/bit.26390
O’sullivan, D., Sanin, D. E., Pearce, E. J., and Pearce, E. L. (2019). Metabolic interventions in the immune response to cancer. Nat. Rev. Immunol. 19, 324–335.
Park, J. O., Rubin, S. A., Xu, Y. F., Amador-Noguez, D., Fan, J., Shlomi, T., et al. (2016). Metabolite concentrations, fluxes and free energies imply efficient enzyme usage. Nat. Chem. Biol. 12, 482–489. doi: 10.1038/nchembio.2077
Patel, A., Veeraiah, P., Shameem, M., Kumar, J., and Saba, K. (2021). Impaired GABAergic and glutamatergic neurometabolic activity in aged mice brain as measured by 1 H-[13 C]-NMR spectroscopy. FASEB J 35:e21321. doi: 10.1096/fj.202001704RR
Quek, L.-E., Krycer, J. R., Ohno, S., Yugi, K., Fazakerley, D. J., Scalzo, R., et al. (2020). Dynamic 13C flux analysis captures the reorganization of adipocyte glucose metabolism in response to insulin. Iscience 23:100855.
Rahim, M., Ragavan, M., Deja, S., Merritt, M. E., Burgess, S. C., and Young, J. D. (2022). INCA 2.0: A tool for integrated, dynamic modeling of NMR- and MS-based isotopomer measurements and rigorous metabolic flux analysis. Metab. Eng. 69, 275–285. doi: 10.1016/j.ymben.2021.12.009
Rantanen, A., Rousu, J., Jouhten, P., Zamboni, N., Maaheimo, H., and Ukkonen, E. (2008). An analytic and systematic framework for estimating metabolic flux ratios from 13C tracer experiments. BMC Bioinformatics 9:266. doi: 10.1186/1471-2105-9-266
Reardon, P. N., Marean-Reardon, C. L., Bukovec, M. A., Coggins, B. E., and Isern, N. G. (2016). 3D TOCSY-HSQC NMR for Metabolic Flux Analysis Using Non-Uniform Sampling. Anal. Chem. 88, 2825–2831. doi: 10.1021/acs.analchem.5b04535
Rühl, M., Rupp, B., Nöh, K., Wiechert, W., Sauer, U., and Zamboni, N. (2012). Collisional fragmentation of central carbon metabolites in LC-MS/MS increases precision of 13C metabolic flux analysis. Biotechnol. Bioeng 109, 763–771. doi: 10.1002/bit.24344
Sá, J. V., Kleiderman, S., Brito, C., Sonnewald, U., Leist, M., Teixeira, A. P., et al. (2017). Quantification of Metabolic Rearrangements During Neural Stem Cells Differentiation into Astrocytes by Metabolic Flux Analysis. Neurochem. Res. 42, 244–253. doi: 10.1007/s11064-016-1907-z
Saldida, J., Muntoni, A. P., De Martino, D., Hubmann, G., Niebel, B., Schmidt, A. M., et al. (2020). Unbiased metabolic flux inference through combined thermodynamic and 13C flux analysis. bioRxiv. [preprint]. doi: 10.1101/2020.06.29.177063
Sauer, U., Lasko, D. R., Fiaux, J., Hochuli, M., Glaser, R., Szyperski, T., et al. (1999). Metabolic flux ratio analysis of genetic and environmental modulations of Escherichia coli central carbon metabolism. J. Bacteriol. 181, 6679–6688. doi: 10.1128/JB.181.21.6679-6688.1999
Schlame, M., Xu, Y., Erdjument-Bromage, H., Neubert, T. A., and Ren, M. (2020). Lipidome-wide (13)C flux analysis: A novel tool to estimate the turnover of lipids in organisms and cultures. J. Lipid. Res. 61, 95–104. doi: 10.1194/jlr.D119000318
Schmidt, K., Carlsen, M., Nielsen, J., and Villadsen, J. (1997). Modeling isotopomer distributions in biochemical networks using isotopomer mapping matrices. Biotechnol. Bioeng. 55, 831–840.
Schwechheimer, S. K., Becker, J., Peyriga, L., Portais, J. C., and Wittmann, C. (2018). Metabolic flux analysis in Ashbya gossypii using (13)C-labeled yeast extract: Industrial riboflavin production under complex nutrient conditions. Microb. Cell Fact. 17:162. doi: 10.1186/s12934-018-1003-y
Shen, T., Rui, B., Zhou, H., Zhang, X., Yi, Y., Wen, H., et al. (2013). Metabolic flux ratio analysis and multi-objective optimization revealed a globally conserved and coordinated metabolic response of E. coli to paraquat-induced oxidative stress. Mol. Biosyst. 9, 121–132. doi: 10.1039/c2mb25285f
Szecowka, M., Heise, R., Tohge, T., Nunes-Nesi, A., Vosloh, D., Huege, J., et al. (2013). Metabolic fluxes in an illuminated Arabidopsis rosette. Plant Cell 25, 694–714. doi: 10.1105/tpc.112.106989
Szyperski, T. (1995). Biosynthetically directed fractional 13C-labeling of proteinogenic amino acids. An efficient analytical tool to investigate intermediary metabolism. Eur. J. Biochem. 232, 433–448. doi: 10.1111/j.1432-1033.1995.tb20829.x
Theorell, A., Leweke, S., Wiechert, W., and Nöh, K. (2017). To be certain about the uncertainty: Bayesian statistics for (13) C metabolic flux analysis. Biotechnol. Bioeng. 114, 2668–2684. doi: 10.1002/bit.26379
Theorell, A., and Nöh, K. (2020). Reversible jump MCMC for multi-model inference in Metabolic Flux Analysis. Bioinformatics 36, 232–240. doi: 10.1093/bioinformatics/btz500
Toya, Y., Ishii, N., Hirasawa, T., Naba, M., Hirai, K., Sugawara, K., et al. (2007). Direct measurement of isotopomer of intracellular metabolites using capillary electrophoresis time-of-flight mass spectrometry for efficient metabolic flux analysis. J. Chromatogr. A. 1159, 134–141. doi: 10.1016/j.chroma.2007.04.011
Van Gastel, N., and Carmeliet, G. (2021). Metabolic regulation of skeletal cell fate and function in physiology and disease. Nat. Metab. 3, 11–20.
Van Heerden, J. H., Wortel, M. T., Bruggeman, F. J., Heijnen, J. J., Bollen, Y. J., Planqué, R., et al. (2014). Lost in transition: Start-up of glycolysis yields subpopulations of nongrowing cells. Science 343:1245114. doi: 10.1126/science.1245114
Van Winden, W. A., Heijnen, J. J., and Verheijen, P. J. (2002). Cumulative bondomers: A new concept in flux analysis from 2D [13C,1H] COSY NMR data. Biotechnol. Bioeng 80, 731–745. doi: 10.1002/bit.10429
Varanasi, S. K., Ma, S., and Kaech, S. M. (2019). T Cell Metabolism in a State of Flux. Immunity 51, 783–785. doi: 10.1016/j.immuni.2019.10.012
Vinaixa, M., Rodríguez, M. A., Aivio, S., Capellades, J., Gómez, J., Canyellas, N., et al. (2017). Positional Enrichment by Proton Analysis (PEPA): A One-Dimensional (1) H-NMR Approach for (13) C Stable Isotope Tracer Studies in Metabolomics. Angew. Chem. Int. Ed. Engl. 56, 3531–3535. doi: 10.1002/anie.201611347
Wahl, S. A., Nöh, K., and Wiechert, W. (2008). 13C labeling experiments at metabolic nonstationary conditions: An exploratory study. BMC Bioinformatics 9:152. doi: 10.1186/1471-2105-9-152
Wang, Y., Nasiri, A. R., Damsky, W. E., Perry, C. J., Zhang, X. M., Rabin-Court, A., et al. (2018). Uncoupling Hepatic Oxidative Phosphorylation Reduces Tumor Growth in Two Murine Models of Colon Cancer. Cell Rep. 24, 47–55. doi: 10.1016/j.celrep.2018.06.008
Wang, Y., Wondisford, F., Song, C., Zhang, T., and Su, X. (2020). Metabolic Flux Analysis-Linking Isotope Labeling and Metabolic Fluxes. Metabolites 10:447. doi: 10.3390/metabo10110447
Watts, M. E., Pocock, R., and Claudianos, C. (2018). Brain Energy and Oxygen Metabolism: Emerging Role in Normal Function and Disease. Front. Mol. Neurosci. 11:216. doi: 10.3389/fnmol.2018.00216
Weitzel, M., Nöh, K., Dalman, T., Niedenführ, S., Stute, B., and Wiechert, W. (2013). 13CFLUX2—high-performance software suite for 13C-metabolic flux analysis. Bioinformatics 29, 143–145. doi: 10.1093/bioinformatics/bts646
Weitzel, M., Wiechert, W., and Nöh, K. (2007). The topology of metabolic isotope labeling networks. BMC Bioinformatics 8:315. doi: 10.1186/1471-2105-8-315
Wiechert, W., and De Graaf, A. A. (1997). Bidirectional reaction steps in metabolic networks: I. Modeling and simulation of carbon isotope labeling experiments. Biotechnol. Bioeng. 55, 101–117.
Wiechert, W., and Nöh, K. (2005). From stationary to instationary metabolic flux analysis. Adv. Biochem. Eng. Biotechnol. 92, 145–172.
Wiechert, W., Siefke, C., De Graaf, A. A., and Marx, A. (1997). Bidirectional reaction steps in metabolic networks: II. Flux estimation and statistical analysis. Biotechnol. Bioeng. 55, 118–135. doi: 10.1002/(SICI)1097-0290(19970705)55:1<118::AID-BIT13>3.0.CO;2-I
Williams, H. C., Farmer, B. C., Piron, M. A., Walsh, A. E., Bruntz, R. C., Gentry, M. S., et al. (2020). APOE alters glucose flux through central carbon pathways in astrocytes. Neurobiol. Dis. 136:104742. doi: 10.1016/j.nbd.2020.104742
Wittmann, C., and Heinzle, E. (2002). Genealogy profiling through strain improvement by using metabolic network analysis: Metabolic flux genealogy of several generations of lysine-producing corynebacteria. Appl. Environ. Microbiol. 68, 5843–5859. doi: 10.1128/AEM.68.12.5843-5859.2002
Wong, M., Xu, G., Barboza, M., Maezawa, I., Jin, L. W., Zivkovic, A., et al. (2020). Metabolic flux analysis of the neural cell glycocalyx reveals differential utilization of monosaccharides. Glycobiology 30, 859–871. doi: 10.1093/glycob/cwaa038
Yam, M., Engel, A. L., Wang, Y., Zhu, S., Hauer, A., Zhang, R., et al. (2019). Proline mediates metabolic communication between retinal pigment epithelial cells and the retina. J. Biol. Chem. 294, 10278–10289. doi: 10.1074/jbc.RA119.007983
Yang, J., Wongsa, S., Kadirkamanathan, V., Billings, S. A., and Wright, P. C. (2007). Metabolic flux estimation–a self-adaptive evolutionary algorithm with singular value decomposition. IEEE/ACM Trans. Comput. Biol. Bioinform. 4, 126–138. doi: 10.1109/TCBB.2007.1032
Yang, T. H., Frick, O., and Heinzle, E. (2008). Hybrid optimization for 13C metabolic flux analysis using systems parametrized by compactification. BMC Syst. Biol. 2:29. doi: 10.1186/1752-0509-2-29
Young, J. D. (2014). INCA: A computational platform for isotopically non-stationary metabolic flux analysis. Bioinformatics 30, 1333–1335. doi: 10.1093/bioinformatics/btu015
Young, J. D., Walther, J. L., Antoniewicz, M. R., Yoo, H., and Stephanopoulos, G. (2008). An elementary metabolite unit (EMU) based method of isotopically nonstationary flux analysis. Biotechnol. Bioeng. 99, 686–699. doi: 10.1002/bit.21632
Yuan, J., Bennett, B. D., and Rabinowitz, J. D. (2008). Kinetic flux profiling for quantitation of cellular metabolic fluxes. Nat. Protoc. 3, 1328–1340.
Yuan, Y., Yang, T. H., and Heinzle, E. (2010). 13C metabolic flux analysis for larger scale cultivation using gas chromatography-combustion-isotope ratio mass spectrometry. Metab. Eng. 12, 392–400. doi: 10.1016/j.ymben.2010.02.001
Zamboni, N. (2011). 13C metabolic flux analysis in complex systems. Curr. Opin. Biotechnol. 22, 103–108.
Zamboni, N., Saghatelian, A., and Patti, G. J. (2015). Defining the metabolome: Size, flux, and regulation. Mol. Cell 58, 699–706.
Zhang, H., Liu, Y., Nie, X., Liu, L., Hua, Q., Zhao, G. P., et al. (2018). The cyanobacterial ornithine-ammonia cycle involves an arginine dihydrolase. Nat. Chem. Biol. 14, 575–581. doi: 10.1038/s41589-018-0038-z
Zhang, Z., Liu, Z., Meng, Y., Chen, Z., Han, J., Wei, Y., et al. (2020). Parallel isotope differential modeling for instationary 13C fluxomics at the genome scale. Biotechnol. Biofuels 13, 103. doi: 10.1186/s13068-020-01737-5
Keywords: metabolic flux analysis, isotope labeling model, 13C fluxomics, isotope tracing, neural cell
Citation: Tian B, Chen M, Liu L, Rui B, Deng Z, Zhang Z and Shen T (2022) 13C metabolic flux analysis: Classification and characterization from the perspective of mathematical modeling and application in physiological research of neural cell. Front. Mol. Neurosci. 15:883466. doi: 10.3389/fnmol.2022.883466
Received: 01 March 2022; Accepted: 15 August 2022;
Published: 08 September 2022.
Edited by:
Weihua Guo, Virginia Tech, United StatesReviewed by:
Fumio Matsuda, Osaka University, JapanAbhishek Singh, Independent Researcher, New Delhi, India
Copyright © 2022 Tian, Chen, Liu, Rui, Deng, Zhang and Shen. This is an open-access article distributed under the terms of the Creative Commons Attribution License (CC BY). The use, distribution or reproduction in other forums is permitted, provided the original author(s) and the copyright owner(s) are credited and that the original publication in this journal is cited, in accordance with accepted academic practice. No use, distribution or reproduction is permitted which does not comply with these terms.
*Correspondence: Zhengdong Zhang, c3gwMDQxQGd5dS5jbg==; Tie Shen, c2hlbnRpZUBnem51LmVkdS5jbg==
†These authors have contributed equally to this work