 Kevin P. Koster1*†
 Zach Fyke1
 Thu T. A. Nguyen2Amanda Niqula1Lorena Y. Noriega-González1Kevin M. Woolfrey3
 Mark L. Dell’Acqua3
 Stephanie M. Cologna2
 Akira Yoshii1,4,5
- 1Department of Anatomy and Cell Biology, University of Illinois at Chicago, Chicago, IL, United States
- 2Department of Chemistry, University of Illinois at Chicago, Chicago, IL, United States
- 3Department of Pharmacology, University of Colorado School of Medicine, Aurora, CO, United States
- 4Department of Pediatrics, University of Illinois at Chicago, Chicago, IL, United States
- 5Department of Neurology, University of Illinois at Chicago, Chicago, IL, United States
Palmitoylation and depalmitoylation represent dichotomic processes by which a labile posttranslational lipid modification regulates protein trafficking and degradation. The depalmitoylating enzyme, palmitoyl-protein thioesterase 1 (PPT1), is associated with the devastating pediatric neurodegenerative condition, infantile neuronal ceroid lipofuscinosis (CLN1). CLN1 is characterized by the accumulation of autofluorescent lysosomal storage material (AFSM) in neurons and robust neuroinflammation. Converging lines of evidence suggest that in addition to cellular waste accumulation, the symptomology of CLN1 corresponds with disruption of synaptic processes. Indeed, loss of Ppt1 function in cortical neurons dysregulates the synaptic incorporation of the GluA1 AMPA receptor (AMPAR) subunit during a type of synaptic plasticity called synaptic scaling. However, the mechanisms causing this aberration are unknown. Here, we used the Ppt1−/− mouse model (both sexes) to further investigate how Ppt1 regulates synaptic plasticity and how its disruption affects downstream signaling pathways. To this end, we performed a palmitoyl-proteomic screen, which provoked the discovery that Akap5 is excessively palmitoylated at Ppt1−/− synapses. Extending our previous data, in vivo induction of synaptic scaling, which is regulated by Akap5, caused an excessive upregulation of GluA1 in Ppt1−/− mice. This synaptic change was associated with exacerbated disease pathology. Furthermore, the Akap5- and inflammation-associated transcriptional regulator, nuclear factor of activated T cells (NFAT), was sensitized in Ppt1−/− cortical neurons. Suppressing the upstream regulator of NFAT activation, calcineurin, with the FDA-approved therapeutic FK506 (Tacrolimus) modestly improved neuroinflammation in Ppt1−/− mice. These findings indicate that the absence of depalmitoylation stifles synaptic protein trafficking and contributes to neuroinflammation via an Akap5-associated mechanism.
1 Introduction
Proteostasis is a fundamental molecular mechanism whereby quality, quantity, and distribution of proteins are rigorously controlled through synthesis, trafficking, and degradation (Labbadia and Morimoto, 2014; Winckler et al., 2018; Liang, 2019). Lysosomal digestion is one of several mechanisms responsible for protein degradation (Nandi et al., 2006; Walter and Ron, 2011; Cao and Kaufman, 2012; Nixon, 2013; Xu and Ren, 2015; Lie and Nixon, 2018), playing a critical role in the breakdown of lipid-modified proteins, such as palmitoylated proteins.
Protein palmitoylation is a reversible posttranslational lipid modification that impacts most, if not all, aspects of proteostasis (Washbourne, 2004; Fukata and Fukata, 2010; Levental et al., 2010). Intriguingly, palmitoylation is particularly prevalent among synaptic proteins (Sanders et al., 2015), including synaptic scaffolds and neurotransmitter receptor subunits (Fukata and Fukata, 2010). Palmitoylation is conducted by a class of over 20 enzymes called protein acyltransferases (PATs) (Fukata et al., 2004; Noritake et al., 2009; Woolfrey et al., 2015; Tabaczar et al., 2017). Conversely, depalmitoylation is performed by a restricted group of enzymes that includes palmitoyl-protein thioesterase 1 (PPT1) (Won et al., 2018).
PPT1 is considered an endo-lysosomal enzyme, though it also has putative substrates within the synaptic cytosol (Camp et al., 1994; Koster and Yoshii, 2019; Gorenberg et al., 2022) and can depalmitoylate proteins extracellularly, in the synaptic cleft, for instance (Gorenberg et al., 2022). Therefore, PPT1 can influence the trafficking and degradation of many proteins across multiple cellular compartments. Accordingly, mutations in the gene encoding PPT1, CLN1, cause infantile neuronal ceroid lipofuscinosis (CLN1), a fatal pediatric neurodegenerative disease that presents with sensory loss, motor regression, and seizure (Vesa et al., 1995; Haltia, 2003; Nita et al., 2016). While histopathological hallmarks of CLN1 include the robust accumulation of autofluorescent lysosomal storage material (AFSM) and gliosis (Nita et al., 2016), accumulating evidence suggests a role for PPT1 in the regulation of synaptic protein function (Finn et al., 2012; Koster et al., 2019, 2023; Sapir et al., 2019; Gorenberg et al., 2022).
Our recent study (Koster et al., 2023) demonstrated that PPT1-mediated depalmitoylation regulates a form of synaptic plasticity termed synaptic scaling (O’Brien et al., 1998; Turrigiano et al., 1998). Specifically, loss of Ppt1 causes an excessive upregulation of GluA1 during synaptic upscaling in cortical neurons (Koster et al., 2023). However, the mechanisms by which loss of PPT1 affects synaptic AMPAR trafficking remain incompletely understood. Additionally, it is unclear how abnormal neurotransmission translates into more proximal pathogenic features of CLN1, like neuroinflammation and neuronal death.
Therefore, the goal of the current study was to investigate the link between the disrupted function of AMPARs and the downstream consequences contributing to the pathogenesis of CLN1. An unbiased palmitoyl-proteomic screen using the Ppt1−/− mouse model revealed that Ppt1 can regulate the proteostasis of AMPARs not only by affecting the GluA1 palmitoylation state (Koster et al., 2023), but also the palmitoylation state of the AMPAR-associated molecule, Akap5. Furthermore, we provide a mechanistic link between aberrant synaptic plasticity and neuroinflammation through an Akap5-associated pathway in CLN1. Finally, we demonstrate that pharmacologically targeting this pathway slightly ameliorates neuroinflammation in Ppt1−/− mice.
2 Materials and methods
2.1 Animals, group allocation, and data handling
All animal procedures were performed in accordance with the guidelines of the University of Illinois at Chicago Institutional Animal Care and Use Committee. Ppt1+/− (heterozygous) mice were maintained on 12-h light/dark cycle with food and water ad libitum and bred to generate Ppt1−/− (CLN1), Ppt1+/−, and Ppt1+/+ (wild-type, WT) animals (Gupta et al., 2001). Animals of both sexes were allocated to groups based on their genotype (i.e., WT or Ppt1−/−), without specific regard to equally balancing the number of males or females across groups. Therefore, males and females were used in roughly equal proportion. Imaging data were acquired randomly (no criteria were used for selecting cells, view fields, etc. except where anatomically necessary). All data were acquired and maintained without descriptive naming/labeling to ease randomization. Severe seizure, defined as an animal suffering from either prolonged (3–5 min) epileptic episodes or a failure to recover normal locomotor activity from such episodes, was considered as a humane endpoint criterion and prompted euthanasia but was not systematically quantified.
2.2 Brain fractionation, biochemical assays from tissue samples, and immunoblotting
WT and Ppt1−/− brains were collected as previously (Koster et al., 2019, 2023). For biochemical analysis of total protein content, isolated visual cortices from Ppt1−/− and WT animals were homogenized in ice-cold synaptosome buffer (320 mM sucrose, 1 mM EDTA, 4 mM HEPES, pH 7.4) containing 1× protease inhibitor cocktail (Roche), 1× phosphatase inhibitor cocktail (Roche), and 1 mM PMSF using 30 strokes in a Dounce homogenizer. Aliquots of lysates were stored at −80°C, and the remaining sample was used for synaptosome preparation, which was performed as follows: whole lysates were centrifuged at 1000 × g to remove cellular debris, after which supernatant was centrifuged at 12,000 × g for 15 min to generate pellet P2. The P2 pellet was resuspended in synaptosome buffer and centrifuged at 18,000 × g for 15 min to produce the synaptosomal membrane fraction, LP1, referred to hereafter as synaptosomes.
For immunoblotting, the protein concentration of each sample was determined using BCA protein assay (Pierce). Samples were then brought to 20 μg total protein in 2× Laemmli buffer containing 10% β-mercaptoethanol (Bio-Rad), heated at 70°C for 10 min, and loaded into 4–20% precast gels (Bio-Rad) for electrophoresis (130 V, 1.5–2 h). Proteins were wet-transferred to PVDF membranes (Immobillon-P, Millipore), blocked in TBS, pH 7.4, containing 5% non-fat milk and 0.1% Tween-20 (TBS-T + 5% milk). Membranes were incubated in primary antibody solutions containing 2% BSA in TBS-T for 2 h at room temperature (RT) or overnight at 4°C. Primary antibodies were used according to Table 4. Membranes were then incubated with appropriate secondary, HRP-conjugated antibodies (Jackson ImmunoResearch) at either 1:1,000 or 1:5,000 for 1 h at RT before washing three times with TBS-T. Visualization and quantification were performed using the Pierce SuperSignal ECL substrate and Odyssey-FC chemiluminescent imaging station (LI-COR). Signal density for each synaptic protein was measured using the LI-COR software, Image Studio Lite (version 5.2), and normalized to the signal density for β-actin loading control for each lane. Two technical replicates for each experiment were averaged together to get one n.
Table 1. Statistics for Sholl measurements in Figure 4D.
Table 2. Statistics for multiple t-tests performed in Supplementary Figure 3C.
Table 3. Statistics for multiple t-tests performed in Figure 6D.
Table 4. Key resources table.
2.3 Transcardial perfusion and AFSM quantification
Wild-type and Ppt1−/− mice were anesthetized using isoflurane and transcardially perfused with ice-cold PBS (pH 7.4, ~30 mL/mouse), followed by 4% paraformaldehyde (PFA) in PBS (~15 mL/mouse). Brains were removed and post-fixed overnight at 4°C in 4% PFA and transferred to PBS, pH 7.4, containing 30% sucrose solution for 48 h prior to sectioning at either 50 or 100 μm in cold PBS using a Vibratome 1,000 (Technical Products International, St. Louis, MO). Serial sections were stored free floating in cryoprotectant solution (30% glycerol, 30% ethylene glycol in PBS) at −20°C until analysis of AFSM or immunohistochemistry was performed.
For AFSM analysis (as in Koster et al., 2019), 3–4 mid-sagittal sections were mounted on Superfrost Plus microscope slides (VWR) using Vectamount mounting media containing DAPI (Vector Laboratories). Images were acquired for at least two sections from each animal using a Zeiss LSM710 confocal laser scanning microscope at 40× magnification. DAPI signal was visualized using excitation at 405 nm, while AFSM was detected using 561 nm excitation. Although AFSM signal is detectable without any deliberate staining across a wide spectral range, we chose to quantify it in the red fluorescence range to allow for consistency across experiments where the green (488 nm) channel was occupied by immunostaining for another protein of interest (e.g., Iba1). All sections were imaged using identical capture conditions. Quantification of AFSM was performed by generating a binary mask of AFSM-positive pixels (i.e., fluorescent signal in the 561 nm channel) in FIJI. An identical threshold was applied to each image. Percent area occupied by AFSM puncta that satisfied the threshold was then calculated using the “analyze particles” tool in FIJI. This analysis was performed for 2–4 sections (a total of 10–20 images, as imaging an entire cortical column is typically five interlaced images) from each animal and averaged together to give a single value, representative of the total area occupied by AFSM in the cortical column imaged. Animal numbers are reported in the relevant figure legends.
2.4 Cortical thickness measurement
Low magnification (4×) images were acquired from 2 to 3 matched sections for all animals used for AFSM analysis using a Zeiss Axio Imager M1. Images were analyzed in Fiji by drawing an ROI perpendicular to the cortical surface that extended down to the start of the subcortical white matter, i.e., at the lowest bounding edge of cortical L6, where DAPI staining sharply disappears. ROI length was measured for three mid-sagittal sections from each animal corresponding to V1. These values were averaged to give the cortical thickness in mm.
2.5 Immunohistochemistry and microglial morphology analysis
For immunohistochemistry, 3–4 medial sections were first incubated in TBS for 10 min before undergoing permeabilization (TBS + 0.5% Triton X-100) for 30 min at RT. Next, samples underwent antigen retrieval by heating in tris-EDTA (pH 9.0) at 95°C for 30 min before being equilibrated to room temperature in Tris-EDTA solution for 40 min. Tissue was then blocked (TBS + 0.1% Triton X-100, 4% BSA, and 5% normal goat serum) for 2 h at RT before being incubated in rabbit anti-Iba1 (1:1,000, in TBS + 0.1% Triton X-100 + 2% BSA) for 48 h. After washing four times, 10 min each, tissue was incubated in Alexa Fluor 488 goat anti-rabbit (1:1,000; Thermo Fisher) overnight at RT. The tissue was then washed (4×, 10 min) and mounted as above.
Microglial images were acquired with a Zeiss LSM710 confocal microscope either at 10× (low magnification images) or 63× for Sholl analysis. 63× images were acquired as 30–60 plane Z-stacks (Z-interval = 2 μm) in random fashion (the only criterion is that at least one full microglia had to be centered in the stack) at the border of layers 2/3 and 4 in the visual cortex. 3–4 images were taken from two tissue sections for each animal. Images were analyzed using the Sholl analysis tool in Fiji by lab members blinded to the condition. Briefly, the image was collapsed into a maximum-intensity projection to ensure all microglia processes were captured, and individual microglia were outlined with a freehand ROI. The surrounding area was removed (“clear outside” function in Fiji), and the image was then thresholded to generate a mask of all microglia processes, and an ROI was created at the center of the cell soma. The mask containing one individual microglia was then skeletonized using the “skeletonize” plugin in Fiji. Sholl analysis was performed according to these parameters using the Fiji Sholl tool: start radius (from the center of cell soma ROI) = 5 μm, step size = 2 μm, end radius = 70 μm. The number of intersections at each 2 μm step was averaged for all microglia from each animal and counted as one n.
To analyze the number of microglia across age, genotype, and condition (LR vs. DR), the number of Iba1-positive cell bodies was counted manually in a 0.135 × 0.135 × 0.05 mm (width × length × depth) volume using the imaging parameters described above. Cell bodies straddling the top and right borders of the image were not counted, while those on the left and bottom borders were. The number of microglia in this view field was then extrapolated to estimate the number of microglia in a 1 mm3 volume.
2.6 Cholera toxin B subunit injection
Mice between P20 and P40 were anesthetized via isoflurane inhalation (4% induction, 1–1.5% maintenance) and placed in a stereotaxic frame (RWD Life Science Inc.). After expressing a small amount of vitreous from the eye, intravitreous injections of 2 μL fluorophore-conjugated CTB (1 mg/mL; 488 nm conjugate in the left eye, 555 nm conjugate in the right eye) were performed for each mouse. Following the injection, antibiotic ointment was applied to each eye, and the animals were allowed to recover in their home cage for 24 h before undergoing transcardial perfusion as detailed above. Sectioned brains (100 μm sequential coronal sections encompassing the entire dLGN) were then assessed for the quality of the injections by a blinded researcher, and only those brains with well-traced retinogeniculate projections were immunostained for Iba1. Matched sections were then imaged under high magnification at the border of converging retinal projections from both eyes in each dLGN using an LSM710 confocal microscope and compared for microglial morphology (Sholl analysis) as described above.
2.7 Acyl-biotin exchange (ABE) assay for palmitoyl-proteomics
WT and Ppt1−/− occipital cortices from animals aged to P42 were used for palmitoyl-proteomic analysis. Lysates and synaptosomes were collected as described above. The palmitoyl-proteomic protocol was then carried out according to Wan et al. (2007) with slight modifications. Before beginning the assay, a BCA assay was performed to start with equal (600 μg) protein content for each sample. Blocking (N-ethylmaleimide; NEM), hydroxylamine, and biotinylation (HPDP-biotin) steps were all performed as recommended in the protocol. The elution protocol was also followed (Wan et al., 2007), with the exception that instead of streptavidin resin, magnetic streptavidin-coated beads (Dynabeads™, Thermo Fisher) were used (100 μL beads/sample). The final eluent was frozen at −80°C and prepared for mass spectrometry (see below). Due to the small starting material (occipital cortex only), the whole procedure was scaled down into 2 mL tubes, including chloroform-methanol precipitations, which were carried out with the following volumes: 150 μL sample, 600 μL methanol, 150 μL chloroform, and 450 μL water. This limited protein loss was evident in trial runs using 15 mL conical tubes.
2.8 Mass spectrometry
Eluents from the ABE assay were dried for approximately 30 min and digested using the S-trap Micro Spin Column Digestion Protocol (Protifi, Huntington, NY) with minor changes. Briefly, 30 μL of 10% sodium dodecyl sulfate (SDS) and 100 mM triethylammonium bicarbonate (TEAB) with Pierce protease inhibitor cocktail (Thermo Fisher Scientific, Waltham, MA) and phosphatase inhibitors (10 mM sodium pyrophosphate, 1 mM PMSF, 1 mM sodium orthovanidate, and 1 mM β-glycerolphosphate). Proteins were reduced with a final concentration of 20 mM dithiothreitol (DDT) at 95°C for 10 min, followed by alkylation in the dark at room temperature with 40 mM of iodoacetamide. Next, phosphoric acid was added for a final concentration of 1.2%. Samples were briefly vortexed to mix before 300 μL of S-trap binding buffer (90% MeOH, 100 mM TEAB) was added. Samples were vortexed again prior to loading onto the S-Trap Micro Spin Columns. After four washes with 150 μL of S-trap binding buffer with centrifugation at 1,000×g, 40 μL of 50 mM TEAB containing 0.75 μg of trypsin was added and incubated overnight at 37°C.
Peptides were eluted with 40 μL of each of the following solutions: 50 mM TEAB, 0.2% formic acid (FA), 50% acetonitrile (ACN), and 0.1% FA. The spin column was spun at 4,000×g after adding each solution. Pooled eluents were dried down prior to resuspension in 100 μL of 3% ACN and 0.1% FA.
2.8.1 LC–MS analysis
Three microliters of resuspended samples were injected for LC–MS/MS analysis, similar to a previously mentioned method (Nguyen et al., 2019). Briefly, peptides were loaded onto a Thermo NanoViper trap column (75 μm × 20 mm, 3 μm C18, 100 Å) (Thermo Fisher Scientific, Bremen, Germany) using an Agilent 1,260 Infinity nanoLC system (Agilent Technologies, Santa Clara, CA) and washed for 10 min with 0.1% FA at 2 μL/min. Peptides were separated with a 120-min gradient (from 5 to 60% ACN with 0.1% FA), at 0.25 μL/min flow rate, on an Agilent Zorbax 300SB-C18 column (75 μm × 150 mm, 3.5 μm, 300 Å). Data were collected using data-dependent acquisition (DDA) analysis by a Thermo Q Exactive mass spectrometer (Thermo Fisher Scientific, Bremen, Germany). Settings for the mass spectrometer are as follows: capillary temperature at 250°C, spray voltage 1.5 kV, MS1 scan at 70,000 resolution, scanning from 375 to 1,600 m/z, automatic gain control (AGC) target 1E6 for a maximum injection time (IT) of 100 ms. The 10 most abundant peaks within an MS1 spectrum were isolated for MS/MS, with an isolation width of 1.5 m/z and a dynamic active exclusion set for 20 s. MS/MS spectra were collected at 17,500 resolution for a maximum of 50 ms or a minimum of 1E5 ions. Normalized collision energy (NCE) was set at 27%. Masses with charges of 1 and larger than 6 were excluded from MS/MS analysis.
2.9 Analysis for palmitoyl-proteomics
Raw files were searched with Proteome Discoverer 2.3 (Thermo Fisher Scientific, Waltham, MA) using the Sequest HT search engine against the UniProt Mus musculus database (22,286 gene sequences; downloaded on 27 April 2017). Mass error tolerance was set to 10 ppm for precursors, cleaved by trypsin, allowing a maximum of two missed cleavages, with sequence lengths between 6 and 144 amino acids. Fragment masses were searched with a tolerance of ±0.02 Da. Dynamic modifications included oxidation (M), deamidation (N, R, Q), and acetylation (N-terminus). Carbamidomethylation was set as a static modification (C). Both peptides and PSMs were set to a target false discovery rate (FDR) ≤0.01 for matches with high confidence. Label-free quantification (LFQ) was performed using precursor ion intensity. Samples were normalized using the average intensity of all peptides. The top five most abundant peptides were used for protein abundance calculation. t-test was used to determine the p-values between the two conditions.
Datasets filtered for two unique peptides were further narrowed by filtering for proteins showing an increase in their abundance ratio (Ppt1−/−/WT) of >1.2-fold. These filtered gene lists for lysates and synaptosomes were input separately into the SynGO online tool (Koopmans et al., 2019). The genes encompassed in the top significant biological process (BP) SynGO term for lysates and synaptosomes were then input into STRING, the online protein–protein interaction database.1 A K-means cluster analysis was performed to detect clusters of functionally related proteins and for clarity of visualization.
2.10 APEGS assay from visual cortices
The APEGS assay was performed as described (Kanadome et al., 2019), following the guidelines for tissue samples. Homogenate buffer as described in the APEGS protocol (20 mM Tris–HCl, 2 mM EDTA, 0.32 M sucrose, pH 8.0) was used to homogenize WT and Ppt1−/− occipital cortices. Lysates and synaptosomes were then brought to 300 μg total protein in a final volume of 0.5 mL buffer B (PBS containing 4% SDS, 5 mM EDTA, 8.9 M urea, and protease inhibitors). Proteins were then reduced by the addition of 25 mM Bond-Breaker™ TCEP (0.5 M stock solution, Thermo Fisher) and incubation at RT for 1 h. To block free thiols, freshly prepared N-ethylmaleimide (NEM) in 100% ethanol was added to lysates (to 50 mM), and the mixture was rotated end-over-end for 3 h at RT. Following 2× chloroform-methanol precipitation, samples were divided into +hydroxylamine (HA) and −HA groups, which were exposed to three volumes of HA-containing buffer (1 M HA to expose palmitoylated cysteine residues) or tris-buffer control (−HA), respectively, for 1 h at 37°C. Following chloroform-methanol precipitation, the samples were solubilized and exposed to 10 mM TCEP and 20 mM mPEG-5 k (Laysan Bio Inc., see Table 4) for 1 h at RT with shaking (thereby replacing palmitic acid with mPEG-5K on exposed cysteine residues). Following the final chloroform-methanol precipitation, samples were solubilized in 70 μL of PBS containing 1% SDS, and protein concentration was measured by BCA assay (Pierce). Samples were then brought to 20 μg protein in Laemmli buffer with 2% β-mercaptoethanol for immunoblot analyses as above. Quantification of palmitoylated vs. non-palmitoylated protein was carried out for standard immunoblot analysis, with the additional consideration that signal from palmitoylated bands demonstrating the APEGS-dependent molecular weight shift was divided by the signal from the non-palmitoylated band, the location of which was verified by matching to the −HA control sample. This ratio was divided by β-actin control from the same lane for normalization.
2.11 Primary cortical neuron culture
For primary cortical neuron cultures, embryos at embryonic day 15.5 from timed-pregnant Ppt1−/+ dams were removed, decapitated under anesthesia, and cortices resected. All dissection steps were performed in ice-cold HBSS, pH 7.4. Following cortical resection, tissue from each embryo was individually collected in a separate microtube, genotyped, and digested in HBSS containing 20 U/mL papain and DNAse at 37°C (20 min total; tubes flicked at 10 min) before sequential trituration with 1 mL (~15 strokes) and 200 μL (~10 strokes) pipettes, generating a single-cell suspension. For live-cell/immunohistochemical experiments, cells were counted and then plated at 150,000–180,000 cells/well in 24-well plates containing poly-D-lysine/laminin-coated coverslips. Plated cells were incubated at 37°C in plating medium (neurobasal medium containing B27 supplement, L-glutamine, and glutamate) for 3–5 DIV, before replacing half medium every 3 days with feeding medium (plating medium without glutamate). For synaptic scaling experiments, neurons were treated with either bicuculline (20 mM, solubilized in DMSO, Tocris) or TTX citrate (1 mM, solubilized in sterile water, Tocris) for 48 h where indicated.
2.12 GFP-NFAT nuclear translocation analyses
Analysis of NFAT nuclear translocation following culture-wide depolarization was performed as in Murphy et al. (2014) with minor modification. Neurons were transfected at DIV 12 with a 1:1 mixture of CAG-mCherry and mouse GFP-NFATc3 (pCMV-SGFP2-mNFATc3.dna, courteously provided by Dr. Dell’Acqua), 1 mg DNA per coverslip using Lipofectamine® 2000 (Thermo Fisher) as above. A subset of neurons was treated with TTX (1 μM) for 48 h leading up to the assay to induce synaptic scaling. Solutions were composed as follows: Tyrode + TTX (in mM: 135 NaCl, 5 KCl, 2 CaCl2, 1 MgCl2, 25 HEPES, and 10 glucose, pH 7.4 and 1 mM TTX), depolarization solution was isotonic, but with 50 mM KCl (85 mM NaCl) and without TTX, and recovery solution was standard Tyrode without TTX. Cells were incubated at 37°C in between steps. For every coverslip of depolarized (KCl) neurons, a control with no depolarization (sham, Tyrode solution + TTX) and depolarization with the selective GluA1-containing AMPAR blocker NASPM (KCl + 10 μM NASPM) added were performed in parallel. Following fixation at the end of the assay, cells were immunostained with anti-GFP 488 antibody (Thermo Fisher) following the protocol above to amplify the GFP-NFAT signal. GFP-NFAT nucleus/soma ratio was analyzed by manually tracing the nucleus, based on the DAPI staining signal, and soma as independent ROIs and dividing the integrated fluorescence value (measured by multi-measure tool in Fiji) for the nucleus by that for the soma.
2.13 FK506 dosing
Animals were treated with FK506 at a dose of 3 mg/kg/day (Muthuraman and Sood, 2010), similar to a previous study (Yoshiyama et al., 2007). Specifically, FK506 (Selleck Chemicals) was solubilized in DMSO at a concentration of 9 mg/mL to make stock solution aliquots. The FK506 stock was solubilized into sucrose-supplemented (2%) drinking water in mice at a dilution of 1:400 (bringing the final DMSO concentration to 0.25%) and changed every other day. Considering animals drink ~4 mL/day, they are expected to consume 0.09 mg/day via this passive administration route, or the equivalent of 3 mg/kg at an average weight of 30 g. Analysis of AFSM and gliosis in FK506-treated animals was performed as mentioned above.
2.14 Motor assessment (Rotarod) of vehicle- and FK506-treated Ppt1−/− mice
Each animal performed three trials on a fixed speed rotarod, and the latency to fall was timed for each animal manually by an observer. The average latency to fall was calculated for each subject.
3 Results
3.1 Palmitoyl-proteomics points to over-palmitoylation of Akap5 in Ppt1−/− visual cortex
A limitation of our previous studies demonstrating that loss of Ppt1 function impairs the function and plasticity of synaptic receptors (Koster et al., 2019, 2023) is that it remains largely unclear how these early-disease changes contribute to classical disease features, like AFSM accumulation or neuroinflammation. To uncover dysregulated molecular pathways in CLN1 that might provide a link between these processes, we performed a palmitoyl-proteomic screen using the acyl-biotin exchange method (Drisdel and Green, 2004; Roth et al., 2006; Wan et al., 2007) on visual cortical lysates and synaptosomes from young (postnatal day (P) 42) Ppt1−/− mice. We chose mice at this timepoint to capture early changes to synaptic protein palmitoylation, prior to the onset of severe disease.
This analysis detected 512 palmitoylated proteins in lysates and 596 in synaptosomes from WT and Ppt1−/− visual cortices (Figures 1A,B). In lysates, we did not detect any significant changes in the abundance ratio (Ppt1−/−/WT) for any proteins (Figure 1A). In synaptosomes, we detected significantly increased palmitoylation levels of only two proteins, acid ceramidase and cathepsin D, demonstrating that these proteins are consistently overrepresented in the CLN1 brain across several studies (Figure 1B; Chandra et al., 2015; Sleat et al., 2017; Atiskova et al., 2019; Gorenberg et al., 2022). Despite only a few proteins showing statistically significant excessive palmitoylation, we found that most of the identified proteins showed modest over-palmitoylation in the Ppt1−/− brain, particularly in synaptosomes (Figures 1A,B). Specifically, in Ppt1−/− lysates, 144 proteins (28.1%) show a > 1.2-fold increase in the raw abundance ratio compared to WT, while only 13 (2.5%) show a < 0.80-fold change (Figure 1C). This trend is even more robust in Ppt1−/− synaptosomes, with 380 proteins (63.8%) demonstrating a > 1.2-fold change increase, and only 31 (5.2%) showing a < 0.80-fold change reduction (Figure 1D). These data indicate a bulk increase in the palmitoylation level of synaptic proteins in young mice with loss of Ppt1 function, consistent with Ppt1 regulating a substantial proportion of the synaptic palmitome (Gorenberg et al., 2022).
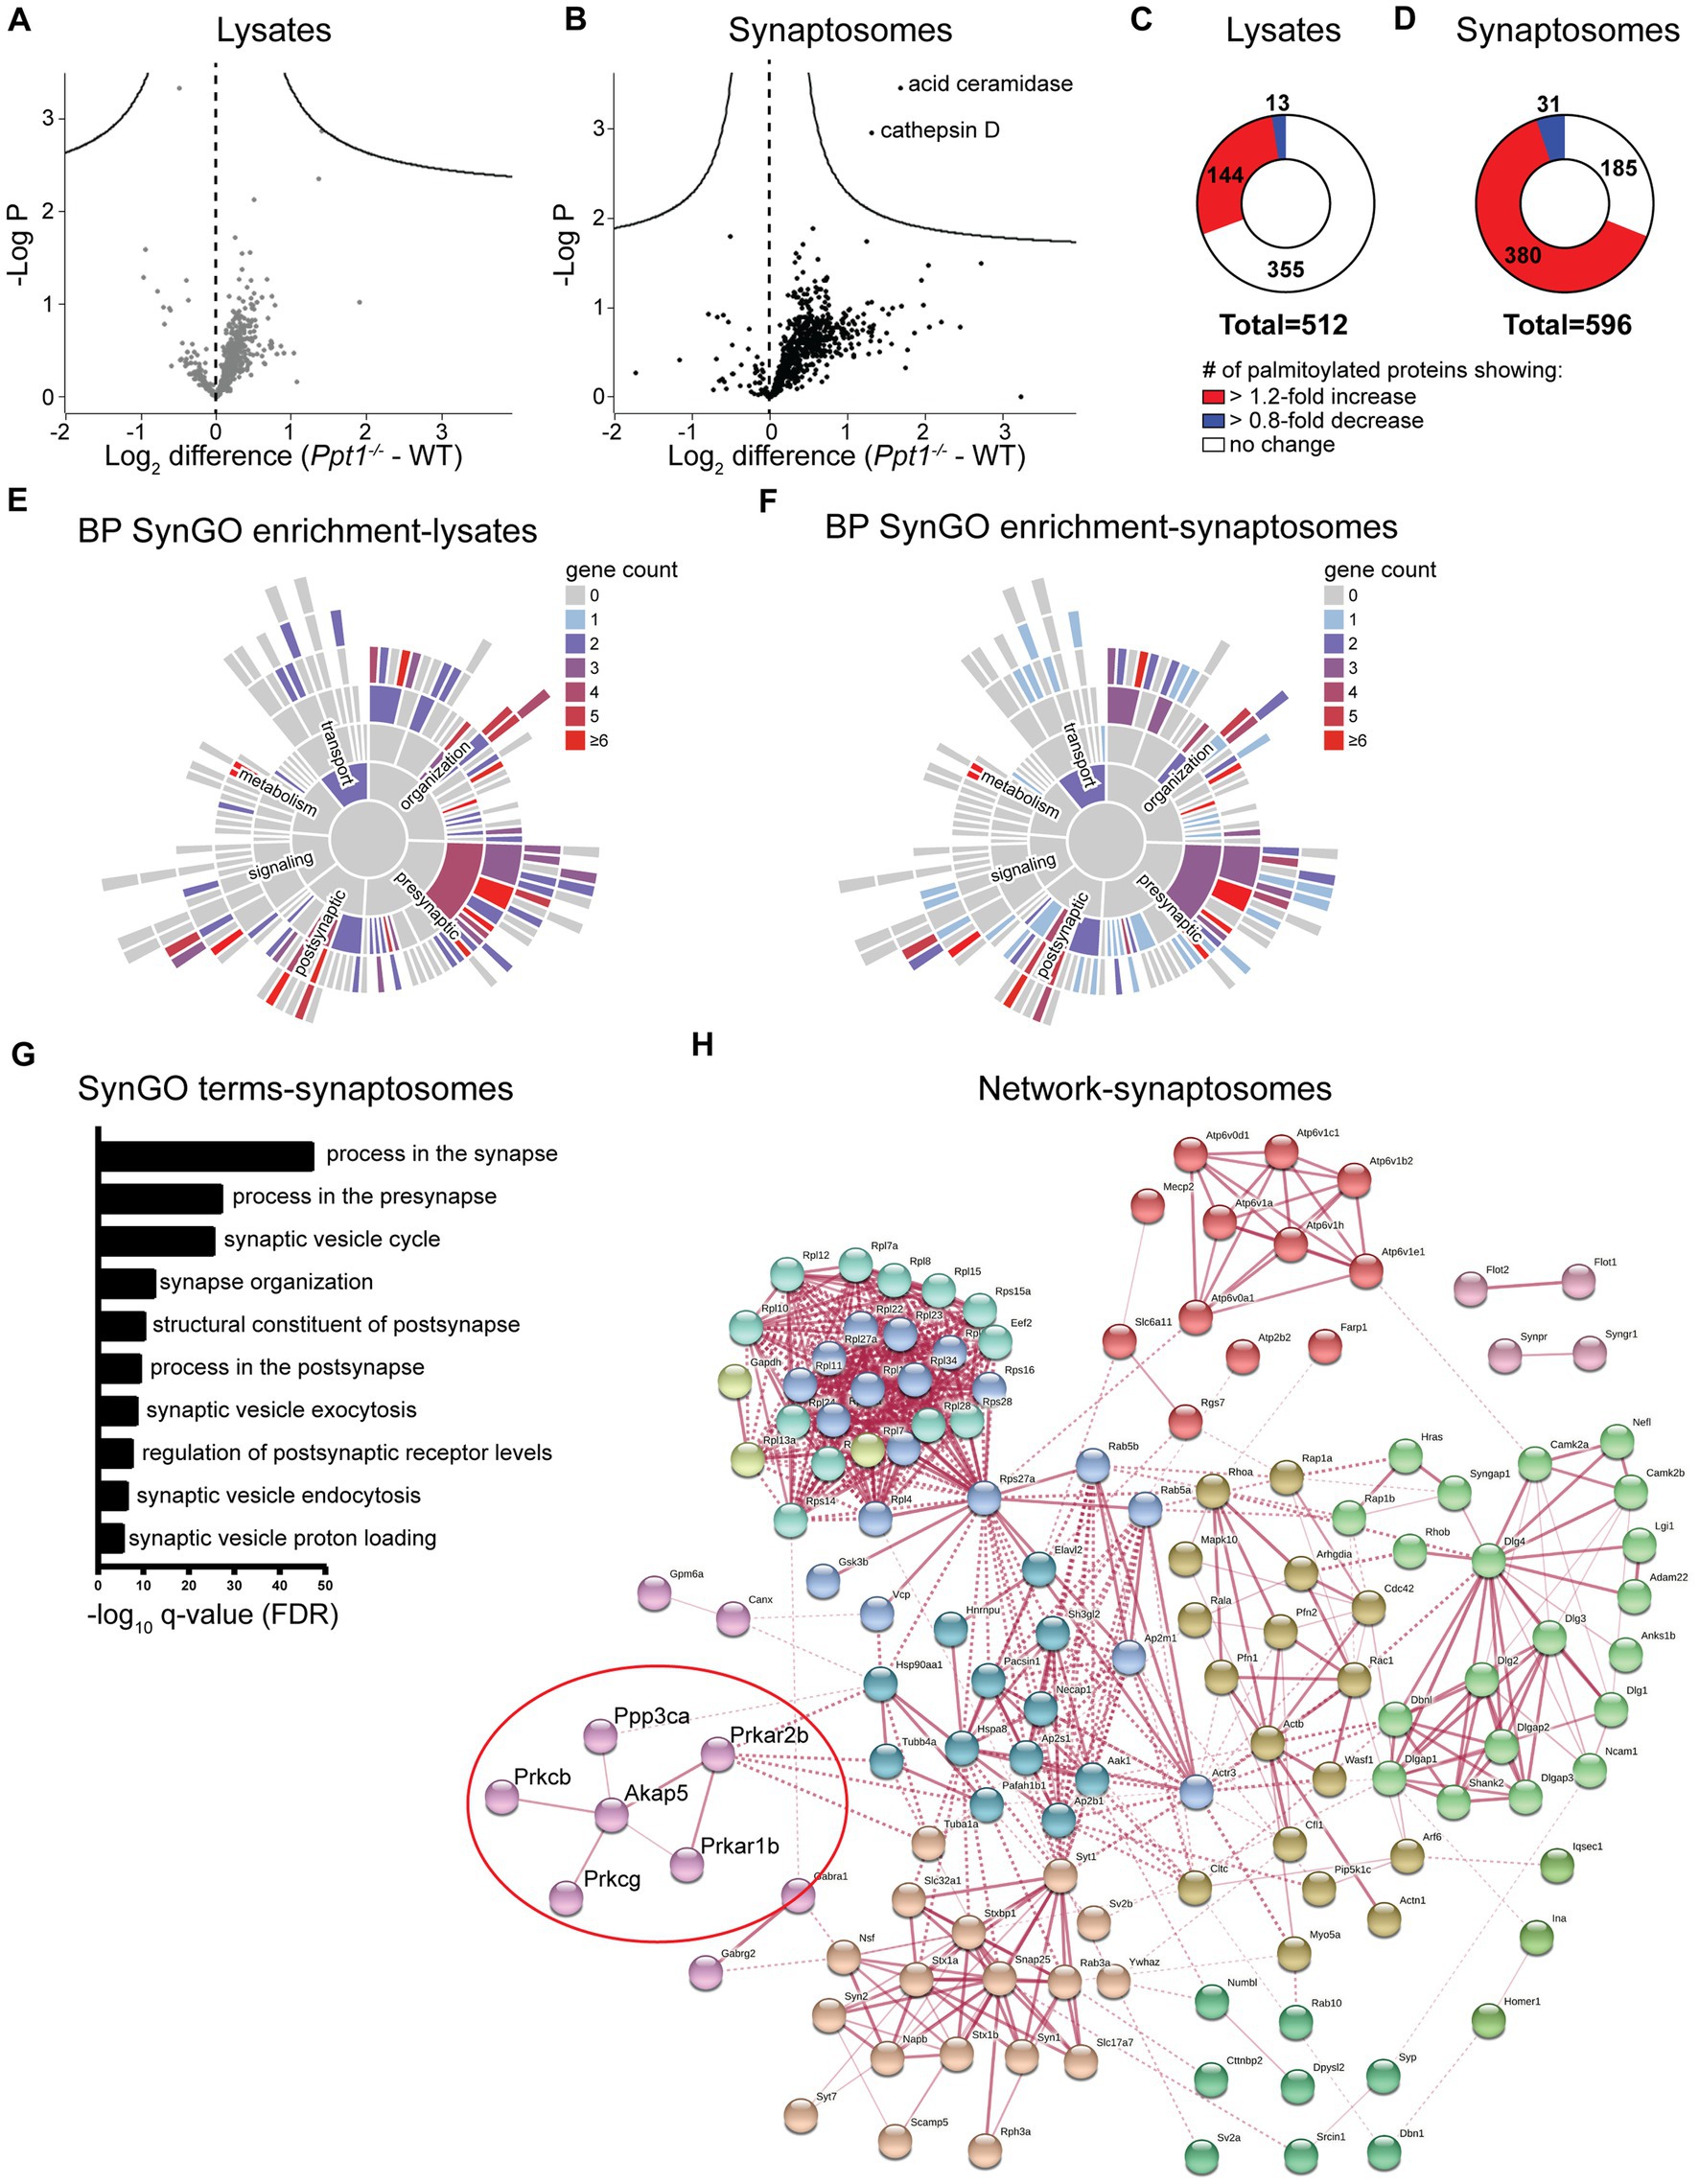
Figure 1. Palmitoyl-proteomics points to excessive palmitoylation of Akap5 and associated signaling proteins in the Ppt1−/− visual cortex. (A) Volcano plot showing the log2 fold change in palmitoyl-protein expression from lysates of WT and Ppt1−/− visual cortex at P42. N = 6 visual cortices/group. (B) Volcano plot showing the log2 fold change in palmitoyl-protein expression from synaptosomes of WT and Ppt1−/− visual cortex. N = 6 visual cortices/group. (C) Breakdown of the proportion of proteins exhibiting a 1.2-fold or greater (red), 0.8-fold or lower (blue), or no change (white) in the abundance ratio Ppt1−/−/WT from visual cortical lysates. (D) Breakdown of the proportion of proteins exhibiting a 1.2-fold or greater (red), 0.8-fold or lower (blue), or no change (white) in the abundance ratio Ppt1−/−/WT from visual cortical synaptosomes. (E) SynGO annotation of the palmitoyl-proteome of visual cortical lysates from WT and Ppt1−/− mice. BP, biological process. (F) SynGO annotation of the palmitoyl-proteome of visual cortical synaptosomes from WT and Ppt1−/− mice. (G) Top 10 enriched SynGO terms from proteins increased 1.2-fold in Ppt1−/− visual cortical synaptosomes. (H) Network analysis of the genes increased in Ppt1−/− synaptosomes by 1.2-fold that were annotated with the top biological process SynGO term “process at the synapse.” Red circle denotes Akap5 and associated signaling protein subunits.
To identify the characteristics of synaptic proteins that are overrepresented in the palmitoyl fraction of Ppt1−/− visual cortices, we performed a synapse-specific gene ontology analysis using SynGO (Koopmans et al., 2019). For both datasets, SynGO analysis demonstrated a robust enrichment for synaptic proteins compared to a whole-brain proteomic background dataset (Figures 1E,F), emphasizing the role of palmitoylation at the synapse (Sanders et al., 2015). The top 10 enriched SynGO terms demonstrated substantial overlap between lysates and synaptosomes, which is expected given the enrichment for palmitoylated proteins in both populations. “Process in the synapse,” “process in the presynapse,” “structural constituent of the postsynapse,” “process in the postsynapse,” and “regulation of postsynaptic receptor levels” are represented in the top 10 enriched terms in both lysates and synaptosomes (Figure 1G and Supplementary Figure 1A).
To highlight specific pathways that are dysregulated by a lack of Ppt1, we performed a network analysis on all genes annotated with the top SynGO term “process in the synapse” using the online protein–protein interaction database, STRING (Snel et al., 2000; Szklarczyk et al., 2017). As expected from the SynGO analysis, the networks in lysates and synaptosomes demonstrated substantial overlap (Figure 1H and Supplementary Figure 1B). We took note of a particular cluster that appeared with minor variation in both lysates and synaptosomes, consisting of Akap5, the cAMP-dependent protein kinase subunits Prkacb, Prkar1b, and Prkar2b, the protein kinase C subunits Prkcb and Prkcg, and the calcineurin subunit Ppp3ca (Figure 1H, red circle).
The Akap5 gene encodes the A-kinase anchoring protein 5 (Akap5), a postsynaptic scaffolding protein that anchors protein kinase A, protein kinase C, and calcineurin to the postsynaptic density, where it indirectly interacts with AMPARs (Colledge et al., 2000; Robertson et al., 2009). Through these interactions, Akap5 can link synaptic activity to downstream signaling (Sanderson and Dell’Acqua, 2011), making it a top candidate for a potential link between aberrant synaptic plasticity and long-term pathogenic changes to the Ppt1−/− brain. This notion is further supported by two related lines of evidence. First, that Akap5 regulates calcium-permeable (CP)-AMPAR incorporation during synaptic scaling (Diering et al., 2014; Sanderson et al., 2018), and second, our recent finding that synaptic upscaling is affected by loss of Ppt1 function, particularly in vitro (Koster et al., 2023). Therefore, we focused on whether Akap5 levels are dysregulated in the Ppt1−/− brain.
3.2 Increased palmitoylation of Akap5 in Ppt1−/− synaptosomes
We first measured Akap5 levels across cortical development (P11–P60) and did not detect changes in the total levels of Akap5 in lysates or synaptosomes of Ppt1−/− visual cortices (Figures 2A,B). Furthermore, we did not detect increased Akap5 palmitoylation in visual cortical lysates at P42 using the acyl-PEGyl exchange gel shift (APEGS) assay (Figure 2C; Yokoi et al., 2016; Kanadome et al., 2019). However, performing the APEGS assay in visual cortical synaptosomes revealed that Akap5 is excessively palmitoylated at Ppt1−/− synapses at this age (Figure 2D). Extending our previous in vitro observations (Koster et al., 2019), we also demonstrated increased GluN2B palmitoylation in Ppt1−/− visual cortical synaptosomes (Supplementary Figure 2).
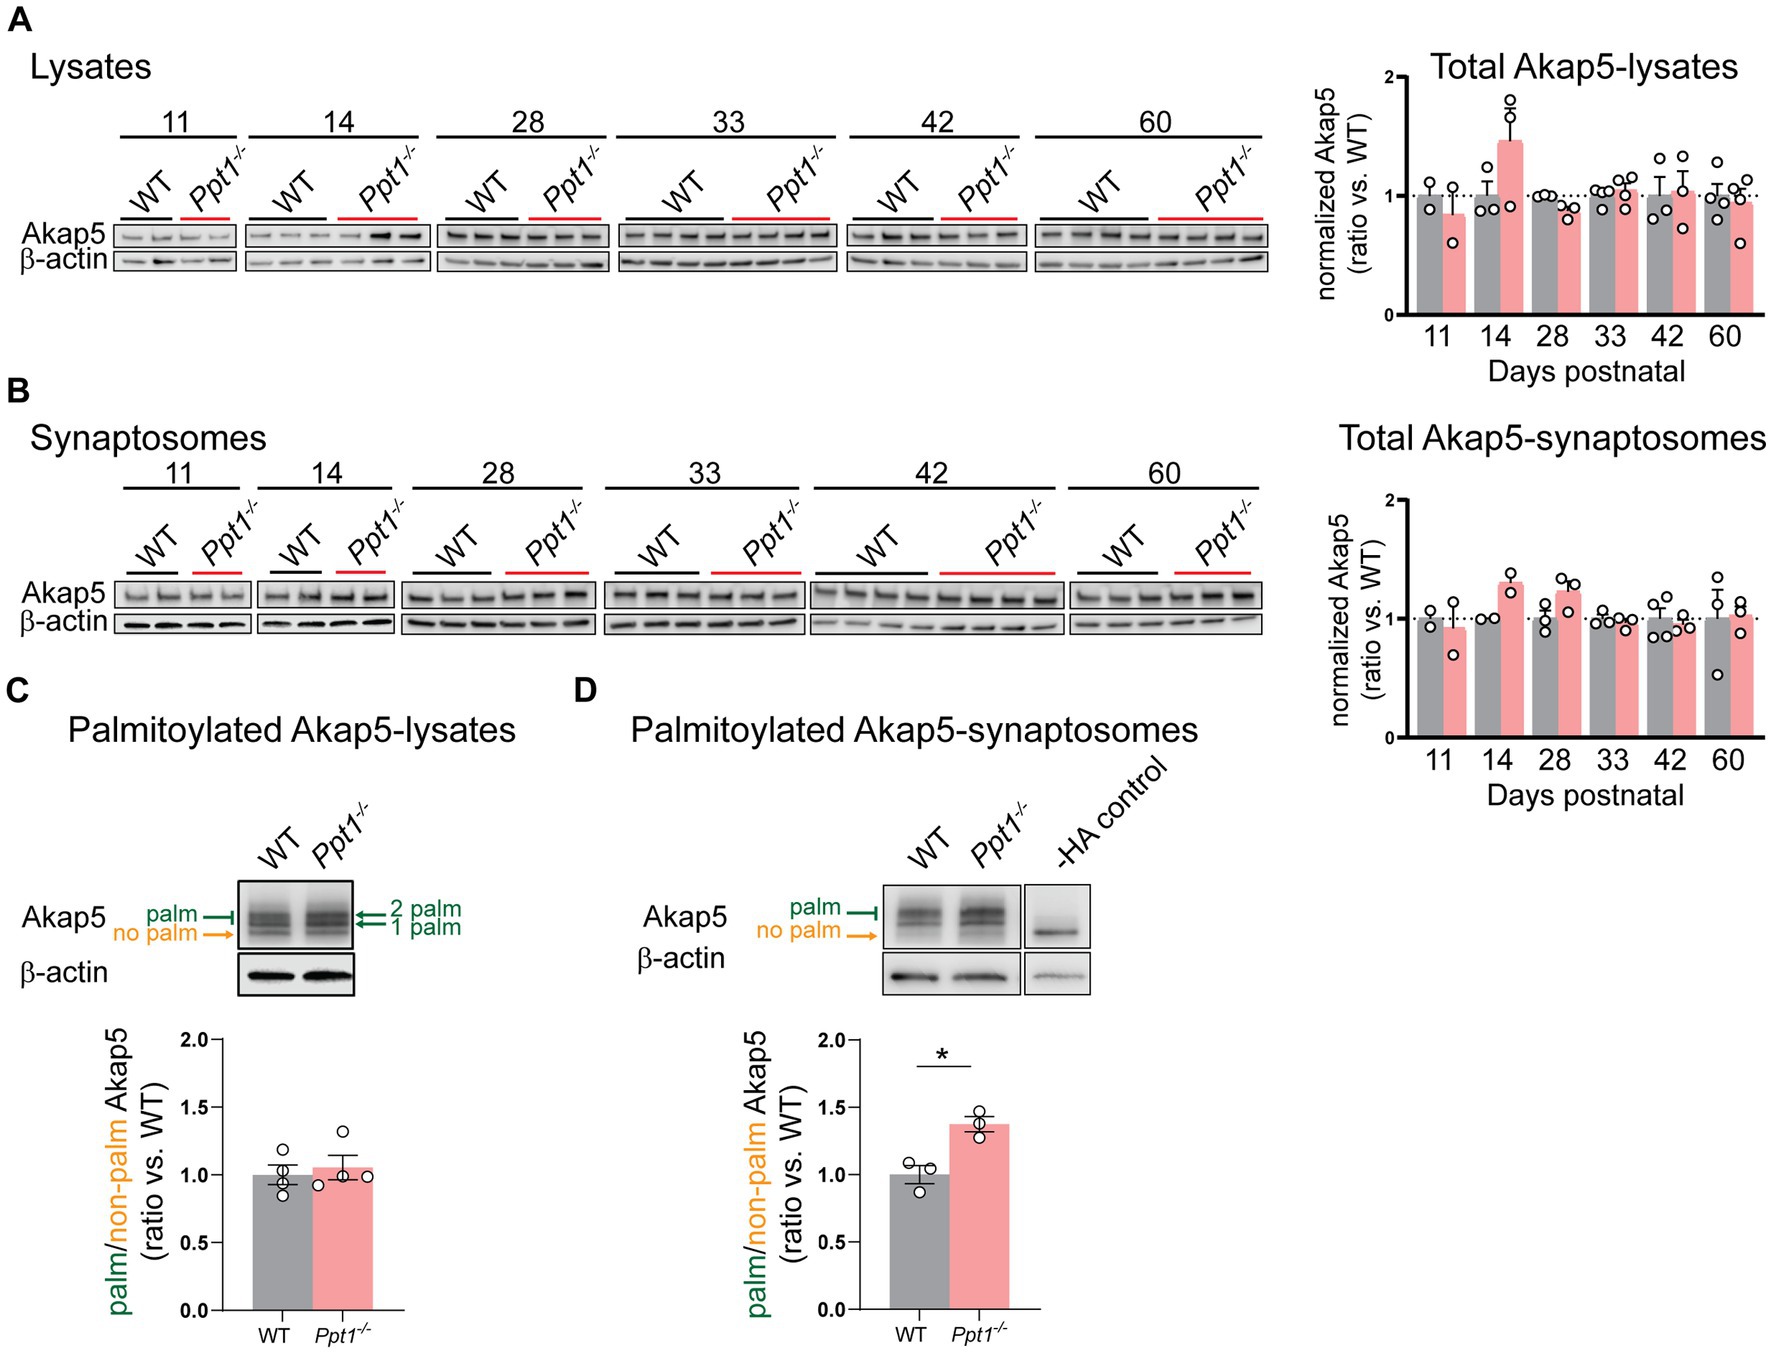
Figure 2. AKAP palmitoylation is increased in Ppt1−/− visual cortical synaptosomes. (A) Representative immunoblots (left) and quantification (right) of Akap5 levels in visual cortical lysates across ages P11–P60. (B) Representative immunoblots (left) and quantification (right) of Akap5 levels in visual cortical synaptosomes across ages P11–P60. (C) Representative immunoblot and quantification of APEGS-processed visual cortical lysates from WT and Ppt1−/− mice probing for Akap5 at P42. N = 3–4 mice/group. (D) Representative immunoblot and quantification of APEGS-processed visual cortical synaptosomes from WT and Ppt1−/− mice probing for Akap5 at P42. The −HA control shows the molecular weight of the non-palmitoylated Akap5 species. t-test: *p = 0.0120. N = 3 mice/group. Note that, unfortunately, one set of synaptosome samples was lost during APEGS processing during chloroform-methanol precipitation.
3.3 Induction of synaptic upscaling in vivo causes excessive upregulation of synaptic GluA1 in Ppt1−/− mice
As mentioned, converging lines of evidence highlight the centrality of Akap5 and its associated signaling molecules in regulating synaptic scaling (Diering et al., 2014; Sanderson et al., 2018). Consistent with these accumulating data, we demonstrate here an over-palmitoylation of Akap5 in Ppt1−/− brains and have shown previously that loss of Ppt1 leads to exaggerated synaptic upscaling of CP-AMPARs. However, the bulk of our prior synaptic upscaling experiments were performed in cortical neurons (Koster et al., 2023). Therefore, to test if this plasticity mechanism was also affected by loss of Ppt1 function in vivo, we employed a dark rearing (dark rearing/dark reared, DR) protocol in WT and Ppt1−/− mice that reliably induces upscaling in the visual cortex (Goel et al., 2006, 2011; Goel and Lee, 2007).
Corroborating previous findings (Goel et al., 2006, 2011; Goel and Lee, 2007; Diering et al., 2014), levels of synaptosomal GluA1, but not GluA2 or Akap5, were increased in both DR-WT and DR-Ppt1−/− visual cortices compared to their light reared (light rearing/light reared, LR) counterparts (Figures 3A,B). Notably, the increase of GluA1 levels in DR-Ppt1−/− cortices exceeded those in DR-WT animals (Figures 3A,B), indicating synaptic upscaling of GluA1-containing AMPARs is exaggerated in vivo as well as in vitro (Koster et al., 2023).
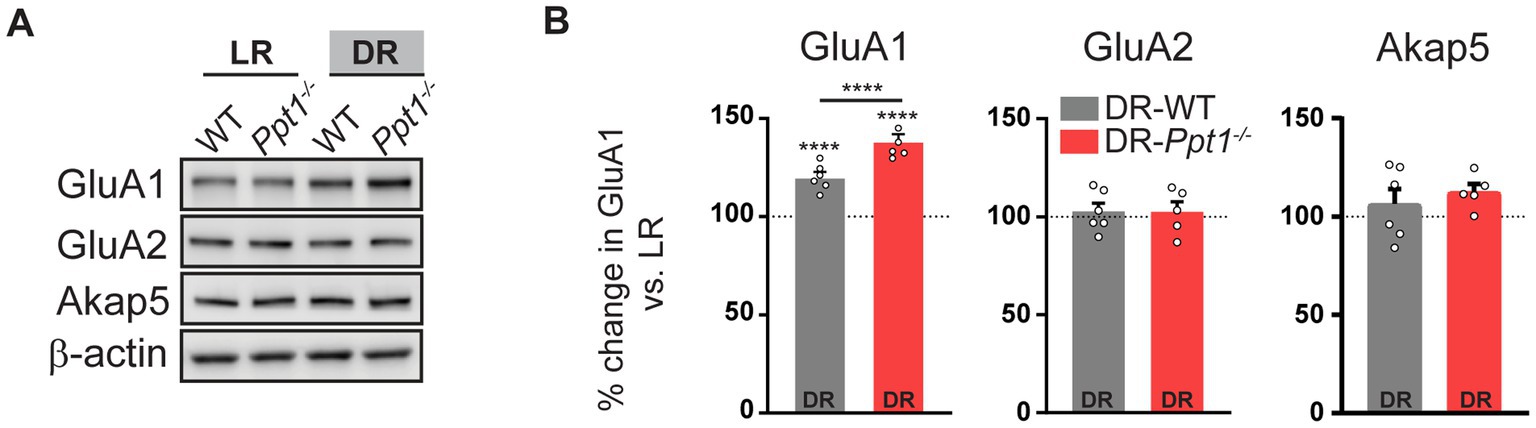
Figure 3. Induction of synaptic upscaling in vivo causes excessive upregulation of synaptic GluA1 in Ppt1−/− mice. (A) Representative immunoblots and (B) quantification of GluA1, GluA2, and Akap5 levels in LR-WT, LR-Ppt1−/−, DR-WT, and DR-Ppt1−/− visual cortical synaptosomes at P42. N = 5–6 animals/group. Two-way ANOVA for GluA1: interaction genotype × rearing condition (F(1, 20) = 17.00, ***p = 0.0005); main effect of genotype (F(1, 20) = 17.00, ***p = 0.0005); main effect of rearing condition (F(1,20) = 172.6, p < 0.0001). Tukey’s multiple comparison indicated on the graph: ****p < 0.0001 LR-WT vs. DR-WT; ****p < 0.0001 LR-Ppt1−/− vs. DR-Ppt1−/−; ****p < 0.0001 DR-WT vs. DR-Ppt1−/−. Data represent mean ± SEM.
3.4 Nuclear factor of activated T cells (NFAT) nuclear translocation is increased in upscaled Ppt1−/− neurons
Upon synaptic calcium influx, like that from CP-AMPARs, activation of Akap5-associated calcineurin leads to dephosphorylation of the nuclear factor of activated T cells (NFAT) (Sanderson and Dell’Acqua, 2011; Li et al., 2012; Murphy et al., 2019). In turn, NFAT undergoes nuclear translocation and regulates transcription (Pan et al., 2012). Therefore, we hypothesized that an overload of palmitoylated Akap5 and excessive CP-AMPAR upregulation leads to the NFAT pathway being sensitized in upscaled Ppt1−/− neurons.
To test this hypothesis, we performed a nuclear translocation assay as described in Murphy et al. (2014), following 48-h pretreatment of TTX to induce upscaling in WT and Ppt1−/− neurons (Figure 4A). Following synaptic upscaling, WT and Ppt1−/− neurons were depolarized (acute incubation in isotonic high K+ solution) and fixed for assessment of NFAT [specifically, the NFATc3 isoform (Murphy et al., 2014)] nuclear translocation (Figures 4B,C). While high K+-induced depolarization triggered the nuclear translocation of NFAT-GFP in both WT and Ppt1−/− neurons, the nuclear/soma ratio was significantly higher in Ppt1−/− cells, indicating a greater responsiveness to depolarization (Figures 4B,C). To test whether this effect resulted from an increased contribution of CP-AMPARs in upscaled Ppt1−/− neurons, we performed the same assay and treated a subset of neurons with NASPM (10 μM), the CP-AMPAR selective antagonist (Koike et al., 1997), during the depolarization period. We found that NASPM reduced NFAT nuclear translocation to a greater degree in Ppt1−/− cells compared to WT (Figures 4B,C). Together, these data suggest that calcium influx through CP-AMPARs more robustly drives downstream signaling through calcineurin and NFAT, which are both anchored by Akap5, in upscaled Ppt1−/− neurons.
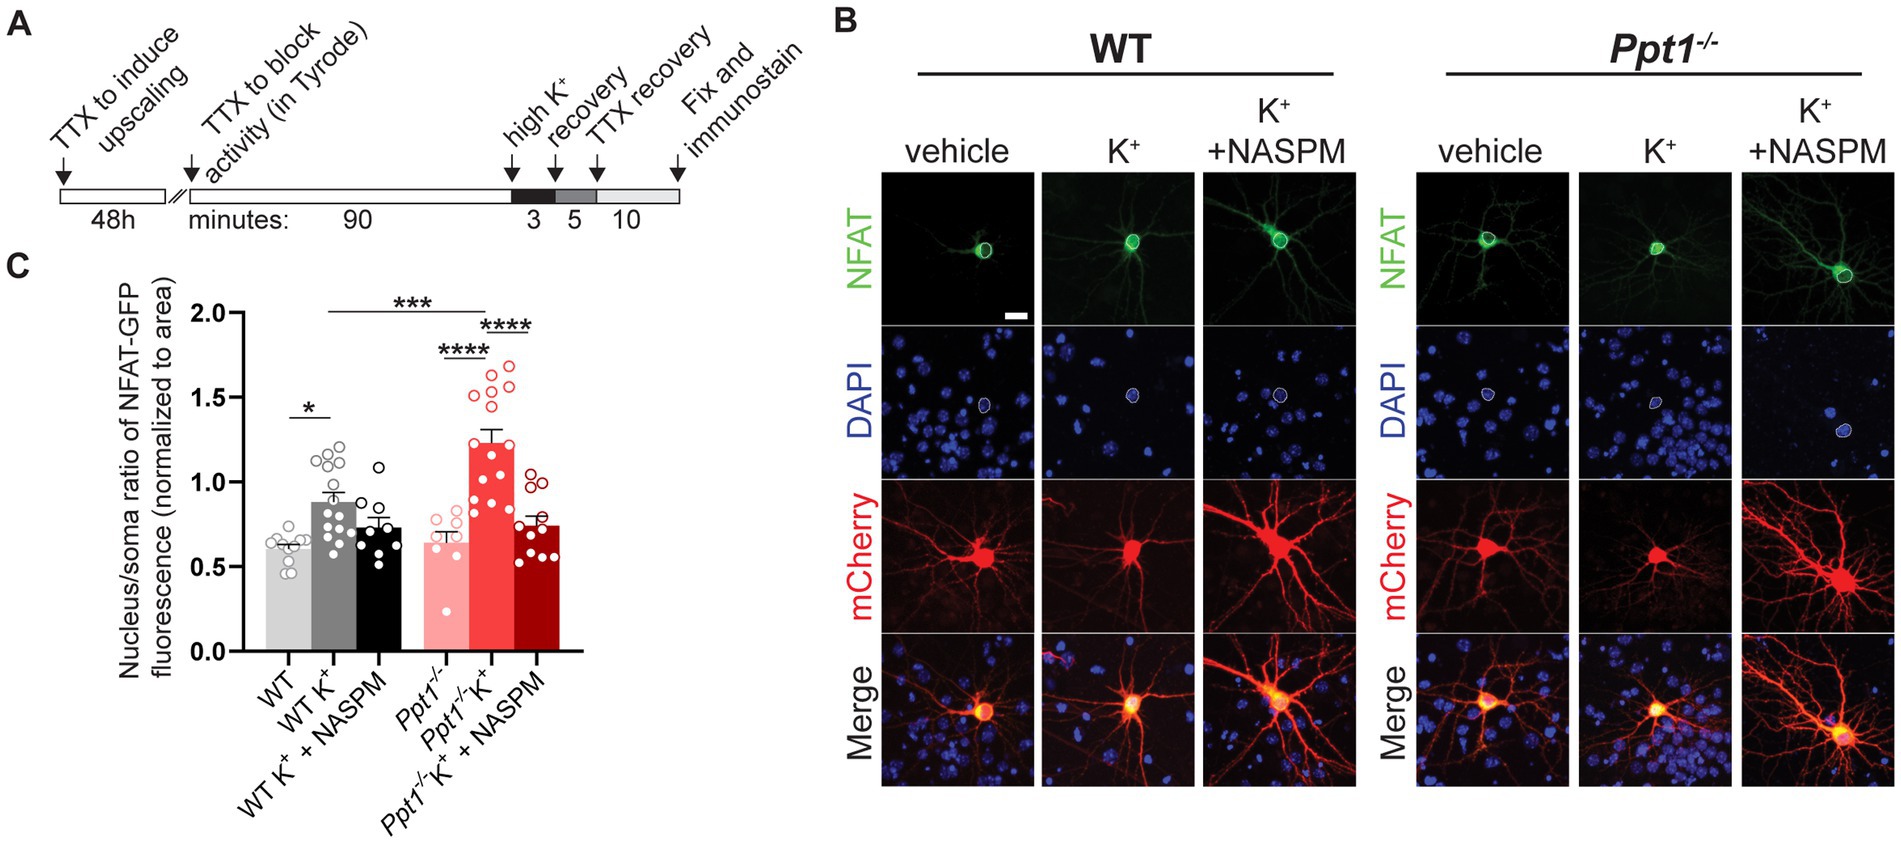
Figure 4. Sensitization of NFAT nuclear translocation in upscaled Ppt1−/− neurons. (A) Schematic representation of the experimental design for depolarization (K+) induction of NFAT activity (nuclear translocation), as previously described (Murphy et al., 2014). (B) Representative images of NFAT localization from WT and Ppt1−/− neurons in response to either sham or K+-induced depolarization. The outline of the nucleus (saturated DAPI signal) is drawn in each image. Scale bar = 20 μm. (C) Quantification of the nucleus/soma ratio of NFAT fluorescence in WT and Ppt1−/− upscaled neurons in sham depolarization, K+ depolarization, and K+ depolarization + NASPM (10 μM) conditions. Two-way ANOVA: interaction genotype × treatment (F(2, 62) = 4.675, *p = 0.0129); main effect of genotype (F(1, 62) = 5.882, *p = 0.0182); main effect of treatment (F(2, 62) = 26.23, ****p < 0.0001). Tukey’s multiple comparison indicated on the graph: *p = 0.0245 WT vs. WT K+; ****p < 0.0001 Ppt1−/− vs. Ppt1−/− K+; ****p < 0.0001 Ppt1−/− K+ vs. Ppt1−/− K+ + NASPM; ***p = 0.006 WT K+ vs. Ppt1−/− K+.
3.5 Excessive synaptic upscaling is associated with accelerated neuroinflammation in Ppt1−/− visual cortex
Although the panel of NFAT-target transcripts is incompletely characterized in neurons (Jayanthi et al., 2005; Luoma and Zirpel, 2008; Vashishta et al., 2009; Gómez-Sintes and Lucas, 2010), NFAT activation is associated with proinflammatory signaling in immune cell types, including microglia (Nagamoto-Combs and Combs, 2010; Minematsu et al., 2011; Pan et al., 2012). Neuroinflammation is a key correlate of disease severity in CLN1 and Ppt1−/− mice (Kielar et al., 2007; Palmer et al., 2013; Macauley et al., 2014). Therefore, we next tested whether excessive synaptic upscaling of GluA1 via DR was associated with the severity of neuroinflammation in Ppt1−/− mice.
We immunostained LR-WT, LR-Ppt1−/−, DR-WT, and DR-Ppt1−/− brains for the microglia marker, Iba1 (Figure 5A), and performed morphological (i.e., Sholl) analysis on individual cells in the visual cortex (Figures 5B,C), since a classical sign of inflammatory microglial activation is a loss of ramification and ameboid shape (Giulian, 1987; Gehrmann et al., 1995). At P33 and P42, there were no differences between LR-WT and LR-Ppt1−/− cells in either the number of intersections as a function of distance from the cell soma (Figure 5D) or in terms of the total number of intersections (Figure 5E). By P60, however, there was a significant reduction in the number of intersections in LR-Ppt1−/− mice compared to LR-WT that persisted to P78, suggesting microglial morphology analysis is a sensitive measure of the neuroinflammatory phenotype in CLN1 mice (Figures 5D,E).
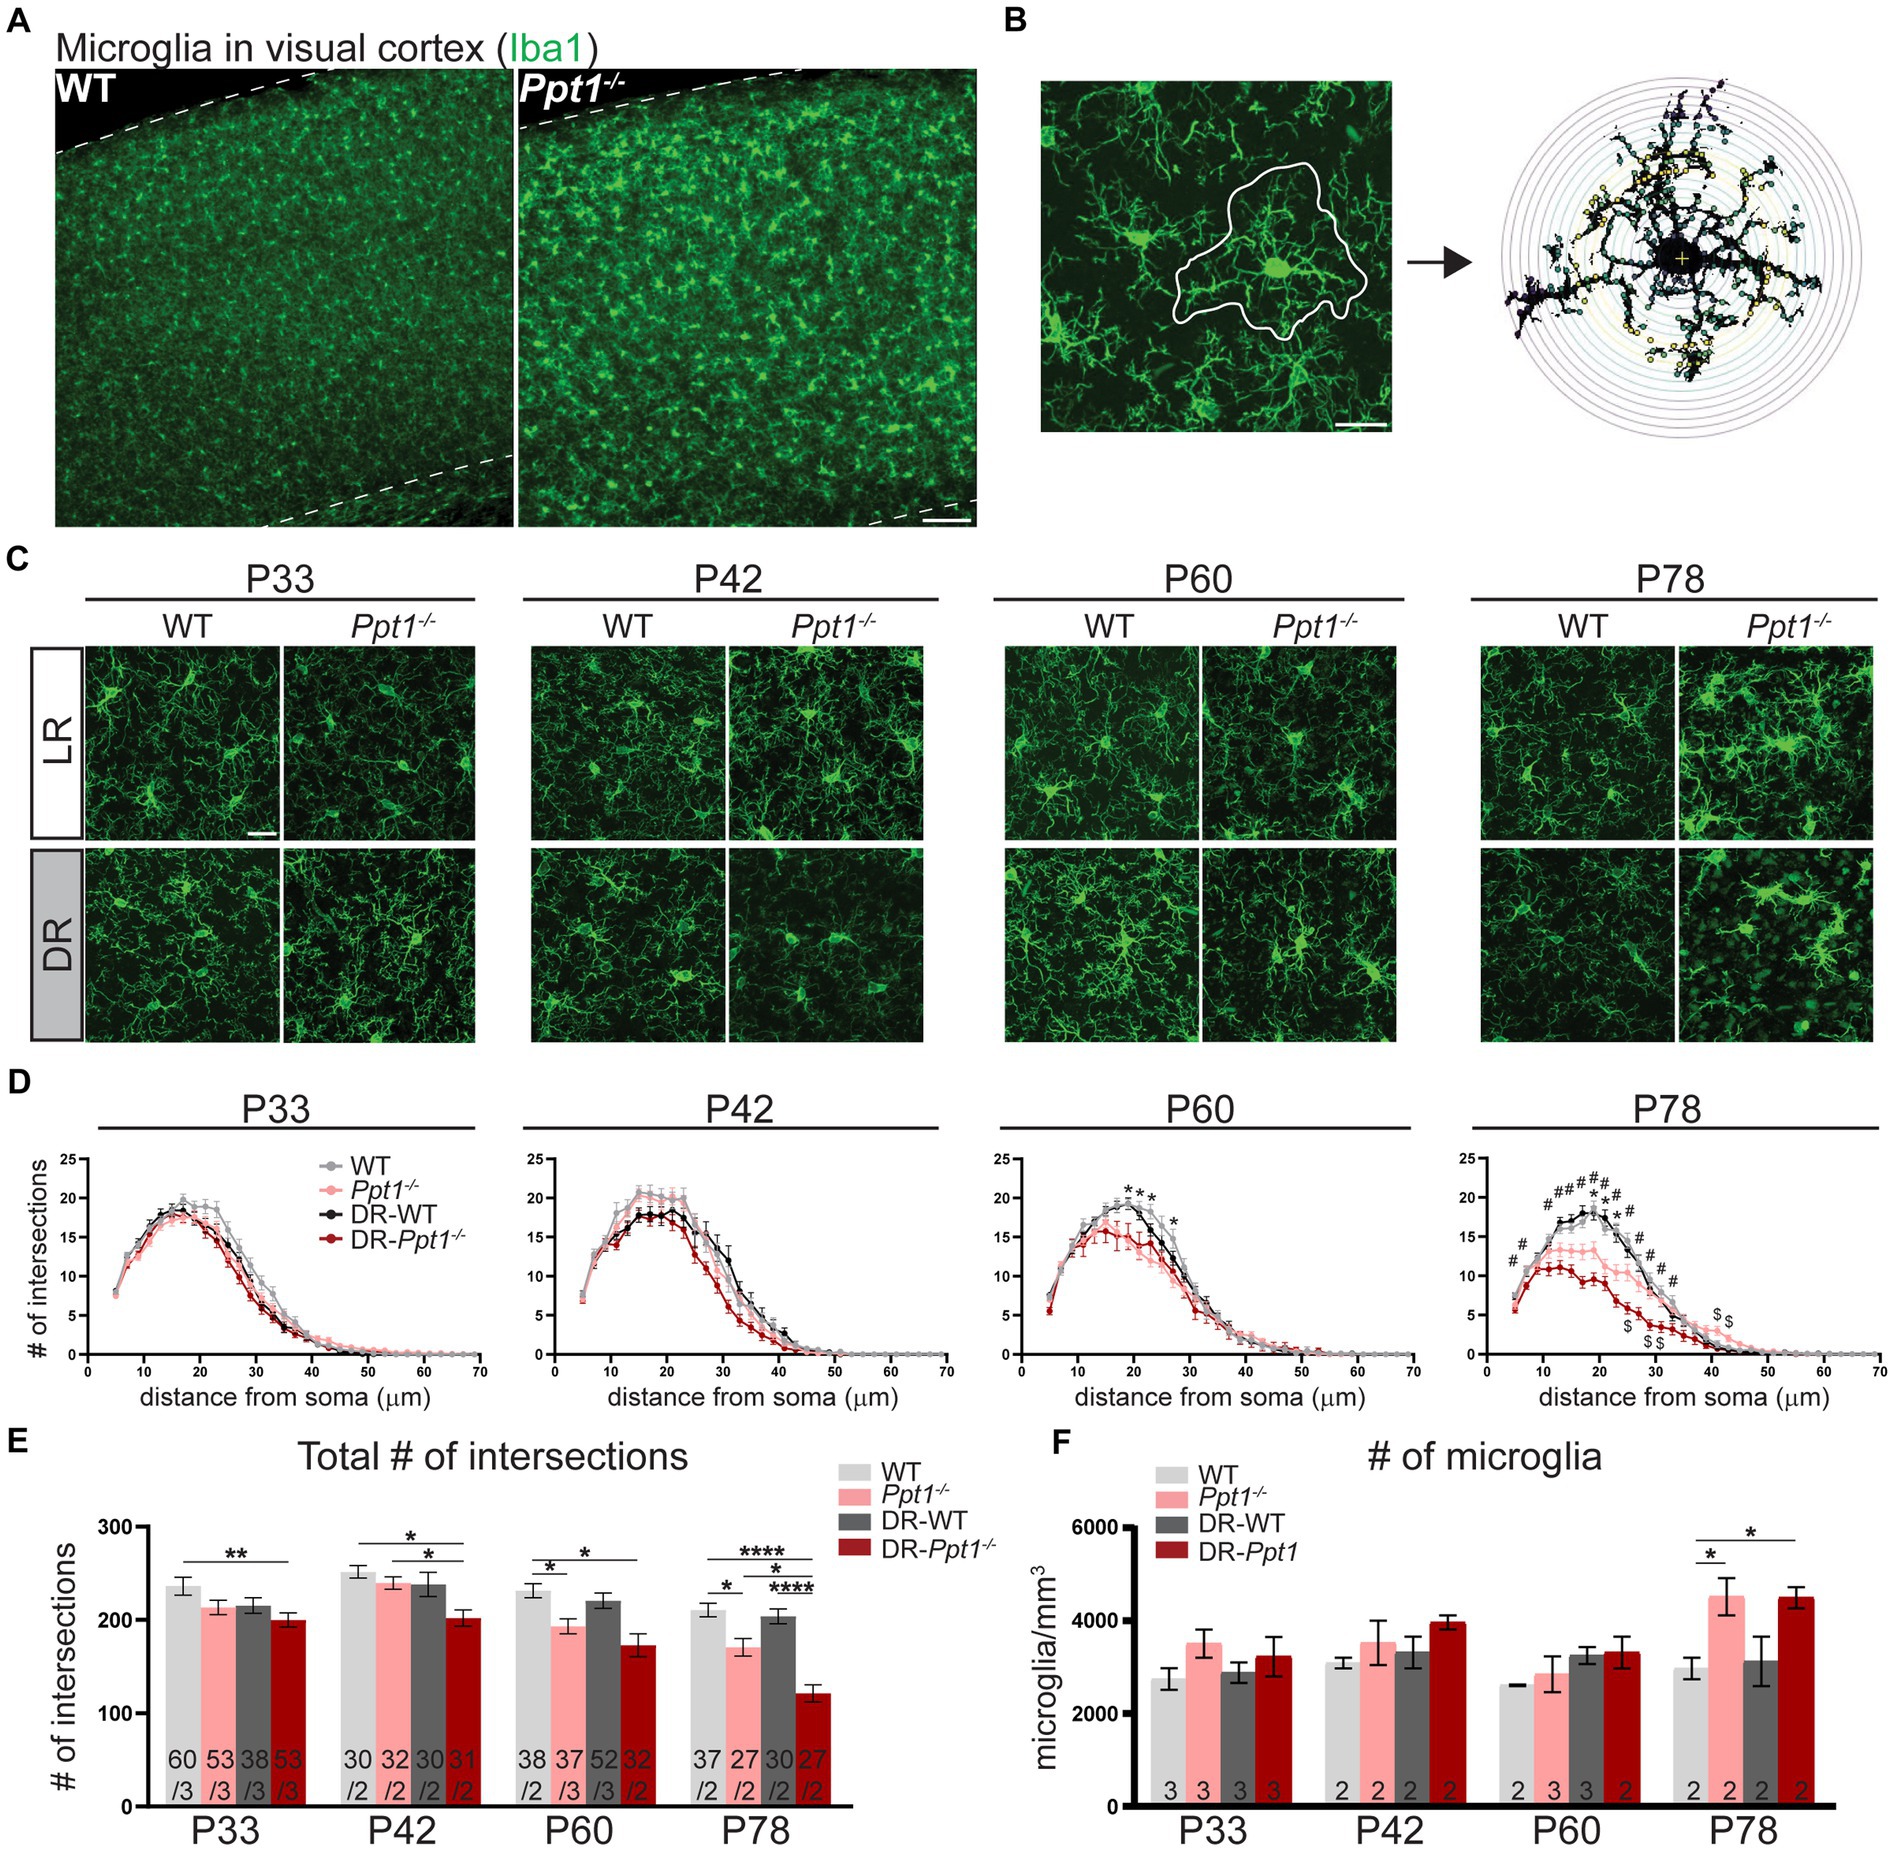
Figure 5. Induction of synaptic upscaling in vivo exacerbates neuroinflammation in Ppt1−/− visual cortex. (A) Representative low magnification images of Iba1 immunostaining in the visual cortex of WT and Ppt1−/− visual cortex at P78. Scale bar = 100 μm. (B) Representative thresholded microglia image and Sholl analysis overlay. Scale bar = 20 μm. (C) Representative high magnification images of Iba1 immunostaining for visual cortical (layer 2/3) microglia in WT, Ppt1−/−, DR-WT, and DR-Ppt1−/− mice across age (P28–P78). Scale bar = 20 μm. (D) Quantification of microglia branching by Sholl analysis in WT, Ppt1−/−, DR-WT, and DR-Ppt1−/− mice across age, where the number of intersections (y-axis) are averaged across cells at the specified distance from the soma (x-axis). Multiple t-tests: *p < 0.005 WT vs. Ppt1−/−; #p < 0.005 WT vs. DR-Ppt1−/−; $p < 0.005 Ppt1−/− vs. DR-Ppt1−/− (see Table 1). N = 27–60 cells, 2–3 animals per group. Number of cells/animals for each group is listed in panel (E). (E) Quantification of the total number of intersections for each group of animals across age. Number of cells/animals in each group is listed on the graph. Two-way ANOVA: interaction of condition (genotype and rearing) × age (F(9, 522) = 2.098, *p = 0.0282); main effect of age (F(3, 522) = 21.42, ****p < 0.0001); main effect of genotype/rearing (F(3, 522) = 22.39, ****p < 0.0001). Tukey’s multiple comparisons indicated on the graph: **p = 0.0017 WT P33 vs. DR-Ppt1−/− P33; P42 *p = 0.0160 WT P42 vs. DR-Ppt1−/− P42; *p = 0.0250 Ppt1−/− P42 vs. DR-Ppt1−/− P42; *p = 0.0458 WT P60 vs. Ppt1−/− P60; *p = 0.0107 WT P60 vs. DR-Ppt1−/− P60; *p = 0.0197 DR-WT P60 vs. DR-Ppt1−/− P60; *p = 0.0178 WT P78 vs. Ppt1−/− P78; ****p < 0.0001 WT P78 vs. DR-Ppt1−/− P78; **p = 0.0040 Ppt1−/− P78 vs. DR-Ppt1−/− P78; ****p < 0.0001 DR-WT P78 vs. DR-Ppt1−/− P78. (F) Quantification of the number of microglia in a 1 mm3 volume of cortical tissue for each group of animals across age. The number of animals in each group is listed on the graph. Two-way ANOVA: no significant interaction (F(9, 22) = 1.288, p = 0.2976); main effect of age (F(3, 22) = 4.618, *p = 0.0119); main effect of genotype/rearing (F(3, 22) = 6.134, **p = 0.0034). Tukey’s multiple comparisons indicated on the graph: *p = 0.0247 WT P78 vs. Ppt1−/− P78; *p = 0.0268 WT P78 vs. DR-Ppt1−/− P78.
Importantly, as early as P33 in the visual cortex, DR-Ppt1−/− microglia exhibited a decrease in the total number of intersections compared to WT cells (Figure 5E). At P42, before any neurological deficit was detected in LR-Ppt1−/− mice, DR-Ppt1−/− mice exhibited significantly reduced microglial processes compared to LR-WT and DR-WT. Moreover, LR-Ppt1−/− animals (Figure 5D,E) demonstrated an acceleration of the neuroinflammatory phenotype in DR animals. This effect was even more robust at P78 (Figure 5D,E). Similar to previous findings (Sadhukhan et al., 2021), we also detected an increase in the number of microglia in LR-Ppt1−/− mice compared to WT counterparts at P78, though this effect was not exacerbated by DR (Figure 5F). These data demonstrate that DR worsens neuroinflammation in the visual cortex of Ppt1−/− mice.
Gliosis and neurodegeneration follow a systematic pattern in CLN1, affecting the thalamus (especially the visual thalamus) before the cortex (Kielar et al., 2007). Therefore, we also examined the neuroinflammatory phenotype of microglia in the dorsal lateral geniculate nucleus (dLGN) at ~P33 before detectable changes occurred in the cortex (Supplementary Figures 3A–C). Microglia in this region are crucial for synaptic refinement during the development of the visual circuit (Shatz, 1990; Katz and Shatz, 1996), so we focused our analysis on microglia at the borders of ipsilateral and contralateral retinal projections reaching the dLGN. We found a subtle but significant change in microglia morphology that suggests an emerging neuroinflammatory phenotype in the dLGN of LR-Ppt1−/− mice (Supplementary Figures 3A–C).
3.6 In vivo induction of synaptic upscaling exacerbates CLN1 disease symptoms
The regulation of synaptic calcium homeostasis, including calcium entry through CP-AMPARs, is crucial for neuronal health and prevention of epileptogenesis (McNamara et al., 2006). In addition, gliosis is not only a histopathological correlate of CLN1 disease progression but is associated with the onset of global symptoms, like seizures, in CLN1 mouse models (Zhang et al., 2022), where it may play a causative role (Vezzani et al., 2022). Having demonstrated an exaggerated synaptic upscaling phenotype, which alters neuronal calcium fluctuation (Koster et al., 2023), as well as exacerbated gliosis in DR-Ppt1−/− animals, we next examined whether these pathophysiological changes influenced CLN1 disease severity.
Indeed, concomitant with excessive synaptic upscaling, the accumulation of AFSM increased in the visual cortex (Figures 6A,B). Furthermore, although dark rearing is known to slightly reduce visual cortical thickness in WT animals (Fifková, 1970; Takács et al., 1992), we observed a statistically significant reduction only in DR-Ppt1−/− mice compared to WT animals raised under standard conditions (Figure 6C). Importantly, mortality occurred significantly earlier because of severe seizures (see Materials and Methods) in DR-Ppt1−/− animals (Figure 6D). Thus, the lack of Ppt1-mediated depalmitoylation drives an exaggerated synaptic upscaling of GluA1 and enhanced neuroinflammation in vivo that corresponds to exacerbated CLN1 pathology. These results are consistent with a substantive connection between aberrant synaptic plasticity and CLN1 disease progression; however, further experiments are required to determine the causative agents (i.e., does excessive CP-AMPAR upregulation itself worsen disease).
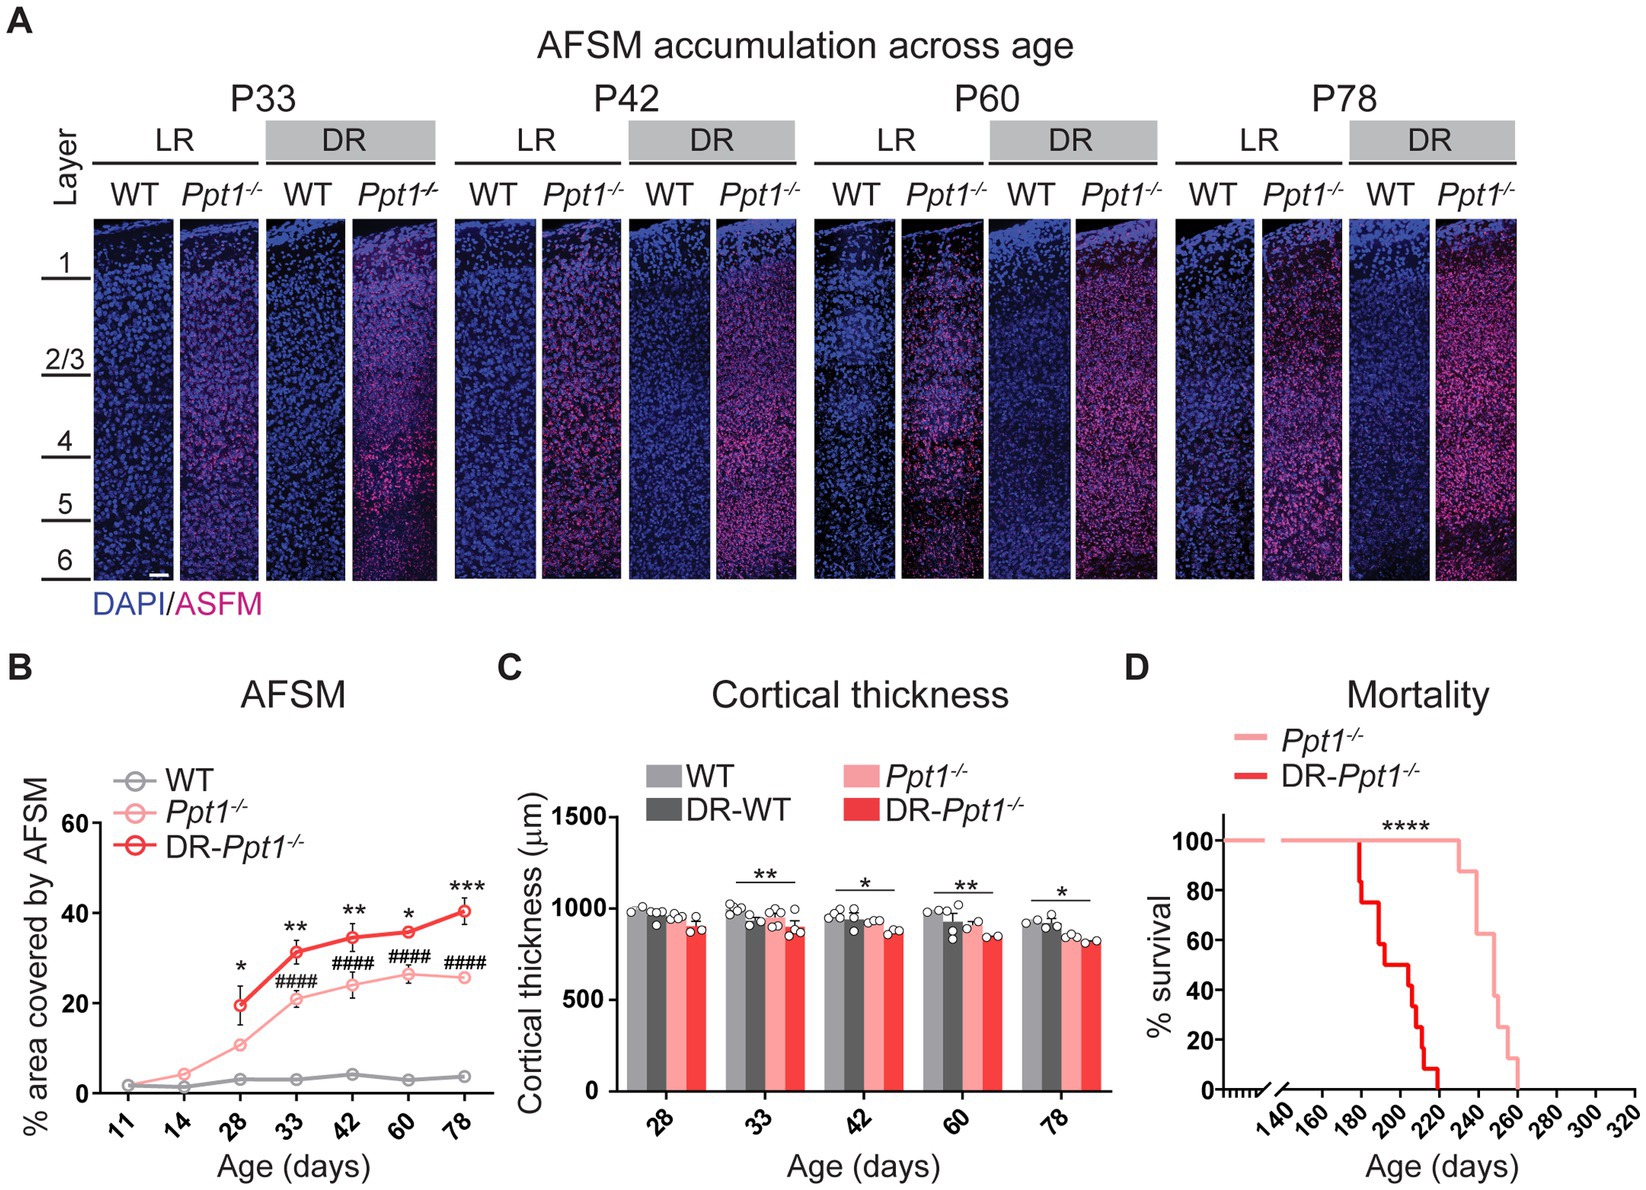
Figure 6. Induction of synaptic upscaling in vivo exacerbates disease pathology in Ppt1−/− mice. (A) Representative mid-sagittal sections of the medial visual cortex from LR-WT, LR-Ppt1−/−, DR-WT, and DR-Ppt1−/− mice showing the accumulation of AFSM with age (postnatal ages 33–78). Scale bar = 50 μm. (B) Quantification of the percent area covered by AFSM. Note that WT and LR-Ppt1−/− data are derived from Koster et al. (2019), but the histology and comparisons were all performed in parallel. Two-way ANOVA: interaction condition (genotype and rearing) × age (F(8, 41) = 3.072, **p = 0.0084); main effect of genotype/rearing (F(2, 41) = 174.5, ****p < 0.0001); main effect of age (F(4, 41) = 13.23, ****p < 0.0001). Tukey’s multiple comparison indicated on the graph: *p = 0.0157 P28 LR-Ppt1−/− vs. P28 DR-Ppt1−/−; **p = 0.0034 P33 LR-Ppt1−/− vs. P33 DR-Ppt1−/−; **p = 0.0030 P42 LR-Ppt1−/− vs. P42 DR-Ppt1−/−; *p = 0.0375 P60 LR-Ppt1−/− vs. P60 DR-Ppt1−/−. ***p = 0.0007 P78 LR-Ppt1−/− vs. P78 DR-Ppt1−/−. Data represent mean ± SEM. N = 3–4 animals/group. (C) Quantification of cortical thickness across age in WT, DR-WT, Ppt1−/−, and DR-Ppt1−/− mice. Two-way ANOVA: no interaction of condition (genotype and rearing) × age (F(12, 43) = 0.4683, p = 0.9223); main effect of genotype/rearing (F(3, 43) = 14.96, ****p < 0.0001); main effect of age (F(4, 43) = 5.330, **p = 0.0014). Tukey’s multiple comparison (simple effect within age) indicated on the graph: **p = 0.0046 P33 LR-WT vs. P33 DR-Ppt1−/−; *p = 0.0241 P42 LR-WT vs. P42 DR-Ppt1−/−; **p = 0.0078 P60 LR-WT vs. P60 DR-Ppt1−/−; *p = 0.0466 P78 LR-WT vs. P78 DR-Ppt1−/−; *p = 0.0401 P78 DR-WT vs. P78 DR-Ppt1−/−. Number of animals for each group (N = 2–5) is displayed on the graph (individual points). Data represent mean ± SEM. (D) Kaplan–Meier plot of mortality in LR-Ppt1−/− and DR-Ppt1−/− mice. Log-rank (Mantel-Cox) test: ****p < 0.0001 LR-Ppt1−/− vs. DR-Ppt1−/−. N = 6 Ppt1−/−, 10 for DR-Ppt1−/−.
3.7 FK506 treatment subtly improves neuroinflammation in Ppt1−/− mice
Considering that the Akap5 complex is dysregulated in the Ppt1−/− brain, NFAT activation is sensitized in upscaled Ppt1−/− neurons, and in vivo induction of synaptic upscaling exacerbates disease symptoms, we reasoned that suppressing calcineurin activity should alleviate CLN1 progression. Therefore, we treated Ppt1−/− animals from 1 to 4 months of age with the calcineurin inhibitor, FK506 (3 mg/kg dissolved in drinking water), which is an FDA-approved immunosuppressant under the trade names Tacrolimus or Prograf. Passive administration of FK506 in Ppt1−/− mice demonstrated no effect on the degree of AFSM accumulation (Figures 7A,B). In addition, FK506 did not significantly suppress microglial activation as measured by the total number of intersections with a Sholl analysis (Figure 7C). However, further scrutiny of the data indicated that while inflammatory activation of microglia in both vehicle- and FK506-treated Ppt1−/− mice was robust, FK506 treatment suppressed the transformation of microglia into a fully ameboid phenotype (Figure 7A). Accordingly, comparison of the Sholl profile (Figure 7D, left) revealed a greater number of microglia with ramifications at intermediate distances from the cell soma, which were largely absent in vehicle-treated mice (Figure 7D, right). Finally, as motor dysfunction is a primary symptom of CLN1 in humans and mice (Gupta et al., 2003; Dearborn et al., 2015; Nita et al., 2016), we next tested whether FK506 treatment improves motor symptoms in Ppt1−/− mice using a Rotarod assay. Under these conditions, FK506 treatment appeared to slightly improve motor behavior compared to vehicle-treated Ppt1−/− counterparts, though the effect did not quite reach statistical significance (p = 0.059, Student’s t-test vs. vehicle-treated Ppt1−/− mice) (Figure 7E). Collectively, these results show that suppressing calcineurin activity via FK506 treatment may modestly slow neuroinflammatory progression in Ppt1−/− mice.
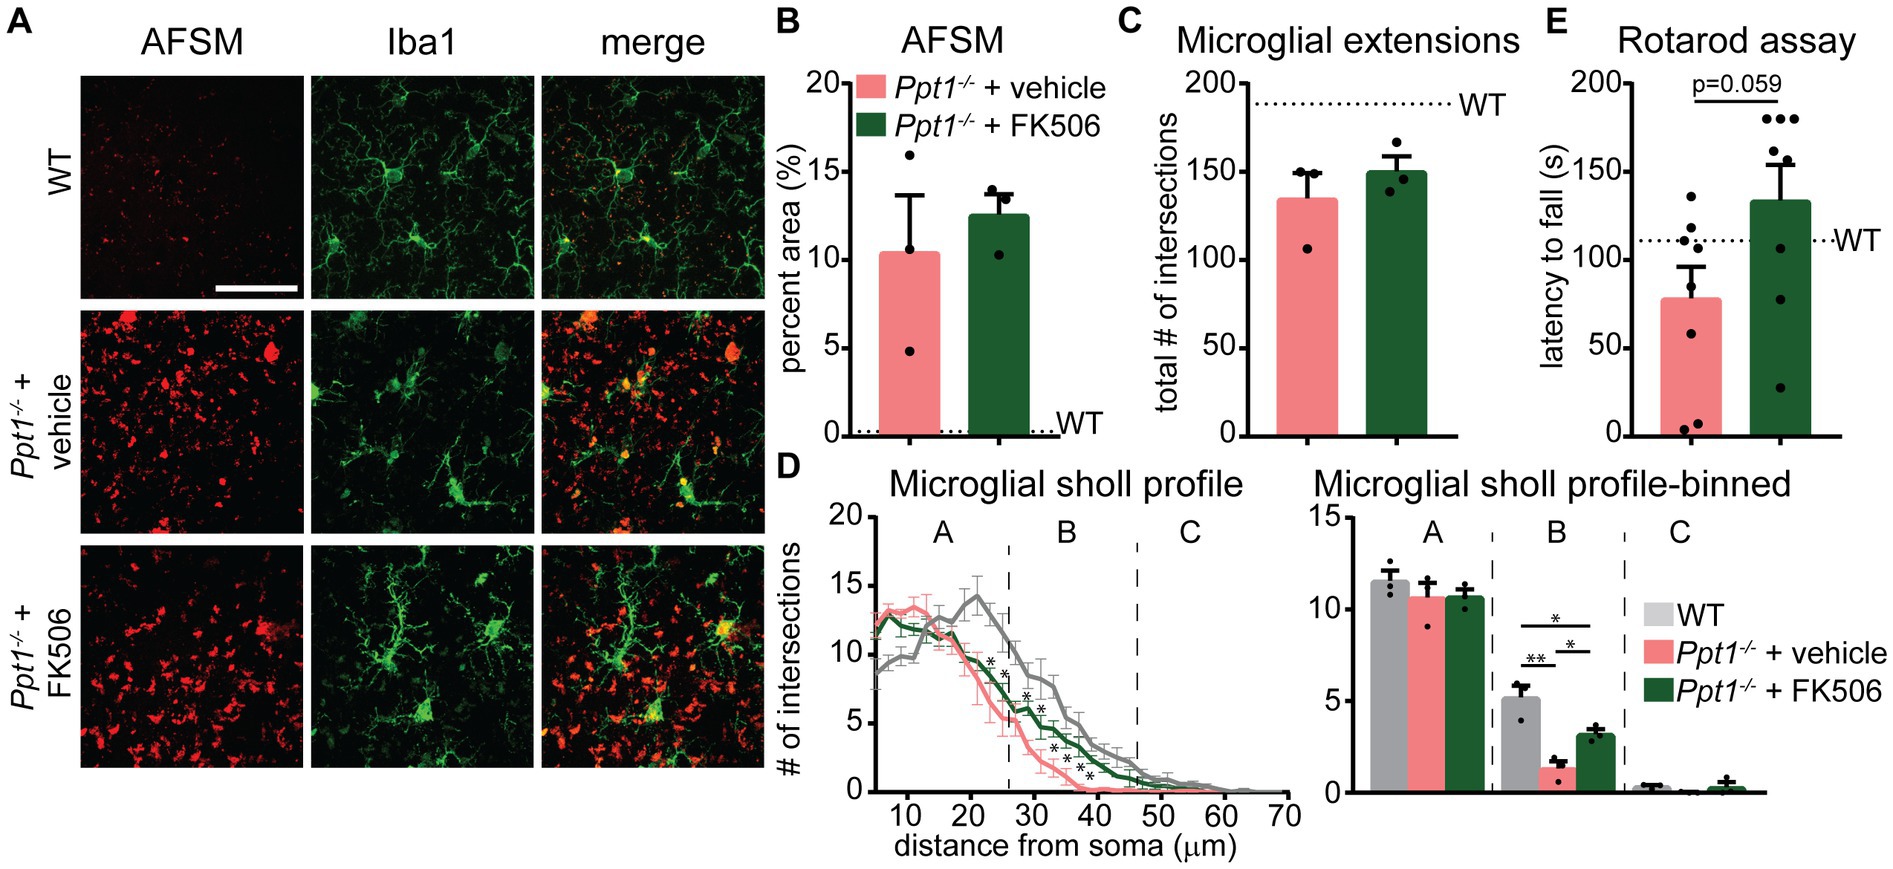
Figure 7. FK506 treatment subtly improves neuroinflammation in Ppt1−/− mice. (A) Representative images of AFSM accumulation (red) and Iba-immunostaining of microglia (green) in the visual cortex of WT, vehicle-treated Ppt1−/−, and FK506-treated Ppt1−/− mice at 4 months of age. Scale = 50 μm. (B) Quantification of the percent area occupied by AFSM puncta in WT (represented by dashed horizontal line), vehicle-treated Ppt1−/−, and FK506-treated Ppt1−/− mice. (C) Quantification of the total number of microglial intersections with a Sholl analysis, a measure of microglial ramification, in WT (represented by dashed horizontal line), vehicle-treated Ppt1−/−, and FK506-treated Ppt1−/− mice. (D) Left, Sholl profile of microglial ramification in WT, vehicle-treated Ppt1−/−, and FK506-treated Ppt1−/− mice. *p < 0.05 vehicle-treated Ppt1−/− mice vs. FK506-treated Ppt1−/− mice at each distance from the soma by t-tests. See Table 3 for full statistics. Right, the same data shown in the Sholl profile but represented as three bins [near, intermediate, and distant from the soma, represented by panels (A–C), respectively]. One-way ANOVA within bin B: F(2, 6) = 18.19, **p = 0.0028. Holm–Sidak multiple comparisons on the graph: *p = 0.0028 WT vs. vehicle-treated Ppt1−/− mice, *p = 0.0413 WT vs. FK506-treated Ppt1−/− mice, *p = 0.0413 vehicle-treated Ppt1−/− mice vs. FK506-treated Ppt1−/− mice. (E) Quantification of rotarod performance in WT (represented by dashed horizontal line), vehicle-treated Ppt1−/−, and FK506-treated Ppt1−/− mice at 4 months. p = 0.059 vehicle-treated Ppt1−/− mice vs. FK506-treated Ppt1−/− mice by t-test.
4 Discussion
We demonstrate herein that synaptic upscaling of GluA1 is exaggerated in DR-Ppt1−/− mice and correlates with an acceleration of disease progression that includes increased neuroinflammation and earlier mortality. Palmitoyl-proteomics profiling revealed a widespread, albeit subtle, over-palmitoylation of many synaptic proteins in Ppt1−/− visual cortical synaptosomes and implicated the scaffolding protein Akap5 and its associated signaling molecules. Further scrutiny of this pathway demonstrated that NFAT activation is increased in Ppt1−/− neurons in response to neuronal stimulation, particularly through CP-AMPARs, and provoked us to test the efficacy of FK506 oral administration in Ppt1−/− mice. Passive administration of FK506 provided subtle histopathological benefits, emphasizing the need for larger cohort studies employing FK506 in CLN1 mouse models. Taken together, our data reveal Akap5 as a potential mechanistic link between initial disease-driven changes to synaptic function and downstream neuroinflammation in CLN.
There are several limitations to the current study. For instance, we did not examine whether GluA1 palmitoylation increased with induction of synaptic upscaling in DR animals, and therefore did not corroborate our previous in vitro findings (Koster et al., 2023). Similarly, it will be important to know whether Akap5 palmitoylation increases during synaptic scaling. Surely, future experiments on the relationship between synaptic protein palmitoylation and synaptic scaling should prioritize these molecules using manipulations that allow a causative interpretation (e.g., palmitoylation-deficient Akap5), which we failed to do. Furthermore, by performing palmitoyl-proteomics at a single timepoint, particularly in young mice, we failed to capture statistically significant changes to the palmitoylation of synaptic proteins in Ppt1−/− animals. Fortunately, the analyses pointed to Akap5 and associated pathways as being dysregulated in Ppt1−/− brains, but we cannot rule out that these analyses may have missed additional, perhaps equally important, signaling pathways that underpin the progression of CLN1. Indeed, protein kinase A is also anchored by Akap5 and known to regulate synaptic scaling (Goel et al., 2011; Diering et al., 2014), representing an attractive target for future studies on how Ppt1 activity might influence AMPAR trafficking. Finally, although we demonstrate that excessive synaptic upscaling in Ppt1−/− neurons is associated with an exacerbation of disease features in vivo, further experiments are required to directly tie these phenomena together. Below, we focus our discussion on the positive data we were able to obtain.
4.1 Palmitoyl-proteomics links synaptic dysfunction to neuroinflammation
While we maintain that over-palmitoylation of GluA1 likely contributes to the increased incorporation of CP-AMPARs at upscaled Ppt1−/− synapses (Koster et al., 2023), we demonstrate here that Akap5 is also hyperpalmitoylated in Ppt1−/− synaptosomes. Thus, the increased synaptic incorporation of GluA1 during upscaling may also arise from enhanced scaffolding by Akap5. Previous experiments implicate Akap5 in the regulation of CP-AMPARs during synaptic scaling (Sanderson et al., 2018). In addition, palmitoylation of Akap5 is required for the postsynaptic insertion of CP-AMPARs during LTP (Purkey et al., 2018); although this study also notes that palmitoylated Akap5 limits the synaptic incorporation of CP-AMPARs under basal conditions, suggesting that Akap5 palmitoylation differentially effects CP-AMPAR trafficking dynamics at a steady state compared to bouts of plasticity. Akap5 also requires depalmitoylation for its removal from the postsynaptic site and undergoes ubiquitination to downregulate GluA1-containing AMPARs during chemical LTD (Woolfrey et al., 2018; Cheng et al., 2020). Therefore, we anticipate that Akap5 normally undergoes depalmitoylation-dependent degradation (Cheng et al., 2020) and that this mechanism is diminished in Ppt1−/− neurons. Consequently, we postulate that overly palmitoylated Akap5 harbors an enlarged perisynaptic pool of CP-AMPARs that is mobilized during synaptic upscaling in Ppt1−/− neurons either at the extrasynapse or dendritic endosomes (He et al., 2009; Diering et al., 2014). Recent detailed analysis of the synaptic and perisynaptic localization of palmitoylated Akap5 agrees with such a notion (Chen et al., 2022).
Our data also indicate that the over-palmitoylation of Akap5 leads to a sensitization of the NFAT transcriptional program in Ppt1−/− neurons. Not only does this provide a mechanistic link between synaptic alterations and gliosis in CLN1 (Jalanko et al., 2005; Kielar et al., 2007; Macauley et al., 2009, 2011, 2014), but, in addition, the calcineurin-NFAT pathway itself mediates synaptic scaling through the turnover of CP-AMPARs (Kim and Ziff, 2014). Therefore, mis-localization of Akap5 or impaired interactions with calcineurin due to loss of Ppt1 likely drives over-activation of NFAT-dependent transcription, causing a vicious cycle of exaggerated upscaling of CP-AMPARs in the Ppt1−/− brain. In sum, several related mechanisms may collaborate to drive exaggeration of CP-AMPAR incorporation during synaptic scaling up in Ppt1−/− neurons.
4.2 Dark rearing exacerbates CLN1 pathology: contribution of exaggerated synaptic upscaling
One motivation for employing the DR paradigm in Ppt1−/− mice was brought on by previous work, which demonstrated that dark-rearing mouse models of other developmental disorders, like Rett and Angelman syndromes, mitigated disease symptoms (Yashiro et al., 2009; Durand et al., 2012). Accordingly, we originally anticipated an improvement in CLN1 pathophysiology in DR-Ppt1−/− mice. However, our study demonstrates that DR-Ppt1−/− animals have the opposite effect, exacerbating several markers of disease progression, including mortality. Why might this be the case?
Before the demonstration of its beneficial effects in neurodevelopmental disease models, DR was established as a model of synaptic upscaling in vivo (Goel et al., 2006, 2011; Goel and Lee, 2007). Here, we corroborate these data by demonstrating that DR of Ppt1−/− mice exaggerates synaptic upscaling of GluA1, extending our previous findings (Koster et al., 2023) that used exogenous manipulations (e.g., TTX induction of upscaling). This is precisely the opposite effect conferred by loss of either Ube3a (Angelman syndrome) or MeCP2 (Rett syndrome), which suppresses upscaling (Blackman et al., 2012; Qiu et al., 2012; Pastuzyn and Shepherd, 2017). Therefore, we postulate that the opposing effects of DR on disease pathology in CLN1 versus Rett or Angelman syndrome mice arise from the differential impact that the proteins mutated in these conditions have on synaptic scaling. In other words, whereas DR alleviated symptoms in Rett and Angelman syndrome mice in part by overcoming the stagnation of synaptic upscaling, this same manipulation proved detrimental in the CLN1 model because it facilitated an exaggerated synaptic upscaling. Still, taking the broader context reveals that several proteins implicated in neurodevelopmental disorders regulate the common pathway of synaptic scaling and imply that normalizing synaptic scaling dynamics might alleviate disease symptoms.
4.3 Implications for CLN1 progression and therapeutic intervention
The sensitization of calcineurin-NFAT activity in Ppt1−/− neurons represents a new therapeutic target in CLN1 that has a history of being inhibited in other conditions requiring immunosuppression with FDA-approved drugs such as Tacrolimus (FK506) and cyclosporin. Drug repurposing is a major priority of the FDA (along with the incentives for orphan drug discovery) due to the economics and relative speed of getting potential therapeutics to patients relative to the traditional approach, which typically takes hundreds of millions of dollars and 10 or more years. Therefore, our demonstration here that FK506 has beneficial effects in CLN1 mice is a substantial first step toward its use in the clinic for patients suffering from CLN1. Although we observed quite a modest effect here, we offer the following caveat. Our aim was to perform a small pilot study of FK506 efficacy that employed several readouts, not just histology or behavior, but both, and as such, we chose a terminal time point for our cohort of 4 months with the hope of capturing such an effect. However, motor deficits in Ppt1−/− mice emerge between 3 and 5 months, often reaching statistical significance by the 5-month mark (Macauley et al., 2009; Groh et al., 2021), while our own data show that neuroinflammation is robust by 3 months. Therefore, by attempting to capture the potential effects of FK506 across these two measures, we may have limited our power to detect either. Accordingly, our data warrant further, more detailed study of FK506 in CLN1.
Interestingly, Tacrolimus has demonstrated beneficial effects in multiple animal models of aging or neurodegeneration (Radhakrishnan et al., 2021; Fracassi et al., 2022; Sordo et al., 2022) and was the subject of an open-label clinical trial (NCT04263519). Moreover, human patients prescribed calcineurin inhibitors, including Tacrolimus, show reduced prevalence of developing Alzheimer’s disease (Silva et al., 2023). These studies suggest Tacrolimus or next-generation analogs may be a promising intervention in multiple neurodegenerative diseases. Future studies focused on testing the efficacy of FK506 or other calcineurin-directed therapeutics in a larger preclinical setting or in CLN1 patients will be of great interest.
In conclusion, we demonstrate here with an interdisciplinary approach how failed protein depalmitoylation disrupts synaptic plasticity via impaired proteostasis and triggers neuroinflammatory signaling that underlies a devastating disease. Importantly, these findings offer multiple novel targets for therapeutic intervention, at least one of which (calcineurin inhibitors) can benefit from the FDA and clinical priority to repurpose well-tolerated drugs and can therefore be more rapidly tested in suffering patients.
Data availability statement
The original contributions presented in the study are publicly available. This data can be found at: https://massive.ucsd.edu/ProteoSAFe/dataset.jsp?task=e9c851fbf5214e1d8f257a9f390614e3.
Ethics statement
The animal study was approved by University of Illinois of Chicago Institutional Animal Care and Use Committee. The study was conducted in accordance with the local legislation and institutional requirements.
Author contributions
KK: Conceptualization, Data curation, Formal analysis, Investigation, Methodology, Visualization, Writing – original draft, Writing – review & editing. ZF: Formal analysis, Investigation, Writing – review & editing, Writing – original draft. TN: Formal analysis, Investigation, Methodology, Writing – review & editing, Writing – original draft. AN: Formal analysis, Writing – review & editing, Writing – original draft. LN-G: Formal analysis, Writing – review & editing, Writing – original draft. KW: Methodology, Resources, Writing – original draft, Writing – review & editing. MD: Methodology, Resources, Writing – original draft, Writing – review & editing. SC: Conceptualization, Methodology, Supervision, Writing – original draft, Writing – review & editing. AY: Conceptualization, Data curation, Formal analysis, Funding acquisition, Resources, Supervision, Writing – original draft, Writing – review & editing.
Funding
The author(s) declare that financial support was received for the research, authorship, and/or publication of this article. This study was supported by startup funding awarded to AY by the University of Illinois at Chicago, Department of Anatomy and Cell Biology, and to SC by the University of Illinois at Chicago, Department of Chemistry. In addition, this study was supported by NIA grants R43AG072984 to AY and R01NS040701 to MD.
In memoriam
This article is dedicated to Dr. Akira Yoshii, MD, PhD, who sadly passed away in March of 2023 during its preparation.
Conflict of interest
The authors declare that the research was conducted in the absence of any commercial or financial relationships that could be construed as a potential conflict of interest.
Publisher’s note
All claims expressed in this article are solely those of the authors and do not necessarily represent those of their affiliated organizations, or those of the publisher, the editors and the reviewers. Any product that may be evaluated in this article, or claim that may be made by its manufacturer, is not guaranteed or endorsed by the publisher.
Supplementary material
The Supplementary material for this article can be found online at: https://www.frontiersin.org/articles/10.3389/fnsyn.2024.1384625/full#supplementary-material
SUPPLEMENTARY FIGURE S1 | SynGo and network analysis of palmitoyl-proteomics from visual cortical lysates. (A) Top 10 enriched SynGO terms from proteins increased 1.2-fold in Ppt1−/− visual cortical lysates. (B) Network analysis of the genes increased in Ppt1−/− lysates by 1.2-fold that were annotated with the top biological process SynGO term “process at the synapse.
SUPPLEMENTARY FIGURE S2 | GluN2B palmitoylation is increased in Ppt1−/− visual cortical synaptosomes. Representative immunoblots (left) and quantification of the palmitoylated/non-palmitoylated ratio (normalized to β-actin, right) of GluN2B in APEGS-processed visual cortical synaptosomes at P42. t-test: *p = 0.0396. n = 3 mice/group.
SUPPLEMENTARY FIGURE S3 | Emerging neuroinflammation in dLGN of young Ppt1−/− mice. (A) Schematic of the injection paradigm for measurement of microglial morphology at the border between ipsilateral and contralateral retinogeniculate projections. (B) Representative images of CTB 488, CTB 555, and Iba1 immunostaining in the dLGN of a WT and Ppt1−/− mouse. Scale = 50 μm. (C) Sholl analysis profile of microglia (Iba1) morphology in WT and Ppt1−/− dLGN between P21 and P42 (see Table 2).
Footnotes
References
Atiskova, Y., Bartsch, S., Danyukova, T., Becker, E., Hagel, C., Storch, S., et al. (2019). Mice deficient in the lysosomal enzyme palmitoyl-protein thioesterase 1 (PPT1) display a complex retinal phenotype. Sci. Rep. 9:14185. doi: 10.1038/s41598-019-50726-8
Blackman, M., Djukic, B., Nelson, S., and Turrigiano, G. (2012). A critical and cell-autonomous role for MeCP2 in synaptic scaling up. J. Neurosci. 32, 13529–13536. doi: 10.1523/jneurosci.3077-12.2012
Brandao, K. E., Dell’Acqua, M. L., and Levinson, R. S. (2012). A-kinase anchoring protein 150 expression in a specific subset of TRPV1- and CaV1.2-positive nociceptive rat dorsal root ganglion neurons. J. Comp. Neurol. 520, 81–99. doi: 10.1002/cne.22692
Camp, L., Verkruyse, L., Afendis, S., Slaughter, C., and Hofmann, S. (1994). Molecular cloning and expression of palmitoyl-protein thioesterase. J. Biol. Chem. 269, 23212–23219. doi: 10.1016/S0021-9258(17)31641-1
Cao, S., and Kaufman, R. J. (2012). Unfolded protein response. Curr. Biol. 22, R622–R626. doi: 10.1016/j.cub.2012.07.004
Chandra, G., Bagh, M. B., Peng, S., Saha, A., Sarkar, C., Moralle, M., et al. (2015). Cln1 gene disruption in mice reveals a common pathogenic link between two of the most lethal childhood neurodegenerative lysosomal storage disorders. Hum. Mol. Genet. 24, 5416–5432. doi: 10.1093/hmg/ddv266
Chen, X., Crosby, K. C., Feng, A., Purkey, A. M., Aronova, M. A., Winters, C. A., et al. (2022). Palmitoylation of A-kinase anchoring protein 79/150 modulates its nanoscale organization, trafficking, and mobility in postsynaptic spines. Front. Synaptic Neurosci. 14:1004154. doi: 10.3389/fnsyn.2022.1004154
Cheng, W., Siedlecki-Wullich, D., Català-Solsona, J., Fábregas, C., Fadó, R., Casals, N., et al. (2020). Proteasomal-mediated degradation of AKAP150 accompanies AMPAR endocytosis during cLTD. Eneuro 7:ENEURO.0218-19.2020. doi: 10.1523/eneuro.0218-19.2020
Colledge, M., Dean, R. A., Scott, G. K., Langeberg, L. K., Huganir, R. L., and Scott, J. D. (2000). Targeting of PKA to glutamate receptors through a MAGUK-AKAP complex. Neuron 27, 107–119. doi: 10.1016/s0896-6273(00)00013-1
Dearborn, J. T., Harmon, S. K., Fowler, S. C., O’Malley, K. L., Taylor, G. T., Sands, M. S., et al. (2015). Comprehensive functional characterization of murine infantile batten disease including Parkinson-like behavior and dopaminergic markers. Sci. Rep. 5:12752. doi: 10.1038/srep12752
Diering, G. H., Gustina, A. S., and Huganir, R. L. (2014). PKA-GluA1 coupling via AKAP5 controls AMPA receptor phosphorylation and cell-surface targeting during bidirectional homeostatic plasticity. Neuron 84, 790–805. doi: 10.1016/j.neuron.2014.09.024
Drisdel, R. C., and Green, W. N. (2004). Labeling and quantifying sites of protein palmitoylation. BioTechniques 36, 276–285. doi: 10.2144/04362rr02
Durand, S., Patrizi, A., Quast, K. B., Hachigian, L., Pavlyuk, R., Saxena, A., et al. (2012). NMDA receptor regulation prevents regression of visual cortical function in the absence of Mecp2. Neuron 76, 1078–1090. doi: 10.1016/j.neuron.2012.12.004
Fifková, E. (1970). The effect of unilateral deprivation on visual centers in rats. J. Comp. Neurol. 140, 431–438. doi: 10.1002/cne.901400404
Finn, R., Kovács, A. D., and Pearce, D. A. (2012). Altered glutamate receptor function in the cerebellum of the Ppt1−/− mouse, a murine model of infantile neuronal ceroid lipofuscinosis. J. Neurosci. Res. 90, 367–375. doi: 10.1002/jnr.22763
Fracassi, A., Marcatti, M., Saieva, S., and Taglialatela, G. (2022). Chronic FK506 treatment reduces amyloid β and tau levels in the hippocampus and cortex of 3xTg-AD mice. Alzheimers Dement. 18. doi: 10.1002/alz.061984
Fukata, Y., and Fukata, M. (2010). Protein palmitoylation in neuronal development and synaptic plasticity. Nat. Rev. Neurosci. 11, 161–175. doi: 10.1038/nrn2788
Fukata, M., Fukata, Y., Adesnik, H., Nicoll, R. A., and Bredt, D. S. (2004). Identification of PSD-95 palmitoylating enzymes. Neuron 44, 987–996. doi: 10.1016/j.neuron.2004.12.005
Gehrmann, J., Matsumoto, Y., and Kreutzberg, G. W. (1995). Microglia: intrinsic immuneffector cell of the brain. Brain Res. Rev. 20, 269–287. doi: 10.1016/0165-0173(94)00015-h
Giulian, D. (1987). Ameboid microglia as effectors of inflammation in the central nervous system. J. Neurosci. Res. 18, 155–171. doi: 10.1002/jnr.490180123
Goel, A., Jiang, B., Xu, L. W., Song, L., Kirkwood, A., and Lee, H.-K. (2006). Cross-modal regulation of synaptic AMPA receptors in primary sensory cortices by visual experience. Nat. Neurosci. 9, 1001–1003. doi: 10.1038/nn1725
Goel, A., and Lee, H.-K. (2007). Persistence of experience-induced homeostatic synaptic plasticity through adulthood in superficial layers of mouse visual cortex. J. Neurosci. Official J. Soc. Neurosci. 27, 6692–6700. doi: 10.1523/jneurosci.5038-06.2007
Goel, A., Xu, L. W., Snyder, K. P., Song, L., Goenaga-Vazquez, Y., Megill, A., et al. (2011). Phosphorylation of AMPA receptors is required for sensory deprivation-induced homeostatic synaptic plasticity. PLoS One 6:e18264. doi: 10.1371/journal.pone.0018264
Gómez-Sintes, R., and Lucas, J. J. (2010). NFAT/Fas signaling mediates the neuronal apoptosis and motor side effects of GSK-3 inhibition in a mouse model of lithium therapy. J. Clin. Invest. 120, 2432–2445. doi: 10.1172/jci37873
Gorenberg, E. L., Tieze, S., Yücel, B., Zhao, H. R., Chou, V., Wirak, G. S., et al. (2022). Identification of substrates of palmitoyl protein thioesterase 1 highlights roles of depalmitoylation in disulfide bond formation and synaptic function. PLoS Biol. 20:e3001590. doi: 10.1371/journal.pbio.3001590
Groh, J., Berve, K., and Martini, R. (2021). Immune modulation attenuates infantile neuronal ceroid lipofuscinosis in mice before and after disease onset. Brain Commun. 3:fcab047. doi: 10.1093/braincomms/fcab047
Gupta, P., Soyombo, A., Atashband, A., Wisniewski, K., Shelton, J., Richardson, J., et al. (2001). Disruption of PPT1 or PPT2 causes neuronal ceroid lipofuscinosis in knockout mice. Proc. Natl. Acad. Sci. U. S. A. 98, 13566–13571. doi: 10.1073/pnas.251485198
Gupta, P., Soyombo, A. A., Shelton, J. M., Wilkofsky, I. G., Wisniewski, K. E., Richardson, J. A., et al. (2003). Disruption of PPT2 in mice causes an unusual lysosomal storage disorder with neurovisceral features. Proc. Natl. Acad. Sci. U. S. A. 100, 12325–12330. doi: 10.1073/pnas.2033229100
Haltia, M. (2003). The neuronal ceroid-Lipofuscinoses. J. Neuropathol. Exp. Neurol. 62, 1–13. doi: 10.1093/jnen/62.1.1
He, K., Song, L., Cummings, L. W., Goldman, J., Huganir, R. L., and Lee, H.-K. (2009). Stabilization of Ca2+−permeable AMPA receptors at perisynaptic sites by GluR1-S845 phosphorylation. Proc. Natl. Acad. Sci. U. S. A. 106, 20033–20038. doi: 10.1073/pnas.0910338106
Jalanko, A., Vesa, J., Manninen, T., von Schantz, C., Minye, H., Fabritius, A.-L., et al. (2005). Mice with Ppt1Deltaex4 mutation replicate the INCL phenotype and show an inflammation-associated loss of interneurons. Neurobiol. Dis. 18, 226–241. doi: 10.1016/j.nbd.2004.08.013
Jayanthi, S., Deng, X., Ladenheim, B., McCoy, M. T., Cluster, A., Cai, N., et al. (2005). Calcineurin/NFAT-induced up-regulation of the Fas ligand/Fas death pathway is involved in methamphetamine-induced neuronal apoptosis. Proc. Natl. Acad. Sci. U. S. A. 102, 868–873. doi: 10.1073/pnas.0404990102
Kanadome, T., Yokoi, N., Fukata, Y., and Fukata, M. (2019). Systematic screening of depalmitoylating enzymes and evaluation of their activities by the acyl-PEGyl exchange gel-shift (APEGS) assay. Methods Mol. Biol. 2009, 83–98. doi: 10.1007/978-1-4939-9532-5_7
Katz, L., and Shatz, C. (1996). Synaptic activity and the construction of cortical circuits. Science 274, 1133–1138. doi: 10.1126/science.274.5290.1133
Kielar, C., Maddox, L., Bible, E., Pontikis, C. C., Macauley, S. L., Griffey, M. A., et al. (2007). Successive neuron loss in the thalamus and cortex in a mouse model of infantile neuronal ceroid lipofuscinosis. Neurobiol. Dis. 25, 150–162. doi: 10.1016/j.nbd.2006.09.001
Kim, S., and Ziff, E. B. (2014). Calcineurin mediates synaptic scaling via synaptic trafficking of Ca2+-permeable AMPA receptors. PLoS Biol. 12:e1001900. doi: 10.1371/journal.pbio.1001900
Koike, M., Iino, M., and Ozawa, S. (1997). Blocking effect of 1-naphthyl acetyl spermine on Ca2+−permeable AMPA receptors in cultured rat hippocampal neurons. Neurosci. Res. 29, 27–36. doi: 10.1016/s0168-0102(97)00067-9
Koopmans, F., van Nierop, P., Andres-Alonso, M., Byrnes, A., Cijsouw, T., Coba, M. P., et al. (2019). SynGO: an evidence-based, expert-curated knowledge base for the synapse. Neuron 103, 217–234.e4. doi: 10.1016/j.neuron.2019.05.002
Koster, K. P., Flores-Barrera, E., de la Villarmois, E. A., Caballero, A., Tseng, K. Y., and Yoshii, A. (2023). Loss of Depalmitoylation disrupts homeostatic plasticity of AMPARs in a mouse model of infantile neuronal ceroid lipofuscinosis. J. Neurosci. 43, 8317–8335. doi: 10.1523/jneurosci.1113-23.2023
Koster, K. P., Francesconi, W., Berton, F., Alahmadi, S., Srinivas, R., and Yoshii, A. (2019). Developmental NMDA receptor dysregulation in the infantile neuronal ceroid lipofuscinosis mouse model. Elife 8:e40316. doi: 10.7554/elife.40316
Koster, K. P., and Yoshii, A. (2019). Depalmitoylation by palmitoyl-protein thioesterase 1 in neuronal health and degeneration. Front. Synaptic Neurosci. 11:25. doi: 10.3389/fnsyn.2019.00025
Labbadia, J., and Morimoto, R. I. (2014). The biology of proteostasis in aging and disease. Annu. Rev. Biochem. 84, 435–464. doi: 10.1146/annurev-biochem-060614-033955
Levental, I., Grzybek, M., and Simons, K. (2010). Greasing their way: lipid modifications determine protein association with membrane rafts. Biochemistry 49, 6305–6316. doi: 10.1021/bi100882y
Li, H., Pink, M. D., Murphy, J. G., Stein, A., Dell’Acqua, M. L., and Hogan, P. G. (2012). Balanced interactions of calcineurin with AKAP79 regulate Ca2+−calcineurin–NFAT signaling. Nat. Struct. Mol. Biol. 19, 337–345. doi: 10.1038/nsmb.2238
Liang, Y. (2019). Emerging concepts and functions of autophagy as a regulator of synaptic components and plasticity. Cells 8:34. doi: 10.3390/cells8010034
Lie, P. P. Y. P., and Nixon, R. A. (2018). Lysosome trafficking and signaling in health and neurodegenerative diseases. Neurobiol. Dis. 122, 94–105. doi: 10.1016/j.nbd.2018.05.015
Luoma, J. I., and Zirpel, L. (2008). Deafferentation-induced activation of NFAT (nuclear factor of activated T-cells) in cochlear nucleus neurons during a developmental critical period: a role for NFATc4-dependent apoptosis in the CNS. J. Neurosci. 28, 3159–3169. doi: 10.1523/jneurosci.5227-07.2008
Macauley, S. L., Pekny, M., and Sands, M. S. (2011). The role of attenuated astrocyte activation in infantile neuronal ceroid lipofuscinosis. J. Neurosci. 31, 15575–15585. doi: 10.1523/jneurosci.3579-11.2011
Macauley, S. L., Wong, A. M. S., Shyng, C., Augner, D. P., Dearborn, J. T., Pearse, Y., et al. (2014). An anti-neuroinflammatory that targets dysregulated glia enhances the efficacy of CNS-directed gene therapy in murine infantile neuronal ceroid lipofuscinosis. J. Neurosci. 34, 13077–13082. doi: 10.1523/jneurosci.2518-14.2014
Macauley, S. L., Wozniak, D. F., Kielar, C., Tan, Y., Cooper, J. D., and Sands, M. S. (2009). Cerebellar pathology and motor deficits in the palmitoyl protein thioesterase 1-deficient mouse. Exp. Neurol. 217, 124–135. doi: 10.1016/j.expneurol.2009.01.022
McNamara, J. O., Huang, Y. Z., and Leonard, A. S. (2006). Molecular signaling mechanisms underlying epileptogenesis. Sci.’s STKE 2006:re12. doi: 10.1126/stke.3562006re12
Minematsu, H., Shin, M. J., Aydemir, A. B. C., Kim, K.-O., Nizami, S. A., Chung, G.-J., et al. (2011). Nuclear presence of nuclear factor of activated T cells (NFAT) c3 and c4 is required for toll-like receptor-activated innate inflammatory response of monocytes/macrophages. Cell. Signal. 23, 1785–1793. doi: 10.1016/j.cellsig.2011.06.013
Murphy, J. G., Crosby, K. C., Dittmer, P. J., Sather, W. A., and Dell’Acqua, M. L. (2019). AKAP79/150 recruits the transcription factor NFAT to regulate signaling to the nucleus by neuronal L-type Ca 2+ channels. Mol. Biol. Cell 30, 1743–1756. doi: 10.1091/mbc.e19-01-0060
Murphy, J. G., Sanderson, J. L., Gorski, J. A., Scott, J. D., Catterall, W. A., Sather, W. A., et al. (2014). AKAP-anchored PKA maintains neuronal L-type calcium channel activity and NFAT transcriptional signaling. Cell Rep. 7, 1577–1588. doi: 10.1016/j.celrep.2014.04.027
Muthuraman, A., and Sood, S. (2010). Pharmacological evaluation of tacrolimus (FK-506) on ischemia reperfusion induced vasculatic neuropathic pain in rats. J. Brachial Plex. Peripher. Nerve Inj. 5:13. doi: 10.1186/1749-7221-5-13
Nagamoto-Combs, K., and Combs, C. K. (2010). Microglial phenotype is regulated by activity of the transcription factor, NFAT (nuclear factor of activated T cells). J. Neurosci. 30, 9641–9646. doi: 10.1523/jneurosci.0828-10.2010
Nandi, D., Tahiliani, P., Kumar, A., and Chandu, D. (2006). The ubiquitin-proteasome system. J. Biosci. 31, 137–155. doi: 10.1007/bf02705243
Nguyen, T. T. A., Li, W., Park, T. J., Gong, L.-W., and Cologna, S. M. (2019). Investigating phosphorylation patterns of the ion channel TRPM7 using multiple extraction and enrichment techniques reveals new phosphosites. J. Am. Soc. Mass. Spectr. 30, 1359–1367. doi: 10.1007/s13361-019-02223-5
Nita, D. A., Mole, S. E., and Minassian, B. A. (2016). Neuronal ceroid lipofuscinoses. Epileptic Disord. 18, 73–88. doi: 10.1684/epd.2016.0844
Nixon, R. A. (2013). The role of autophagy in neurodegenerative disease. Nat. Med. 19, 983–997. doi: 10.1038/nm.3232
Noritake, J., Fukata, Y., Iwanaga, T., Hosomi, N., Tsutsumi, R., Matsuda, N., et al. (2009). Mobile DHHC palmitoylating enzyme mediates activity-sensitive synaptic targeting of PSD-95. J. Cell Biol. 186, 147–160. doi: 10.1083/jcb.200903101
O’Brien, R. J., Kamboj, S., Ehlers, M. D., Rosen, K. R., Fischbach, G. D., and Huganir, R. L. (1998). Activity-dependent modulation of synaptic AMPA receptor accumulation. Neuron 21, 1067–1078. doi: 10.1016/S0896-6273(00)80624-8
Palmer, D. N., Barry, L. A., Tyynelä, J., and Cooper, J. D. (2013). NCL disease mechanisms. Biochim. Biophys. Acta 1832, 1882–1893. doi: 10.1016/j.bbadis.2013.05.014
Pan, M.-G., Xiong, Y., and Chen, F. (2012). NFAT gene family in inflammation and cancer. Curr. Mol. Med. 13, 543–554. doi: 10.2174/1566524011313040007
Pastuzyn, E. D., and Shepherd, J. D. (2017). Activity-dependent arc expression and homeostatic synaptic plasticity are altered in neurons from a mouse model of Angelman syndrome. Front. Mol. Neurosci. 10:234. doi: 10.3389/fnmol.2017.00234
Purkey, A. M., Woolfrey, K. M., Crosby, K. C., Stich, D. G., Chick, W. S., Aoto, J., et al. (2018). AKAP150 palmitoylation regulates synaptic incorporation of Ca2+-permeable AMPA receptors to control LTP. Cell Rep. 25, 974–987.e4. doi: 10.1016/j.celrep.2018.09.085
Qiu, Z., Sylwestrak, E. L., Lieberman, D. N., Zhang, Y., Liu, X.-Y., and Ghosh, A. (2012). The Rett syndrome protein MeCP2 regulates synaptic scaling. J. Neurosci. 32, 989–994. doi: 10.1523/jneurosci.0175-11.2012
Radhakrishnan, H., Ubele, M. F., Krumholz, S. M., Boaz, K., Mefford, J. L., Jones, E. D., et al. (2021). Tacrolimus protects against age-associated microstructural changes in the beagle brain. J. Neurosci. 41, 5124–5133. doi: 10.1523/jneurosci.0361-21.2021
Robertson, H. R., Gibson, E. S., Benke, T. A., and Dell’Acqua, M. L. (2009). Regulation of postsynaptic structure and function by an A-kinase anchoring protein–membrane-associated guanylate kinase scaffolding complex. J. Neurosci. 29, 7929–7943. doi: 10.1523/jneurosci.6093-08.2009
Roth, A. F., Wan, J., Green, W. N., Yates, J. R., and Davis, N. G. (2006). Proteomic identification of palmitoylated proteins. Methods 40, 135–142. doi: 10.1016/j.ymeth.2006.05.026
Sadhukhan, T., Bagh, M. B., Appu, A. P., Mondal, A., Zhang, W., Liu, A., et al. (2021). In a mouse model of INCL reduced S-palmitoylation of cytosolic thioesterase APT1 contributes to microglia proliferation and neuroinflammation. J. Inherit. Metab. Dis. 44, 1051–1069. doi: 10.1002/jimd.12379
Sanders, S. S., Martin, D. D., Butland, S. L., Lavallée-Adam, M., Calzolari, D., Kay, C., et al. (2015). Curation of the mammalian palmitoylome indicates a pivotal role for palmitoylation in diseases and disorders of the nervous system and cancers. PLoS Comput. Biol. 11:e1004405. doi: 10.1371/journal.pcbi.1004405
Sanderson, J. L., and Dell’Acqua, M. L. (2011). AKAP signaling complexes in regulation of excitatory synaptic plasticity. Neurosci 17, 321–336. doi: 10.1177/1073858410384740
Sanderson, J. L., Scott, J. D., and Dell’Acqua, M. L. (2018). Control of homeostatic synaptic plasticity by AKAP-anchored kinase and phosphatase regulation of ca 2+ -permeable AMPA receptors. J. Neurosci. 38, 2863–2876. doi: 10.1523/jneurosci.2362-17.2018
Sapir, T., Segal, M., Grigoryan, G., Hansson, K. M., James, P., Segal, M., et al. (2019). The interactome of palmitoyl-protein thioesterase 1 (PPT1) affects neuronal morphology and function. Front. Cell. Neurosci. 13:92. doi: 10.3389/fncel.2019.00092
Shatz, C. J. (1990). Competitive interactions between retinal ganglion cells during prenatal development. J. Neurobiol. 21, 197–211. doi: 10.1002/neu.480210113
Silva, J. D., Taglialatela, G., and Jupiter, D. C. (2023). Reduced prevalence of dementia in patients prescribed tacrolimus, sirolimus, or cyclosporine. J. Alzheimers Dis. 95, 585–597. doi: 10.3233/jad-230526
Sleat, D. E., Tannous, A., Sohar, I., Wiseman, J. A., Zheng, H., Qian, M., et al. (2017). Proteomic analysis of brain and cerebrospinal fluid from the three major forms of neuronal ceroid lipofuscinosis reveals potential biomarkers. J. Proteome Res. 16, 3787–3804. doi: 10.1021/acs.jproteome.7b00460
Snel, B., Lehmann, G., Bork, P., and Huynen, M. A. (2000). STRING: a web-server to retrieve and display the repeatedly occurring neighbourhood of a gene. Nucleic Acids Res. 28, 3442–3444. doi: 10.1093/nar/28.18.3442
Sordo, L., Ubele, M. F., Boaz, K., Mefford, J. L., Jones, E. D., Smiley, J., et al. (2022). Effect of calcineurin inhibitors on cognition in a canine model of Alzheimer’s disease. Alzheimers Dement. 18:e069099. doi: 10.1002/alz.069099
Szklarczyk, D., Morris, J. H., Cook, H., Kuhn, M., Wyder, S., Simonovic, M., et al. (2017). The STRING database in 2017: quality-controlled protein–protein association networks, made broadly accessible. Nucleic Acids Res. 45, D362–D368. doi: 10.1093/nar/gkw937
Tabaczar, S., Czogalla, A., Podkalicka, J., Biernatowska, A., and Sikorski, A. F. (2017). Protein palmitoylation: Palmitoyltransferases and their specificity. Exp. Biol. Med. 242, 1150–1157. doi: 10.1177/1535370217707732
Takács, J., Saillour, P., Imbert, M., Bogner, M., and Hámori, J. (1992). Effect of dark rearing on the volume of visual cortex (areas 17 and 18) and number of visual cortical cells in young kittens. J. Neurosci. Res. 32, 449–459. doi: 10.1002/jnr.490320317
Turrigiano, G., Leslie, K., Desai, N., Rutherford, L., and Nelson, S. (1998). Activity-dependent scaling of quantal amplitude in neocortical neurons. Nature 391, 892–896. doi: 10.1038/36103
Vashishta, A., Habas, A., Pruunsild, P., Zheng, J.-J., Timmusk, T., and Hetman, M. (2009). Nuclear factor of activated T-cells isoform c4 (NFATc4/NFAT3) as a mediator of antiapoptotic transcription in NMDA receptor-stimulated cortical neurons. J. Neurosci. 29, 15331–15340. doi: 10.1523/jneurosci.4873-09.2009
Vesa, J., Hellsten, E., Verkruyse, L., Camp, L., Rapola, J., Santavuori, P., et al. (1995). Mutations in the palmitoyl protein thioesterase gene causing infantile neuronal ceroid lipofuscinosis. Nature 376, 584–587. doi: 10.1038/376584a0
Vezzani, A., Ravizza, T., Bedner, P., Aronica, E., Steinhäuser, C., and Boison, D. (2022). Astrocytes in the initiation and progression of epilepsy. Nat. Rev. Neurol. 18, 707–722. doi: 10.1038/s41582-022-00727-5
Walter, P., and Ron, D. (2011). The unfolded protein response: from stress pathway to homeostatic regulation. Science 334, 1081–1086. doi: 10.1126/science.1209038
Wan, J., Roth, A. F., Bailey, A. O., and Davis, N. G. (2007). Palmitoylated proteins: purification and identification. Nat. Protoc. 2, 1573–1584. doi: 10.1038/nprot.2007.225
Washbourne, P. (2004). Greasing transmission palmitoylation at the synapse. Neuron 44, 901–902. doi: 10.1016/j.neuron.2004.12.010
Winckler, B., Faundez, V., Maday, S., Cai, Q., Almeida, C. G., and Zhang, H. (2018). The endolysosomal system and proteostasis: from development to degeneration. J. Neurosci. 38, 9364–9374. doi: 10.1523/jneurosci.1665-18.2018
Won, S. J., Kit, M. C. S., and Martin, B. R. (2018). Protein depalmitoylases. Crit. Rev. Biochem. Mol. Biol. 53, 83–98. doi: 10.1080/10409238.2017.1409191
Woolfrey, K. M., O’Leary, H., Goodell, D. J., Robertson, H. R., Horne, E. A., Coultrap, S. J., et al. (2018). CaMKII regulates the depalmitoylation and synaptic removal of the scaffold protein AKAP79/150 to mediate structural long-term depression. J. Biol. Chem. 293, 1551–1567. doi: 10.1074/jbc.m117.813808
Woolfrey, K. M., Sanderson, J. L., and Dell’Acqua, M. L. (2015). The palmitoyl acyltransferase DHHC2 regulates recycling endosome exocytosis and synaptic potentiation through palmitoylation of AKAP79/150. J. Neurosci. 35, 442–456. doi: 10.1523/jneurosci.2243-14.2015
Xu, H., and Ren, D. (2015). Lysosomal physiology. Annu. Rev. Physiol. 77, 57–80. doi: 10.1146/annurev-physiol-021014-071649
Yashiro, K., Riday, T. T., Condon, K. H., Roberts, A. C., Bernardo, D. R., Prakash, R., et al. (2009). Ube3a is required for experience-dependent maturation of the neocortex. Nat. Neurosci. 12, 777–783. doi: 10.1038/nn.2327
Yokoi, N., Fukata, Y., Sekiya, A., Murakami, T., Kobayashi, K., and Fukata, M. (2016). Identification of PSD-95 Depalmitoylating enzymes. J. Neurosci. 36, 6431–6444. doi: 10.1523/jneurosci.0419-16.2016
Yoshiyama, Y., Higuchi, M., Zhang, B., Huang, S.-M., Iwata, N., Saido, T. C., et al. (2007). Synapse loss and microglial activation precede tangles in a P301S tauopathy mouse model. Neuron 54, 343–344. doi: 10.1016/j.neuron.2007.03.022
Keywords: palmitoylation, depalmitoylation, PPT1, synaptic scaling, neuroinflammation, lipofuscinosis, Akap5
Citation: Koster KP, Fyke Z, Nguyen TTA, Niqula A, Noriega-González LY, Woolfrey KM, Dell’Acqua ML, Cologna SM and Yoshii A (2024) Akap5 links synaptic dysfunction to neuroinflammatory signaling in a mouse model of infantile neuronal ceroid lipofuscinosis. Front. Synaptic Neurosci. 16:1384625. doi: 10.3389/fnsyn.2024.1384625
Edited by:
Weifeng Xu, University of Pittsburgh, United StatesReviewed by:
Seonil Kim, Colorado State University, United StatesArchan Ganguly, University of Rochester Medical Center, United States
Eunsil Cho, Korea Basic Science Institute, Republic of Korea
Copyright © 2024 Koster, Fyke, Nguyen, Niqula, Noriega-González, Woolfrey, Dell’Acqua, Cologna and Yoshii. This is an open-access article distributed under the terms of the Creative Commons Attribution License (CC BY). The use, distribution or reproduction in other forums is permitted, provided the original author(s) and the copyright owner(s) are credited and that the original publication in this journal is cited, in accordance with accepted academic practice. No use, distribution or reproduction is permitted which does not comply with these terms.
*Correspondence: Kevin P. Koster, a3Brb3N0ZXJAdWNoaWNhZ28uZWR1
†Present address: Kevin P. Koster, Department of Neurobiology, University of Chicago, Chicago, IL, United States