 Qian Shen1,2,3
 Zhuoshi Li1,2,3
 Jiasong Sun1,2,3
 Yao Fan1,2,3Yuanyuan Chen1,2,3Haojie Gu1,2,3
 Peng Gao4*Qian Chen3
 Chao Zuo1,2,3*
- 1Smart Computational Imaging Laboratory (SCILab), School of Electronic and Optical Engineering, Nanjing University of Science and Technology, Nanjing, Jiangsu, China
- 2Smart Computational Imaging Research Institute (SCIRI) of Nanjing University of Science and Technology, Nanjing, Jiangsu, China
- 3Jiangsu Key Laboratory of Spectral Imaging and Intelligent Sense, Nanjing, Jiangsu, China
- 4School of Physics, Xidian University, Xi’an, China
Label-free quantitative phase imaging is an essential tool for studying in vitro living cells in various research fields of life sciences. Digital holographic microscopy (DHM) is a non-destructive full-field microscopy technique that provides phase images by directly measuring the optical path differences, which facilitates cell segmentation and allows the determination of several important cellular physical features, such as dry mass. In this work, we present a systematic analysis framework for live-cell imaging and morphological characterization, terms as LAF (live-cell analysis framework). All image processing algorithms involved in this framework are implemented on the high-resolution artifact-free quantitative phase images obtained by our previously proposed slightly off-axis holographic system (FPDH) and associated reconstruction methods. A highly robust automated cell segmentation method is applied to extract the valid cellular region, followed by live-cell analysis framework algorithms to determine the physical and morphological properties, including the area, perimeter, irregularity, volume and dry mass, of each individual cell. Experiments on live HeLa cells demonstrate the validity and effectiveness of the presented framework, revealing its potential for diverse biomedical applications.
1 Introduction
In vitro imaging of living single cells with light microscopy is crucial for many research fields in biology and medicine. Live-cell imaging provides important insights into various cellular properties, such as motility or biomechanics related to cell structure changes. In particular, the cellular dry mass, which accurately reflects the accumulation of cellular contents, is relevant to cell growth research and is of great significance. This requires measurements must be performed at the single cell level with high precision and high throughput, thus bringing challenges to microscopy. Quantitative Phase Imaging (QPI) techniques are rapidly gaining momentum and popularity as new imaging tools in cellular biology (Zuo et al., 2017; Fan et al., 2019; Li et al., 2019; Zuo et al., 2020; Lu et al., 2022; Zhou et al., 2022), where Digital holographic microscopy (DHM) (Cuche et al., 1999; Mann et al., 2005; Huang et al., 2022) combines interferometric technique, modern CCD sensor and image processing systems, opening up a new perspective for the accurate characterization of physical properties of living cells.
Different from conventional microscopic imaging techniques that require exogenous contrast agents for visualization and detection of samples (Giloh and Sedat, 1982; Betzig et al., 2006), DHM is optical, enabling high contrast imaging of all cells in the entire field-of-view (FoV) without being limited to fluorescent or stained samples. DHM is also a non-invasive technique since the radiation used does not damage the cells. Therefore, non-destructive long-term time-lapse investigations for quantitative monitoring of dynamic changes of cell morphology, motility, and proliferation are accessible. Moreover, DHM converts the invisible sample thickness into a detectable intensity variation and provides quantitative measurements, a capability that Zernike phase contrast (PC) (Nomarski, 1955) and differential interference contrast (DIC) (Zernike, 1942) lack. The reconstruction of quantitative phase images allows for the acquisition of samples’ three-dimensional morphological information, thereby permitting the extraction of integral biophysical parameters globally quantifying the intracellular content, dynamic morphology, and volume changes as well as cell motility. In addition, it has been proved that an optical path can be used to measure the mass of a total substance other than water in a living cell or in any of its parts, i.e., cellular dry mass (Davies and Wilkins, 1952). DHM uses the laser with high coherence as the physical medium for optical modulation to reconstruct phase information by measuring the optical path difference induced by a micro-sample. This direct observation recovers the phase results more accurately to benefit the analysis of morphological characteristics like dry mass, which becomes a unique advantage of DHM. Consequently, DHM is a desirable tool for live-cell imaging that efficiently serves physical features analysis (Kemper and Von Bally, 2008; Rappaz et al., 2009).
Since the spectral aliasing degree of the object information and background intensity directly affects the accuracy of phase demodulation through linear Fourier domain filtering, conventional digital holographic microscopy suffers from the problem of incompatibility between high-quality reconstruction and high-throughput imaging. To avoid the introduction of zero-order information to degrade the fidelity of the reconstructed wavefront, quasi-off-axis DHM sacrifices substantial imaging throughput (Takeda et al., 1982). This leads to a considerable reduction in image resolution, which renders the reconstructed cell phases lose in detail to a great extent and is not conducive to cell structure analysis. The enhancement of space-bandwidth product by the slightly off-axis DHM is necessarily accompanied by the zero-order suppression; otherwise, artifacts will be formed on the phase image due to the residual background intensity information (Pavillon et al., 2009; Pavillon et al. 2010; Baek et al., 2019). In our previous work (Shen et al., 2022), we innovatively proposed a slightly off-axis holographic imaging system (FPDH) based on Fourier ptychographic reconstruction (Zheng et al., 2013; Sun et al., 2017; Shu et al., 2022). FPDH effectively breaks through the spatial bandwidth limitation of quasi-off-axis holography and reconstructs high-quality artifact-free phase images while reaching the theoretical resolution, laying the foundation for high-precision measurement of the physical properties of living cells.
Over the years, light microscopy has achieved many breakthroughs in improving resolution and imaging quality, but the biological interpretation of its imaging results (e.g., cell fusion, morphology, and dry mass) still requires additional processing analysis software. The combination of the two and its application to the observation of living cells is more valuable to the life science field. In this paper, we further present a systematic analysis framework for live-cell imaging and morphological characterization based on FPDH, named LAF. Since the phase information reconstructed by FPDH is not interfered by the background intensity, the accuracy of LAF is guaranteed. More importantly, the high-throughput imaging and achievement of theoretical resolution can preserve the high-frequency details of cell edges, solving the problem of difficulty in identifying cell contours due to unclear boundaries. The evaluation of the recorded quantitative phase contrast images allows the extraction of data for simplified object tracking and image segmentation, thus realizing single cell observations. Based on this, LAF is equipped with a set of automated cell segmentation method to extract the valid cellular region, which improves the existing methods to make the framework more robust and accurate. Various physical properties of each individual living cell can be measured and analyzed using phase information and segmentation data. According to parameters such as medium refractive index, LAF provides calculations of the area, perimeter, irregularity and volume of each single cell and translates the surface integral of the optical phase shift through a cell layer into an estimation of the cellular dry mass (Barer, 1952; Popescu et al., 2014). The measurement of these physical properties reflects the cellular nature, which is beneficial for quantitative studies of cell growth and biochemical status. In other words, LAF is a complete live-cell systematic analysis framework that covers the entire process from quantitative phase imaging to the acquisition of individual cell morphological structure data. Experiments on HeLa live-cells demonstrate the validity and effectiveness of the proposed framework for physical and morphological analysis of cells.
2 FPDH imaging system
The proposed systematic analysis framework (Figure 1) begins with the application of FPDH imaging system to obtain quantitative phase images of cells. This chapter reviews the reconstruction principle of FPDH.
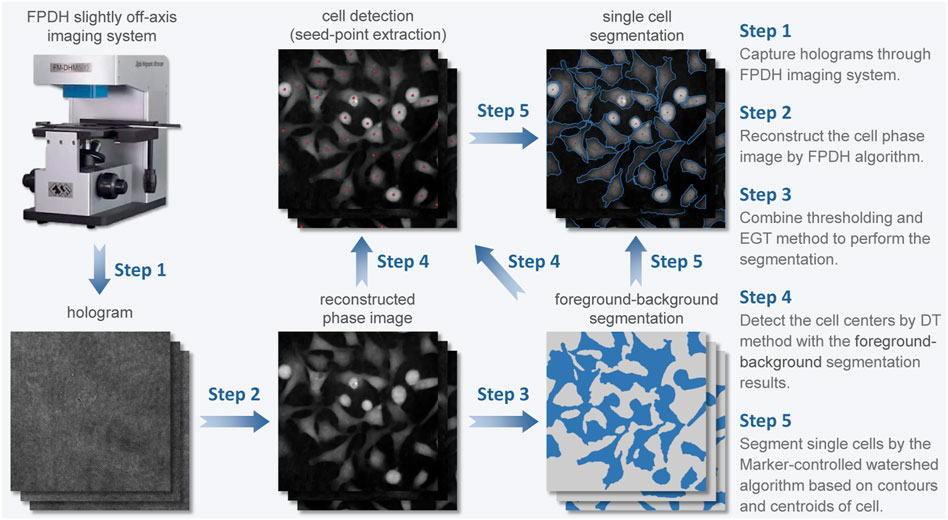
FIGURE 1. Flow chart of the operation of the LAF systematic analysis framework.
Based on the off-axis architecture, FPDH adjusts the system parameters such as the source wavelength and the numerical aperture of the objective lens so that the autocorrelation and intercorrelation terms are distributed diagonally and partially overlapped in the frequency domain. When the tilt angle between the object beam and the reference beam is at a certain angle, the spectrum of ±1-order is tangent at the origin with a complete and continuous display, which forms a slightly off-axis spectrum configuration with maximum spectrum utilization. However, since the extreme spectral configuration mentioned above makes full use of the spatial bandwidth, aliasing of spectral information will lead to the inability of the Fourier method to reconstruct the phase correctly. Therefore, FPDH solves the problem by the non-linear optimization algorithm (Khare et al., 2013), which is solved by a Gechberg-Saxton (GS) (Gerchberg, 1971; Gerchberg, 1972) algorithm-like method.
Build a forward physical model of the imaging process of off-axis digital holography and the complex amplitude distribution of the hologram is expressed as U(x, y) = O(x, y) + R(x, y), where O(x, y) and R(x, y) are respectively the complex amplitudes of the object and reference beams, and the reference beam is considered as a quasi-plane wave. With the recorded intensity images of the hologram and the reference beam, the complex amplitude distribution of the reference beam is reconstructed from the offset of ±1-order of the hologram in the frequency domain and the amplitude information of the reference beam.
Define the cost function with the purpose of minimizing the amplitude error
and derive the updated equation of the hologram as
where Ue(u, v) = O(u, v)P(u, v) + R(u, v) represents the subspectrum before the update and
During the iteration, the square root of the recorded digital hologram intensity is always employed to update the reconstructed complex amplitude, as shown in Figure 2, where the structural similarity index of both the reconstructed amplitude and phase images is 1. With the non-linear optimization algorithm, FPDH constructs a high-resolution, high-throughput, artifact-free slightly off-axis holographic imaging system, which is a solid foundation for subsequent cell morphology analysis algorithms of LAF to operate with high robustness and accuracy.
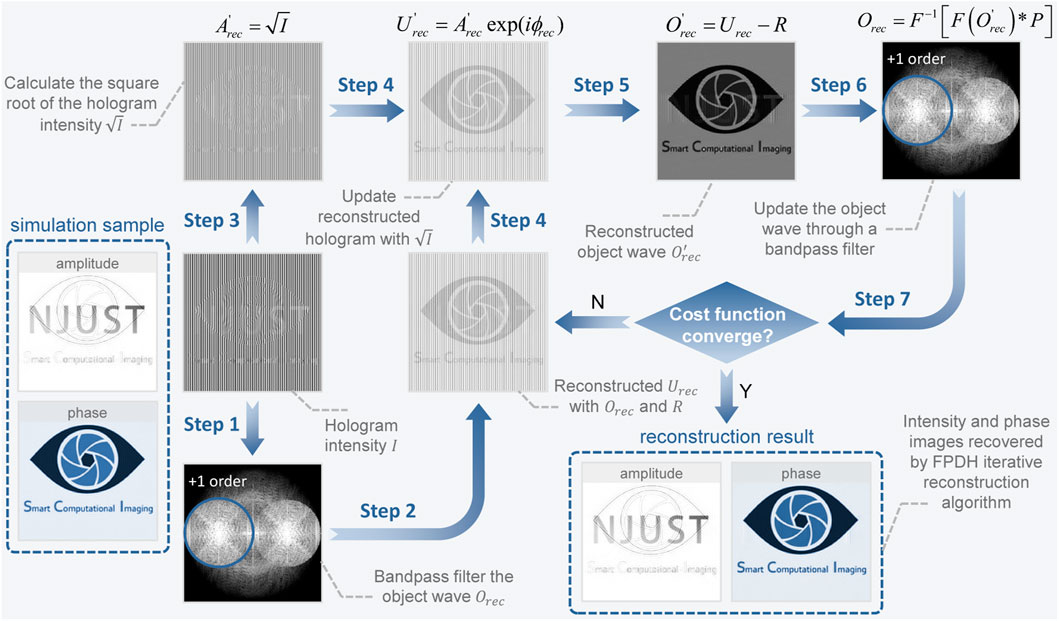
FIGURE 2. Flow chart of the FPDH slightly off-axis holographic reconstruction algorithm.
3 Cell segmentation
In the paragraphs below we provide a detailed summary of each image processing step in LAF for live-cell imaging and morphological characterization (Figure 1), followed by a description of the methods involved.
3.1 Foreground-background segmentation
The analysis of cell features is based on the accurate cell segmentation of a cell phase image, so the cell segmentation algorithm is of critical importance. We first need to separate the cells in the phase image from the background and extract the contours of the overall cells. The conventional segmentation algorithms are generally classified into two categories based on the mathematical model: Level-Set-based methods (Chan and Vese, 2001) and Thresholding-based methods (Sezgin and Sankur, 2004; Sun and Thakor, 2015). The former is computationally expensive, time-consuming and unable to guarantee the accuracy of segmentation results. Although the simple thresholding schemes are efficient, they do not provide a robust segmentation solution because the contrast between cells and background is not constant within the same image. Therefore, it becomes a better choice to extract some feature images, which are then thresholded and morphologically modified.
Based on the observation that pixel intensity gradients are higher for pixels at cell edges than for background pixels in a image, thresholding the gradient image is a more desirable and general segmentation approach. We choose the Empirical Gradient Threshold (EGT) (Chalfoun et al., 2015) method to segment the foreground from the background. EGT is an empirically derived image gradient threshold selection method, which has the advantages of high segmentation accuracy, high speed, and applicability to multiple cell lines with various densities of cells and cell colonies. EGT operates on the histogram of the gradient image and derives the function to compute the gradient threshold through empirical observations and mathematical models. The function f of the optimal gradient percentile value Y is derived empirically as follows:
where X is the area under the histogram curve between a lower and upper bound, s1 and s2 are derived with values equal to s1 = 3, s2 = 50. The linear function is obtained by the training and validation data set equal to a = −1.3517 and b = 98.8726, and the image gradient threshold is then derived from the percentile. In a word, EGT is a histogram shape-based thresholding method that segments the gradient image by thresholding it at every gradient percentile value.
However, holographic imaging usually uses a highly coherent laser as the light source; thus the background of the reconstructed phase image will carry some speckle noise and inhomogeneity contrast caused by self-interference. In this case, segmentation by EGT alone would retain some of the unwanted background information with large phases or miss a few thin cells with very small gradients. Therefore, the LAF combines thresholding and EGT to threshold the phase image and gradient image of cells separately, while preserving the main structure and edge details of cells. In addition, for local regions where the background is severely inhomogeneous, a more accurate segmentation can be achieved by only thresholding the phase image with a mask. All the above operations can considerably reduce the errors caused by the subsequent hole filling and erosion steps, improving the performance yet being simple and fast.
3.2 Cell detection (seed-point extraction)
Once the foreground (cells) is separated from the background, the next step is to identify the centroids of the cells (seed points). Seed-point extraction is also an essential step of cell segmentation. As the intensity distribution within the cell regions presents a large degree of variation and the transitions between the cells’ nuclei and the background are very shallow, the threshold-based method has the same limitations when it is applied to the central identification of dense cellular data as it does in foreground segmentation. Besides, considering the real-time imaging property of the FPDH system, we choose the distance transform thresholding (DT-Threshold) strategy with a strong speed advantage according to ref (Vicar et al., 2019), which is robust to shifts in the intensity domain and is able to maximally exploit the contrast difference between the cells and the background information.
The DT method highlights the cell regions by generating intensity peaks around the cells’ nuclei with a method mainly based on the extended maxima transform (Thirusittampalam et al., 2013). Similarly, we combine thresholding and DT to improve the cell center detection algorithm in order to make it more applicable to holographic imaging. Since the background information with higher intensity can damage the results of phase image thresholding, we perform two thresholding operations according to the different cell morphologies to respectively obtain the binary images of both adherent thin cells and spherical cells with large phases. A binary image covering all of the cells’ nuclei is integrated by a mask for the subsequent distance transform.
The Euclidean distance transform is applied to the above binary image and then the extended maxima transform is performed on its result map. The extended maxima transform is the regional maxima of the h-maxima transform, where the value of h is experimentally determined and each connected extremal region in the generated binary image represents a centroid of the cell located in that region. Finally, centroids for connected components in this binary image is calculated to get the location of each cell center, which means that the seed-point extraction is completed.
3.3 Single cell segmentation
After the above procedures of reconstruction, foreground segmentation and seed-point extraction, we obtained the overall outline of all cells and their centroids from the cell phase image. With these information, the detection of edge contours of individual cells can be achieved by segmenting the connected cell regions.
The watershed segmentation is a powerful and fast technique for contour detection and region-based segmentation that has become a classic tool for individual cell segmentation. In mathematical morphology, we employ watershed segmentation to consider gray-scale images as topographical maps for processing, where the intensity value of each pixel stands for the height at that point, converting the edges of the objects into ridges to perform a proper segmentation. Based on the watershed segmentation, Marker-controlled watershed transformation is a more robust and flexible method that can efficiently segment objects with closed contours such as HeLa cells (Parvati et al., 2008).
Therefore, based on the cell centers and profiles already calculated, we select Marker-controlled watershed segmentation to achieve the final single-cell segmentation. The binary image obtained after foreground-background segmentation is modified by marking the pixels of the centroids of the cells as the regional minimum. Each marker has a one-to-one relationship to a specific watershed region; thus the number of markers will be equal to the final number of watershed regions. After segmentation, the boundaries of the watershed regions are arranged on the desired ridges, thereby separating each cell from its neighbors.
4 Cell morphology characterization
At this point, we have achieved the extraction of the valid cellular region. Finally, LAF performs cell morphology analysis with the reconstructed phase information and segmentation data. The framework allows for quantitative measurements of the area, circumference and volume of individual living cells as well as the definition of cell irregularity. In addition, in view of the fact that cellular dry mass has long been considered an important physical property, LAF completes its estimation using cellular phase, i.e., optical path difference. The calculations of these cellular morphological features are described below.
4.1 Area
Based on the location of the cell edges, we calculate the number of pixels within each cell contour and multiply it by the pixel area to obtain the area of a single cell. Since the FPDH system applies a ×10 objective lens and thus has a systematic magnification, some corresponding adjustment of the individual pixel size is necessary. The equation to calculate the area of a single cell is defined as follows:
where pixelsize is the pixel size of the CCD camera, Ma is the system magnification (obtained by calibration), and Ω is the contour position of the single cell obtained after cell segmentation.
4.2 Circumference
Similar to the cell area, we define the circumference of a single cell using the location of the cell edge. The Euclidean distance between the occupied pixels around the edge contour of each cell is calculated, and a discrete integration of this discrete distance gives the circumference of the cell:
The pixeli and pixelj in Eq. 5 denote two pixels adjacent to each other on the cell contour.
4.3 Irregularity
The irregularity of a single cell can be calculated after obtaining its area and circumference. In this paper, we define the irregularity of a cell by the morphological definition of roundness as the following expression:
where S and C are calculated by Eq. 4 and Eq. 5, respectively.
4.4 Volume
Combining the reconstructed cell phase information with the area defined previously, we can calculate the volume of single cells. Firstly, according to the phase value and the refractive index distribution of the cell, the cell thickness is obtained by the following equation:
In Eq. 7, λ is the central wavelength of the laser, φ is the phase value measured by the FPDH system, ncell and nmedium are respectively the refractive indices of the cell and the immersion medium, and h is the cell thickness (Barer, 1953). Then, based on the calculated cell area, circumference and thickness, the area is sliced from the minimum to the maximum value of the thickness with the idea of discretized triple integration. Finally, the discrete integration of the area of each layer is calculated to obtain the single cell volume by the following equation:
where h is the cell thickness, Zstep is the slice thickness in the Z-direction, and
4.5 Dry mass
It has been proved that the surface integral of the cell phase map is invariant to small osmotic changes (Popescu et al., 2008). Utilizing the fact that the refractive increments of most substances in cells are approximately the same and independent of composition, DHM is applicable to the measurement of cellular dry mass. The dry mass surface density at each pixel (x, y) is calculated as:
where α is a constant known as the specific refraction increment (Mir et al., 2011). According to Ref. (Barer, 1952), we used the average value of this parameter of 0.2 ml/g for the subsequent calculations.
Then the total dry mass is calculated by integrating the region of interest in the dry mass density map, and the expression is shown as follows:
To get a more accurate measurement of the true dry mass, the projected maximum of three z slices centered around the middle of each cell can be used to calculate the dry mass density map. To automatically detect the center position in each z stack, the mean phase of each z slice is calculated, and the slice with the maximum mean value is chosen as the center slice (Dubois et al., 2006).
5 Experiments
To demonstrate the capability of the above systematic analysis framework for live-cell imaging and morphological characterization, we performed experiments on HeLa live-cells. The Digital Holographic Smart Computational Light Microscope (DH-SCLM) (Figure 1) developed by SCILab (Fan et al., 2021) was used to acquire holograms. Its central wavelength of illumination is 532 nm, and the pixel size of the CCD camera (The Imaging Source DMK 23U274, 1600 × 1200) is 4.4 μm. We selected a specific objective (UPLanSAPO ×10/0.4NA, Olympus, Japan) to maximize spectral utilization and combined it with the FPDH non-linear optimization algorithm to achieve artifact-free high-resolution imaging. LAF performed cell segmentation on quantitative phase images reconstructed by the FPDH imaging system.
Figure 3 illustrates the ability of LAF to automatically segment individual cell in the phase maps. Figures 3A1, B1 are segmentation results of the reconstructed high-quality phase images of HeLa cells in the full FoV, respectively. The blue lines indicate the contours of the cell edges and the red points represent the locations of the cell centroids. The EGT method preserves the main structure and edge details of single or multiple aggregated cells, which further improves the accuracy and robustness of the segmentation in combination with thresholding. Similarly, the cell centroids are also correctly identified by the DT method and thresholding. Based on the overall cell contours and centroid locations, single cell segmentation is performed on the cells connected to the edge of their neighbors by the Marker-controlled watershed segmentation. Figures 3C1, G1 shows the boundary subregions of dense cells in the phase images. It can be seen that the edge contours and centroids of cells in these regions are identified with high precision.
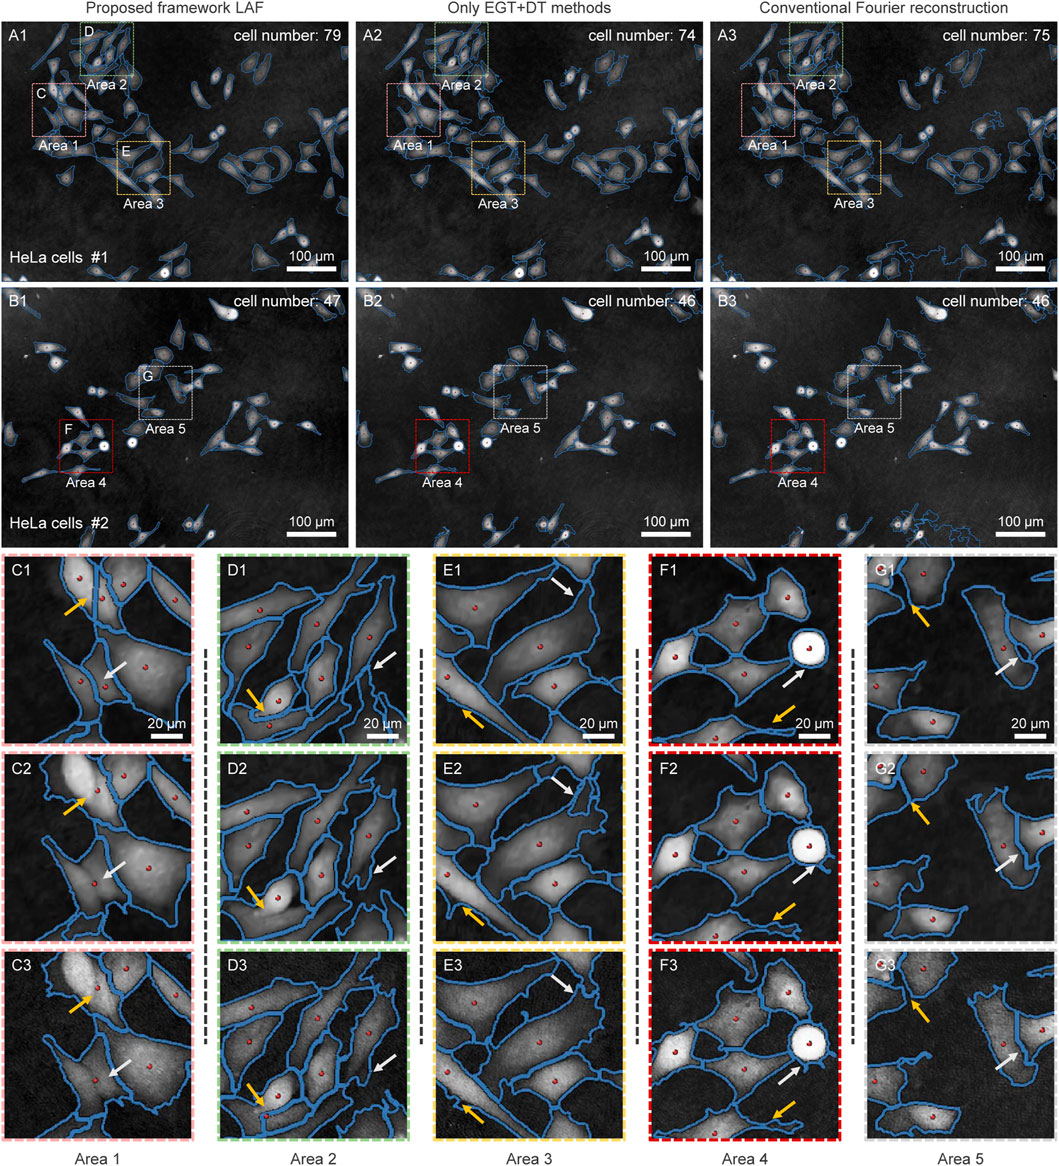
FIGURE 3. Cell segmentation results based on LAF systematic analysis framework (A1,B1), EGT and DT methods (A2,B2) and conventional Fourier reconstruction (A3,B3). (A1–A3), (B1–B3) Cell segmentation results for the full FoV of the quantitative phase images of HeLa cells. (C–G) represents (C1–C3, D1–D3, E1–E3, F1–F3, G1–G3) The selected subregions in (A–B) represents (A1–A3, B1–B3).
To illustrate the better performance of LAF on cell segmentation, we performed comparison experiments using only the EGT method and the DT method on the same FoV. As shown in Figures 3A2, B2, the accuracy of foreground-background segmentation is considerably reduced. More importantly, the under-recognition of cell centroid can directly lead to the failure of the watershed algorithm, thereby resulting in the inability to separate several neighboring cells, as shown in Figure 3C2. In addition, we also conducted segmentation experiments on cell phase images reconstructed by the conventional Fourier method, as shown in Figures 3A3, B3. It can be obviously seen that there is much background intensity information remaining on the reconstructed phase images due to the lack of zero-order suppression, which has a negative impact on the cell segmentation. In contrast, LAF images HeLa cells with FPDH system to obtain high-quality quantitative phase images, which eliminates the background artifacts while preserving the high-frequency detail information of cells, thus further guaranteeing the measurement precision.
Depending on the cell segmentation results and quantitative phase information, LAF allows for provision of the physical features measurements of single HeLa live-cells for analysis. We respectively selected a cell-dense FoV (Figure 4A) and a cell-sparse FoV (Figure 4D) as the analysis samples. Figures 4B, E are the segmentation results of the selected cell regions of interest from the original phase images. To conveniently demonstrate the cell analysis results, Figures 4C, F mark the numbers of the cells for morphological analysis on the binary images obtained after cell segmentation. Tables 1, 2 show the analysis results of the physical properties calculated with the reconstructed Hela cell phase and the segmentation data previously obtained. We evaluated the morphological characteristics of HeLa live-cells by Eqs 4–10, involving area, circumference, irregularity, volume and dry mass. The experimental results confirm that the systematic analysis framework has a highly efficient practicality for both sparse and dense cell analysis.
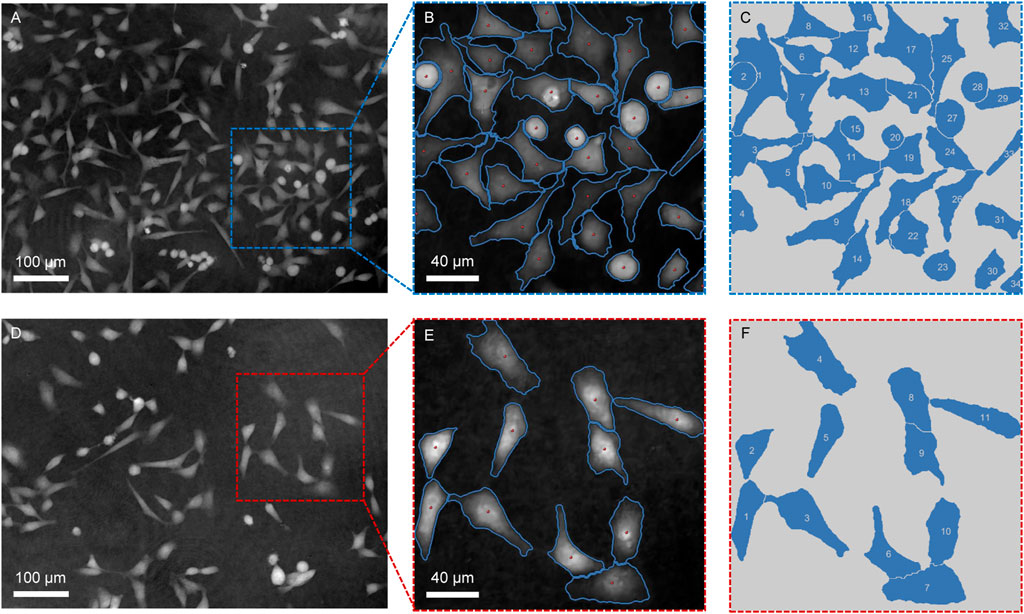
FIGURE 4. Segmentation of cell regions of interest in the phase images for further evaluation of the cells physical properties. (A,D) Quantitative phase images of HeLa cells reconstructed by the FPDH imaging system. (B,E) Regions for cell analysis. (C,F) Mark numbers of the cells for morphological analysis on the binary images obtained after cell segmentation.
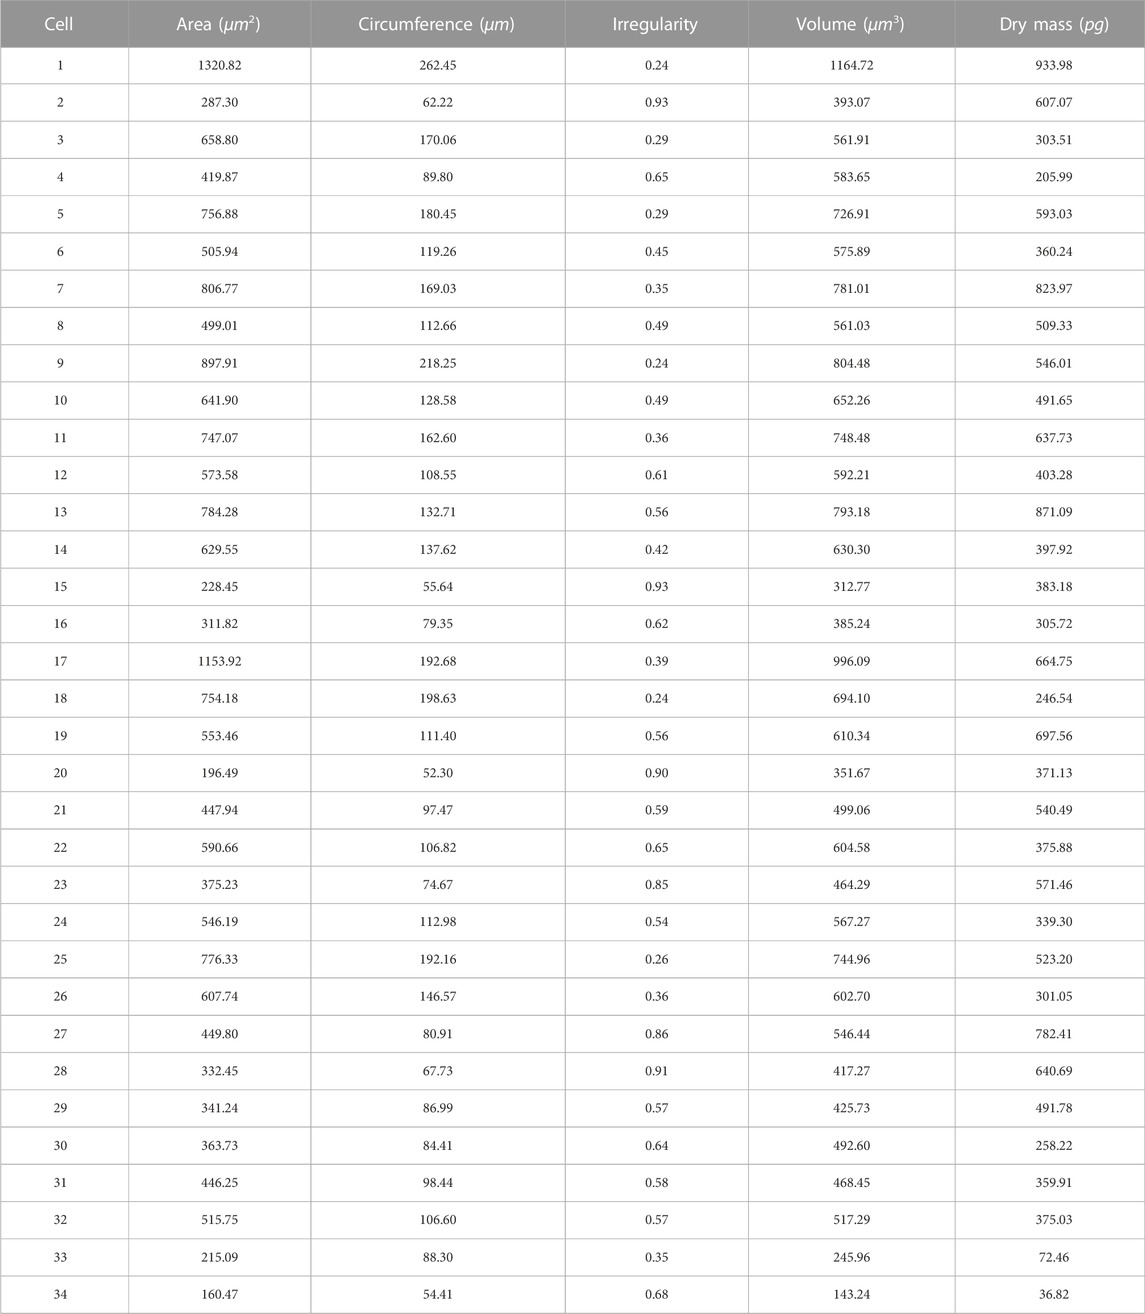
TABLE 1. Physical property measurements of HeLa live-cells in Figure 4B with LAF.
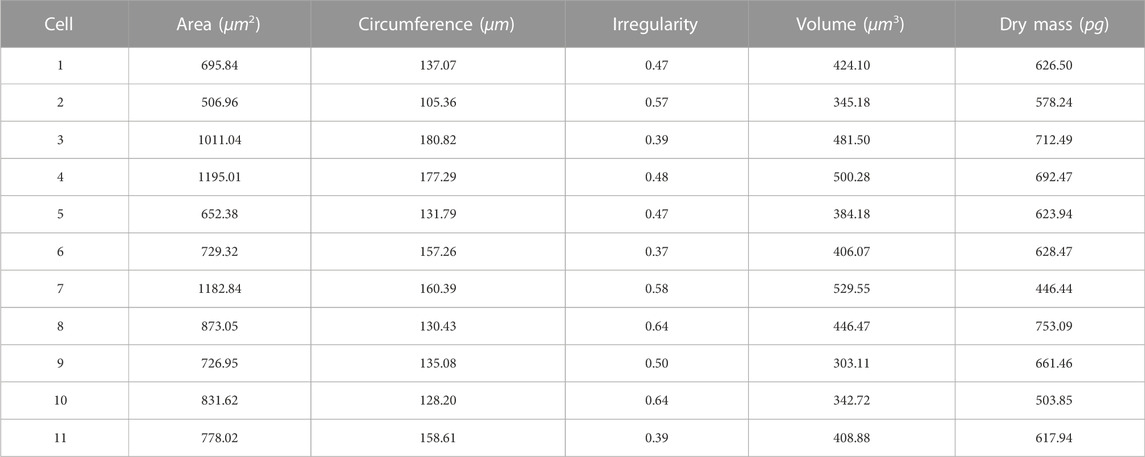
TABLE 2. Physical property measurements of HeLa live-cells in Figure 4E with LAF.
Based on this, LAF can utilize the real-time imaging capability of digital holography to provide dynamic observation of important physiological processes in living cells. By tracking the physical properties mentioned above, we can measure the growth rate of individual cells and thereby obtain their growth characteristics. Moreover, the observation process of growth trends is beneficial for understanding the link between cell cycle progression and mass. Therefore, the LAF systematic analysis framework holds considerable potential for biomedical applications.
6 Conclusion and discussions
In this paper, we present a systematic analysis framework, which employs FPDH imaging to study the physical properties of HeLa live-cells at the single cell level in a non-invasive manner. The application of FPDH slightly off-axis holography system realizes high-throughput artifact-free imaging, further improving the resolution and reconstruction quality of quantitative phase images and laying the foundation for high-precision cell segmentation and analysis. LAF also equips a set of highly robust algorithms for automated cell segmentation and morphological analysis, allowing the analysis of individual cells in culture or the statistical measurement of large populations of cells. Furthermore, the cellular dry mass has long been recognized as an important physical property, but its biological applications as an experimental tool have been limited due to the lack of readily accessible methods. With the methods mentioned here, the quantitative measurement of cellular dry mass is placed on a solid physical background and made available as a practical microscopic assay.
LAF has a FoV of 2.32323 mm2 (10×), permitting dynamic and full-field topography analysis. It should be mentioned that LAF is mainly applicable to adherent cells. Since the thickness of suspended cells is large, the significance of the phase measured by QPI techniques is not clear. It is better to use three-dimensional tomography to measure suspended cells. Moreover, if the reconstructed phase image is slightly defocused, digital holography allows fine-tuning by auto-focusing methods, thus enhancing the accuracy of cell segmentation and measurement of physical properties. With image processing, LAF can measure the growth rates of individual cells among confluent population with cell-to-cell contacts and achieve high measurement throughput. LAF is also completely non-invasive as it uses the cellular refractive index as the source of microscopic contrast. In addition, a combination of synthetic aperture technology (Zheng et al., 2020; Gao and Yuan, 2022) can be considered to further improve the spatial resolution of the framework. Thus, the systematic analysis framework has the potential to form versatile tools to generate quantitative phase data in a very simple way in life sciences, etc., which may be evaluated to quantify the physical properties of various morphological living cells.
Data availability statement
The original contributions presented in the study are included in the article further inquiries can be directed to the corresponding authors.
Author contributions
QS and ZL contributed equally to this work. CZ initiated the project. QS, JS, and ZL developed the theory and method. QS, JS, and ZL wrote code for the simulation and experiment. QS and JS designed the experiments. QS and YC built the experimental platform. QS performed the experiments and analyzed the data. CZ, PG, and QC provided research advice and overall supervision. QS, YC, and HG wrote the manuscript with contributions from all authors.
Funding
This work was supported by the National Natural Science Foundation of China (61905115, 62105151, 62175109, and U21B2033), National Major Scientific Instrument Development Project (62227818), Leading Technology of Jiangsu Basic Research Plan (BK20192003), Youth Foundation of Jiangsu Province (BK20190445 and BK20210338), Biomedical Competition Foundation of Jiangsu Province (BE2022847), Key National Industrial Technology Cooperation Foundation of Jiangsu Province (BZ2022039), Fundamental Research Funds for the Central Universities (30920032101), and Open Research Fund of Jiangsu Key Laboratory of Spectral Imaging and Intelligent Sense (JSGP202105 and JSGP202201).
Conflict of interest
The authors declare that the research was conducted in the absence of any commercial or financial relationships that could be construed as a potential conflict of interest.
Publisher’s note
All claims expressed in this article are solely those of the authors and do not necessarily represent those of their affiliated organizations, or those of the publisher, the editors and the reviewers. Any product that may be evaluated in this article, or claim that may be made by its manufacturer, is not guaranteed or endorsed by the publisher.
References
Baek, Y., Lee, K., Shin, S., and Park, Y. (2019). Kramers–kronig holographic imaging for high-space-bandwidth product. Optica 6, 45–51. doi:10.1364/optica.6.000045
Barer, R. (1953). Determination of dry mass, thickness, solid and water concentration in living cells. Nature 172, 1097–1098. doi:10.1038/1721097a0
Barer, R. (1952). Interference microscopy and mass determination. Nature 169, 366–367. doi:10.1038/169366b0
Betzig, E., Patterson, G. H., Sougrat, R., Lindwasser, O. W., Olenych, S., Bonifacino, J. S., et al. (2006). Imaging intracellular fluorescent proteins at nanometer resolution. Science 313, 1642–1645. doi:10.1126/science.1127344
Chalfoun, J., Majurski, M., Peskin, A., Breen, C., Bajcsy, P., and Brady, M. (2015). Empirical gradient threshold technique for automated segmentation across image modalities and cell lines. J. Microsc. 260, 86–99. doi:10.1111/jmi.12269
Chan, T. F., and Vese, L. A. (2001). Active contours without edges. IEEE Trans. Image Process. 10, 266–277. doi:10.1109/83.902291
Cuche, E., Bevilacqua, F., and Depeursinge, C. (1999). Digital holography for quantitative phase-contrast imaging. Opt. Lett. 24, 291–293. doi:10.1364/ol.24.000291
Davies, H., and Wilkins, M. (1952). Interference microscopy and mass determination. Nature 169, 541. doi:10.1038/169541a0
Dubois, F., Schockaert, C., Callens, N., and Yourassowsky, C. (2006). Focus plane detection criteria in digital holography microscopy by amplitude analysis. Opt. Express 14, 5895–5908. doi:10.1364/oe.14.005895
Fan, Y., Li, J., Lu, L., Sun, J., Hu, Y., Zhang, J., et al. (2021). Smart computational light microscopes (sclms) of smart computational imaging laboratory (scilab). PhotoniX 2, 19–64. doi:10.1186/s43074-021-00040-2
Fan, Y., Sun, J., Chen, Q., Pan, X., Tian, L., and Zuo, C. (2019). Optimal illumination scheme for isotropic quantitative differential phase contrast microscopy. Photonics Res. 7, 890–904. doi:10.1364/prj.7.000890
Gao, P., and Yuan, C. (2022). Resolution enhancement of digital holographic microscopy via synthetic aperture: A review. gxjzz. 3, 105–120. doi:10.37188/lam.2022.006
Gerchberg, R. W. (1972). A practical algorithm for the determination of phase from image and diffraction plane pictures. Optik 35, 237–246.
Gerchberg, R. W. (1971). Phase determination for image and diffraction plane pictures in the electron microscope. Opt. Stuttg. 34, 275.
Giloh, H., and Sedat, J. W. (1982). Fluorescence microscopy: Reduced photobleaching of rhodamine and fluorescein protein conjugates by n-propyl gallate. Science 217, 1252–1255. doi:10.1126/science.7112126
Huang, Z., Memmolo, P., Ferraro, P., and Cao, L. (2022). Dual-plane coupled phase retrieval for non-prior holographic imaging. PhotoniX 3, 3–16. doi:10.1186/s43074-021-00046-w
Kemper, B., and Von Bally, G. (2008). Digital holographic microscopy for live cell applications and technical inspection. Appl. Opt. 47, A52–A61. doi:10.1364/ao.47.000a52
Khare, K., Ali, P. S., and Joseph, J. (2013). Single shot high resolution digital holography. Opt. Express 21, 2581–2591. doi:10.1364/oe.21.002581
Li, J., Matlock, A. C., Li, Y., Chen, Q., Zuo, C., and Tian, L. (2019). High-speed in vitro intensity diffraction tomography. Adv. Photonics 1, 1. doi:10.1117/1.ap.1.6.066004
Lu, L., Li, J., Shu, Y., Sun, J., Zhou, J., Lam, E. Y., et al. (2022). Hybrid brightfield and darkfield transport of intensity approach for high-throughput quantitative phase microscopy. Adv. Photonics 4, 056002. doi:10.1117/1.ap.4.5.056002
Mann, C. J., Yu, L., Lo, C.-M., and Kim, M. K. (2005). High-resolution quantitative phase-contrast microscopy by digital holography. Opt. Express 13, 8693–8698. doi:10.1364/opex.13.008693
Mir, M., Wang, Z., Shen, Z., Bednarz, M., Bashir, R., Golding, I., et al. (2011). Optical measurement of cycle-dependent cell growth. Proc. Natl. Acad. Sci. U. S. A. 108, 13124–13129. doi:10.1073/pnas.1100506108
Nomarski, G. (1955). Differential microinterferometer with polarized waves. J. Phys. Radium Paris 16, 9S.
Parvati, K., Rao, P., and Mariya Das, M. (2008). Image segmentation using gray-scale morphology and marker-controlled watershed transformation. Discrete Dyn. Nat. Soc. 2008, 1–8. doi:10.1155/2008/384346
Pavillon, N., Arfire, C., Bergoënd, I., and Depeursinge, C. (2010). Iterative method for zero-order suppression in off-axis digital holography. Opt. Express 18, 15318–15331. doi:10.1364/oe.18.015318
Pavillon, N., Seelamantula, C. S., Kühn, J., Unser, M., and Depeursinge, C. (2009). Suppression of the zero-order term in off-axis digital holography through nonlinear filtering. Appl. Opt. 48, H186–H195. doi:10.1364/ao.48.00h186
Popescu, G., Park, K., Mir, M., and Bashir, R. (2014). New technologies for measuring single cell mass. Lab. Chip 14, 646–652. doi:10.1039/c3lc51033f
Popescu, G., Park, Y., Lue, N., Best-Popescu, C., Deflores, L., Dasari, R. R., et al. (2008). Optical imaging of cell mass and growth dynamics. Am. J. Physiology-Cell Physiology 295, C538–C544. doi:10.1152/ajpcell.00121.2008
Rappaz, B., Cano, E., Colomb, T., Kuhn, J., Depeursinge, C. D., Simanis, V., et al. (2009). Noninvasive characterization of the fission yeast cell cycle by monitoring dry mass with digital holographic microscopy. J. Biomed. Opt. 14, 034049. doi:10.1117/1.3147385
Sezgin, M., and Sankur, B. (2004). Survey over image thresholding techniques and quantitative performance evaluation. J. Electron. Imaging 13, 146–165. doi:10.1117/1.1631315
Shen, Q., Sun, J., Fan, Y., Li, Z., Gao, P., Chen, Q., et al. (2022). High-throughput artifact-free slightly off-axis holographic imaging based on Fourier ptychographic reconstruction. Front. Phot. 29. doi:10.3389/fphot.2022.936561
Shu, Y., Sun, J., Lyu, J., Fan, Y., Zhou, N., Ye, R., et al. (2022). Adaptive optical quantitative phase imaging based on annular illumination Fourier ptychographic microscopy. PhotoniX 3, 1–15. doi:10.1186/s43074-022-00071-3
Sun, J., Zuo, C., Zhang, L., and Chen, Q. (2017). Resolution-enhanced Fourier ptychographic microscopy based on high-numerical-aperture illuminations. Sci. Rep. 7, 1–11. doi:10.1038/s41598-017-01346-7
Sun, Y., and Thakor, N. (2015). Photoplethysmography revisited: From contact to noncontact, from point to imaging. IEEE Trans. Biomed. Eng. 63, 463–477. doi:10.1109/tbme.2015.2476337
Takeda, M., Ina, H., and Kobayashi, S. (1982). Fourier-transform method of fringe-pattern analysis for computer-based topography and interferometry. J. Opt. Soc. Am. 72, 156–160. doi:10.1364/josa.72.000156
Thirusittampalam, K., Hossain, M. J., Ghita, O., and Whelan, P. F. (2013). A novel framework for cellular tracking and mitosis detection in dense phase contrast microscopy images. IEEE J. Biomed. Health Inf. 17, 642–653. doi:10.1109/titb.2012.2228663
Vicar, T., Balvan, J., Jaros, J., Jug, F., Kolar, R., Masarik, M., et al. (2019). Cell segmentation methods for label-free contrast microscopy: Review and comprehensive comparison. BMC Bioinforma. 20, 1–25. doi:10.1186/s12859-019-2880-8
Zernike, F. (1942). Phase contrast, a new method for the microscopic observation of transparent objects. Physica 9, 686–698. doi:10.1016/s0031-8914(42)80035-x
Zheng, C., Jin, D., He, Y., Lin, H., Hu, J., Yaqoob, Z., et al. (2020). High spatial and temporal resolution synthetic aperture phase microscopy. Adv. Photonics 2, 065002. doi:10.1117/1.ap.2.6.065002
Zheng, G., Horstmeyer, R., and Yang, C. (2013). Wide-field, high-resolution Fourier ptychographic microscopy. Nat. Photonics 7, 739–745. doi:10.1038/nphoton.2013.187
Zhou, N., Li, J., Sun, J., Zhang, R., Bai, Z., Zhou, S., et al. (2022). Single-exposure 3d label-free microscopy based on color-multiplexed intensity diffraction tomography. Opt. Lett. 47, 969–972. doi:10.1364/ol.442171
Zuo, C., Li, J., Sun, J., Fan, Y., Zhang, J., Lu, L., et al. (2020). Transport of intensity equation: A tutorial. Opt. Lasers Eng. 135, 106187. doi:10.1016/j.optlaseng.2020.106187
Keywords: digital holographic microscopy, quantitative phase imaging, live-cell imaging, slightly off-axis holography, cellular dry mass
Citation: Shen Q, Li Z, Sun J, Fan Y, Chen Y, Gu H, Gao P, Chen Q and Zuo C (2022) Live-cell analysis framework for quantitative phase imaging with slightly off-axis digital holographic microscopy. Front. Photonics 3:1083139. doi: 10.3389/fphot.2022.1083139
Received: 28 October 2022; Accepted: 02 December 2022;
Published: 22 December 2022.
Edited by:
Ting-Chung Poon, Virginia Tech, United StatesReviewed by:
Guoan Zheng, University of Connecticut, United StatesLu Rong, Beijing University of Technology, China
Copyright © 2022 Shen, Li, Sun, Fan, Chen, Gu, Gao, Chen and Zuo. This is an open-access article distributed under the terms of the Creative Commons Attribution License (CC BY). The use, distribution or reproduction in other forums is permitted, provided the original author(s) and the copyright owner(s) are credited and that the original publication in this journal is cited, in accordance with accepted academic practice. No use, distribution or reproduction is permitted which does not comply with these terms.
*Correspondence: Peng Gao, cGVuZy5nYW9AeGlkaWFuLmVkdS5jbg==; Chao Zuo, enVvY2hhb0BuanVzdC5lZHUuY24=