 Ting-Hang Pei
 Kei-Hsiung Yang
- College of Photonics, National Yang Ming Chiao Tung University, Tainan, Taiwan
The analytical distribution of the electric field in a micro-lens made of polymer-stabilized blue phase liquid crystals (PS-BPLCs) between two electrodes has been derived, and ray bending and focusing for the o (ordinary) and e (extraordinary) rays caused by the field-induced extended Kerr effect on the PS-BPLC have also been calculated. Those calculations show that the focal lengths of most o rays are longer than those of e rays. The o and e rays result in a focal length of 11.6 cm at a Kerr constant of 2.3768 nm/V2 close to the experimental data, and the calculated focal spot diameter is about 80.0 μm. If the Kerr constant is decreased to 2.14 nm/V2, we can obtain a focal length of 13.1 cm, the same as the experimental data. This reduction in the Kerr constant is reasonable because it is still within the experimental error. In summary, our calculations reveal an efficient and accurate way to discuss the focusing phenomena in the PS-BPLC micro-lens.
After Kikuchi et al. (2002) reported polymer-stabilized blue phase liquid crystals (PS-BPLCs) with an across-room-temperature range of 60°C, there has been an extensive research study to apply PS-BPLC for electro-optical (EO) devices (Haseba et al., 2005; Hisakado et al., 2005; Kikuchi et al., 2007; Choi et al., 2008; Ge et al., 2009a) due to its fast response time (10–4 s), alignment-layer-free, and no need of polarizers to increase light efficiency. The fast electro-optical response of the PS-BPLC is mainly based on a local director reorientation within the unit lattice of the cubic blue phase structure (Kikuchi et al., 2002). Macroscopically, it exhibits the Kerr effect, which is caused by an applied voltage larger than the threshold voltage to change the PS-BPLC medium from optically isotropic to anisotropic.
Recently, a polarizer-free and fast response micro-lens array based on the optical phase modulation of PS-BPLC has been reported (Lin et al., 2010). When a voltage V is applied across the PS-BPLC medium, birefringence can be induced as V exceeds the critical voltage Vc (Chen et al., 2010; Lin et al., 2010). Furthermore, the optical axis of the induced refractive-index ellipsoid is along the electric field direction (Ge et al., 2009a; Ge et al., 2009b; Rao et al., 2010a). In this article, we used geometrical-optics-ray expansion to analyze their experimental results. First, we calculated the distributions of the electric potential and field in the PS-BPLC medium and then calculated the distribution of induced birefringence Δnind based on the extended Kerr effect (Jin et al., 2010a) caused by applied electric fields. Subsequently, we established the o (ordinary) and e (extraordinary) ray-path equations through the Fermat principle and Euler–Lagrange equation in PS-BPLC for the normal-incident case. Finally, the orientation and refractive indices of the ellipsoids are substituted into the o and e ray-path equations to calculate the focal lengths.
First of all, we have to know the basic optical characteristics of PS-BPLC. Following the development in Jin et al. (2010a), we assume that the weighted-average refractive index, naverage, is a constant at any applied electric field E. We call niso the isotropically refractive index. The expression for naverage and niso is:
Here, no(E) and ne(E) are the field-dependent refractive index perpendicular and parallel to the electric field, respectively. With the assumption of Eq. 1, no(E) and ne(E) under an electric field can be expressed as follows:
Because the electric field E is a spatial variable, no and ne are both functions of the radial coordinate ρ and vertical coordinate z.
The flowchart of the BP-LCD modeling based on the Kerr effect has been introduced in some references (Ge et al., 2009b). We carried out our calculations in three similar steps (Ge et al., 2009a; Jin et al., 2010b). First, compute the potential distribution by solving the Poisson equation
Consider one PS-BPLC micro-lens confined between two indium tin oxide (ITO) glasses as shown in Figure 1. The upper ITO glass holds at potential V, and the lower one holds at 0. We suppose that each size of these two glasses is much larger than the gap between them, so the structure can be treated as a parallel capacitor. If there is no pattern on these two glasses, the electric field is uniform inside PS-BPLC. The distance between two glasses is h1; therefore, the uniform electric field is E1 = V/h1. The potential above the upper glass at a very far distance h2 is supposed at zero; hence, the electric field outside the upper glass is E2 = V/h2, which is reasonably approximated to zero. By making a circular aperture with radius a on the upper electrode, an inhomogeneous electric field can be generated. Due to the inhomogeneous electric field, the path of light passing through PS-BPLC is not straight anymore. Next, the potential and electric field are solved in the (ρ,φ,z) coordinate where the upper electrode is set at z = 0. We neglect the thickness of the upper glass by considering that it only affects the final result very little. Because the structure is circularly symmetric and light with polarization in the ρ-z plane is normally incident into the PS-BPLC, the problem can be reduced to a two-dimensional one. The plane in Figure 1 is one intersectional plane through the center of the circle. The horizontal and vertical axes represent the ρ- and z-directions, respectively. The vector
where ε is the isotropic dielectric constant of PS-BPLC and
where
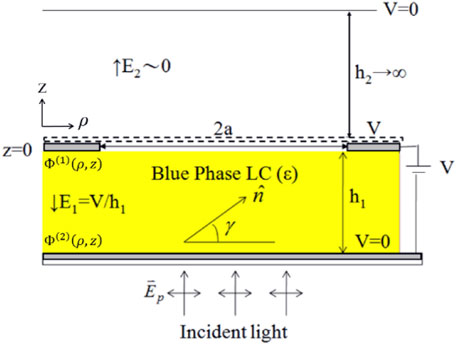
FIGURE 1. Structure of one micro-lens consisting of PS-BPLC between two glass substrates with upper and lower electrodes (gray region) and an opening circular aperture of diameter 2a in the upper electrode. In calculation, the thickness of the upper glass (dashed-line region) is neglected.
Finally, we follow the same processes (Jackson, 1999) to solve this problem for single
where
Next, the o and e ray-path equations are deduced. Kosmopoulos and Zenginoglou, (1987) used the geometrical-optics-ray approximation to solve a light beam passing through a thin nematic liquid crystal layer. They successfully calculated the ray inside the layer deviating from the normal and predicted the appearance of fringes. This approach can also be applied to our analysis because the aperture size is much larger than the wavelength of the incident light in our case. The incident light has its electric field polarized parallel to the ρ axis, and therefore light will retain its polarization as well as its propagation direction parallel to the ρ-z plane during passing through PS-BPLC. According to the Fermat principle (Bahaa, 2007), an optical ray traveling between the two points A and B follows a path such that the optical path length is minimum relative to neighboring paths. Then, the integral form of the optical path length for the o ray is
where ds is an infinitesimal length along the ray. Using the metric tensor and changing ds to dz, the integrand F is
Solving Eq. 10 with the initial conditions, one can obtain the o ray path inside PS-BPLC.
The propagation of the e ray is more complicated and harder to solve than that of the o ray. We consider a plane-polarized wave with its electric vector
where
where
Another similar term
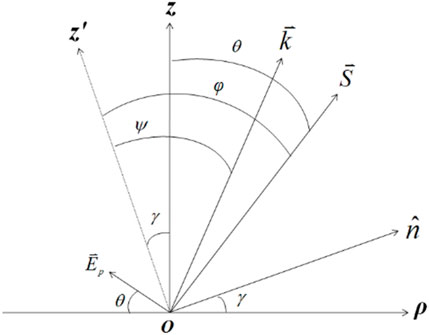
FIGURE 2. Relations of
In order to obtain the o and e ray-path Eqs.8, 10, the distribution of the electrostatic field and some parameters of PS-BPLC have to be known. In the calculation, the saturated refractive index change δnsat, the saturation field Es, and the Kerr constant K of PS-BPLC are important parameters when the extended Kerr effect model is used (Jin et al., 2010a). Previously, some Kerr constants have been reported. They are 0.473 nm/V2 (λ = 632.8 nm) (Ge et al., 2009a), 0.93 nm/V2 (λ = 633 nm) (Jin et al., 2010b), 1.033 × 10⁻⁹ m/V2 (λ = 632.8 nm) (Ge et al., 2009a; Ge et al., 2009b), and 12.7 nm/V2 (λ = 550 nm) (Ge et al., 2009b; Rao et al., 2010a; Rao et al., 2010b; Jiao et al., 2010). Furthermore, a large Kerr constant ∼26.3 nm/V2 in the low voltage region has also been reported (Kikuchi et al., 2009; Jin et al., 2010a). All those aforementioned reports used the same monomers, which are EHA (2-ethylhexyl, Fluka) and RM-257 (Merck), so those reported Kerr constants tell us the appropriate range for use. These two monomers were also adopted for preparing PS-BPLCs in Ref. (Lin et al., 2010). If the relationship between the induced birefringence and the applied electric field is obtained, one would be able to estimate the Kerr constant from it. Recently, the extended Kerr effect model (Jin et al., 2010a) has successfully explained such cases, so we use this model to deduce the Kerr constant. By investigating the relationships between the optical phase shifts of PSBP-LC and the applied voltages in Ref. (Lin et al., 2010), all of them show saturation trends, and the optical phase shift saturating at 150 Vrms is around ∼ π radian. Since the optical phase modulation of PS-BPLC is polarization-independent (Lin et al., 2010), the experimental data from any polarized light would give an approximate Kerr constant. In PS-BPLC, the employed LC host has an intrinsic birefringence of 0.142 (Lin et al., 2010). Furthermore, taking into account the LC concentration of 56.9 wt% (Lin et al., 2010), the maximum PS-BPLC birefringence should be less than 0.142 due to some strongly anchored BPLCs (Jin et al., 2010a). According to the aforementioned considerations, the experimental data of 0° linearly polarized light (p = 0) shown in Figure 3 of Ref. (Lin et al., 2010) are used to estimate δnsat, Es, and K. The relationship between the optical phase shift and the applied voltage is transferred to the relationship between the absolutely induced birefringence |Δn| and the applied electric field E. By using the extended Kerr effect model (Jin et al., 2010a) to fit the p = 0 experimental data, we obtain δnsat = 0.0467 and Es ∼ 10.71 V/μm. The experimental data and the fitting curve match each other very well, and both are shown in Figure 3. Then, the Kerr constant is estimated to be
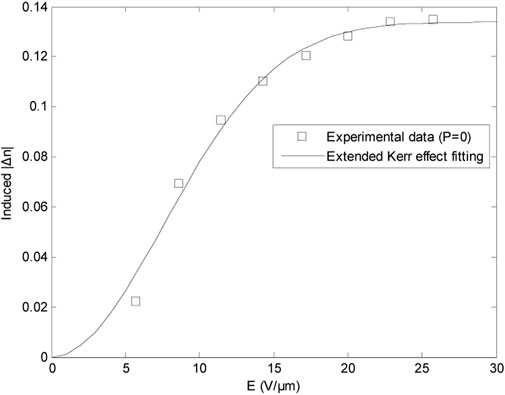
FIGURE 3. Relationships between the induced birefringence |Δn| and the applied electric field E by fitting the p = 0 experimental data (□) in Ref. (Lin et al., 2010) to the extended Kerr effect model (solid line).
Before the calculation, all parameters about the isotropically refractive index niso, the wavelength of light λ, the Kerr constant K, the saturation field Es, the applied voltage V, the critical voltage Vc, h1, and a have to be known. Except for niso, K, and Es, other parameters follow the values in Ref. (Lin et al., 2010). They are |Vpp| = 200 V (squared AC voltage in Figure 4 (Lin et al., 2010)), Vc = 20 Vrms, h1 = 20 μm, and a = 125 μm (Lin et al., 2010). K and Es at λ = 532 nm have been estimated by fitting them before. The only undetermined parameter is niso. In Ref. (Jin et al., 2010b), the refractive index at the voltage-off state was measured using an Abbe refractometer, and the refractive index change under an electric field was measured using a Michelson interferometer, and then the field-dependent index no(E) can be obtained directly. After measuring the induced birefringence at different incident angles subsequently, ne(E) can also be obtained by fitting. Eventually, the isotropically average refractive index niso was determined to be 1.5543 (Lin et al., 2011). According to the previous report (Li and Wu, 2004), the isotropically refractive index only decreased by 4%, while λ increases from 400 to 800 nm. So, we use niso = 1.5543 at λ = 532 nm, and the optical dielectric constant ε is (1.5543)2. Substituting the aforementioned parameters into Eqs 2, 3, 7, 8, and using the extended Kerr effect model, the electric field in the entire region as well as the effective optical index-ellipsoid of PS-BPLC can be obtained. It can be found that the directions of the optical axis are not all parallel to the z-direction, especially when the molecule is close to the edge of the micro-lens, the direction of the electric field has a larger inclined angle, which induces the optical axis to deviate much from the z-direction. Because the deviation exists, light in PS-BPLC is bent and focused on a small region after leaving the micro-lens.
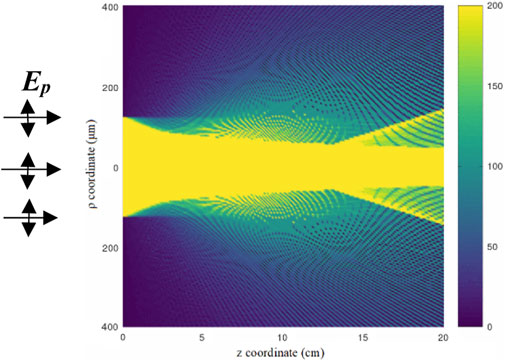
FIGURE 4. The intensity distribution of light in the ρ-z plane after the normal incident light passes through the micro-lens. The incident light is uniformly distributed in the circular region with a radius of a, and the polarization is denoted by EP perpendicular to the incident direction. The calculation only considers light from the micro-lens, and the focal length is 13.1 cm, the same as the experimental measurement (Lin et al., 2010). The focal length is determined by the collective effect of the o and e rays where the minimum spot size appears. The focal length of the e ray is only 2.5 cm, which is covered by the o ray, so the collective focal length is also the o ray focal length. In our simulations, the detector is supported to be able to detect minimum light intensity at least 3% of the maximum intensity. The parameters used here are h1 = 20 μm, a = 125 μm, λ = 532 nm, niso = 1.5543, Es ∼ 10.71 V/μm, and K = 2.14 nm/V2. This calculation shows a collective effect of o and e rays.
Then, the o and e ray-path Eqs 10, 12 can be solved numerically by using the fourth Runge–Kutta method (Nakamura, 1995; Alejandro, 2000). It is a highly precise method to calculate ray paths. We neglect the reflections of the o and e rays at z = 0 and z = -h1 planes because their reflectivity is small and has little effect on our analysis. Finally, by calculations, the focal lengths of most o rays are longer than those of e rays. The collective effect of both the rays indicates that the focal length is 11.6 cm, which is close to the experimental measurement of the focal length of 13.1 cm (Lin et al., 2010). The focal spot size is about 80.0 μm after passing through the micro-lens.
In fact, we ignore the thickness of the ITO glass in which PS-BPLC was sandwiched in experiments. Although the refractive index of ITO is 2.011 at 532 nm (Laux et al., 1998), which is higher than the isotropically refractive index niso = 1.5543, the very thin ITO glass would influence the focal length very less. By further analysis, there are several factors affecting the focal length by calculation. First, we find that the higher accurate potential and electric field inside the PS-BPLC micro-lens can improve the calculation. The second factor worthy of mentioning is the electrostatic epsilon ε of the PS-BPLC. This value is not mentioned in either Ref. (Lin et al., 2010) or Ref. (Lin et al., 2011). Therefore, we just use a value of ten close to the general case we used in LC (Cannon and Pethrick, 1999). It is also a tunable value in calculations, which can improve our calculation results closer to the experimental value. Hence, ε is also a considerable factor in our calculations. Third, the Kerr constant would be an undetermined or inaccurate value in our calculations. About the estimation of the Kerr constant, if we use the optical phase shift data of the phase modulation in Figure 3 of Ref. (Lin et al., 2010), two data at about 40 Vrms and 60 Vrms can tell us that the Kerr constant is as high as 1.4–1.8 nm/V2 at λ = 633 μm. By using the extended Kerr effect model, the fitting curve for the p = 0 experimental data as shown in Figure 3 gives K = 1.8441 nm/V2 at λ = 633 and 2.3768 nm/V2 at λ = 532 nm. Moreover, the same PS-BPLC prescription is also used to measure the Kerr constant (Lin et al., 2011). The value is different from the values in Ref. (Lin et al., 2010). Therefore, the tolerance of the Kerr constant is reasonably allowed in calculations. Actually, many possible errors in experiments would lead to the measured deviation of the Kerr constant and affect the focal length finally. If we decrease the Kerr constant to 2.14 nm/V2, the focal length will increase to 13.1 cm by calculation, which is the same as the experimental result (Lin et al., 2010). The distribution of light intensity of this case is shown in Figure 4. Our calculation indeed shows the collective effect of both the rays. Even though the Kerr constant increases to a higher value, it is still reasonable and in the range of previous reports (Ge et al., 2009a; Ge et al., 2009b; Kikuchi et al., 2009; Jin et al., 2010a; Rao et al., 2010a; Jin et al., 2010b; Rao et al., 2010b; Jiao et al., 2010). In addition, the micro-lens array was used in experiments such that the electric potential is periodic in the plane perpendicular to the z-axis. On the contrary, we only consider one micro-lens in the calculation, so the distribution of the electric potential lacks the periodicity that results in a little deviation from the experiments. According to Figure 4 in Ref. (Lin et al., 2010), all micro-lenses are close to each other. The shortest distance between two micro-lenses might be only 40–50 μm, about two times larger than the cell gap. Therefore, the voltage and electric field will affect each other near the edge of each micro-lens. This effect can be discussed by imposing the periodic boundary on the edge of the micro-lens.
In conclusion, we have solved the analytical distribution of the electric potential and field in a PS-BPLC micro-lens between two electrodes. The direction of the optical axis is along the electric field, and birefringence is induced by the extended Kerr effect. Because of the inhomogeneous electric field, the o and e rays bend and focus after passing through the biased PS-BPLC. Some new ways of demonstrating PS-BPLC consisting of nanoparticles are worthy of studying for the improvement of optical performance (Wang et al., 2013; Xu et al., 2015; Adam et al., 2020). Our calculated focal length is 11.6 cm based on the Kerr constant derived from the experimental data (Lin et al., 2010), which is close to the experimentally measured focal length of 13.1 cm. Meanwhile, the calculated focal spot size is about 80.0 μm. We also propose several factors affecting the calculated focal length by considering the accurate potential and electric field, the electrostatic epsilon ε of PS-BPLC, and a variable Kerr constant. Therefore, the focal length can increase to 13.1 cm when the Kerr constant is reduced to 2.14 nm/V2, which is still reasonably allowed in calculations. In addition, there is one advantage of our method, that is, the calculation speed is much faster than the finite-difference time-domain method to evaluate the focal length of the PS-BPLC micro-lens. In this article, we demonstrate a way with strict deductions in physics to study PS-BPLC. Other complicated problems would be discussed based on our case or improving our model to further calculate optical performances.
Data availability statement
The original contributions presented in the study are included in the article/supplementary material; further inquiries can be directed to the corresponding author.
Author contributions
K-HY proposed this research experimentally proceeded by some group, and it can be discussed theoretically. Then, T-HP tried to collect all the related references and thought about how to calculate it by combining electric field distribution with the Kerr effect in the blue phase liquid crystals. T-HP paid much attention to build the model to calculate the field distribution inside the blue phase liquid crystal and then used the Kerr effect to calculate the orientations of the blue phase liquid crystal as well as the refraction indices ne and no at each calculated point. Finally, he built the whole model and wrote the ray-tracing program to calculate light focusing after passing through the micro-lens made of the stabilized-polymer blue phase liquid crystal. During the research, T-HP continuously updated the progress with K-HY and discussed the detailed calculation results. T-HP also finished this manuscript and submitted this manuscript.
Conflict of interest
The authors declare that the research was conducted in the absence of any commercial or financial relationships that could be construed as a potential conflict of interest.
Publisher’s note
All claims expressed in this article are solely those of the authors and do not necessarily represent those of their affiliated organizations, or those of the publisher, the editors, and the reviewers. Any product that may be evaluated in this article, or claim that may be made by its manufacturer, is not guaranteed or endorsed by the publisher.
References
Adam, P., Kalavalapalli, T. Y., Iliut, M., McConnell, B., and Dierking, I. (2020). Stabilization of liquid crystal blue phases by carbon nanoparticles of varying dimensionality. Nanoscale Adv. 2, 2404–2409. doi:10.1039/D0NA00276C
Alejandro, L. (2000). Garcia, numerical methods for physics. 2nd ed. Englewood Cliffs, NJ: Printice-Hall Inc.
Bahaa, E. A. (2007). Saleh and malvin carl teich, fundamentals of optics. 2nd ed. Hoboken, New Jersey: John Wiley & Sons.
Cannon, Linda A., and Pethrick, Richard A. (1999). Effect of the glass-transition temperature on film formation in 2-ethylhexyl acrylate/methyl methacrylate emulsion copolymers. Macromolecules 32, 7617–7629. doi:10.1021/ma990273i
Chen, K. M., Gauza, S., Xianyu, H., and Wu, S.-T. (2010). Submillisecond gray-level response time of a polymer-stabilized blue-phase liquid crystal. J. Disp. Technol. 6, 49–51. doi:10.1109/jdt.2009.2037981
Choi, S.-W., Yamamoto, S.-I., Haseba, Y., Higuchi, H., and Kikuchi, H. (2008). Optically isotropic-nanostructured liquid crystal composite with high Kerr constant. Appl. Phys. Lett. 92, 043119. doi:10.1063/1.2838352
Ge, Z., Gauza, S., Jiao, M., Xianyu, H., and Wu, S.-T. (2009a). Electro-optics of polymer-stabilized blue phase liquid crystal displays. Appl. Phys. Lett. 94, 101104. doi:10.1063/1.3097355
Ge, Z., Rao, L., Gauza, S., and Wu, S.-T. (2009b). Modeling of blue phase liquid crystal displays. J. Disp. Technol. 5, 250–256. doi:10.1109/JDT.2009.2022849
Haseba, Y., Kikuchi, H., Nagamura, T., and Kajiyama, T. (2005). Large electro-optic Kerr effect in nanostructured chiral liquid crystal composites over A wide temperature range. Adv. Mat. 17, 2311–2315. doi:10.1002/adma.200500042
Hisakado, Y., Kikuchi, H., Nagamura, T., and Kajiyama, T. (2005). Large electro-optic Kerr effect in polymer-stabilized liquid-crystalline blue phases. Adv. Mat. 17, 96–98. doi:10.1002/adma.200400639
Jiao, M, Li, Y, and Wu, S-T (2010). Low voltage and high transmittance blue-phase liquid crystal displays with corrugated electrodes. Appl. Phys. Lett. 96, 011102–0111023. doi:10.1063/1.3290253
Jin, Y., Cheng, H.-C., Gauza, S., Li, Y., Jiao, M., Rao, L., et al. (2010a). Extended Kerr effect of polymer-stabilized blue-phase liquid crystals. Appl. Phys. Lett. 96, 071105. doi:10.1063/1.3318288
Jin, Y, Jiao, M, Rao, L, and Wu, S.T. (2010b). Direct measurement of electric-field-induced birefringence in a polymer-stabilized blue-phase liquid crystal composite. Opt. Exp. 18, 11450. doi:10.1364/OE.18.011450
Kikuchi, H., Haseba, Y., Yamamoto, S., Iwata, T., and Higuchi, H. (2009). 39.1: Invited paper: Optically isotropic nano-structured liquid crystal composites for display applications. SID Symp. Dig. 40, 578–581. doi:10.1889/1.3256842
Kikuchi, H., Higuchi, H., Haseba, Y., and Iwata, T. (2007). 62.2:Invited paper: Fast electro-optical switching in polymer-stabilized liquid crystalline blue phases for display application. SID Symposium Dig. Tech. Pap. 38, 1737–1740. doi:10.1889/1.2785662
Kikuchi, H., Yokota, M., Hiskado, Y., Yang, H., and Kajiyama, T. (2002). Polymer-stabilized liquid crystal blue phases. Nat. Mat. 1, 64–68. doi:10.1038/nmat712
Kosmopoulos, J. A., and Zenginoglou, H. M. (1987). Geometrical optics approach to the nematic liquid crystal grating: Numerical results. Appl. Opt. 26, 1714. doi:10.1364/ao.26.001714
Laux, S., Kaiser, N., Zöller, A., Götzelmann, R., Lauth, H., and Bernitzki, H. (1998). Room-temperature deposition of indium tin oxide thin films with plasma ion-assisted evaporation. Thin Solid Films 335, 1–5. doi:10.1016/s0040-6090(98)00861-x
Li, J., and Wu, S. T. (2004). Extended Cauchy equations for the refractive indices of liquid crystals. J. Appl. Phys. 95, 896–901. doi:10.1063/1.1635971
Lin, Y-H, Chen, H-S, Lin, H-C, Tsou, Y-S, Hsu, H-K, and Li, W-Y (2010). Polarizer-free and fast response microlens arrays using polymer-stabilized blue phase liquid crystals. Appl. Phys. Lett. 96, 113505. doi:10.1063/1.3360860
Lin, Y-H, Chen, H-S, Wu, C-H, and Hsu, H-K (2011). Measurement electric-field-induced birefringence in polymer stabilized blue-phase liquid crystals based on phase shift measurements. J. Appl. Phys. 109, 104503–104506. doi:10.1063/1.3583572
Rao, L, Ge, Z, and Wu, S-T (2010a). Viewing angle controllable displays with a blue-phase liquid crystal cell. Opt. Express 18, 3143. doi:10.1364/oe.18.003143
Rao, L, Ge, Z, and Wu, S-T (2010b). Zigzag electrodes for suppressing the color shift of Kerr effect-based liquid crystal displays. J. Disp. Technol. 6, 115–120. doi:10.1109/JDT.2009.2039463
Wang, L., He, W., Wang, Q., Yu, M., Xiao, X., Zhang, Y., et al. (2013). Polymer-stabilized nanoparticle enriched blue phase liquid crystals. J. Mat. Chem. C 1, 6526–6531. doi:10.1039/C3TC31253D
Keywords: micro-lens, focal length, blue phase, liquid crystal, Kerr effect, birefringence
Citation: Pei T-H and Yang K-H (2022) Light-focusing phenomena of field-tuned micro-lens made of polymer-stabilized blue phase liquid crystals. Front. Photonics 3:960142. doi: 10.3389/fphot.2022.960142
Received: 02 June 2022; Accepted: 03 August 2022;
Published: 09 September 2022.
Edited by:
Anna Bezryadina, California State University Northridge, United StatesReviewed by:
Xinzheng Zhang, Nankai University, ChinaMoritsugu Sakamoto, Nagaoka University of Technology, Japan
Copyright © 2022 Pei and Yang. This is an open-access article distributed under the terms of the Creative Commons Attribution License (CC BY). The use, distribution or reproduction in other forums is permitted, provided the original author(s) and the copyright owner(s) are credited and that the original publication in this journal is cited, in accordance with accepted academic practice. No use, distribution or reproduction is permitted which does not comply with these terms.
*Correspondence: Ting-Hang Pei, dGhwZWlAbnljdS5lZHUudHc=