 Sandra I. Vieira1†*
 Raquel Nunes da Silva1,2†
 Mariana Alves1
 Roberto A. Dias1‡
 Ana M. Meireles Sousa3Fatima Camões1André Maia4
 Mónica Almeida5
 João Rocha6*Artur M. Silva2
 Samuel Guieu2,6*
- 1Institute of Biomedicine iBiMED, Department of Medical Sciences, University of Aveiro, Aveiro, Portugal
- 2LAQV-REQUIMTE, Department of Chemistry, University of Aveiro, Aveiro, Portugal
- 3Department of Developmental Biology, Stanford University School of Medicine, Stanford, CA, United States
- 4i3S—Instituto de Investigação e Inovação em Saúde, Universidade do Porto, IBMC—Instituto de Biologia Molecular e Celular, Universidade do Porto, Porto, Portugal
- 5CESAM, Department of Biology, University of Aveiro, Aveiro, Portugal
- 6CICECO, Department of Chemistry, University of Aveiro, Aveiro, Portugal
Pathological lipid accumulation is a hallmark of several metabolic disorders, and detection of lipid aggregates is an essential step for initial diagnosis and drug screening purposes. However, low-cost, simple, and reliable detection fluorescent probes are not widely available. Here, six push-pull-push dyes were studied, and proved to be highly sensitive to the polarity of the medium, presenting potential to distinguish structures with different hydrophobic indexes. Importantly, in the presence of lipid aggregates their staining specificity highly increased and the fluorescence wavelength blue shifted. One of the compounds, named Liprobe, was physiologically inert in cells, as witnessed by mass-spectrometry and metabolic assays. Liprobe was not toxic to living zebrafish embryos, and differentially stained the muscle and bone tissues. In triglyceride solutions, a high correlation was observed between Liprobe’s 558 and 592 nm emissions and the 0–2.5 mg dl−1 triglyceride range. Confocal and cell-based high content screens revealed that this fluorophore was able to selectively detect lipid droplets and ceramide loads in normal and Farber’s disease human fibroblasts, respectively. Our results demonstrate that Liprobe is a suitable fluorescing probe for vital staining of lipid aggregates, compatible with a rapid and cheap high content screening assays for preliminary diagnosis of Farber’s disease and, potentially, of other lipidosis.
Introduction
Lipids comprise a large and important class of biomolecules highly relevant in metabolism and signaling (Hannun and Obeid, 2018). They integrate multiple biochemical functions, such as energy production, cell membranes generation, and act as chemical signals for cell and organ communication. Thus, they are important for all tissues, (Gross and Silver, 2014), (Walther and Farese, 2012) and alterations in the lipid homeostasis may greatly impact the whole organism. Lipid-based disorders (or lipidosis) encompass a wide range of lipid metabolic diseases with harmful accumulation of lipids in various cells and tissues. Most lipid disorders are related to diet and lifestyle (80%) and result in dyslipidaemia, particularly hyperlipidaemia, a well-established risk factor for atherosclerosis and cardiovascular disease that lead to more than 17.9 million deaths per year. (WHO, 2002), (Pischon et al., 2008), (Adams et al., 2006) The other 20% are mostly familial lipid disorders, including inherited lipid storage diseases such as Gaucher, Tay-Sachs, Fabry, and Farber’s diseases (Elias et al., 2008). The detection of lipid loads in cells and tissues via, e.g., high-content screening (HCS), is important for lipidosis diagnosis and therapeutic drugs screening, and may also assist identifying individuals for risk prevention (Galema -Boers and Van Lennep, 2015).
Cell- or plasma-based HCS diagnosis and drug development must be fast and affordable, benefiting from the implementation of user-friendly probes for lipid aggregates’ detection. Fluorescent probes fitting these criteria would be ideal, since fluorescence-based detection techniques are amongst the most sensitive. Fluorescence labelling is highly employed in biology and medicine for therapeutic means (Serra et al., 2009) or to image tissues, cells or specific subcellular structures (Nunes da Silva et al., 2019). Although several fluorescent probes have been developed for lipid droplets staining, (Fam et al., 2018), (Tatenaka et al., 2019) the commercial probes have drawbacks that limit their use, such as poor solubility hindering the staining process, high prices, and a limited range of absorption and emission wavelengths. Hence, it is of interest to develop user friendly and affordable fluorescent probes for lipid load detection, compatible with HCS.
Push-pull fluorophores have been successfully used for imaging living cells, (Didier et al., 2009), (Dang et al., 2018) in particular because of their large Stokes’ shifts. For example, certain substituted chalcone derivatives exhibit high quantum yields in solution and are efficient probes for ex vivo imaging (Lee et al., 2012). Here, we report a series of six push-pull-push fluorophores, decorated with halogen atoms. All the compounds exhibit good molar extinction coefficients and fair quantum yields. Importantly, the compounds present a large Stokes’ shift and their emission maximum is much influenced by the polarity of the surrounding environment, and they are biocompatible. Moreover, they are highly selective for intracellular lipid aggregates, making them intriguing vital dyes for cellular imaging, in particular, for the detection of lipidic aggregates in fundamental and pharmaceutical studies.
Results and discussion
Synthesis and photophysical properties of the new push-pull-push chromophores
The chromophores 1a-c (linear) and 2a-c (cyclic), decorated with halogen atoms, were synthesized following a common strategy. The building blocks were obtained by chlorination or bromination of 4-dimethylaminobenzaldehyde using n-chlorosuccinimide or n-bromosuccinimide (Guieu et al., 2013), (Vaz et al., 2016). The double condensation of the appropriate benzaldehyde with acetone or cyclohexanone gave the linear and cyclic chromophores, respectively, in fair to good yields (Scheme 1). The structures of the linear (1a-c) and cyclic (2a-c) fluorophores were confirmed by NMR, MS and HRMS or elemental analysis. Synthesis details and NMR spectra are given in the Supplementary Materials.
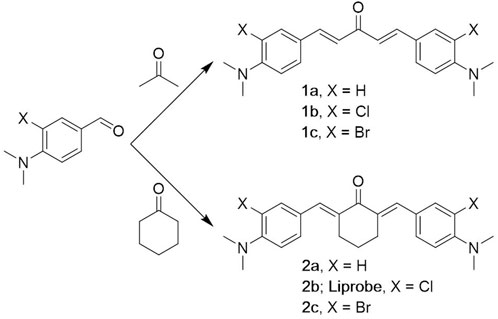
SCHEME 1. Synthesis of the probes.
The compounds 1a-c were obtained as oils or amorphous solids, while the cyclic equivalents 2a-c were crystalline solids. Single crystals suitable for X-ray diffraction were obtained by slow evaporation of a saturated solution in dichloromethane (Cambridge Crystallographic Data Centre). The crystal structure of 2a has been published, (Yakimanski et al., 1997), and it is described here for comparison with the halogenated analogues. Although in 2a the asymmetric unit is half of the molecule (Figure 1), for the halogenated derivatives 2b-c the asymmetric unit consists of two different molecules, mirror images of each other (only one of the molecules is shown in Figure 1, for clarity).
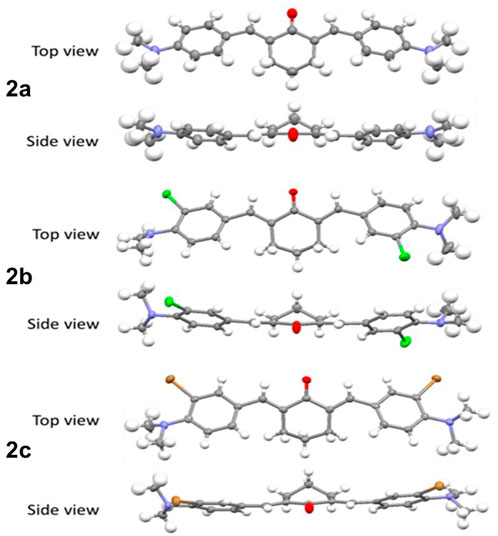
FIGURE 1. Crystal structures of the probes 2a-c; Thermal ellipsoids are shown at the 50% probability level, hydrogen atoms are shown with an arbitrary radius (0.30Å). C, grey; O, red; N, blue; H, white; Cl, green; Br, brown.
All bonds and angles are in the normal ranges (Allen et al., 1987). The crystal structures confirmed the formation of the double bonds and their (E)- configuration. In the crystals, the two phenyl rings are coplanar and rotated in the same direction relatively to the central cyclohexanone. No halogen bonds are present, the molecules being held together solely by a network of weak hydrogen bonds.
UV-vis absorption experiments were carried out in dichloromethane (DCM) solutions. The main band is ascribed to the S0–S1 (n–π*) transition, observed at ca. 440 nm for 1a and 2a (Figure 2, full lines). Substitution of the phenyl rings with a halogen atom shifts this absorption maximum to shorter wavelengths (ca. 380 nm). The molar extinction coefficient does not seem to be influenced by the presence of halogens on the phenyl rings (Table 1). The weaker band at 270 nm is similar for all compounds and attributed to the S0–S2 (p–p*) transition.
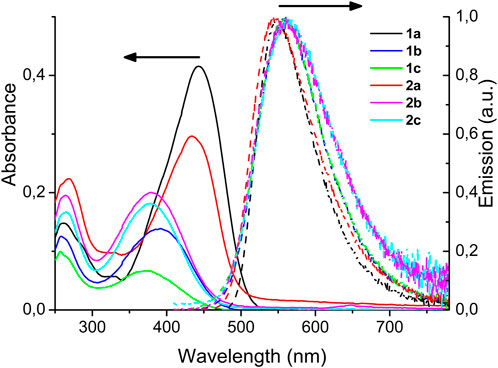
FIGURE 2. Absorption and normalized emission spectra in dichloromethane.
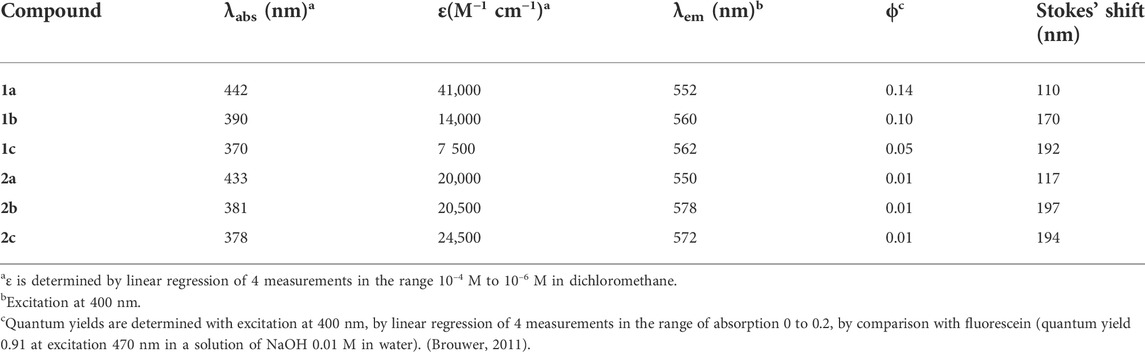
TABLE 1. Photophysical data in dichloromethane.
The emission spectra were recorded at low concentration in DCM solutions (Figure 2, dotted lines). All compounds emit at similar wavelength, between 500 and 700 nm, as a broad band centered around 560 nm. The quantum yields are modest, ranging from 0.01 to 0.14 and, in the linear series, the presence of the halogen on the phenyl rings is detrimental to the emission efficiency. In the cyclic series (compounds 2a-c), the quantum yields are probably too small to allow seeing an influence of the halogen atoms. The large Stokes’ shift observed for all chromophores, ranging from 110 to 197 nm, is characteristic of a transition with charge transfer character, occurring from the dimethylamino groups to the ketone via the two butadiene bridges.
Biocompatibility and imaging in mammalian cultured cells
The choice of a fluorophore for cellular imaging should not rely solely on its in vitro properties, such as the quantum yield measured in dichloromethane, but also take in consideration its properties in cells. The compounds’ capacity to be internalized by living cells, their fluorescence distribution and relative intensity, were first analyzed in HeLa cells (here exemplified for cyclic 2a-c). As expected, due to their absorption maximum (Figure 2), the fluorophores could be excited with confocal microscope’s 405 and 458 nm laser lines. Given that the optimum concentration to maximize the emission of fluorophores is between 10 and 100 µM (more concentrated the fluorescence is quenched, more diluted the fluorescence decreases linearly), further assays were performed in that concentration range.
All compounds were taken up within 1 h by living HeLa cells (Supplementary Figure S1). Surprisingly, although the quantum yield of 2b is 10 times lower than its linear analogue 1b, the former appeared inside cells with high emission when excited with equal laser power at 405 nm (Table 1 and SI). Nevertheless, a general tendency of brighter emission for fluorophores with chloride for hydrogen substitution could not be found.
Cells were not affected by 1 h incubation with the fluorophores and, to confirm their biocompatibility, two cell lines (HeLa and MC3T3) were incubated with 1 µM of the compounds for 24 h (Supplementary Figure S2) and cells viability monitored. Only 1c and 2a rendered significantly decreased viabilities, and only in HeLa cells (ca. 30 and 20%, respectively, Supplementary Figure S2). The fluorophores were still visible in cells following 24 h, here exemplified for 2b (Supplementary Figure S3A). Depending on their localization, the fluorophores emitted in the green, yellow, or red regions (Supplementary Figure S3B).
Importantly, the powdered fluorophores were stable for more than 1 year and their intensities in fixed cells stored in PBS were stable for at least 1 month.
Next, the emission lambda scans of the compounds were recorded on a 510-META confocal microscope upon excitation with the 405 nm diode laser. Figure 3A shows the emission spectra of 1a and 2b, the brightest fluorophores in cells. Spectra of 1b, 1c, 2a and 2c (Supplementary Figure S4) were very similar to the spectrum of 2b (Figure 3A, left graph), with a characteristic narrow peak. Spectrum of compound 1a displays a wider band (Figure 3A, right graph).
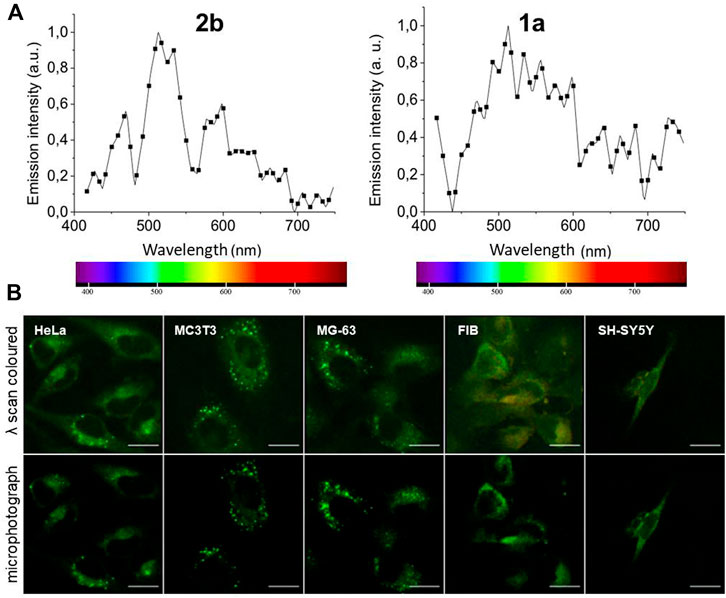
FIGURE 3. (A) Lambda scans of fluorophores 2b (20 μM, left graph) and 1a (100 μM, right graph) in HeLa cells. (B) Microphotographs of cell lines of human (cervix tumor HeLa, skin Fibroblasts ‘FIB’, neuroblastoma SH-SY5Y, pre-osteoblast MG63) and rat (pre-osteoblast MC3T3) origins, incubated live with 20 μM of 2b for 2 h. Upper panel: lambda scans (exc. 405 nm; em. 411–754) and resulting pseudocolors. Lower panel: corresponding microphotographs taken in the 475–625 nm channel, colored green. Bar, 20 μm. Negative controls are shown in Supplementary Figure S3C.
Given its photophysical characteristics in cells, the cyclic compound 2b was selected as the best-performing fluorophore for live and fixed cells staining. The characteristics of 2b live imaging in several cell lines, mainly human, were analyzed upon 2 h incubation with 20 µM 2b (Figure 3B). Compound 2b emitted mostly in the green region (lambda-colored), and its emission was predominantly detected in cytoplasmic vesicles, where it emitted at higher intensity. Some faint staining of the aqueous cytoplasm could also be observed, while no nuclear staining was usually detected (Figure 3B; negative controls in Supplementary Figure S3C). Cells fluoresced primarily in bright green, occasionally in yellow/orange with red spots, but very rarely in blue (tested with various filter sets and various conditions) (Figure 3B and Supplementary Figure S3B).
The observed 2b subcellular spotted pattern may indicate lysosomal or mitochondrial staining, and this was further pursued. Co-staining of 2b with the lysosomal marker LAMP2 and the MitoTracker® vital dye for active mitochondria, revealed some co-localization with fluorophore 2b (Figures 4B,C, respectively). Although the Mander’s coefficients were of 26.3 ± 4.6 and 29.3 ± 4.4 for co-localization with LAMP2 or MitoTracker®, respectively, some of the apparent co-labeled structures were not morphologically equal. Hence, a high percentage of the Liprobe population stained other cytoplasmic structures and we hypothesized that 2b could differentially stain organelles with different polarities.
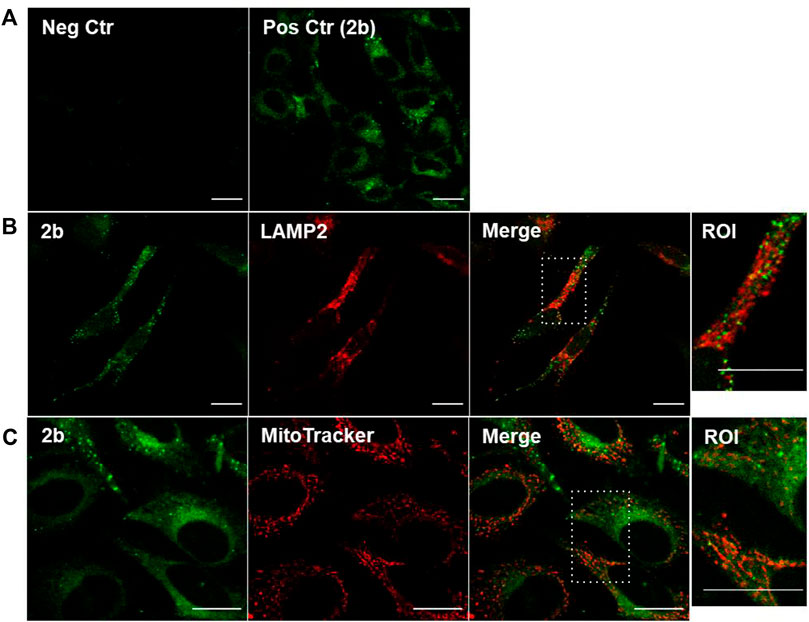
FIGURE 4. Co-localization studies of the fluorophore 2b with endolysosomal and mitochondrial markers in HeLa cells. (A) Negative control (‘Neg Ctr’), cells not stained; positive control (‘Pos Ctr’), living cells incubated for 2 h with 20 µM 2b. Cells were (B) co-stained with the endolysosomal marker LAMP2 (in red) after fixation or (C) with the viable mitochondrial marker MitoTracker Deep Red FM 633 nm (in red), in living cells. Compound 2b: exc. at 405 nm, em. 475–625 nm, colored green. LAMP2 and MitoTracker: exc. at 633 nm; em. 650–750 nm. Bar, 20 μm.
Solvatochromism effect and imaging cellular lipid aggregates
The observed differences between the compounds’ emission spectra in DCM and inside cells (Figures 2, 3A; Supplementary Figure S3) prompted us to investigate in more detail their optoelectronic properties, particularly solvatochromism. In a push-pull chromophore, the first excited state is highly polar, in the present chromophores with a negative charge on the oxygen and a positive one on the nitrogen atoms. Therefore, the polarity of the solvent or surrounding structures is crucial for the stabilization or destabilization of this excited state. A polar solvent stabilizes the excited state without influencing much the energy of the ground state, resulting in a decrease in the transition energy (higher emission wavelengths). The opposite occurs with a less polar solvent (lower emission wavelengths).
The influence of the solvent polarity on the emission spectrum was studied for all compounds; given the similarity of the obtained results, only the spectra of compound 2b are presented here as an example. As expected, in a mixture of THF and hexane (Figure 5A, left graph), when the percentage of hexane increased the polarity of the solvent decreased, and the emission maximum blue-shifted. In contrast, when the polarity of the solvent increased in a mixture of THF and water (Figure 5A, right graph), a red shift was observed in the emission maximum. The intensity of the emission was also investigated as a function of the solvent polarity (Figure 5B). The emission was maximal in solvents with medium polarity such as DCM or THF and decreased in more polar (water) or less polar (hexane) solvents. An interesting consequence is that the emission of polar and apolar solutions can be separated. A simple experiment was further conducted: water (2 ml) and hexane (2 ml) were added to a solution of 2b in THF; two phases were separated, and the fluorescence was only visible in the hexane phase, confirmed by recording the emission spectra of each phase (not shown). Hence, 2b is more soluble in pure hexane than in pure water and/or the emission is much stronger in pure hexane than in pure water. The same can be said for the other fluorophores.
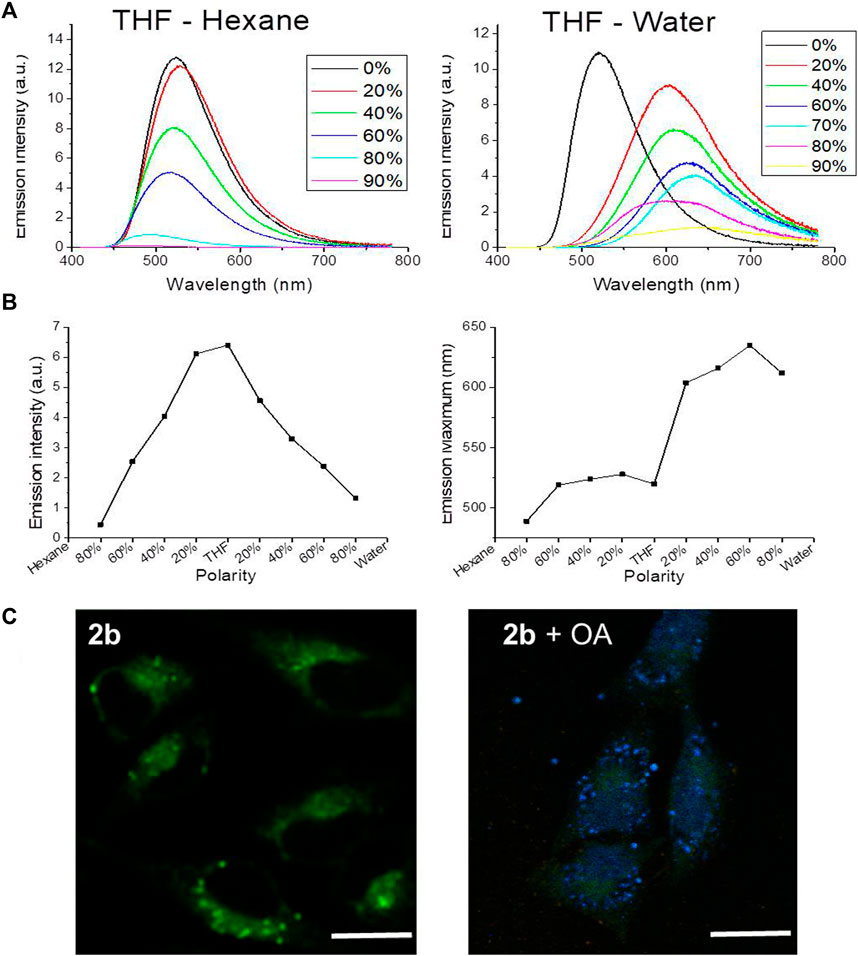
FIGURE 5. (A) Fluorescence of compound 2b (10–4 M; λex = 400 nm) in a THF/Hexane mixture with different percentages of hexane (left), or in a THF/Water mixture with different percentages of water (right). (B) Variation of compound 2b emission intensity (left) and its maximum emission wavelength (right), versus solvent polarity. (C) Lambda scan colored microphotographs of live HeLa cells incubated with compound 2b (20 µM) for 1h and previously incubated or not with oleic acid (“OA”) (exc. 405 nm). Bar, 20 μm.
Given that the fluorophores’ color shifts with the polarity of the environment in vitro, (Lakowicz, 2006), we further investigated whether they shift with the hydrophobicity of the subcellular organelles and are able to selectively mark cells and organelles with higher lipidic load. This was first explored in human cells where the lipid droplets content was increased by cells incubation with an oleic acid solution (Camões et al., 2015) (Figure 5C). Lipid droplets are dynamic cytoplasmic organelles found in most eukaryotic cells, where they participate in lipid storage for energy generation and membrane synthesis, among others (Walther and Farese, 2012).
In the presence of abundant lipid droplets, the fluorophores staining was more defined, revealing its selectivity for lipid aggregates. This also suggests that, in basal conditions, the fluorophores locate in cytoplasmic vesicles with more hydrophobic content. Furthermore, in conditions of lipid droplets abundance a blue-shift of the emission maximum was detected in cells (Figure 5C), with the fluorophores signaling in the blue range. As stated before, the ability of the fluorophores to selectively stain lipids is highly relevant, since they account for nearly half of the mass of cell membranes (Holthuis and Menon, 2014). The most widely used lipid droplet markers (Dang et al., 2018; Tatenaka et al., 2019), (Collot et al., 2018) are lipophilic fluorescent probes such as BODIPY 493/503 and Nile Red (9-diethylamino-5H-benzo [a]phenoxazine-5-one) (Listenberger et al., 2016). The compounds here presented share cellular staining properties with Nile Red, which is also highly membrane-permeant, not acutely toxic, and its emission shifts from red to yellow according to the level of hydrophobicity of the solvent (Diaz et al., 2008).
Differential staining of zebrafish embryos’ structures
To determine if 2b was able to penetrate and differentially counterstain small organisms in a physiologically innocuous manner, its solvatochromic staining properties were tested in zebrafish embryos (Figure 6). Vital dyes are extremely valuable to provide contextual information in these embryos that, due to their optical transparency and rapid development, are ideal systems to study numerous biological processes such as development and tissue regeneration (Cooper et al., 2005).
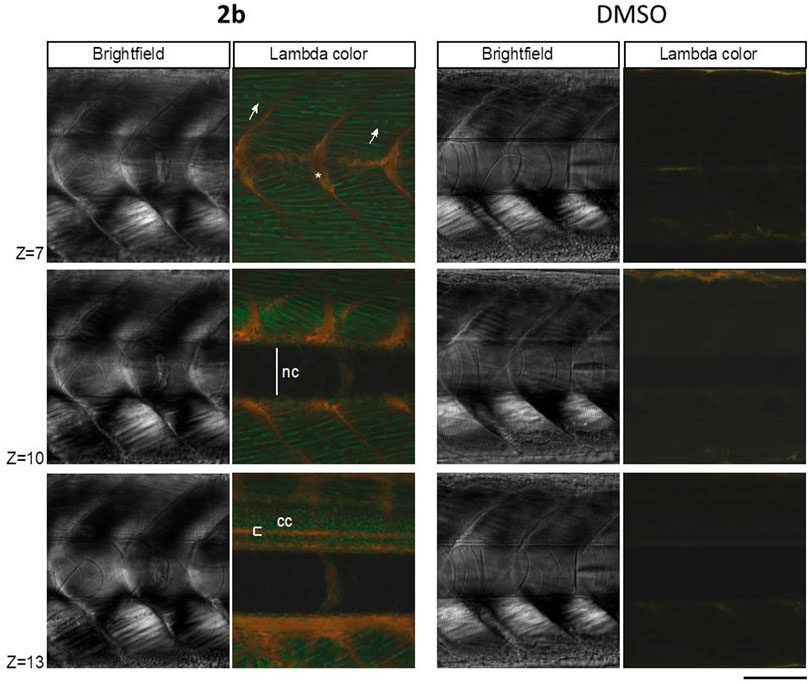
FIGURE 6. Zebrafish embryos at 4.5 dpf were incubated for 16 h with 50 µM compound 2b in DMSO. Confocal lambda scans (exc. 405 nm) of the trunk were taken at the level of the urogenital pore, at different focal planes (“z”). A DMSO alone condition was performed in parallel, as negative control. “nc”, notochord canal; “cc”, central canal; arrows: muscle cells/fibers—green fluorescing; asterisk: bone/cartilaginous tissue - orange fluorescing. Bar, 100 μm.
To first test for lethality, embryos were treated at 4 days post-fertilization (dpf) with different concentrations of 2b (10–50 µM) for increasing time (4–16 h) (n ≥ 30 fish/treatment, N = 5). No cellular or whole organism toxicity was observed for any 2b treatment, with 100% viability being obtained at 6 dpf, even with the higher dose tested (50 µM).
Lambda scans of embryos treated with 2b showed that the fluorophore penetrated deeply into the embryonic tissues (40 µm) and differentially stained its cells (Figure 6), as previously observed for the mammalian cell cultures (Figures 3–5).
Muscle cells were easily distinguished in 2b counterstained embryos, with the fluorophore emitting in the green spectral region (Figure 6, arrows). Another easily identifiable structure was the central canal (Figure 6, “cc”), with the fluorophore emitting in the yellow/red -spectral region. Compound 2b also stained in yellow/red the bone/cartilaginous tissue and was excluded from the notochord region (Figure 6, “nc”). At the single cell level, the fluorophore signal was absent or much reduced in the nuclei, allowing for the quick identification of tissues, such as muscle with clearly visible multinuclear cells (Figure 6, arrows).
Compound 2b application to triglyceride quantification
Given the fluorophores’ preference to stain hydrophobic structures and lipids, we explored other applications for 2b, namely in the detection and quantification of triglycerides in liquid samples (Figure 7).
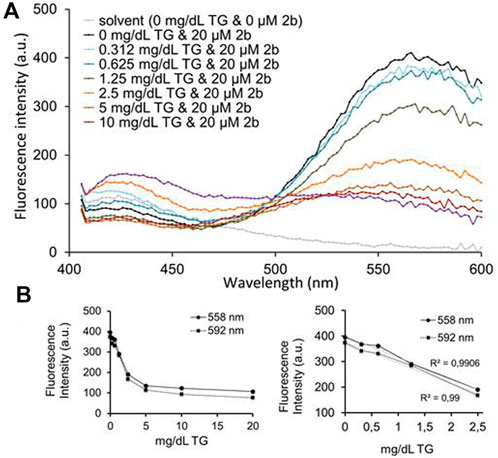
FIGURE 7. (A) Emission spectra (412–588 nm) of compound 2b (20 μM) upon a 5 min incubation with triglyceride 0–20 mg/dl standards (exc. 375 nm). A potential linear inverse correlation between triglyceride concentration and 2b emission intensities was apparent at 550–600 nm. (B) Graphs plotting 2b emission intensities at 558 and 592 nm with all triglyceride concentrations tested (left) or only between 0–2.5 mg/dl triglyceride (right).
A triglyceride standard curve was established, to which compound 2b was added for 5 min. The fluorophore was excited at 375 nm and the 412–600 nm emission recorded in a microplate reader. Figure 7A shows 2b emission spectra in the presence of increasing triglyceride concentrations. In the blue region of the spectra, 2b emission intensities varied, but not linearly increased with triglycerides concentration. However, in the green-yellow region of the spectrum a decrease in the 2b emission intensity occurred with increasing triglycerides concentration. A zone of inverse correlation was visible between 0 and 2.5–5.0 mg dl−1 triglyceride, for the 550–600 nm emission interval. Emissions at 558 and 592 nm were plotted against triglyceride concentrations (Figure 7B), particularly the 0–2.5 mg dl−1 triglyceride range. An inverse correlation was visible for both 558 and 592 nm emission wavelengths, with a correlation (R2) of 0.99. Correlations were of 0.92 (for 558 nm) and 0.93 (for 592 nm) in the 0–5.0 mg dl−1 triglyceride interval (not shown).
These data confirm that, within this linearity range, compound 2b is as a highly sensitive probe to quantify the concentration of triglycerides in liquid samples. Unfortunately, no correlation between the emission of 2b and the triglyceride content of human plasma samples was apparent, due to interferences of undetermined plasma structures in the recorded emission interval (data not shown).
Compound 2b in cell-based high-content screens for lipidosis pre-diagnosis
Early detection of lipid-based disorders is highly important, as well as the study of new therapeutic approaches for these diseases is. To assess the adequacy of 2b as a probe for pre-diagnosis of lipidosis, Farber’s disease was used as example. Inherited Farber’s lipogranulomatosis (MIM 228000) is an autosomal recessive neurodegenerative lysosomal disease caused by mutations in the ASAH1 gene that lead to a deficient acid ceramidase. As a result, ceramide accumulates in lysosomes of several cell types (Yu et al., 2018). The most common method for Farber’s disease definitive diagnosis is the determination of acid ceramidase activity using cultured patient fibroblasts. A fluorescent non-molecular screening of the lipidic load of these patient fibroblasts, based on cellular high content screening assays, would be an important add on as a fast and low-cost pre-diagnostic tool for Farber’s disease and other lipid-based disorders.
High content screening assays were performed, testing the capacity of 2b to differentially stain fibroblasts in three conditions: normal fibroblasts (negative control), Farber’s fibroblasts (tested condition) and fibroblasts pre-incubated with oleic acid (positive control). All three conditions were randomly distributed over a 96-well plate and the 2b fluorescence in the different wells was recorded in the blue-region. Results are depicted in Figure 8, where the number of lipid aggregates blue-stained foci per cell (Figure 8A) and their mean integrated blue intensity (Figure 8B) are plotted for the three conditions.
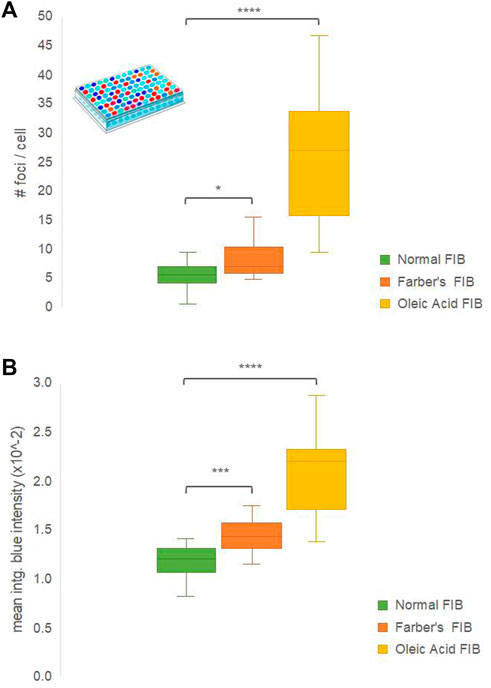
FIGURE 8. High-content screening of lipid aggregates in human fibroblasts (FIB) from a Farber’s disease patient (‘Farber’s FIB′), normal (‘Normal FIB’) or incubated overnight with oleic acid to produce lipid droplets (‘Oleic Acid FIB’), exposed to compound 2b for 2 h. Detection: CFP channel, BP filters with exc. 400–440 nm, em. 460–490 nm). (A) Number of foci per cell; (B) Mean integrated blue emission intensity. N = 10–13. Settings were normalized to eliminate FIB’s auto-fluorescence. Statistical significance analyses against normal FIB used the two-tailed Student’s t-test; symbols: *, p < 0.05; ***, p < 0.001; ****, p < 0.0001.
A consistent tendency was found for the three conditions in both graphs, where the number of 2b blue foci and their mean integrated blue intensity was significantly increased for Farber’s fibroblasts when compared to control ones, and even more increased in normal fibroblasts incubated overnight with oleic acid. This is expected, since oleic acid is more hydrophobic than ceramide, and 2b emits with higher intensity in the blue region in more apolar environments. Compound 2b was also able to blue stain ceramide breakdown products (Supplementary Figure S6 micrographs).
These data confirmed that fluorophore 2b is a reliable option for a fast and cheap pre-diagnostic of Farber’s disease by high content screening since the emission blue-shift was sufficient to detect the increase in ceramide load, demonstrating the ability to discern between normal and Farber’s disease human fibroblasts (Figure 8). Furthermore, the remarkable results with the oleic acid lipid droplets suggest that 2b value in high content screening cell-based pre-diagnostics or drug screening even increases for other metabolic diseases related to the accumulation of lipids with hydrophobicity indexes higher than ceramide.
Compound 2b (“Liprobe”) as an inert vital dye for long-term cellular imaging
Since a vital dye should stay in the cell for a long time without hindering the cellular metabolism or impacting other important cellular processes, the biological inertia of 2b (named “Liprobe”) was studied using proteomic, viability and imaging assays (Figure 9).
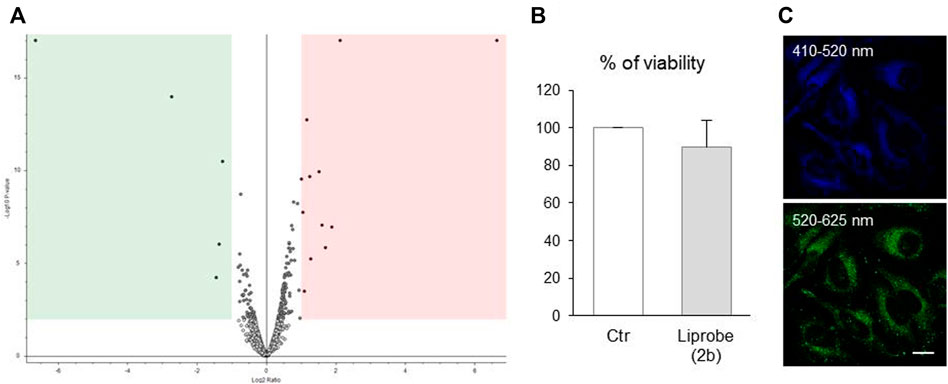
FIGURE 9. Compound 2b is inert for living cells and stays in culture for up to 3 days (A) Volcano plot with the distribution of proteins detected by mass spectrometry analysis in human fibroblasts, exposed or not to 2b for 24 h, exhibits few differences between the cells’ proteomes. After an initial 2 h incubation of HeLa cells with 20 μM 2b, (B) the fluorophore had no significant effects on the cells’ viability (resazurin metabolic assay, N = 3), and was still visible in cells after 3 days (confocal microphotographs; exc. 405 nm; em. indicated on the photographs; bar, 10 μm).
Human fibroblasts were incubated with 2b for 24 h, and its effect on the cellular pathways evaluated by mass spectrometry (nano LC-MS/MS). The proteome of stained and non-stained cells was compared, with the resulting volcano plot graph (Figure 9A) showing the distribution of the detected proteins and their relative abundance in 2b stained cells. Out of the more than 3,000 proteins identified, only 17 proteins (ca. 0.5% of the cellular proteome) were found de-regulated: 5 proteins down-regulated (Figure 9A green area) and 12 proteins up-regulated (pink area). Only one of these proteins (sphingomyelin phosphodiesterase 4) relates to lipid metabolism, and its high values are based on the quantification of only two unique peptides. Hence, 2b did not to alter significantly any cellular pathway.
The long-term maintenance and fluorescence of 2b in cells, and its long-term effects on the cells’ viability, were also assessed. Confirming its innocuous character, after an initial 2 h incubation of HeLa cells with 20 μM Liprobe, the cells’ metabolism was not significantly altered 3 days later (Figure 9B). The fluorophore was still visible in cells after 3 days, emitting in the green and blue (Figure 9C). The value of Liprobe as a vital dye for long-term cellular imaging was thus established.
Conclusion
A family of new fluorophores relevant for live imaging has been reported and thoroughly characterized. Their synthesis is straightforward and scalable, and further modifications may easily be introduced. In the molecules bearing a cyclic core, the fluorophore with chloride substituents is the best for a variety of biological and biomedical staining procedures. It is permeable to the live cell membrane and not toxic to cells or zebrafish embryos. Furthermore, it does not affect the cell metabolism or proteome and, thus, can be used as a vital dye.
In cells, the cyclic-core fluorophore (“Liprobe”) preferentially localizes in the lipidic structures, such as lipid droplets and pathological lipid aggregates. Liprobe can be used in high content screening, for fast and cheap pre-diagnosis of lipidosis, such as Farber’s disease, discriminating between normal and Farber disease human fibroblasts. It has potential to be used in the pre-diagnosis and drug screening of other metabolic disorders of increased lipid load, particularly those pertaining the accumulation of highly hydrophobic lipids. Liprobe is, thus, a valuable alternative to commercially available molecular probes for live cell imaging and lipid aggregates’ detection. We are currently working on introducing peripheral modifications to increase its brightness, tune its emission color and modify its selectivity.
Data availability statement
The original contributions presented in the study are included in the article/Supplementary Material, further inquiries can be directed to the corresponding authors.
Ethics statement
The animal study was reviewed and approved by Stanford University Institutional Animal Care and Use Committee.
Author contributions
SG, JR, and AS designed the structures of the molecules, SG synthetized and characterized them. SV designed and coordinated the biological experiments, with the help of RN, MA, RD, FC, and SG. RN, MA, RD, FC, and SV performed the cell biology experiments and AM designed and performed the zebrafish experiments. MA and AM helped to perform the oleic acid and the HCS assays, respectively. SV, RNS, and SG analyzed all the data, compiled the figures and wrote the manuscript. All authors reviewed the manuscript.
Funding
This work was supported by Portuguese Fundação para a Ciência e a Tecnologia (FCT) via the CICECO-Aveiro Institute of Materials (UID/CTM/50011/2013, UIDB/50011/2020 and UIDP/50011/2020), QOPNA (UID/QUI/00062/2019), LAQV-REQUIMTE (UIDB/50006/2020), Institute for Biomedicine iBiMED (UID/BIM/04501/2013, UID/BIM/04501/2019 - POCI-01–0145-FEDER-007628), by Centro 2020 and Portugal 2020, and by the European Union (FEDER program) via R. Nunes da Silva post-Doctoral fellow grant (BPD/UI98/6327/2018) from the pAGE project (CENTRO-01–0145-FEDER-000003). SG is supported by national funds (OE), through FCT, I.P., in the scope of the framework contract foreseen in the numbers 4, 5, and 6 of the article 23, of the Decree-Law 57/2016, of August 29, changed by Law 57/2017, of July 19. AM was supported by the NMSS grant RG-1707–28694 attributed to William S. Talbot.
Conflict of interest
The authors declare that the research was conducted in the absence of any commercial or financial relationships that could be construed as a potential conflict of interest.
Publisher’s note
All claims expressed in this article are solely those of the authors and do not necessarily represent those of their affiliated organizations, or those of the publisher, the editors and the reviewers. Any product that may be evaluated in this article, or claim that may be made by its manufacturer, is not guaranteed or endorsed by the publisher.
Supplementary material
The Supplementary Material for this article can be found online at: https://www.frontiersin.org/articles/10.3389/fphot.2022.963778/full#supplementary-material
References
Adams, K. F., Schatzkin, A., Harris, T. B., Kipnis, V., Mouw, T., Ballard-Barbash, R., et al. (2006). Overweight, obesity, and mortality in a large prospective cohort of persons 50 to 71 Years old. N. Engl. J. Med. Overseas. Ed. 355, 763–778. doi:10.1056/nejmoa055643
Allen, F. H., Kennard, O., Watson, D. G., Brammer, L., Orpen, A. G., Taylor, R., et al. (1987). Tables of bond lengths determined by X-ray and neutron diffraction. Part 1. Bond lengths in organic compounds. J. Chem. Soc. Perkin Trans. 2, 1. doi:10.1039/p298700000s1
Brouwer, A. M. (2011). Standards for photoluminescence quantum yield measurements in solution (IUPAC Technical Report). Pure Appl. Chem. 83, 2213–2228. doi:10.1351/pac-rep-10-09-31
Cambridge Crystallographic Data Centre. Crystallographic data (excluding structure factors) for the structures here reported have been deposited with the Cambridge Crystallographic Data Centre as supplementary publication No. CCDC 1042558-1042559. Data can be obtained free of charge at www.ccdc.cam.ac.uk/conts/retrieving.html (or from the Cambridge Crystallographic Data Centre, e-mail:ZGVwb3NpdEBjY2RjLmNhbS5hYy51aw==).
Camões, F., Islinger, M., Guimarães, S. C., Kilaru, S., Schuster, M., Godinho, L. F., et al. (2015). New insights into the peroxisomal protein inventory: Acyl-CoA oxidases and -dehydrogenases are an ancient feature of peroxisomes. Biochimica Biophysica Acta - Mol. Cell Res. 1853, 111–125. doi:10.1016/j.bbamcr.2014.10.005
Collot, M., Fam, T. K., Ashokkumar, P., Faklaris, O., Galli, T., Danglot, L., et al. (2018). Ultrabright and fluorogenic probes for multicolor imaging and tracking of lipid droplets in cells and tissues. J. Am. Chem. Soc. 140, 5401–5411. doi:10.1021/jacs.7b12817
Cooper, M. S., Szeto, D. P., Sommers-Herivel, G., Topczewski, J., Solnica-Krezel, L., Kang, H. C., et al. (2005). Dev. Dyn. 232, 359–368.
Dang, D., Liu, H., Wang, J., Chen, M., Liu, Y., Sung, H. H. Y., et al. (2018). Highly emissive AIEgens with multiple functions: Facile synthesis, chromism, specific lipid droplet imaging, apoptosis monitoring, and in vivo imaging. Chem. Mat. 30, 7892–7901. doi:10.1021/acs.chemmater.8b03495
Diaz, G., Melis, M., Batetta, B., Angius, F., and Falchi, A. M. (2008). Hydrophobic characterization of intracellular lipids in situ by Nile Red red/yellow emission ratio. Micron 39, 819–824. doi:10.1016/j.micron.2008.01.001
Didier, P., Ulrich, G., Mély, Y., and Ziessel, R. (2009). Improved push-pull-push E-Bodipy fluorophores for two-photon cell-imaging. Org. Biomol. Chem. 7, 3639. doi:10.1039/b911587k
Elias, P. M., Williams, M. L., Holleran, W. M., Jiang, Y. J., and Schmuth, M. J. (2008). Thematic review series: Skin lipids. Pathogenesis of permeability barrier abnormalities in the ichthyoses: Inherited disorders of lipid metabolism. J. Lipid Res. 49, 697–714. doi:10.1194/jlr.r800002-jlr200
Fam, T. K., Klymchenko, A. S., and Collot, M. (2018). Recent advances in fluorescent probes for lipid droplets. Mater. (Basel) 11, 1768. doi:10.3390/ma11091768
Galema-Boers, J. M. H., and Van Lennep, J. E. R. (2015). Dyslipidemia testing: Why, for whom and when. Maturitas 81, 442–445. doi:10.1016/j.maturitas.2015.05.012
Gross, D. A., and Silver, D. L. (2014). Cytosolic lipid droplets: From mechanisms of fat storage to disease. Crit. Rev. Biochem. Mol. Biol. 49, 304–326. doi:10.3109/10409238.2014.931337
Guieu, S., Rocha, J., and Silva, A. M. S. (2013). Supramolecular organization of bis(3-halo-4-dimethylaminobenzylidene)hydrazines. J. Mol. Struct. 1035, 1–5. doi:10.1016/j.molstruc.2012.09.012
Hannun, Y. A., and Obeid, L. M. (2018). Sphingolipids and their metabolism in physiology and disease. Nat. Rev. Mol. Cell Biol. 19, 175–191. doi:10.1038/nrm.2017.107
Holthuis, J. C. M., and Menon, A. K. (2014). Lipid landscapes and pipelines in membrane homeostasis. Nature 510, 48–57. doi:10.1038/nature13474
Lee, S. C., Kang, N. Y., Park, S. J., Yun, S. W., Chandran, Y., Chang, Y. T., et al. (2012). Development of a fluorescent chalcone library and its application in the discovery of a mouse embryonic stem cell probe. Chem. Commun. 48, 6681. doi:10.1039/c2cc31662e
Listenberger, L. L., Studer, A. M., Brown, D. A., and Wolins, N. E. (2016). Current protocols in cell biology, 71. Hoboken, NJ, USA: John Wiley & Sons, 4.31.1–4.31.14.
Nunes da Silva, R., Costa, C. C., Santos, M. J. G., Alves, M. Q., Braga, S. S., Vieira, S. I., et al. (2019). Fluorescent light‐up probe for the detection of protein aggregates. Chem. Asian J. 14, 859–863. doi:10.1002/asia.201801606
Pischon, T., Nöthlings, U., and Boeing, H. (2008). Obesity and cancer. Proc. Nutr. Soc. 67, 128–145. doi:10.1017/s0029665108006976
Serra, V. V., Camo, F., Vieira, S. I., Faustino, M. A. F., Tomé, J. P. C., Pinto, D. C. G. A., et al. (2009). Acta Chim. Slov. 56, 603–611.
Tatenaka, Y., Kato, H., Ishiyama, M., Sasamoto, K., Shiga, M., Nishitoh, H., et al. (2019). Monitoring lipid droplet dynamics in living cells by using fluorescent probes. Biochemistry 58, 499–503. doi:10.1021/acs.biochem.8b01071
Vaz, P. A. A. M., Rocha, J., Silva, A. M. S., and Guieu, S. (2016). Aggregation-induced emission enhancement in halochalcones. New J. Chem. 40, 8198–8201. doi:10.1039/c6nj01387b
Walther, T. C., and Farese, R. V. (2012). Lipid droplets and cellular lipid metabolism. Annu. Rev. Biochem. 81, 687–714. doi:10.1146/annurev-biochem-061009-102430
WHO (2002). “Quantifying selected major risks to health,” in The world health report 2002 - reducing risnks, promoting healthy life (Geneva: WHO). Chapter 4.
Yakimanski, A. V., Kolb, U., Matveeva, G. N., Voigt-Martin, I. G., and Tenkovtsev, A. V. (1997). The use of structure analysis methods in combination with semi-empirical quantum-chemical calculations for the estimation of quadratic nonlinear optical coefficients of organic crystals. Acta Crystallogr. A 53, 603–614. doi:10.1107/s010876739601570x
Keywords: fluorophore, lipid aggregates, live imaging, high-content screening, farber’s disease
Citation: Vieira SI, Nunes da Silva R, Alves M, Dias RA, Meireles Sousa AM, Camões F, Maia A, Almeida M, Rocha J, Silva AM and Guieu S (2022) Liprobe, a vital dye for lipid aggregates detection in imaging and high-content screens. Front. Photonics 3:963778. doi: 10.3389/fphot.2022.963778
Received: 07 June 2022; Accepted: 05 July 2022;
Published: 15 August 2022.
Edited by:
Sidney J. L. Ribeiro, São Paulo State University, BrazilReviewed by:
Nirmal Mazumder, Manipal Academy of Higher Education, IndiaAniruddha Ray, University of Toledo, United States
Copyright © 2022 Vieira, Nunes da Silva, Alves, Dias, Meireles Sousa, Camões, Maia, Almeida, Rocha, Silva and Guieu. This is an open-access article distributed under the terms of the Creative Commons Attribution License (CC BY). The use, distribution or reproduction in other forums is permitted, provided the original author(s) and the copyright owner(s) are credited and that the original publication in this journal is cited, in accordance with accepted academic practice. No use, distribution or reproduction is permitted which does not comply with these terms.
*Correspondence: Sandra I. Vieira, c2l2aWVpcmFAdWEucHQ=; João Rocha, cm9jaGFAdWEucHQ=; Samuel Guieu, c2d1aWV1QHVhLnB0
†These authors have contributed equally to this work and share first authorship
‡Present address: Roberto A. Dias, VIB-KU Leuven Center for Brain and Disease Research, Campus Gasthuisberg, Leuven, Belgium