 Hongning Ren
 Tadeusz Balcerowski1,2
 Ahu Gümrah Dumanli
- 1Department of Materials, The University of Manchester, Manchester, United Kingdom
- 2Henry Royce Institute, The University of Manchester, Manchester, United Kingdom
Hydroxypropyl cellulose (HPC) is a sustainable, cost-efficient, and bio-compatible cellulose derivative that forms cholesteric liquid crystalline phases in highlyconcentrated water solutions that reflects colour in the visible range. While there have been studies exploiting HPC’s structural coloration and transferring the cholesteric order of the solutions into solid form via cross-linking, there is still lack of understanding on the thermotropic mechanisms that enable the transfer of the structural ordering of the pure HPC at higher temperatures. In this work, we demonstrate the balance between the temperature, humidity, and film thickness to achieve a full color palette of pure HPC. We reveal that at the early stages of the evaporation, formation of a dense skin over the lyotropic phase facilitates the thermal expansion of the HPC during the heat treatment. Increasing the thickness, applying higher drying temperatures, and exposing the samples to higher humidity during the evaporation all result with increased pitch values that cause a red-shift in coloration in the solid state. Our analysis of the HPC samples dried in controlled temperature and humidity conditions at a fixed thickness provided an understanding of the dominance of the thermal expansion which drives the final structural organization in the solid cholesteric phase. When the thickness of the films was varied against fixed temperature and humidity conditions, the color shift from red to violet follows the thickness gradient of the sample due to the change in the drying time required to reach the solid form.
1 Introduction
Hydroxypropyl cellulose (HPC), a derivative of cellulose with hydroxypropyl groups on the cellulose backbone, is widely used in both food and pharmaceutical industries due to its biocompatibility, ease of processing, and cost-efficiency (Dürig et al., 2019; Kapoor et al., 2020). In highly concentrated water solutions, HPC forms cholesteric mesophases that exhibit right-handed helicoidal arrangement which act as a filter that reflects right handed circularly polarised (RCP) light, Figure 1. There are a number of other cellulose derivatives that exhibit similar lyotropic and thermotropic cholesteric liquid crystal behaviour with the ability to demonstrate coloration in the visible range such as side functionalised HPC and tri-o-(β-methoxyethoxy) ethyl cellulose (Hayata and Furumi, 2019; Yamagishi et al., 1990). The ability of HPC mesophases to exhibit structural coloration has attracted interest to promote HPC as a responsive photonic material with applications ranging from strain sensors to electronic skins (Kamita et al., 2016; Liang et al., 2018; Chan et al., 2019; Zhang et al., 2020). In the viscous liquid form, the HPC mesophases are able to reflect iridescent metallic coloration, which spans across the visible wavelength range, from ultraviolet (UV) to red and infrared (IR) (Werbowyj and Gray, 1980; Balcerowski et al., 2023). The manifested color can be controlled as a function of temperature, ionic strength, and concentration by tuning the helicoidal pitch of the HPC, Figure 1 (Werbowyj and Gray, 1980; Bhadani and Gray, 1983; Fortin and Charlet, 1989; Nishio et al., 2002; Balcerowski et al., 2023). Much work has been carried out into transferring the structural coloration of HPC mesophases via cross-linking (Suto et al., 1990; Chan et al., 2022) by highly toxic cross-linkers such as glutaraldehyde, or emulsion method via surfactant systems (Ming et al., 2023). While an understanding of the mechanisms causing the structural transformation of the HPC during evaporation and phase transformation has been quite established, i.e., the removal of the water should cause a blue shift in the coloration due to the reduction of the pitch (Chan et al., 2019). The combined effect of additional factors such as heat treatment profile, thickness of the films, and the humidity of the heating environment have not been fully explored in combination before. In this work, for the first time, we report the structural coloration of HPC in solid phase without cross-linking whilst achieving a full color palette by just tuning the physical conditions of the evaporation process. Our method uses no other chemical modification or additives and thus ensures that HPC mesophase is completely pure, edible and cost-efficient. Furthermore, in this work, we demonstrate the complex relationship between the visual coloration as a function of the thickness of samples as well as tuning of the drying conditions (temperature and humidity). Our work highlights that starting from a uniform HPC solution, when sample constructs are cast in varying thicknesses, the color shifts from blue to red with increasing thickness. Moreover, the thickness dependence has a well-defined relationship with the temperature and humidity gradients due to a finely tuned color trapping mechanism. For example, at a fixed thickness, evaporating the water at higher temperatures may cause a red-shift due to faster evaporation kinetics. Interestingly, when humidity was accounted for, the same sample could display a red-shift in coloration with increasing humidity, which indicates a competition between the thermodynamic expansion of the consecutive layers and kinetically driven compression of the layers during evaporation. To the best of our knowledge, this study is the first to showcase the ability to tune the structural coloration of the HPC within a full color palette by simply adjusting the drying conditions without further functionalization routes.
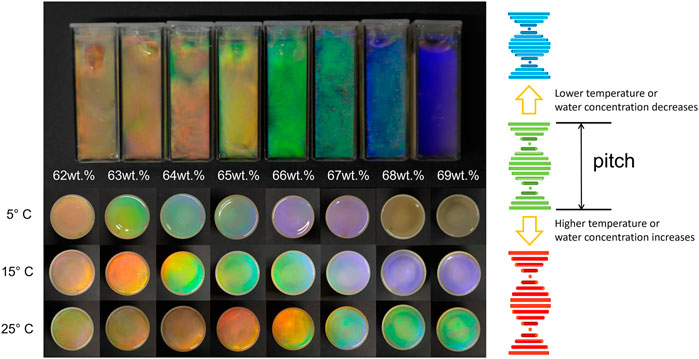
FIGURE 1. Color tuning of the HPC aqueous solutions as a function of varying HPC concentration between 62 wt% and 69 wt% and temperature between 5°C and 25°C. The pitch (p) is described as a full 360° rotation of the cholesteric pseudo layers. Following the color changes shown, the cholesteric pitch is compressed as the water concentration and/or temperature are decreased. Conversely, an increase in the water concentration and/or temperature results in an elongated cholesteric pitch.
2 Experimental methods
2.1 HPC solution preparation
All chemicals were used without further purification. HPC solutions were prepared from HPC powder (SSL grade, MW 40k, Nisso Chemicals, JP) mixed with the appropriate amount of MilliQ water (18.2 MΩ cm, Suez Fusion 320) to attain the required weight percentage to demonstrate the color tenability in the solution phase. For the evaporation studies a 64 wt% HPC solution was used throughout this work. Homogeneous HPC solutions were prepared by mixing them repeatedly with hourly intervals. The solutions were centrifuged at 6,000 rpm for 5 min to remove the air bubbles, each-time they were mixed. The cycle of mix and centrifuge process was repeated at least three times daily. To observe the uniform color appearance in the solution form, the HPC solutions were kept at room temperature overnight to reach their phase equilibrium. Prior to the use of 3d printing, the HPC solutions were transferred into printing cartridges and centrifuged for at least 10 min at 6,000 rpm to remove air bubbles.
2.2 Fabrication of HPC thickness gradients
The thickness of the casted HPC films were adjusted using three different set-ups, as shown in Supplementary Figure S1, An initial set–up to vary the thickness of the samples was based on half filling the HPC solutions in a 35 mm Petri dish, which was then placed at an angle without lid, Supplementary Figure S1A. The slight tilt (between 5° and 20°) allowed accumulation of the HPC solution and formation of a thickness gradient. For these samples the following naming convention was used: CP-HPC-drying temperature (°C)-drying humidity (%).
Separately, a 3d printing set-up was used to produce HPC constructs with uniform thickness, where the extrusion pressure, nozzle size, and the number of layers applied were optimized. In this paper, all the 3d printed samples were prepared using a robocaster I&J7300-LF bench robot model of Fisnar intertronics with nozzles of 21 gauge and at a printing pressure of 6 bars. Using the 3d printing set-up, two types of samples were produced; first the HPC solutions were 3d printed following a staircase pattern by gradually stacking layers on top to make a uniform thickness gradient, Supplementary Figure S1B. The naming convention of the staircase-printed samples is SP-HPC-drying temperature (°C)-drying humidity (%). In the final design, the HPC solutions were 3d printed on a flat surface with merged layers to make uniform thicknesses where the thickness is controlled by the number of merged layers. The naming convention of the flat-printed samples is FP-HPC-drying temperature (°C)-drying humidity (%), Supplementary Figure S1C.
To explore the effect of drying temperature, the samples were dried at 70°C–90°C in the oven (Genlab Prime Range Oven PRO/50/TDIG) immediately after printing until they were entirely dry (usually 4–5 h). The effect of the humidity during drying was tested using an environmental chamber (Memmert humidity chamber HCP105) at 70°C and with controlled humidity values fixed at 10% relative humidity (RH), 30% RH, 50% RH and 70% RH. The samples were dried in such conditions overnight and until their weights plateaued.
2.3 Characterization
Digital images were taken by a Panasonic LUMIX DMC-LX15 digital camera. The optical imaging and spectroscopy were performed using a custom-modified polarized optical microscope (Olympus BX53MTRF) coupled to an Ocean Insight Flame spectrometer by Ocean Insight 50 µm UV-Visible Optical Fiber. Unpolarized light from an LED lamp was coupled into a ×20 objective (Olympus, MPLFLN-BD 10) with a numerical aperture NA = 0.3. Part of the transmitted signal was coupled into a 50-μm core optical fiber (Ocean Optics) mounted in confocal configuration to achieve a spatial resolution of approximately 20 μm, and the results were captured by the Ocean View 2.0 spectroscopy software. Circular Dichroism spectroscopy results were obtained by a Chirascan CD spectrometer (wavelength range 350–700 nm). Scanning electron microscopy (SEM) was performed using a Zeiss Sigma VP FEG SEM system. Prior to SEM imaging, the samples casted on a Petri dish were cut across the thickness gradient through the middle axis with a razor to capture the cross-section morphology to retain the relative error for measuring the pitch constant and then fixed on sample substrates with a 90° chamfer with the side wrapped with thin copper tape. The fracture surfaces were then deposited with Au/Pt using a Quorum sputter-coater Q150R Plus prior to imaging (an Au/Pt target 80:20 was used at 50 mA current for 8 s).
The UV-Vis spectra were smoothed by applying a locally weighted scatterplot smoothing (LOWESS) method. The thickness of the films is taken as the average of measurements from a five-point sampling method. The pitch of the HPC cholesteric mesophase is taken as the average of measurements from a five-lines sampling method.
3 Results and discussion
Photonic HPC constructs with a thickness ranging between 0.5 and 5 mm were prepared by casting HPC solutions of 64 wt% in petri dishes. The constructs were immediately dried at temperatures between 70°C and 90°C (see the “Experimental Methods”). To introduce a thickness gradient, the samples were kept at a tilt angle between 5 and 20 degrees during the heat treatment. All HPC solutions were in equilibrium and formed a cholesteric phase prior to the film casting (Figure 1).
At equilibrium, the reflection wavelength of the cholesteric phase can be described by following the modified Bragg equation (Dumanli et al., 2014; Ryabchun and Bobrovsky, 2018; Kamita et al., 2023),
And
where n is the average refractive index, and p is the cholesteric pitch (where the consecutive pseudo layers undergo a 360° rotation of the cholesteric structure) and θ is the angle of incidence of light with respect to the normal. Considering the average refractive index is constant and can be calculated using Eq. 2, the reflection wavelength is linearly dependent on the cholesteric pitch of the HPC solutions. HPC refractive index is reported as
The 64 wt% HPC solutions self-assemble into cholesteric order spontaneously with a pitch value of 434 nm that corresponds to orange to red color at room temperature with a reflection wavelength of 624 nm, Supplementary Figure S3; Supplementary Table S3 in Supplementary Material. When the HPC solutions are fabricated uniformly using different methods such as laminated between two glass slides, 3d printed, or casted using doctor blade, all these uniform constructs would show a homogeneous reflection throughout the sample regardless of the sample thickness (Chan et al., 2019). And dried samples at room temperature exhibit transparent appearance without color, Supplementary Figure S4; Supplementary Material. Interestingly, for the fabrication of the HPC in solid form using higher temperatures between 70°C and 90°C, Eq. 3 is no longer applicable. At the same time, our experiments revealed that, upon drying at the given temperature, the samples demonstrated a significant color shift with changing thickness. As shown in Figure 2A, the color of the HPC samples changes gradually from violet to red following the thickness of the casted films. To quantify the color shift, the thickness data was correlated with the reflectance measurements and a linear relationship was identified between sample thickness and reflection wavelength, which can be described as:
where λd is the observed reflection wavelength in nm of a defined thickness d which is expressed in mm, cT is the temperature coefficient and λ0 is the theoretical minimum reflection wavelength in nm, where thickness is infinitely close to zero. The observed color shift in the angle casted and staircase printed samples was confirmed by measuring the cholesteric pitch as a function of the film thickness by the SEM analysis, Figure 3; Supplementary Figure S5; Supplementary Material.
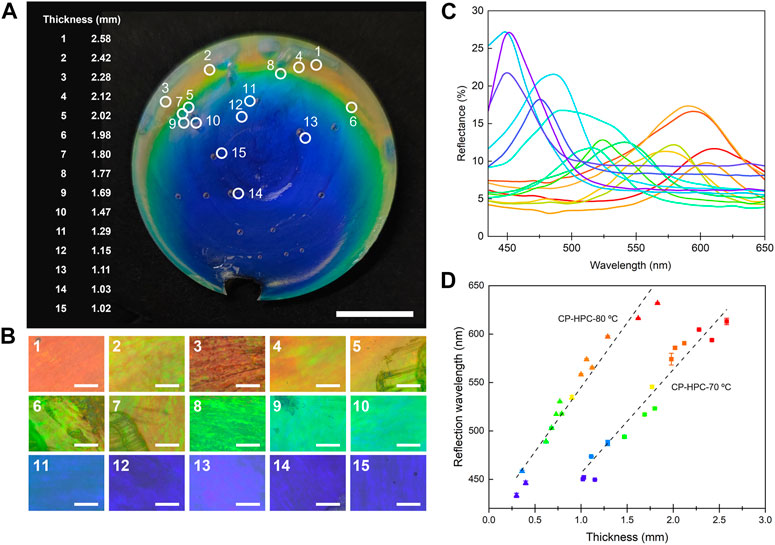
FIGURE 2. The color tuning analysis of the HPC film casted on a tilted Petri dish and dried at 70°C with slope of approximately 8° (CP-HPC-70°C). (A) Photography of CP-HPC-70°C and labels of the measured points 1–15. The scale bars represent 10 mm. (B) Optical microscopy images of the corresponding points on the sample following the visible color range 1–15. The scale bars represent 100 µm. (C) Reflectance measurements of the corresponding points on the sample following the visible color range 1–15 (the color of the spectra is correlated with the color of the points measured). (D) Linear fitting of the reflection wavelength as a function of measured thickness of the sampling points 1–15. The fitting for the CP-HPC-70°C sample is represented with squares and has an R-square parameter of 0.95301. The fitting was repeated for the CP-HPC-80°C sample and is represented using triangles and has an R-square parameter of 0.95352.
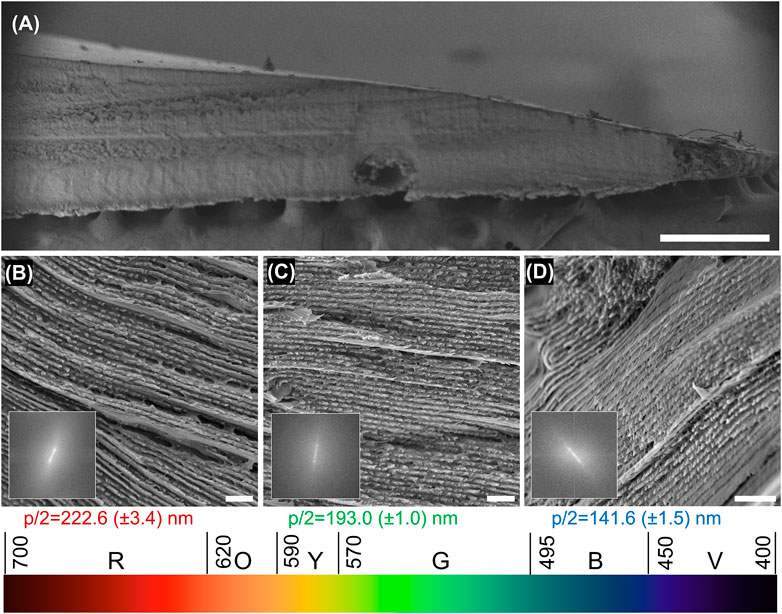
FIGURE 3. Cross-sectional SEM micrograph and the corresponding pitch and wavelength values matching to the coloration of the zones. (A) SEM micrograph of the solid sample CP-HPC-80°C. The scale bar is 500 µm. (B–D) higher-resolution SEM micrographs and fast-Fourier-transform (FFT) of the SEM micrographs of the areas with red, green, and blue reflection, respectively. The scale bars are 1 µm.
The SEM micrographs in Figure 3 demonstrate the highly ordered HPC phases regardless of the thickness of the sample. A correlation of the reflected color was found with the periodic cholesteric structure, which was measured directly. At the left edge of the film, the film thickness was measured to be approximately 1.8 mm and the pitch was measured at p1/2 = 223 nm with a corresponding wavelength of λ1 = 668 nm, which is consistent with the film’s red visual appearance. When the film thickness reached to 1.2 mm, the pitch value gradually decreased to p2/2 = 193 nm with green-yellow reflection at λ2 = 0.5 mm. Finally, as the thickness reached a value of 200 μm, the pitch value decreased to p3/2 = 142 nm with violet as the macroscopic appearance (λ3 = 426 nm). Both samples CP-HPC-80°C and CP-HPC-70°C exhibited such behavior, measured using cross-sectional microstructural SEM images. Therefore, as the thickness increases, the pitch shifts to larger values with a color transformation from violet to red.
The drying temperature difference between the samples labelled as CP-HPC-80°C in Figure 3 and CP-HPC-70°C in Figure 2 leads to a visible red-shift. From this observation, it is worth noting that the thickness gradient alone is not the main factor in the tuning of the coloration and the changes in sample size should be also accounted for. For example, the specular reflection values recorded for the 1 mm region in the sample CP-HPC-70°C and the sample CP-HPC-80°C are 450 and 558 nm, respectively, Supplementary Figure S2; Supplementary Material. Our systematic work demonstrated that two HPC films in solid form could display the same color at a different thickness or display different visual coloration even though they are prepared at the same thickness (more see Supplementary Table S1, Supplementary Material). Such overlap in the visual coloration for different thicknesses implies that the main driving force for the final coloration arises from thermodynamic and evaporation kinetic effects and the thickness of the samples play a secondary role in color tuning. By applying linear fit parameters in Eq. 2; Figure 2D and Supplementary Table S2, Supplementary Material, we can calculate the reflection wavelength for CP-HPC-70°C as
As the HPC solutions both possess lyotropic and thermotropic liquid crystalline behavior, the pitch of the HPC can be altered by the temperature at a fixed concentration as shown in Figure 1 (Fortin and Charlet, 1989; Balcerowski et al., 2023). Such color variation implies the polymeric degree of freedom as a function of temperature to define the equilibrium state of the HPC solutions in a way that allows the compression of the pseudo cholesteric layers at lower temperatures (blue shift) and stretching the cholesteric order at higher temperatures (red-shift) (Schütz et al., 2020). The orientation of the axis of the HPC polymer chains rotates by an angle of 2π every period of the cholesteric helix, therefore the rotation angle of the axis of the molecule in the pseudo planes can be defined as
where
The effect of temperature and the rate of water evaporation were analyzed by subjecting the HPC samples to different drying temperatures between 70°C and 90°C with 2.5°C intervals, Figure 4. The samples used for this purpose were 3d printed on a glass substrate to attain comparable thickness values with uniform coloration. As the digital images and the CD spectra summarize, the final coloration of the flat 3d printed HPC constructs showed a significant variance from violet to red. The CD spectrum also confirms two key structural traits of the cholesteric HPC phases produced via 3d printing; the first key observation of these systems is the chiro-optical response of the HPC, which has shown the pure RCP reflection observed from these constructs. Such pure right-handed signal demonstrates the high degree of laminar arrangement of the helicoidal structure.
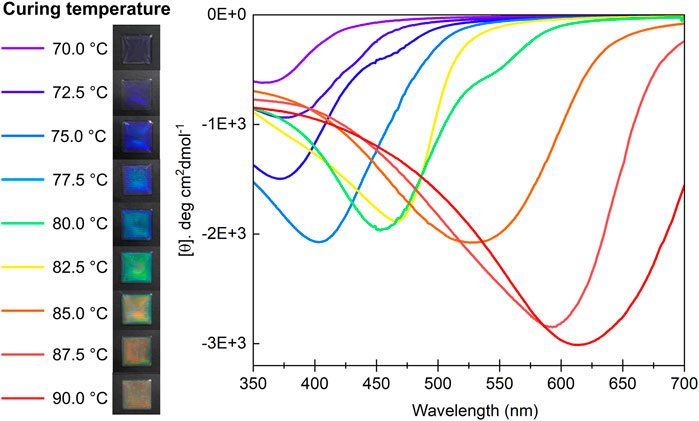
FIGURE 4. Color shift in the HPC as a function of the drying temperature. Photographs and CD spectra of FP-HPC-70°C, FP-HPC-72.5°C, FP-HPC-75°C, FP-HPC- 77.5°C, FP-HPC-80°C, FP-HPC-82.5°C, FP-HPC-85°C, FP-HPC-87.5°C, and FP-HPC-90°C. The samples are 1.15 (±0.21) mm thick.
The cholesteric phase in the aqueous HPC is right-handed following its molecular chirality and at normal incidence it is expected to reflect only RCP light. However, in many works investigating both the solution and solid phases of the HPC, it was reported that the HPC constructs reflect a large amount of RCP light as well as left-handed circular polarization (LCP) light. Such optical impurity was caused by the distortion of the cholesteric phases, as well as the presence of highly tilted domains leading to helical sense inversion (Rivera and Reyes, 2007; Chan et al., 2019; Frka-Petesic et al., 2019; Kragt et al., 2019; Chan et al., 2022). Our observation of pure RCP signal in the flat 3d printed samples confirms the additional linear arrangement caused by the shear forces (Balcerowski et al., 2023). Furthermore, the reflection wavelength of the CD peak follows the visual color trend that increases from 370 nm for the sample dried at 70°C to 612 nm for the sample dried at 90°C.
Our structural analysis showed that the thermotropic behavior of the HPC samples from their solution state indeed plays the primary role in terms of the structural organization during evaporation. This was especially apparent during the drying of the 3D printed constructs, for example, the color of the samples dried at lower temperatures led to a blue shift, whilst the color of the samples dried at higher temperatures led to a red-shift. Such direct correlation between the drying temperature and the color appearance of the samples implies that the drying rate is one of the key parameters for to modulate the pitch. To the best of our knowledge, such tuning of the coloration in the HPC films and coatings through alteration of the drying conditions as a method of transferring the cholesteric phase in the visible range without using a cross-linker was not reported before. Therefore, this work provides new information on controlled processing of HPC solutions to achieve a full color palette without any additives and further chemical processes. Furthermore, our work provides additional insight on the force balance during the evaporation process. As such, during the drying process, there is an expected decrease in the pitch value due to the collapse of the cholesteric planes upon evaporation. Indeed, when the films were dried at temperatures below 60°C, the slow evaporation leads to compression of the pseudo layers and complete loss of coloration due to the pitch values shifting towards the UV region. However, when the samples were dried at higher temperatures and hence the evaporation rate was increased during the drying process, the faster water evaporation kinetics avoided the collapse of the cholesteric layers, thus shifting the color appearance to red. As discussed by Ming et al. (2023), the presence of a lower critical solution temperature (LCST) for HPC solutions can prove troublesome for the formation of cholesteric phases at elevated temperatures. During the heat treatment process presented in this work, the 64 wt% HPC solutions reach temperatures above their LCST and therefore do not initially exist in their cholesteric forms. However, the LCST is also concentration dependent; as the evaporation progresses, the temperature at which a cholesteric mesophase exists is gradually increased (Werbowyj and Gray, 1980; Balcerowski et al., 2023).
In order to explain the interactions during the drying process, we hypothesized that an irregular trapping mechanism of HPC conforms the cholesteric structure in solid form and is a combination of two simultaneous processes: kinetically driven compression and thermodynamic expansion, Figure 5.

FIGURE 5. (A) Graphic of the HPC drying process describing the HPC in liquid solution form and the cholesteric arrangement. During the drying process evaporation of water causes formation of skin. During this stage exposure to higher temperatures causes water evaporation to accelerate, and the pseudo-cholesteric layers at the surface collapse faster. At the same time, through controlling the rate of evaporation using humidity the final cholesteric pitch can be thermally expanded. The HPC in solid state represents the final stage after water content has entirely escaped, where the cholesteric order and the pitch is manifested denser than the inner structure. (B) SEM micrograph of a dried HPC film (SP-HPC-70°C) demonstrating the skin and cholesteric structure.
When the HPC samples were dried at higher temperatures, initially the freshly casted films or the 3d printed construct will form a thin cloudy-translucent skin layer, Figures 5B, C. Our microstructural analysis revealed that the skin layer does not possess the cholesteric order which is most likely due to the fast formation process Figure 5B (Balcerowski et al., 2023). Interestingly, the presence of this layer is one of the key factors in regulating the interplay between the kinetically driven compression and thermodynamic expansion, and thus the tuning of the final color. Since the dense skin acts as a semi permeable shield to lock the water content, the evaporation rate from the bulk cholesteric phase slows down. Furthermore, across the thickness of the HPC, the parts that are closer to the surface and the areas closer to the substrate will have a different rate of evaporation. At this stage, the encapsulated solutions in the bulk phase are still hydrated and capable of changing structure following the cholesteric order. Such a difference in the evaporation rate will be more pronounced for the samples with a non-uniform thickness profile, i.e., the samples casted on an angle as well as the staircase 3d printed constructs. In these samples, while the thin areas of the samples evaporate fast, the thicker parts of the films need a longer time for the HPC solutions to conform to their final equilibrium state before compression. Such slow evaporation should lead to a blue shift in the pitch overall, however intriguingly the thicker parts of the films demonstrated a red-shift, in Figure 2A; Supplementary Figure S2A, Supplementary Material. Retaining the higher pitch values in thicker parts of the films is an interesting finding and clear evidence that the pitch value at high temperatures is tuned as a function of the thermodynamic expansion of the polymer layers and evaporation rate. During the evaporation process at higher temperatures, due to the higher kinetic energy applied on the HPC polymer chains, two distinct events happen; the first one is the accelerated evaporation which means that the cholesteric layers would have less time for relaxation and compress to a smaller pitch. The second phenomenon is the further expansion of the cholesteric order due to the thermal expansion of the HPC which is a trait that is transferred from the solution phase. In both angular casting and staircase 3d printed samples, the sample profiles were not uniform and evaporation happened non-uniformly along the sample profile. As expected, the thicker part took a longer time to dry and required a longer time for the encapsulated aqueous solution to achieve equilibrium. Furthermore, the bubble formation in different areas of the samples also confirms the effect of the temperature on the structural organization. For example, the thinner areas of the samples have much smaller sized bubbles in the range of 1.0–1.5 mm for the blue region and those areas with red coloration bubbles have much larger sizes in the range of 2–2.5 mm because of longer heating as in Figure 2A and similar effect is observed in Supplementary Figure S2A, Supplementary Material. While the varying thickness samples are a clear evidence to demonstrate the effect of the thickness within the sample, this new information can be used to tune the pitch as a function of thermal expansion and water evaporation perspectives. Similarly, the 3d printed samples fabricated by overlapping different number of layers to achieve different thickness values led to red-shifted coloration as the thickness of the samples was increased, Supplementary Figure S6. In thermotropic liquid crystals, the pitch is formed upon reaching such a concentration at which a cholesteric mesophase will correspond to the temperature of the solution at that given moment (Keating, 1969). Therefore, by increasing the temperature at which the HPC solutions are dried, we demonstrate control over the pitch when the solution is capable of forming a cholesteric phase again. In turn, this temperature controlled pitch is then translated into the solid samples presented.
In order to develop a more generalized understanding between the factors contributing to the color tuning, we also tested the effect of the humidity during the water evaporation and analyzed its effect on the drying rate effect and the final structure of the HPC. Figure 6 summarizes the visual appearance and the spectral analysis. For this part of the work, we 3d printed four different HPC samples of the same thickness of 1.2 mm and dried these constructs at 70°C at different relative humidity (RH) values of 10 RH %, 30 RH %, 50 RH %, and 70 RH %. The visible color change from violet to green on these HPC samples can be seen directly Figure 6, which indicates the role of the humidity in a way that the pitch can be shifted to larger values as the humidity increases. Such a result might appear to contradict the observations we report in this contribution in terms of the evaporation time, which leads to a blue shift when the thickness factor was considered alone as the evaporation rate slows down at higher RH. However, from the thermal expansion perspective, at higher RH, the slow evaporation process allows the cholesteric structure a longer time to relax to its equilibrium at higher temperatures and facilitates thermal expansion. This additional time causes a fixing of the color at a longer pitch value and reflection wavelength. A surface fitting of the data points connecting between the effect of humidity and thickness for a given temperature (70°C) was plotted to connect these parameters effectively in Supplementary Figure S8, Supplementary Material.
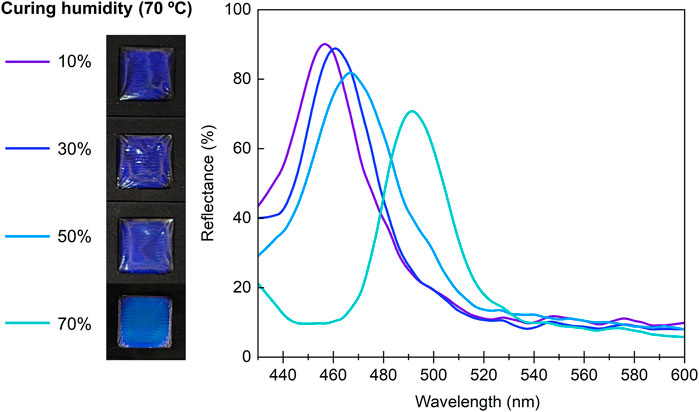
FIGURE 6. Smoothed reflectance spectra and photographs of 64wt% HPC solution dried at 70°C and RH of 10%, 30%, 50%, and 70%, respectively, in the environmental chamber. The samples are 1.25 (±0.03) mm thick.
Therefore, we concluded that the dominating factor contributing to the color tuning is the thermal expansion of the HPC during the evaporation process. The secondary factor is the rate of evaporation that causes the compression of the pseudo cholesteric layers, which is defined by both temperature and humidity. The final coloration determined by the thickness is therefore a consequence of the competition between the thermodynamic expansion of the consecutive layers and kinetically driven compression of the layers during evaporation. As shown in Figure 4, flat samples give only negative signals during the CD measurements that indicates pure right handed helicoidal order in the HPC. However, the 3d printed constructs as well as the thick films casted in the Petri dishes both exhibit positive signals in the CD spectra, which conflicts with the right handed nature of the HPC mesophase (Supplementary Figure S7). As mentioned above, similar results were reported for HPC and other cholesteric LCs due to the angular distortion of the helicoidal arrangement (Rivera and Reyes, 2007; Chan et al., 2019; Frka-Petesic et al., 2019; Kragt et al., 2019; Chan et al., 2022). The structure of the kinetically arrested and physically confined HPC solutions poses high degree of planar order, which is apparent by the intense RCP signal, as shown in Supplementary Figures S7E, G. When these laminarly contained HPC solutions were left to dry slowly over 9 days at room temperature, their CD spectrum is broadened due to the uneven water loss. However, these samples still conform their highly ordered state exhibiting only RCP response. Such order is broken by the drying process, where both the solvent evaporation and the restriction of the skin lead to mechanical stress, applied vertically on the helicoidal order at different magnitudes according to the changing thickness (Chan et al., 2019; Frka-Petesic et al., 2019). As a result, the ideal helicoids in the cholesteric structure are distorted and the defects manifest various magnitudes of LCP reflection.
4 Conclusion
In conclusion, we provided a simple new method to modulate the color in the full visible spectrum of solid HPC mesophases. This new method accounts for the specific and inner-connected effects of the thickness, temperature, and humidity in transferring the color into the solid phase. During evaporation of the HPC, the constructs form a uniform cholesteric phase. As the water concentration decreases, the cholesteric layers would be expected to compress and cause a blue shift of the coloration. Our work demonstrated that increasing the thickness of the HPC construct or the drying temperature indeed causes a red-shift in the coloration. We proposed a gradual thermal expansion mechanism during the drying conditions driven by the thermotropic properties of the HPC and the increased polymer chain mobility at elevated temperatures. During the evaporation in the first few minutes, a dense solidified skin formed that encapsulated the HPC solution. While the semipermeable HPC skin allowed the controlled evaporation of the water, the cholesteric pseudo layers of the HPC also expanded to the equilibrium state under a much higher temperature and finally achieved a larger pitch. We explored the relationship between the water evaporation kinetics and the thermal expansion on the final pitch of the solid cholesteric phase and concluded that even though there is a tradeoff between the thickness driven evaporation kinetics and the thermal expansion, overall, the thermal expansion is the dominant effect. We identified that a higher drying temperature and a higher relative humidity are both factors that drive the thermal expansion, resulting in an increase in cholesteric pitch and red-shifted coloration. At the same time, we concluded that as the thickness decreases, the evaporation kinetics will drive the final structure formation with a blue shift in the coloration. This relationship is a critical shift in the color dependence of the HPC which is only a function of HPC concentration and angular dependence in the solution phase. Yet, by finely tuning the thermal process conditions we were able to demonstrate the fabrication of solid phase of HPC with a full color palette in the visible range. In the context of structurally colored materials from the HPC, our work clearly signifies the effective tuning of the evaporation conditions without any cross-linkers and chemical modifications and establishes a key development towards the fabrication of largescale functional products. Keeping the HPC as a pure biocompatible polymer without any chemical modifications elevates the potential of sing these systems in colorimetric indicators and optical sensors for food and pharmaceutical industries. The mechanical properties also give possibility as food decorations without artificial colorings and edible clay/plasticine that can be safely used by children.
Data availability statement
The original contributions presented in the study are included in the article/Supplementary Material, further inquiries can be directed to the corresponding author.
Author contributions
All the HPC formulations, production of the casted films at an angle as well as the 3d printed constructs were performed by HR. The optical microscopy, and the other spectral analysis (CD, and UV-Vis) of the constructs as well as the data analysis were also done by HR. AGD performed all the SEM experiments, and the relevant image analysis was done by HR. The initial experimentation of the HPC casting at different thicknesses, discussion of the initial analysis and optimization of the microscopy system were performed by TB. The initial drafting, figure construction, editing, and formatting was done by HR and AGD. All authors contributed to the article and approved the submitted version.
Funding
The authors would also like to acknowledge the funding from bp for the bp-ICAM Kathleen Lonsdale Research Fellowship (AGD), Royal Society Research Grant (RGS\R2\202434) to AGD and the EPSRC Doctoral Funding Award (EPSRC DTP Grant No. EP/R513131/1) (TB). The authors declare that this study received funding from bp-ICAM. The funder was not involved in the study design, collection, analysis, interpretation of data, the writing of this article, or the decision to submit it for publication.
Acknowledgments
We thank Matthew Graham, Department of Material, University of Manchester, for proofreading the final version of the manuscript and Jiaxin Hou for his help in plotting the graphical representation used in Figure 5.
Conflict of interest
The authors declare that the research was conducted in the absence of any commercial or financial relationships that could be construed as a potential conflict of interest.
The handling editor GG declared a past co-authorship with the author AGD.
Publisher’s note
All claims expressed in this article are solely those of the authors and do not necessarily represent those of their affiliated organizations, or those of the publisher, the editors and the reviewers. Any product that may be evaluated in this article, or claim that may be made by its manufacturer, is not guaranteed or endorsed by the publisher.
Supplementary material
The Supplementary Material for this article can be found online at: https://www.frontiersin.org/articles/10.3389/fphot.2023.1134807/full#supplementary-material
References
Anyfantakis, M., Jampani, V. S. R., Kizhakidathazhath, R., Binks, B. P., and Lagerwall, J. P. F. (2020). Responsive photonic liquid marbles. Angew. Chem. Int. Ed. 59 (43), 19422–19429. doi:10.1002/ange.202008210
Balcerowski, T., Ozbek, B., Akbulut, O., and Dumanli, A. G. (2023). Hierarchical organization of structurally colored cholesteric phases of cellulose via 3D printing. Small 19, 2205506. doi:10.1002/smll.202205506
Barzic, A. I., Soroceanu, M., Rotaru, R., Doroftei, F., Asandulesa, M., Tugui, C., et al. (2022). Cellulose derivative/barium titanate composites with high refractive index, conductivity and energy density. Cellulose 29 (2), 863–878. doi:10.1007/s10570-021-04343-2
Belyakov, V. A., Dmitrienko, V. E., and Orlov, V. P. (1979). Optics of cholesteric liquid crystals. Sov. Phys. Uspekhi 22 (2), 64–88. doi:10.1070/pu1979v022n02abeh005417
Bhadani, S. N., and Gray, D. G. (1983). Cellulose-based liquid crystalline polymers; esters of (hydroxypropyl) cellulose. Mol. Cryst. Liq. Cryst. 99 (1), 29–38. doi:10.1080/00268948308072026
Chan, C. L. C., Bay, M. M., Jacucci, G., Vadrucci, R., Williams, C. A., De Kerkhof, G. T., et al. (2019). Visual appearance of chiral nematic cellulose-based photonic films: Angular and polarization independent color response with a twist. Adv. Mater. 31 (52), 1905151. doi:10.1002/adma.201905151
Chan, C. L. C., Lei, I. M., Van De Kerkhof, G. T., Parker, R. M., Richards, K. D., Evans, R. C., et al. (2022). 3D printing of liquid crystalline hydroxypropyl cellulose—Toward tunable and sustainable volumetric photonic structures. Adv. Funct. Mater. 32 (15), 2108566. doi:10.1002/adfm.202108566
Dürig, T., and Karan, K. (2019). “Chapter 9 - binders in wet granulation,” in Handbook of pharmaceutical wet granulation. Editors A. S. Narang, and S. I. F. Badawy (Cambridge: Academic Press), 317–349.
Dumanli, A. G., Van Der Kooij, H. M., Kamita, G., Reisner, E., Baumberg, J. J., Steiner, U., et al. (2014). ACS Appl. Mater. Interfaces 6, 12302–12306.
Fortin, S., and Charlet, G. (1989). Phase diagram of aqueous solutions of (hydroxypropyl)cellulose. Macromolecules 22 (5), 2286–2292. doi:10.1021/ma00195a050
Fried, F., Gilli, J. M., and Sixou, P. (1983). The cholesteric pitch in lyotropic solutions of a semi-rigid macromolecule: Hydroxypropyl-cellulose. Mol. Cryst. Liq. Cryst. 98 (1), 209–221. doi:10.1080/00268948308073476
Frka-Petesic, B., Kamita, G., Guidetti, G., and Vignolini, S. (2019). Angular optical response of cellulose nanocrystal films explained by the distortion of the arrested suspension upon drying. Phys. Rev. Mater. 3 (4), 045601. doi:10.1103/physrevmaterials.3.045601
Godinho, M. H., Gray, D. G., and Pieranski, P. (2017). Revisiting (hydroxypropyl) cellulose (HPC)/water liquid crystalline system. Liq. Cryst. 44, 2108–2120. doi:10.1080/02678292.2017.1325018
Hayata, K., and Furumi, S. (2019). Side chain effect of hydroxypropyl cellulose derivatives on reflection properties. Polymers 11 (10), 1696. doi:10.3390/polym11101696
Kamita, G., Frka-Petesic, B., Allard, A., Dargaud, M., King, K., Dumanli, A. G., et al. (2016). Biocompatible and sustainable optical strain sensors for large-area applications. Adv. Opt. Mater. 4 (12), 1950–1954. doi:10.1002/adom.201600451
Kamita, G., Vignolini, S., and Dumanli, A. G. (2023). Edible cellulose-based colorimetric timer. Nanoscale Horiz. doi:10.1039/d3nh00006k
Kapoor, D., Maheshwari, R., Verma, K., Sharma, S., Ghode, P., and Tekade, R. K. (2020). “Chapter 14 - coating technologies in pharmaceutical product development,” in Drug delivery systems. Editor R. K. Tekade (Cambridge: Academic Press), 665–719.
Keating, P. N. (1969). A theory of the cholesteric mesophase. Mol. Cryst. 8 (1), 315–326. doi:10.1080/15421406908084912
Kragt, A. J. J., Hoekstra, D. C., Stallinga, S., Broer, D. J., and Schenning, A. P. H. J. (2019). 3D helix engineering in chiral photonic materials. Adv. Mater. 31 (33), 1903120. doi:10.1002/adma.201903120
Liang, H.-L., Bay, M. M., Vadrucci, R., Barty-King, C. H., Peng, J., Baumberg, J. J., et al. (2018). Roll-to-roll fabrication of touch-responsive cellulose photonic laminates. Nat. Commun. 9 (1), 4632. doi:10.1038/s41467-018-07048-6
Ming, S., Zhang, X., Chan, C. L. C., Wang, Z., Bay, M. M., Parker, R. M., et al. (2023). Exploiting the thermotropic behavior of hydroxypropyl cellulose to produce edible photonic pigments. Adv. Sustain. Syst. 7, 2200469. doi:10.1002/adsu.202200469
Nishio, Y., Chiba, R., Miyashita, Y., Oshima, K., Miyajima, T., Kimura, N., et al. (2002). Salt addition effects on mesophase structure and optical properties of aqueous hydroxypropyl cellulose solutions. Polym. J. 34 (3), 149–157. doi:10.1295/polymj.34.149
Onogi, Y., and Nishijima, Y. (1986). Liquid crystalline structure of hydroxypropyl cellulose. Estimation of intrinsic anisotropy of rigid polymer chain. Kobunshi Ronbunshu 43 (4), 223–229. doi:10.1295/koron.43.223
Ragab, E. A.-Z., El-Wakil, N. A., Elgendy, A., Fahmy, Y., and Dufresne, A. (2021). Liquid crystalline properties of hydroxypropyl cellulose prepared from dissolved Egyptian bagasse pulp. Cellul. Chem. Technol. 55 (1-2), 13–22. doi:10.35812/cellulosechemtechnol.2021.55.02
Rivera, M., and Reyes, J. A. (2007). Nested optical band gaps for a cholesteric elastomer slab under stress. Appl. Phys. Lett. 90 (2), 023513. doi:10.1063/1.2430784
Ryabchun, A., and Bobrovsky, A. (2018). Cholesteric liquid crystal materials for tunable diffractive Optics. Adv. Opt. Mater. 6 (15), 1800335. doi:10.1002/adom.201800335
Saeva, F., and Wysocki, J. (1971). Induced circular dichroism in cholesteric liquid crystals. J. Am. Chem. Soc. 93 (22), 5928–5929. doi:10.1021/ja00751a075
Schütz, C., Bruckner, J. R., Honorato-Rios, C., Tosheva, Z., Anyfantakis, M., and Lagerwall, J. P. F. (2020). From equilibrium liquid crystal formation and kinetic arrest to photonic bandgap films using suspensions of cellulose nanocrystals. Crystals 10 (3), 199. doi:10.3390/cryst10030199
Suto, S., Tashiro, H., and Karasawa, M. (1990). Circular dichroism study of crosslinked cholesteric liquid crystalline hydroxypropyl cellulose solid films. J. Mater. Sci. Lett. 9 (7), 768–769. doi:10.1007/bf00720151
Werbowyj, R. S., and Gray, D. G. (1984). Optical properties of hydroxypropyl cellulose liquid crystals. I. Cholesteric pitch and polymer concentration. Macromolecules 17 (8), 1512–1520. doi:10.1021/ma00138a016
Werbowyj, R. S., and Gray, D. G. (1980). Ordered phase formation in concentrated hydroxpropylcellulose solutions. Macromolecules 13 (1), 69–73. doi:10.1021/ma60073a014
Yamagishi, T., Fukuda, T., Miyamoto, T., Ichizuka, T., and Watanabe, J. (1990). Thermotropic cellulose derivatives with flexible substituents. III. Temperature dependence of cholesteric pitches exhibiting a cholesteric sense inversion. Liq. Cryst. 7 (2), 155–161. doi:10.1080/02678299008029204
Keywords: hydroxypropyl cellulose (HPC), cholesteric phase, liquid crystal, structural color, thermotropic, lyotropic, thermal expansion
Citation: Ren H, Balcerowski T and Dumanli AG (2023) Achieving a full color palette with thickness, temperature, and humidity in cholesteric hydroxypropyl cellulose. Front. Photonics 4:1134807. doi: 10.3389/fphot.2023.1134807
Received: 30 December 2022; Accepted: 16 May 2023;
Published: 07 June 2023.
Edited by:
Giulia Guidetti, Tufts University, United StatesReviewed by:
Suwit Kiravittaya, Chulalongkorn University, ThailandSara Coppola, National Research Council (CNR), Italy
Copyright © 2023 Ren, Balcerowski and Dumanli. This is an open-access article distributed under the terms of the Creative Commons Attribution License (CC BY). The use, distribution or reproduction in other forums is permitted, provided the original author(s) and the copyright owner(s) are credited and that the original publication in this journal is cited, in accordance with accepted academic practice. No use, distribution or reproduction is permitted which does not comply with these terms.
*Correspondence: Ahu Gümrah Dumanli, YWh1Z3VtcmFoLnBhcnJ5QG1hbmNoZXN0ZXIuYWMudWs=