 Antonia Intze1,2†Maria Eleonora Temperini1,2†
 Leonetta Baldassarre1Valeria Giliberti2
 Michele Ortolani1,2
 Raffaella Polito1*
- 1Department of Physics, Sapienza University of Rome, Rome, Italy
- 2Center for Life Nano & Neuro Science CL2NS, Istituto Italiano di Tecnologia, Rome, Italy
The proton pump Bacteriorhodopsin (BR) undergoes repeated photocycles including reversible conformational changes upon visible light illumination. Exploiting the sensitivity of infrared (IR) spectra to the conformation, we have determined the reaction kinetic parameters of the conductive intermediate M for the wild-type protein and for its slow mutant D96N during its photocycle. Time-resolved IR micro-spectroscopy using an in-house developed confocal laser microscope operating in the mid-IR is employed to record absorption changes of 10−4 at wavelengths λ1 = 6.08 μm and λ2 = 6.35 μm, assigned to backbone and retinal structural modifications, respectively. Protein samples were embedded in dried lipid bilayers deposited on ultraflat gold supports to enhance the surface field. The signals were analyzed according to a simplified photocycle model with only two dominant states: the dark-adapted state BR* and the intermediate M. We obtained the excitation and relaxation times of the intermediate M from exponential fits to the absorption change time traces. Our results constitute a first step towards future plasmonic-assisted nanoscale time-resolved mid-IR spectrometers for the characterization of bioelectronic and light-harvesting nanodevices based on BR.
Introduction
The basic mechanism of many protein functions goes through changes of the protein conformation under a given external stimulus. Vibrational spectroscopy in the mid-infrared (mid-IR) is a well-established tool for protein structural analysis, relying on vibrational transitions measurement, in a label-free fashion and in a quasi-physiologic environment (Baker et al., 2014; Rout and Sali, 2019). In the IR wavelength range between 5.5 and 6.5 μm (approximately from 1500 to 1700 cm−1) the amide-I and amide-II bands are observed, whose detailed line shape is sensitive to the relative positions of the C, N, H, and O atoms of the peptide bonds (Barth, 2007). A protein conformational change often results in an observable mid-IR difference absorption spectrum with both positive and negative features (see examples in Figures 1C, D), which can be compared to atomistic simulations of the vibrational spectrum for each significant protein conformation (Davis et al., 2018; Lorenz-Fonfria, 2020).
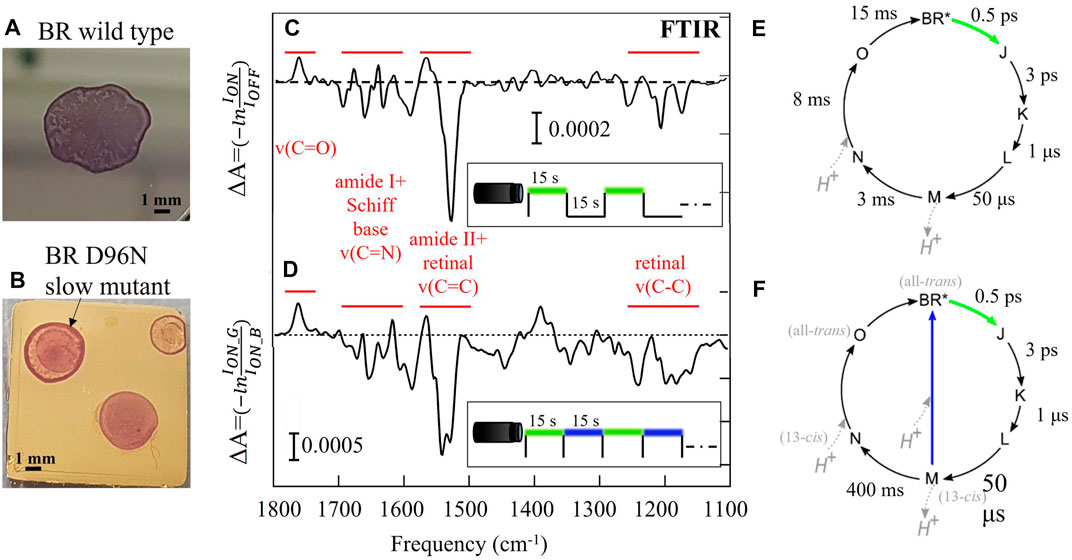
FIGURE 1. Difference FTIR spectroscopy of thin films of wild-type BR (A, C, E) and its slow mutant BR D96N (B, D, F). (A, B) Pictures of the films obtained by drop casting on solid substrates. (C, D) Difference spectra resulting from the average of 80 repeated photocycles together with the indication of the main vibrational bands (in red) and the employed time/color structure of the LED illumination (square waves vs. time). (E, F) Sketch of the photocycle of the two BR protein variants. The approximative lifetime of each step in liquid environment is indicated (Holz et al., 1989; Ernst et al., 2014). To perform difference spectroscopy with repeated cycles on the slow mutant, the second part of the photocycle is usually shortcut by blue light illumination.
Rhodopsins are fundamental cell receptors undergoing light-induced conformational changes that allow them to act as ion pumps and channels through the cell membrane (Ernst et al., 2014). The structure of rhodopsins consists of a seven-helix protein and a non-protein cofactor, called retinal, which provides the protein with sensitivity to visible light. This photochemical sensitivity is exploited by living cells for energy harvesting and signal transduction (Ernst et al., 2014; Frangipane et al., 2018), thereby triggering applications in organic photovoltaics (Jin et al., 2008), active matter control (Mahyad et al., 2015), and optogenetics (Deisseroth, 2011; Grote et al., 2014). Under visible light illumination, the retinal undergoes its own conformational change (in particular, a photoisomerization) that can be monitored through the observation of C-C and C=C vibrations. The simultaneous reversible conformational changes of the protein and the retinal, that take place under visible illumination, are named the rhodopsin photocycle (Ernst et al., 2014). Mid-IR difference spectroscopy is the standard approach to monitor these slight modifications of the protein structure underlying the photocycle of rhodopsins, usually performed with the Fourier-transform IR (FTIR) technique with the time-resolved spectroscopy method (Schultz et al., 2018; Lorenz-Fonfria, 2020). This method can provide information on the protein dynamics analyzing the difference spectra linked to the light-induced chemical bonds and the conformation modifications. Furthermore, it is possible to isolate kinetic information, meaning the excitation time, relaxation time and the lifetime of individual intermediates of the rhodopsin photocycle (Ernst et al., 2014; Lorenz-Fonfria, 2020). Given a time-resolved spectra dataset, a time trace at fixed wavelength describes the temporal evolution of an individual chemical bond (Efremov et al., 2006). Knowledge of the time scale of the photocycle intermediates is essential to have an active control of the biological activity of rhodopsins for both optogenetics and optoelectronic applications.
The photoactive proton pump Bacteriorhodopsin (BR) and its mutants are promising materials for use in light-harvesting and bioelectronic nanodevices (Haupts et al., 1999). The function of rhodopsins as proton pumps works at the nanometric scale because of their transmembrane protein nature (cell membrane thickness is around 5 nm, lateral protein size is below 3 nm, lateral size of a typical cell membrane patch containing rhodopsins is around 500 nm) (Ernst et al., 2014). In many applications of these nanometric “molecular machines”, dried thin films (down to monolayers) of lipid bilayers containing BR proteins are sandwiched between metal or semiconductor electrodes. It is known that the scarcity of protons in the dry environment prolongs the lifetime of the M intermediate state up to several seconds, nevertheless the relevant time scales of the photocycle intermediates in this condition are not reported in literature (Giliberti et al., 2019). It is therefore important to be able to measure the relevant lifetimes using mid-IR radiation and, in perspective, reaching nanoscale resolution, which will be relevant for characterizing light-energy conversion and bioelectronic devices.
Nanoscale resolution for mid-IR spectroscopy is currently attained by using atomic-force-microscopy (AFM)-assisted laser spectrometers (Amenabar et al., 2013; Giliberti et al., 2019; Pfitzner and Heberle, 2020). The nanoscale resolution can be only reached thanks to the plasmonic filed enhancement at the metal-coated AFM probe tip, acting as a plasmonic nanoantenna (Giliberti et al., 2019; Malerba et al., 2022). These sophisticated instruments do not feature time resolution capabilities, which can be maybe expected in the future with the introduction of even more advanced mid-IR frequency-comb quantum-cascade-laser (QCL) spectrometers (Klocke et al., 2018). In this context, we have built a confocal optical microscope coupled to a mid-IR QCL (Temperini et al., 2023),1 with which we have started to implement time-resolved measurements, foreseeing, although not yet using at the moment, a scanning plasmonic nanoantenna (metal-coated AFM probe or similar) for nanometric resolution (Giliberti et al., 2019; Polito et al., 2021).
In this paper, we report, for the first time to our knowledge, the excitation and relaxation times of the conductive intermediate M of wild-type BR and its slow mutant BR D96N (Holz et al., 1989; Gergely et al., 1993) embedded in dried thin films and deposited on flat solid supports. We performed time-resolved mid-IR laser micro-spectroscopy (Mittal et al., 2018; Kümmel et al., 2021) operating with a time resolution of 30 ms. Our IR microscope features two co-aligned paths for visible and IR laser for the selective photoactivation of the proteins in the illuminated sample area only. To obtain the required signal-to-noise ratio (SNR) necessary to probe the small mid-IR relative absorption differences, of the order of 10−3 to 10−4, time-resolved experiments generally require averaging over many tens of repeated photocycles (Heberle et al., 2000; Lorenz-Fonfria, 2020). Between two subsequent visible light pulses it is needed a delay longer than the time required for the proteins to recover the dark-adapted state BR*. This return time can range from a few tens of milliseconds, as for the wild-type BR in liquid environment (Heberle et al., 2000), to many minutes, as for some mutants of Channelrhodopsin (Berndt et al., 2009; Franziska et al., 2015), depending on the specific protein and the environmental conditions (Ernst et al., 2014). In the case of proteins with a slow photocycle, of the order of seconds or minutes, this translates to a long total experimental time up to several hours or days. To tackle this temporal limitation, we performed experiments for the slow mutant BR D96N using a protocol for sample replacement to record each measurement from a dark-adapted sample area, thereby minimizing both the total experimental time and the photodegradation of the sample. Moreover, the visible light activation of only the molecules present in the IR focal spot of a few tens of microns reduces the sample consumption which is generally a problem for biomolecules: a few-μl droplets resulting in mm-sized sample area provide 102–103 different dark-adapted locations for signal co-adding and improvement of the SNR. In conclusion our microscope has many practical advantages that could make it suitable for performing time-resolved studies of several photo-induced processes ranging from other photobiological to photochemical reactions (Mezzetti et al., 2022).
Bacteriorhodopsin and its photocycle variants
We investigated the photoactive protein BR in two different variants: the wild-type BR featuring a fast return time of less than 30 ms in liquid environment (Heberle et al., 2000), and the slow mutant BR D96N featuring a long return time of many seconds (Holz et al., 1989; Gergely et al., 1993). The relevant time scales and illumination wavelengths of the BR photocycle are summarized in Figures 1E, F for both variants in liquid environment. The intermediate M is the so-called conductive state of the photocycle because during its lifetime a proton is released toward the extracellular surface of the protein. In FTIR difference spectroscopy of the slow mutant, after the green light excitation it is often necessary to use blue light, absorbed by the M intermediate state, to “shortcut” the slow section of the photocycle (M → N → O) (Krisztina et al., 1999). One is then able to take hundreds of difference spectra in a reasonable time frame, however the proton capture dynamics of the proteins that absorbed blue light is fundamentally different from those who went through the N and O intermediates. In Figure 1D a double-dip structure is observed in the difference spectrum of the slow mutant around 1570 cm-1, suggesting the simultaneous population of two different final states (BR* and X*), indeed (Giliberti et al., 2019). In the case of the slow mutant BR D96N, we employed a protocol of dark-adapted sample replacement to eliminate the need for blue light “shortcut” illumination, allowing to probe the lifetime of the intermediate state M in a reasonable time frame.
Materials and methods
Sample preparation
Patches of cell membranes densely filled with wild-type BR or its mutant BR D96N were purified as reported in ref 31 and stored in buffer solution (20 mM Bis-Tris propane, 100 mM NaCl, 1 mM MgCl2) at −80°C. Droplets of 10 μL of the suspension containing cell membranes were cast onto 1 cm × 1 cm template-stripped gold chips (Platypus Technologies) and let dry in controlled low-humidity conditions.
Time-resolved mid-IR micro-spectroscopy
Time-resolved micro-spectroscopy measurements were performed using an in-house developed confocal mid-IR laser microscope (Temperini et al., 2023).1 The latter operates in reflection mode and features a co-aligned IR and visible illumination path. The IR source is an external-cavity QCL operating in pulsed mode with a tuning range from 5.80 to 6.35 μm and peak output power <300 mW. The microscope is based on a pair of infinity-corrected Cassegrain reflective objectives with numerical aperture of 0.4 (Beck Optronic Solutions) and a piezo-driven XY table (Physik Instrumente). The IR diffraction-limited spot size at λ1 = 6.08 μm is around 32 μm. A time resolution of 30 ms is achieved using a cryogen-free (thermoelectric-cooled) HgCdTe detector and lock-in amplification at the QCL repetition rate of 100 kHz. The SNR is 103 in the time trace ω1 = 1/λ1 = 1644 cm-1 and it increases to 104 when averaging 80 time traces. The light to start the BR photocycle is provided by a LED (Thorlabs M565L3, center wavelength at 565 nm). The visible illumination power sent to the sample is around 10 mW. The microscope is implemented with a protocol for sample replacement that allows one to perform time-resolved studies rigorously starting from the dark-adapted state of the slow mutant BR D96N. The LED illumination (from 60 ms to 1.5 s pulse duration), the piezo-driven XY table and the lock-in amplifier are synchronized by a master oscillator (Quantum Composers) and controlled by a Python code that ensures full automation. For more details see ref 20.
Data analysis
The time traces acquired at fixed wavelengths are plotted as ION(t)/IOFF where ION(t) and IOFF are the values of the reflected intensity under visible illumination and just before turning the LED on, respectively. The exponential increase and decay of the time traces are fitted to obtain the characteristic excitation (τE) and the relaxation (τR) time of the intermediate M, respectively. In the case of the time trace acquired on the slow mutant BR D96N at fixed position (brown curve in Figure 3C), an exponential profile obtained by fitting the curve of Figure 2C is subtracted from the raw data. This subtraction operation is performed to remove unavoidable photothermal effects.
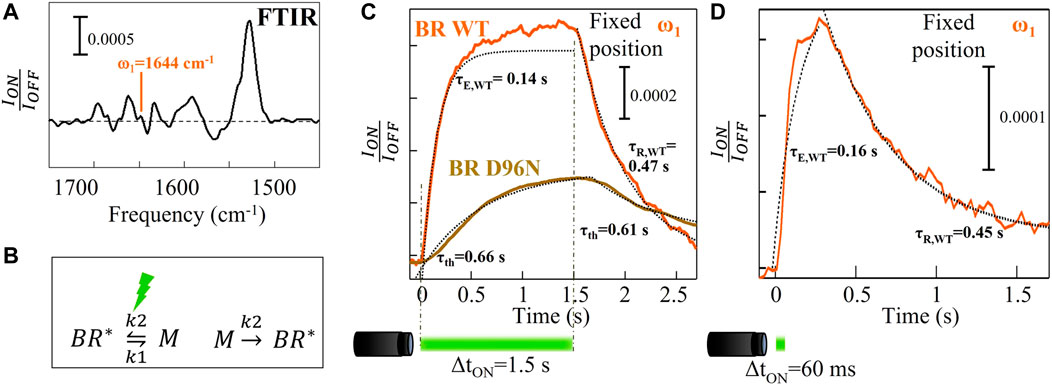
FIGURE 2. Time-resolved micro-spectroscopy of wild-type BR performed with our mid-IR laser microscope. (A) FTIR reference difference spectrum replotted from Figure 1C. (B) Simplified chemical reactions describing the principal photocycle events of BR. (C) Time traces averaged over 80 repeated measurements for wild-type BR (orange curve) and for the slow mutant BR D96N (gold curve) acquired at ω1 = 1644 cm-1 with a visible illumination time on of 1.5 s and a time resolution of 30 ms. (D) The same of (C) with a visible illumination time on of 60 ms.
Results
A typical thin film of BR is produced by drop-casting 10 μL of cell membrane suspension on an ultraflat gold surface (Figures 1A, B). The cell membrane of Halobacterium salinarum contains almost exclusively BR and lipids (Soppa, 2006). The film thickness is inhomogeneous and varies between 1 and 3 μm. The total dried-drop area is around 4 mm2.
Time-resolved kinetic studies of the intermediate M of wild-type Bacteriorhodopsin
Figure 2A is a detailed view of Figure 1C, in which we plot ION/IOFF instead of -ln (ION/IOFF) where ION and IOFF are the values of the reflected intensity under visible illumination and just before turning the LED on, respectively. In Figure 2A, the mid-IR wavelength selected for the experiment has been highlighted: λ1 = 6.08 μm (ω1 = 1644 cm-1). It is close to the center of the amide-I band where the α-helix absorption has a maximum and atmospheric attenuation is minimal. We acquired time traces at ω1 = 1644 cm-1 (Figures 2C, D) as the α-helix absorption is the most sensitive to the protein conformational changes. Time-resolved reflected-intensity time traces ION(t) are acquired with duration of the illumination pulse ΔtON and wait time before the next pulse of 1.5 s and 1.8 s, respectively. The wild-type BR (fast) photocycle is not strongly affected by the repetition of subsequent illumination cycles with total period of a few seconds, therefore meaningful time traces can also be acquired without replacing the sample in the focus of the microscope. The time trace averaged over 80 photocycles at fixed position of the XY stage features an exponential increase with a characteristic excitation time τE = 0.14 s that is determined from fitting (Figure 2C, orange curve). This exponential increase is followed by a non-perfect asymptotic behavior and then by a slower exponential decay to the dark-adapted value, with characteristic relaxation time τR = 0.47 s > τE. Figure 2C shows also the time trace acquired at fixed position on the slow mutant BR D96N averaging over 80 photocycles. It increases slightly with a characteristic photothermal time constant τth = 0.66 s and, when the illumination is turned off, it decreases with a relaxation time constant undistinguishable from τth. This indicates that the conformational changes, in the case of BR D96N without replacing the sample in the focus of the microscope, have a trivial photothermal origin, i.e., a local temperature increase due to absorption of visible light coming from the LED. The amide-I signal increases and decreases with visible illumination turning on and off, respectively, not revealing any intrinsic photocycle dynamics. After the first LED pulse, which hits the proteins in their dark-adapted BR* state, the subsequent 79 LED pulses hit the same proteins in a non-dark-adapted state, most likely a high vibrational level of the M state, not originating any photocycle but only photothermal effects. The correct procedure to measure the photocycle of the slow mutant BR D96N is therefore dark-adapted sample replacement by mapping. Figure 2D shows the time trace acquired on wild-type BR at fixed position by reducing the illumination time to ΔtON = 60 ms in order to avoid slight photothermal effects unavoidable even in the fast BR variant. The excitation and relaxation times obtained from exponential fitting fairly match those of Figure 2C (orange curve).
Time-resolved kinetic studies of the intermediate M of D96N Bacteriorhodopsin mutant
Figure 3A illustrates a part of a slow mutant BR D96N droplet with a grid of 80 locations. At each grid position, we acquired IR data and then we averaged them to obtain the final time trace. The replacement step was chosen to be around 250 µm to avoid any stray light effects inside the drop. We measured the time traces at two different mid-IR wavelengths λ1 = 6.08 μm (ω1 = 1644 cm-1) and λ2 = 6.35 μm (ω2 = 1575 cm-1) (highlighted in Figure 3B). The resulting curve at ω1 (amide-I) is shown in Figure 3C. In these conditions, the photothermal contribution to the amide-I difference signal could not be neglected as we did in Figure 2C for wild-type BR. In other words, we have to remove the signal contribution of those proteins that do not experience any conformational changes related to the photocycle, but only due to temperature increase. We then subtracted from the raw data (brown curve in Figure 3C) an exponential profile with τth = 0.66 s, taken from the previous observation of Figure 2C, both from the increasing and decreasing range of the signal (0 < t < 1.5 s and t > 1.5 s, respectively). The resulting red curve in Figure 3C shows two different characteristic times that can be fitted with simple exponential relations: a short τE,D96N = 0.88 s for the excitation of the M intermediate under green light illumination, and a long τR,D96N = 4.8 s for relaxation back to the dark-adapted state BR* after the light pulse is turned off. This slow relaxation from the intermediate M to the dark-adapted state BR* represents the main characteristic of the slow mutant BR D96N, correlated to the substitution of the hydrogen-binding amino acid aspartic acid in position 96 with the asparagine. In particular, that specific amino acid substitution inhibits the hydrogen-transfer capability to the retinal, slowing down the M → BR* transition (Krisztina et al., 1999; Berndt et al., 2009).
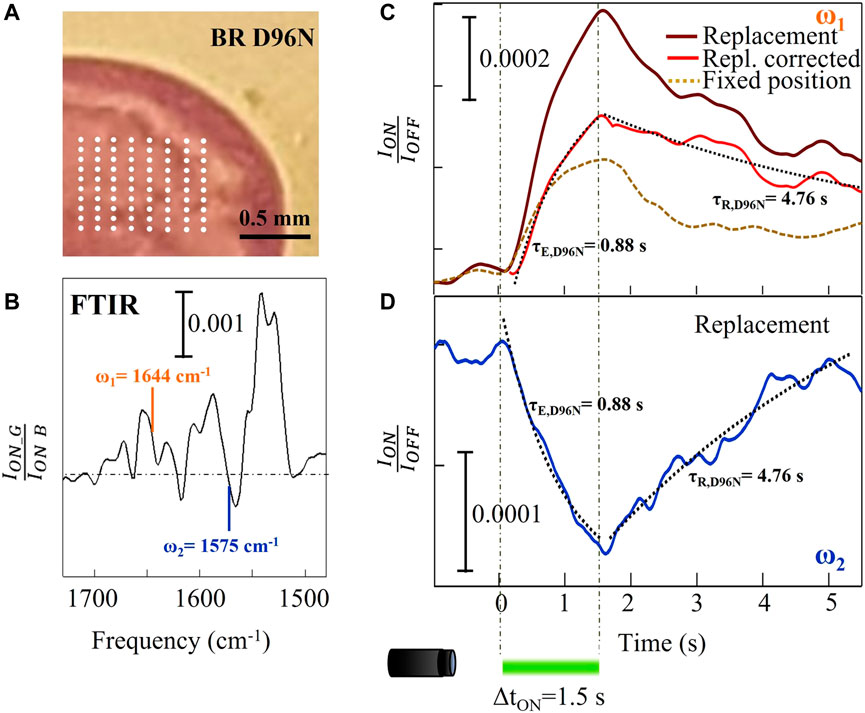
FIGURE 3. Time-resolved micro-spectroscopy of the slow mutant BR D96N performed with our mid-IR laser microscope. (A) Picture of part of the dried drop with indication of the array of positions (white dots) of sample replacement by mapping. (B) FTIR reference difference spectrum replotted from Figure 1D. (C) Time traces at ω1 = 1644 cm-1 with and without sample replacement for the slow mutant D96N (brown and dashed gold curves, respectively). The red curve is the subtraction between the other two curves. (D) Time trace at ω2 = 1575 cm-1 showing the opposite sign of the spectral difference as expected from panel (B).
Figure 3D shows the time trace acquired on the same sample at ω2 = 1575 cm−1, which is related to conformational changes of the retinal. In the case of BR, only when the protein executes its conformational change from the M to the N and finally to the O state does the retinal reverse its photoisomerization (see Figure 1F). For this reason, there is a good correlation between the relaxation time of the amide-I and of the retinal signals as verified from the fitting curves in Figure 3D (dotted black curves), obtained by imposing the same τE and τR taken from the fitting of the red curve of Figure 3C. Notably, it is not necessary here to subtract the photothermal signal because at this wavenumber corresponding to the edge of the strongest retinal absorption change, the signal is almost insensitive to temperature (Rödig et al., 1999; Mezzetti and Spezia, 2008).
Discussion
We now connect the experimentally observed τE and τR in wild-type BR with the photochemical reaction rates of Figure 2B. We assume a simplified photocycle with two dominant states, the dark-adapted state BR* and the longest-lifetime intermediate M. This occurrence is peculiar of BR proteins in dry conditions as also verified by us with time-resolved FTIR spectroscopy (Giliberti et al., 2019): the scarcity of protons in the dry environment slows down the M → N transition and the green light is partly absorbed by the N and O intermediates depopulating them, but not by the M intermediate, whose optical absorbance peaks sharply in the blue light. According to our model, τE and τR can be directly correlated to the excitation and relaxation lifetime of the conductive state M, respectively. We apply the rate law of the chemical kinetics to the reversible reaction BR* ⇔ M (see scheme in Figure 2B), because during the excitation light pulse not only BR* turns into M (forward reaction rate k1), but also the fast non-radiative relaxation from M to BR* takes place (backward reaction rate k2<k1) (Atkins and de Paula, 2014; Tian et al., 2017). When the LED is turned off, the intermediate state M is depleted with rate k2 and without any counter reaction. k1 and k2 can then be derived from the experimentally determined τE and τR as follows:
From the formulas we obtain k1 = 4.0 s−1 and k2 = 2.2 s−1. Note that the M state population reached at the end of the LED pulse, i.e., when the chemical equilibrium is achieved, is lower than the initial BR* population by an efficiency factor k1/(k1+k2) = 0.64. The wild-type BR time trace in Figure 2C (orange curve), however, does not reach an asymptote at t > 5τE = 0.7 s because of unavoidable photothermal effects: also in the wild-type BR, as in BR D96N, the temperature increases due to visible light absorption resulting in small secondary structure changes, that continue to take place in the time interval 0.7–1.5 s. To avoid photothermal effects, the curve in Figure 2D is obtained by decreasing the illumination time to ΔtON = 60 ms. The τE and τR are in agreement with those of Figure 2C (orange curve).
Concerning the slow mutant BR D96N, to precisely determine from our time-resolved data its reaction rates, we again use Eq. 1, 2 at the amide-I frequency ω1 = 1644 cm−1. We obtain k1,D96N = 0.93 s−1 and k2,D96N = 0.21 s−1. The efficiency factor is 0.82, higher than that of wild-type BR due to the much slower backward reaction rate, k2,D96N << k2,WT correlated to the longer lifetime of the intermediate M state. As already mentioned, we obtain the backward reaction rate of the slow mutant BR D96N from the fitting of the time trace acquired by averaging over 80 photocycles with sample replacement. This would not be measurable resting at a fixed position with alternated green and blue light illumination periods, as done in the FTIR experiment of Figure 1D, because the absorption of blue light “shortcuts” the photocycle and prevents its completion.
Conclusion
In this work we have monitored the kinetic parameters of the conductive intermediate M during the photocycle of wild-type BR and its slow mutant BR D96N when embedded in dried lipid bilayers. Assuming a simplified photocycle model with only two dominant states, the dark-adapted state BR* and the intermediate M, we have evaluated, for the first time to our knowledge, the excitation and relaxation times of the conductive intermediate M in dry conditions. We performed our measurements using an in-house confocal microscope integrating an IR laser source with a parallel confocal visible light illumination channel. In perspective, the data obtained with the micro-spectroscopy approach proposed in this paper constitute a first step towards future AFM-assisted time-resolved difference spectroscopy of rhodopsins, in which the nanoscale is reached due to the plasmonic nanoantenna behaviour of the gold-coated AFM probe. Our results are relevant for bioelectronic nanodevices in which dried films of cell membranes containing BR proteins are employed to harvest the visible light and inject photoelectrons to metal or semiconductor electrodes (Giliberti et al., 2019; Polito et al., 2021).
Data availability statement
The original contributions presented in the study are included in the article/supplementary material, further inquiries can be directed to the corresponding author.
Author contributions
AI, MET, LB, VG, MO, and RP: Contribution to the conception and design of the work; AI, MET, MO, and RP: Acquisition, analysis, and interpretation of data for the work; AI, MO, and RP: contribution to drafting the work and revising of analysis and manuscript.
Funding
We acknowledge the support from Sapienza University of Rome “Ricerca d’Ateneo” Grant nos. AR12117A859E27F0, RM12117A5EDED70C, PH120172B3E3E36D.
Acknowledgments
We wish to acknowledge the colleagues Chiara Ciano and Simone Sotgiu for all the interesting discussions and for scientifically supporting us during this work.
Conflict of interest
The authors declare that the research was conducted in the absence of any commercial or financial relationships that could be construed as a potential conflict of interest.
Publisher’s note
All claims expressed in this article are solely those of the authors and do not necessarily represent those of their affiliated organizations, or those of the publisher, the editors and the reviewers. Any product that may be evaluated in this article, or claim that may be made by its manufacturer, is not guaranteed or endorsed by the publisher.
Footnotes
1Temperini, M. E., Polito, R., Intze, A., Gillibert, R., Baldassarre, L., Giliberti, V., et al. (2023). A mid-infrared laser microscope for the time-resolved study of light-induced protein conformational changes. Rev. Sci. Instrum. Under review.
References
Amenabar, I., Poly, S., Nuansing, W., Govyadinov, A. A., Huth, F., Krutokhvostov, R., et al. (2013). Structural analysis and mapping of individual protein complexes by infrared nanospectroscopy. Nat. Commun. 4, 2890. doi:10.1038/ncomms3890
Atkins, P., and de Paula, J. (2014). Atkins' physical chemistry. Oxford, United Kingdom: Oxford University Press.
Baker, M. J., Trevisan, J., Bassan, P., Bhargava, R., Butler, H. J., Dorling, K. M., et al. (2014). Using Fourier transform IR spectroscopy to analyze biological materials. Nat. Protoc. 9, 1771–1791. doi:10.1038/nprot.2014.110
Barth, A. (2007). Infrared spectroscopy of proteins. Biochim. Biophys. Acta Bioenerg. 1767, 1073–1101. doi:10.1016/j.bbabio.2007.06.004
Berndt, A., Yizhar, O., Gunaydin, L. A., Hegemann, P., and Deisseroth, K. (2009). Bi-stable neural state switches. Nat. Neurosci. 12, 229–234. doi:10.1038/nn.2247
Davis, C. M., Zanetti-Polzi, L., Gruebele, M., Amadei, A., Dyer, R. B., and Daidone, I. (2018). A quantitative connection of experimental and simulated folding landscapes by vibrational spectroscopy. Chem. Sci. 9, 9002–9011. doi:10.1039/C8SC03786H
Efremov, R., Gordeliy, V. I., Heberle, J., and Büldt, G. (2006). Time-resolved microspectroscopy on a single crystal of bacteriorhodopsin reveals lattice-induced differences in the photocycle kinetics. Biophys. J. 91, 1441–1451. doi:10.1529/biophysj.106.083345
Ernst, O. P., Lodowski, D. T., Elstner, M., Hegemann, P., Brown, L. S., and Kandori, H. (2014). Microbial and animal rhodopsins: Structures, functions, and molecular mechanisms. Chem. Rev. 114, 126–163. doi:10.1021/cr4003769
Frangipane, G., Dell'Arciprete, D., Petracchini, S., Maggi, C., Saglimbeni, F., Bianchi, S., et al. (2018). Dynamic density shaping of photokinetic, E. Coli. Elife 7, e36608. doi:10.7554/eLife.36608
Franziska, S., Grimm, C., and Hegemann, P. (2015). Biophysics of channelrhodopsin. Annu. Rev. Biophys. 44, 167–186. doi:10.1146/annurev-biophys-060414-034014
Gergely, C., Ganea, C., Groma, G., and Váró, G. (1993). Study of the photocycle and charge motions of the bacteriorhodopsin mutant D96N. Biophys. J. 65, 2478–2483. doi:10.1016/S0006-3495(93)81308-0
Giliberti, V., Polito, R., Ritter, E., Broser, M., Hegenmann, P., Puskar, L., et al. (2019). Tip-enhanced infrared difference-nanospectroscopy of the proton pump activity of bacteriorhodopsin in single purple membrane patches. Nano Lett. 19, 3104–3114. doi:10.1021/acs.nanolett.9b00512
Grote, M., Engelhard, M., and Hegemann, P. (2014). Of ion pumps, sensors and channels—Perspectives on microbial rhodopsins between science and history. Biochim. Biophys. Acta - Bioenerg. 1837, 533–545. doi:10.1016/j.bbabio.2013.08.006
Haupts, U., Tittor, J., and Oesterhelt, D. (1999). Closing in on bacteriorhodopsin: Progress in understanding the molecule. Annu. Rev. Biophys. Biomol. Struct. 28, 367–399. doi:10.1146/annurev.biophys.28.1.367
Heberle, J., Fitter, J., Sass, H. J., and Büldt, G. (2000). Bacteriorhodopsin: The functional details of a molecular machine are being resolved. Biophys. Chem. 85, 229–248. doi:10.1016/S0301-4622(99)00154-4
Holz, M., Drachev, L. A., Mogi, T., Otto, H., Kaulen, A. D., Heyn, M. P., et al. (1989). Replacement of aspartic acid-96 by asparagine in bacteriorhodopsin slows both the decay of the M intermediate and the associated proton movement. Proc. Natl. Acad. Sci. U.S.A. 86, 2167–2171. doi:10.1073/pnas.86.7.2167
Jin, Y., Honig, T., Ron, I., Friedman, M., Sheves, M., and Cahen, D. (2008). Bacteriorhodopsin as an electronic conduction medium for biomolecular electronics. Chem. Soc. Rev. 37, 2422–2432. doi:10.1039/B806298F
Klocke, J. L., Mangold, M., Allmendinger, P., Hugi, A., Geiser, M., Jouy, P., et al. (2018). Single-shot sub-microsecond mid-infrared spectroscopy on protein reactions with quantum cascade laser frequency combs. Anal. Chem. 90, 10494–10500. doi:10.1021/acs.analchem.8b02531
Krisztina, L., Ganea, C., and Váró, G. (1999). Back photoreaction from intermediate M of bacteriorhodopsin photocycle. J. Photochem. Photobiol. B Biol. 49, 23–28. doi:10.1016/S1011-1344(98)00220-6
Kümmel, T., van Marwick, B., Rittel, M., Guevara, C. R., Wühler, F., Teumer, T., et al. (2021). Rapid brain structure and tumour margin detection on whole frozen tissue sections by fast multiphotometric mid-infrared scanning. Sci. Rep. 11, 11307–11313. doi:10.1038/s41598-021-90777-4
Lorenz-Fonfria, V. A. (2020). Infrared difference spectroscopy of proteins: From bands to bonds. Chem. Rev. 120, 3466–3576. doi:10.1021/acs.chemrev.9b00449
Mahyad, B., Janfaza, S., and Hosseini, E. S. (2015). Bio-nano hybrid materials based on bacteriorhodopsin: Potential applications and future strategies. Adv. Colloid Interface Sci. 225, 194–202. doi:10.1016/j.cis.2015.09.006
Malerba, M., Sotgiu, S., Schirato, A., Baldassarre, L., Gillibert, R., Giliberti, V., et al. (2022). Detection of strong light–matter interaction in a single nanocavity with a thermal transducer. ACS Nano 16 (12), 20141–20150. doi:10.1021/acsnano.2c04452
Mezzetti, A., Schnee, J., Lapini, A., and Di Donato, M. (2022). Time-resolved infrared absorption spectroscopy applied to photoinduced reactions: How and why. Photochem. Photobiol. Sci. 21, 557–584. doi:10.1007/s43630-022-00180-9
Mezzetti, A., and Spezia, R. (2008). Time-resolved step scan FTIR spectroscopy and DFT investigation on triplet formation in peridinin–chlorophyll-a–protein from Amphidinium carterae at low temperature. J. Spectrosc. 22, 235–250. doi:10.1155/2008/682046
Mittal, S., Yeh, K., Leslie, L. S., Kenkel, S., Kajdacsy-Balla, A., and Bhargava, R. (2018). Simultaneous cancer and tumor microenvironment subtyping using confocal infrared microscopy for all-digital molecular histopathology. Proc. Natl. Acad. Sci. U.S.A. 115, E5651–E5660. doi:10.1073/pnas.1719551115
Pfitzner, E., and Heberle, J. (2020). Infrared scattering-type scanning near-field optical microscopy of biomembranes in water. J. Phys. Chem. Lett. 11, 8183–8188. doi:10.1021/acs.jpclett.0c01769
Polito, R., Temperini, M. E., Ritter, E., Puskar, L., Schade, U., Broser, M., et al. (2021). Conformational changes of a membrane protein determined by infrared difference spectroscopy beyond the diffraction limit. Phys. Rev. Appl. 16, 014048. doi:10.1103/PhysRevApplied.16.014048
Rödig, C., Georg, H., Siebert, F., Rousso, I., and Sheves, M. (1999). Temperature effects of excitation laser pulses during step-scan FT-IR measurements. Laser Chem. 19, 169–172. doi:10.1155/1999/50762
Rout, M. P., and Sali, A. (2019). Principles for integrative structural biology studies. Cell 177, 1384–1403. doi:10.1016/j.cell.2019.05.016
Schultz, B. J., Mohrmann, H., Lorenz-Fonfria, V. A., and Heberle, J. (2018). Protein dynamics observed by tunable mid-IR quantum cascade lasers across the time range from 10ns to 1s. Spectrochim. Acta A Mol. Biomol. Spectrosc. 188, 666–674. doi:10.1016/j.saa.2017.01.010
Soppa, J. (2006). From genomes to function: Haloarchaea as model organisms. Microbiol 152, 585–590. doi:10.1099/mic.0.28504-0
Keywords: Bacteriorhodopsin (BR), protein conformational change, protein kinetics, time-resolved infrared spectroscopy, infrared laser micro-spectroscopy
Citation: Intze A, Temperini ME, Baldassarre L, Giliberti V, Ortolani M and Polito R (2023) Time-resolved investigation of nanometric cell membrane patches with a mid-infrared laser microscope. Front. Photonics 4:1175033. doi: 10.3389/fphot.2023.1175033
Received: 27 February 2023; Accepted: 13 April 2023;
Published: 28 April 2023.
Edited by:
Aliaksandra Rakovich, King’s College London, United KingdomReviewed by:
Rekha Gautam, Vanderbilt University, United StatesMezzetti Alberto, Sorbonne Université(CNRS), France
Copyright © 2023 Intze, Temperini, Baldassarre, Giliberti, Ortolani and Polito. This is an open-access article distributed under the terms of the Creative Commons Attribution License (CC BY). The use, distribution or reproduction in other forums is permitted, provided the original author(s) and the copyright owner(s) are credited and that the original publication in this journal is cited, in accordance with accepted academic practice. No use, distribution or reproduction is permitted which does not comply with these terms.
*Correspondence: Raffaella Polito, cmFmZmFlbGxhLnBvbGl0b0B1bmlyb21hMS5pdA==
†These authors have contributed equally to this work