 Hui-Yun Gu
 Min Yang1†
 Chao Zhang
 Ren-Xiong Wei
- 1Department of Orthopedic, Zhongnan Hospital of Wuhan University, Wuhan, China
- 2Department of Plastic Surgery, Zhongnan Hospital of Wuhan University, Wuhan, China
- 3Center for Evidence-Based Medicine and Clinical Research, Taihe Hospital, Hubei University of Medicine, Shiyan, China
Osteoarthritis (OA) is a joint disease resulting in high rates of disability and low quality of life. The initial site of OA (bone or cartilage) is uncertain. The aim of the current study was to explore biomarkers and pathological processes in subchondral bone samples. The gene expression profile GSE51588 was downloaded from the Gene Expression Omnibus database. Fifty subchondral bone [knee lateral tibial (LT) and medial tibial (MT)] samples from 40 OA and 10 non-OA subjects were analyzed. After data preprocessing, 5439 genes were obtained for weighted gene co-expression network analysis. Highly correlated genes were divided into 19 modules. The yellow module was found to be highly correlated with OA (r = 0.71, p = 1e-08) and the brown module was most associated with the differences between the LT and MT regions (r = 0.77, p = 1e-10). Gene ontology functional annotation and Kyoto Encyclopedia of Genes and Genomes pathway enrichment indicated that the yellow module was enriched in a variety of components including proteinaceous extracellular matrix and collagen trimers, involved in protein digestion and absorption, axon guidance, ECM-receptor interaction, and the PI3K-Akt signaling pathway. In addition, the brown module suggests that the differences between the early (LT) and end (MT) stage of OA are associated with extracellular processes and lipid metabolism. Finally, 45 hub genes in the yellow module (COL24A1, COL5A2, COL3A1, MMP2, COL6A1, etc.) and 72 hub genes in the brown module (LIPE, LPL, LEP, SLC2A4, FABP4, ADH1B, ALDH4A1, ADIPOQ, etc.) were identified. Hub genes were validated using samples from cartilage (GSE57218). In summary, 45 hub genes and 72 hub genes in two modules are associated with OA. These hub genes could provide new biomarkers and drug targets in OA. Further studies focusing on subchondral bone are required to validate these hub genes and better understand the pathological process of OA.
Introduction
Osteoarthritis (OA) is a prevalent, heritable degenerative joint disease, primarily involving large weight-bearing joints in the hip and the knee (Valdes and Spector, 2011; Ryd et al., 2015). As the most common musculoskeletal disease (Picavet and Hazes, 2003), OA causes major pain, disability, low quality of life and an increased social healthcare burden globally (Centers for Disease Control and Prevention [Cdc], 2009). A report (Murphy and Helmick, 2012) investigating 27 million adults found that OA was diagnosed in over 10% of adults and was the fourth most common cause for hospitalization. The World Health Organization Scientific Group estimated that OA caused health issues in 10% of the world population, over 60 years old (Woolf and Pfleger, 2003).
Osteoarthritis is characterized by a complex pathological process including progressive cartilage erosion, osteophyte formation, subchondral bone modification, and synovial inflammation. It involves a long disease span of approximately10 to 20 years from onset to the end-stage, when joint replacement is recognized as the most effective treatment (Chu et al., 2014). Therefore, better identification is urgently required. Biomarkers, which are biological molecules that indicate biological processes, could be used for the identification of OA. Previous studies have mainly focused on the gene expression profiles of articular cartilage, meniscus or synovium from progressive OA patients, and the use of the resulting biomarkers for progressive OA is widespread. However, few consensual biomarkers are available for subchondral bone. Currently, accumulative evidence shows that alterations in subchondral bone are associated with the initiation of OA (Burr and Gallant, 2012). An analysis of gene expression microarray profiling of subchondral bone samples could contribute to the identification of new biomarkers and increase the mechanistic understanding necessary to provide early prevention and management of OA (Vukusic et al., 2013).
Weighted gene co-expression network analysis (WGCNA), a new systems biology method, is increasingly being used in bioinformatics to analyze gene expression microarray profiling data (Stuart et al., 2003; Zhang and Horvath, 2005; Langfelder and Horvath, 2008). By constructing a gene co-expression network, highly correlated genes are clustered into several modules. After relating modules to external information, biologically interesting modules are detected. From interesting modules associated with important biological functions or pathways, critical genes are found which play key roles in the phenotype and the development of disease, such as those involved in body weight (Ghazalpour et al., 2006), brain cancer (Horvath et al., 2006), diabetes (Keller et al., 2008), and osteoporosis (Farber, 2010). In addition, WGCNA can be used to screen candidate biomarkers or therapeutic targets. Therefore, we conducted the current study to find new biomarkers, relevant genes or potential mechanisms associated with OA.
Materials and Methods
Data Collection and Preprocessing
The gene expression profile of OA was downloaded from the Gene Expression Omnibus database1. The GSE51588 microarray dataset (Chou et al., 2013) was obtained from 50 subchondral bone samples including those from 10 non-OA control subjects (five from the lateral tibial plateau and five from medial tibial plateau) and 40 OA subjects (20 from the lateral tibial plateau and 20 from the medial tibial plateau). A series matrix file was preprocessed to find differentially expressed genes based on variance analysis and 5439 genes were obtained for subsequent analysis.
Co-expression Network Construction
The “WGCNA” package (Langfelder and Horvath, 2008) in R software was used for the network construction. Samples which met the Z.K value < -2.5 were deemed as outlying and removed from the expression and trait data. The Pearson correlation coefficients were calculated for all gene comparisons. Then, a weighted network adjacency matrix was calculated based on aij = | cor (xi, xj)|β. Xi and xj are the nodes i and j of the network and β was determined using a scale-free topology criterion (Zhang and Horvath, 2005). The adjacency matrix was converted to a topological overlap matrix to identify gene modules, clusters of highly interconnected genes. A topological overlap measure (TOM) was used to determine the network interconnectedness. Gene modules were detected using the hierarchical clustering method based on a TOM-based dissimilarity measure (1-TOM) (Ravasz et al., 2002). The identification of branches of a hierarchical clustering dendrogram was conducted through the dynamic branch cut method (Langfelder et al., 2008).
Identification of Clinically Significant Modules and Functional Annotation
Modules from hierarchical clustering with a dense correlation with biological or clinical information were selected as the interesting modules for subsequent analysis. In this process, gene significance (GS), module significance (MS), and module eigengene (ME) were calculated. GS was defined as the minus log of a p-value and MS was the average gene significance across the module gene. ME was the first principal component of a given module. The significance between the ME and a clinical trait was also calculated, as modules with a high trait significance were associated with pathways and could be a candidate (Ghazalpour et al., 2006; Fuller et al., 2007). Gene ontology (GO) functional annotation and Kyoto Encyclopedia of Genes and Genomes (KEGG) pathway enrichment via the database for Annotation, Visualization, and Integrated Discovery (Dennis et al., 2003), were performed to further validate the selected modules by finding the underlying mechanism and biological pathways.
Identification and Validation of Hub Genes
The hub genes of an interesting module were determined through an absolute value of the geneModuleMembership > 0.9 and a geneTraitSignificance > 0.2 (Horvath and Dong, 2008). All genes from the selected interesting modules were then mapped into a protein–protein interaction (PPI) network using the Search Tool for the Retrieval of Interacting Genes database (Szklarczyk et al., 2015). The PPI network was visualized using Cytoscape (Shannon et al., 2003) and genes with more than 10 nodes were chosen for the determination of common components between the interesting module and the PPI network. The gene expression profile GSE57218 from cartilage samples was used to validate some hub genes within the yellow and brown modules through a one-way analysis of variance (p < 0.05).
Results
Data Preprocessing and Co-expression Network Construction
Based on variance analysis, the top 25% of genes (5439 genes) was obtained from GSE51588 with 50 samples. As shown in Figure 1, the GSM1248767 sample was outlying. In the current study, the soft-thresholding parameter was determined as β = 12 where the curve first reached Rˆ2 = 0.85, to construct a weighted network based on a scale-free topology criterion (Figure 2). As is shown in Figure 3, 19 modules were detected through the dynamic tree cutting method.
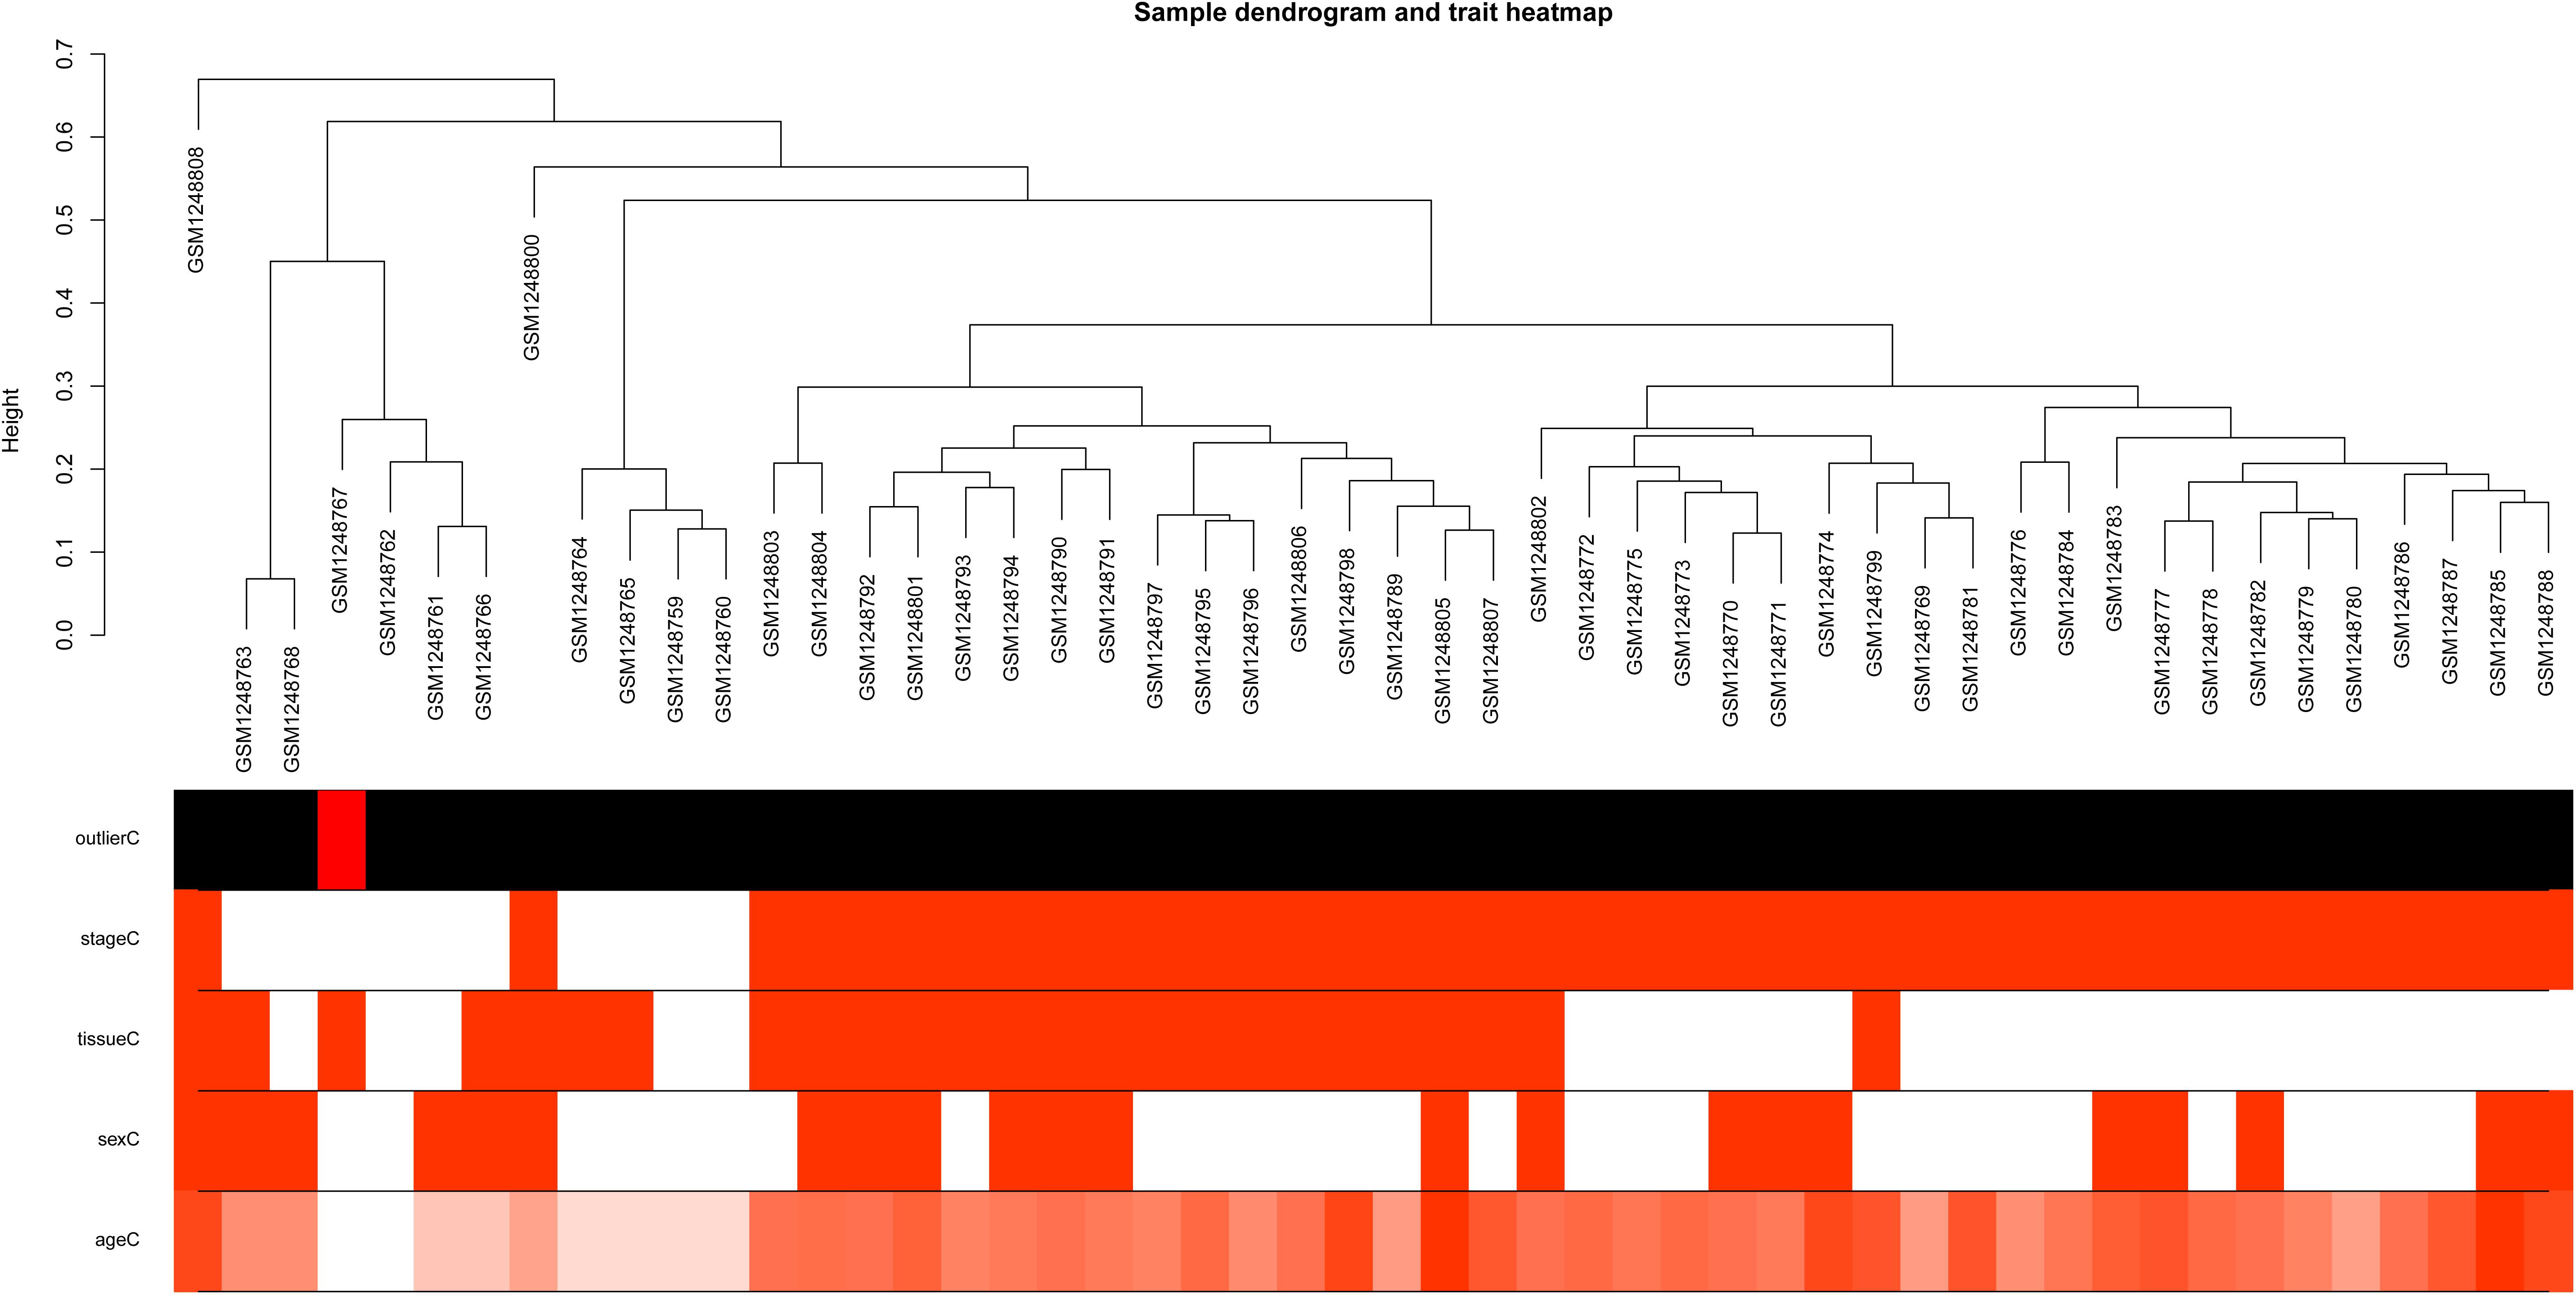
Figure 1. Sample dendrogram and trait heatmap. The leaves of the tree correspond to osteoarthritis (OA) samples and non-steoarthritis (non-OA) samples. The first color band underneath the tree indicates which arrays appear to be outlying. The second color band represents disease stages which indicate OA and non-OA (red indicates high values). The third color band represents tissue sources which indicate samples from knee lateral tibial (LT) and medial tibial (MT) (red indicates high values). Similarly, the remaining color-bands color-code the numeric values of physiologic traits.
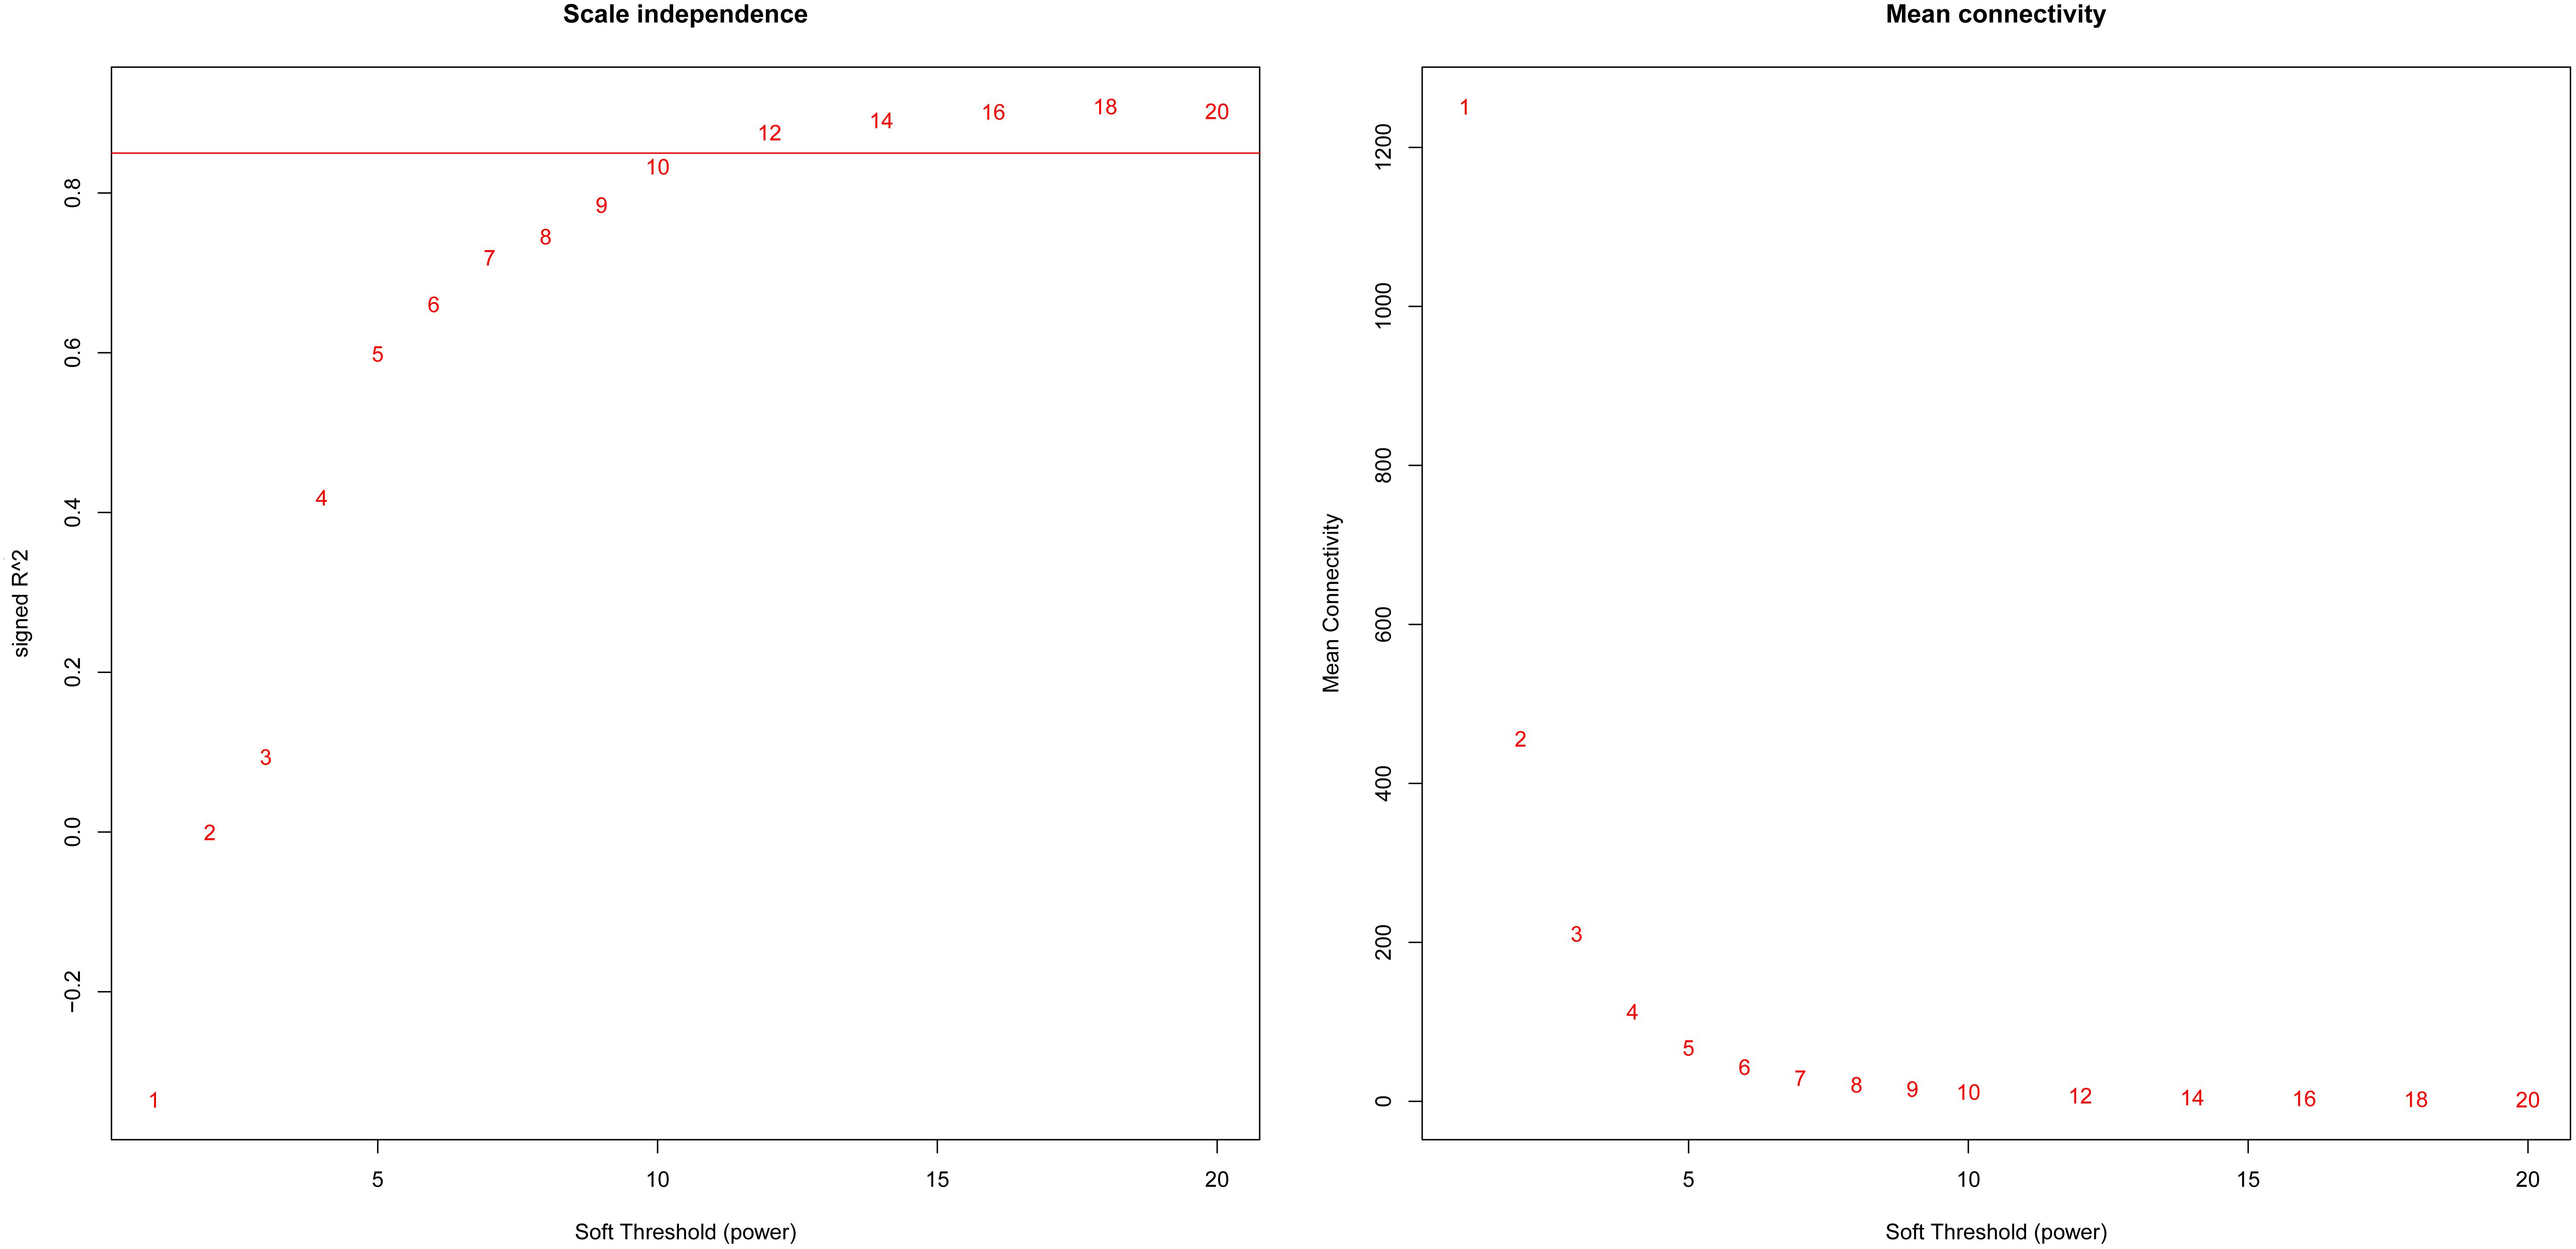
Figure 2. Analysis of network topology for various soft-theholding powers. The left panel shows the scale-free fit index, signed Rˆ2 (y-axis) and the soft threshold power (x-axis). β = 12 was chosen for subsequent analysis. The right panel shows the mean connectivity (y-axis) is a strictly decreasing function of the power β (x-axis).
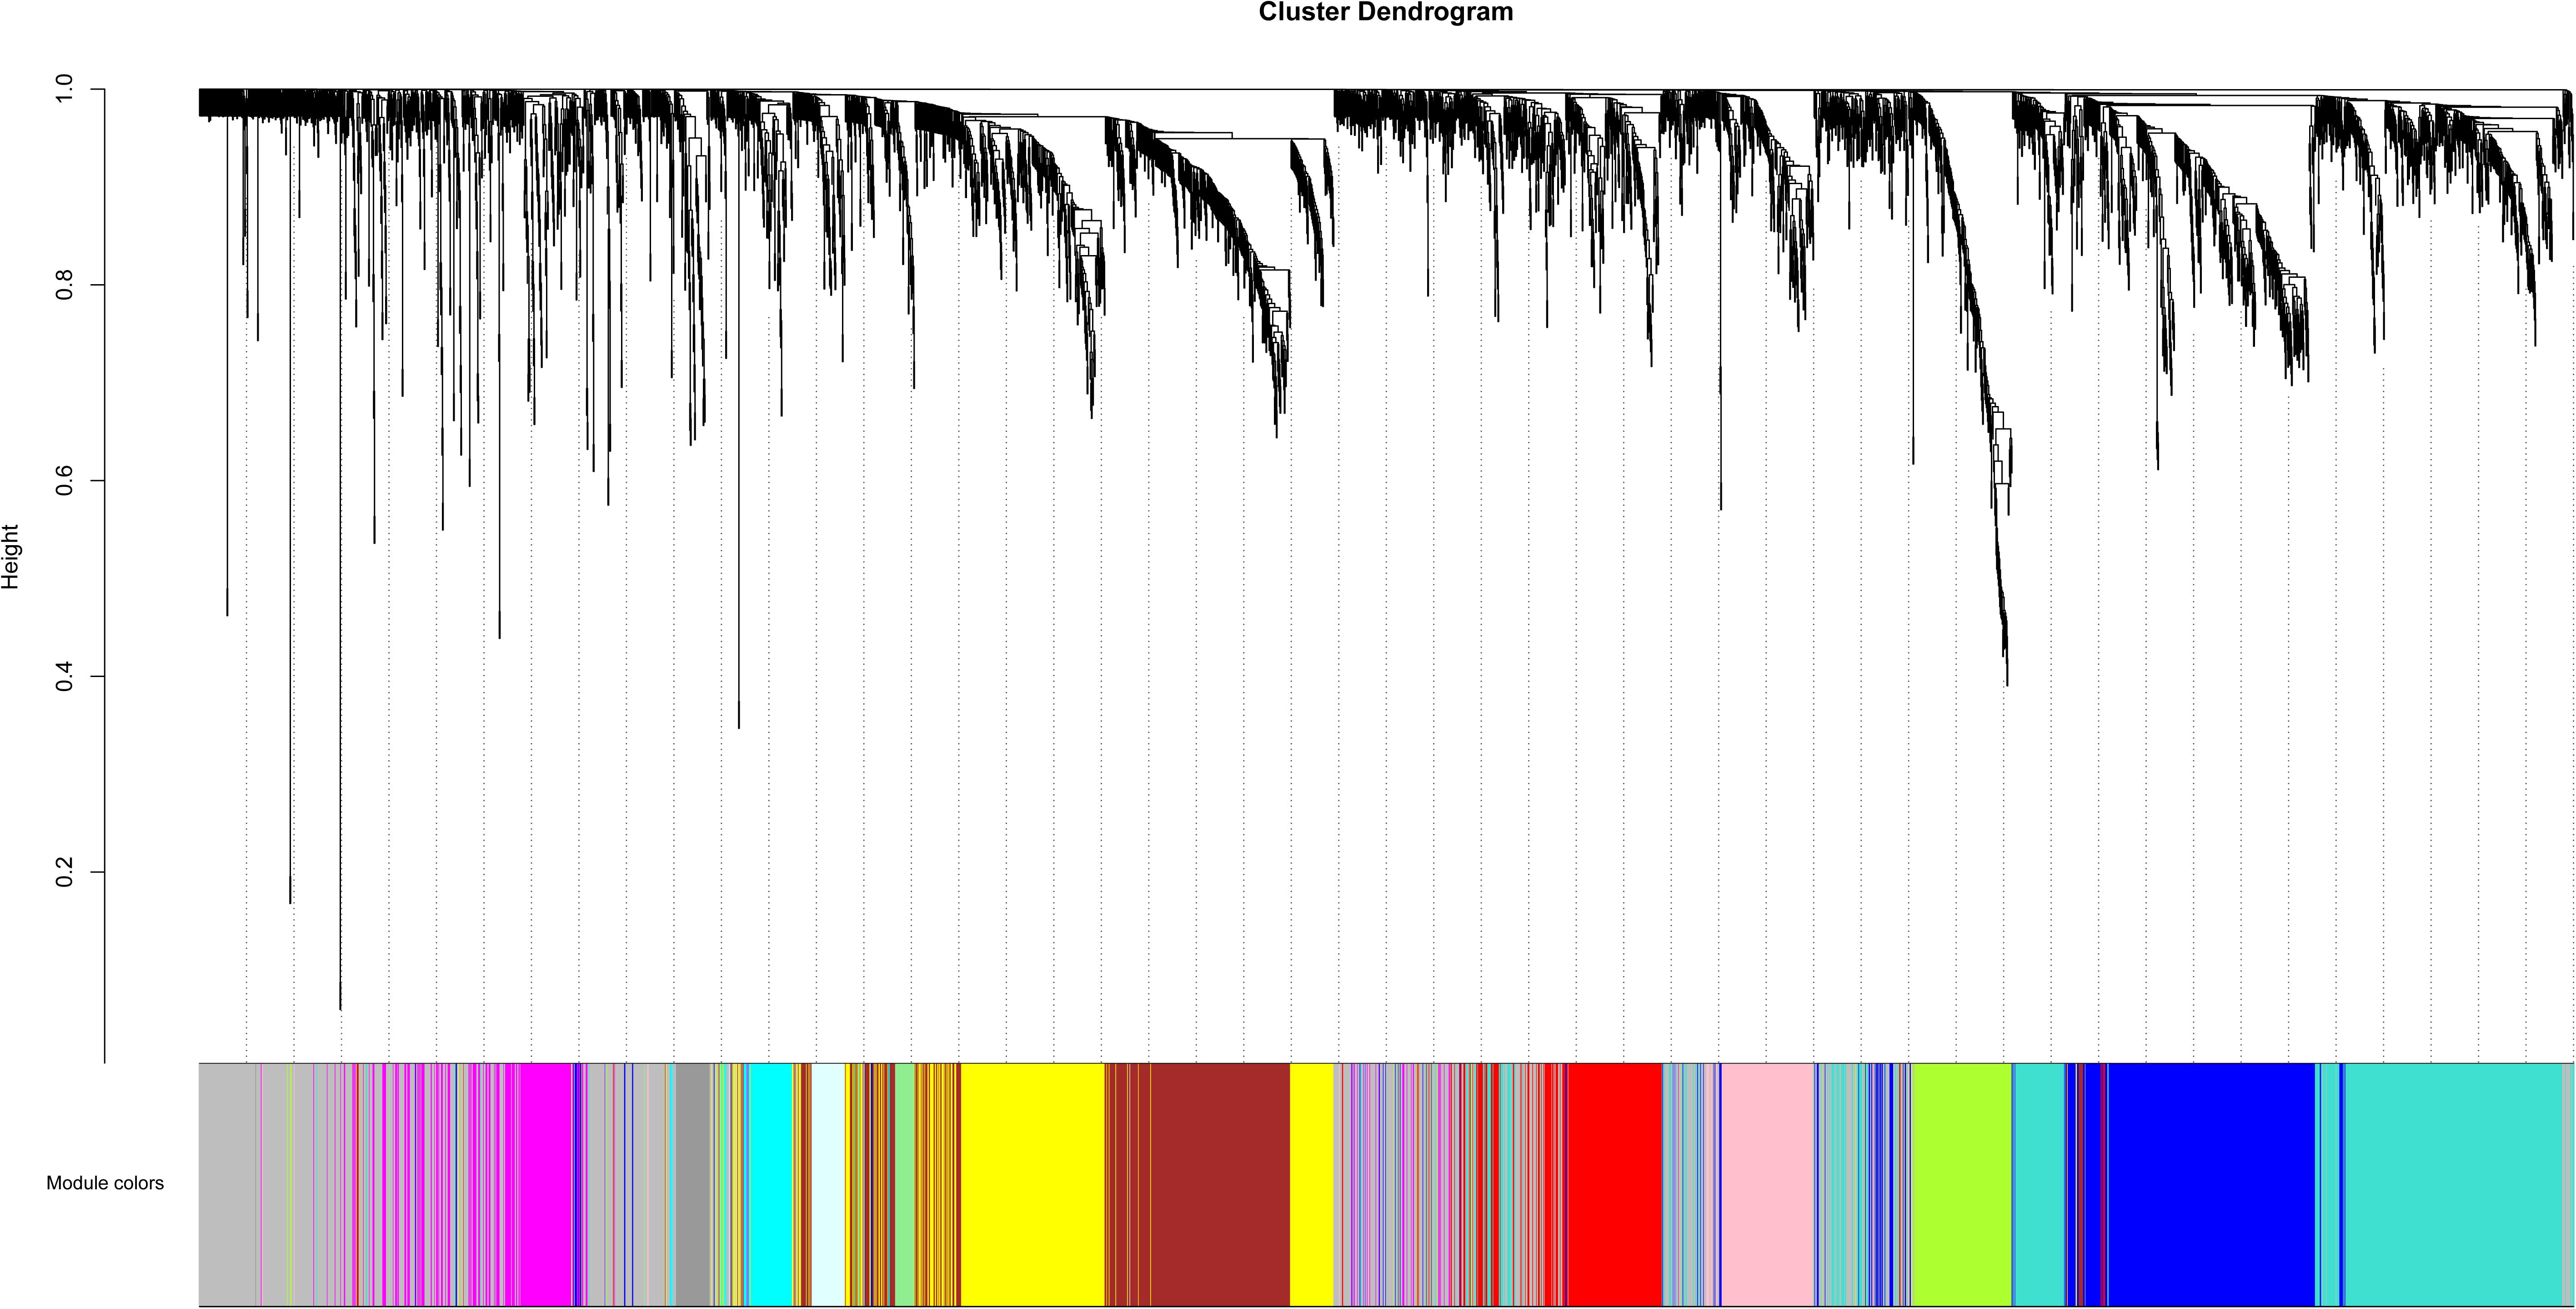
Figure 3. Clustering dendrogram of genes. The color bands provide a simple visual comparison of module assignments (branch cuttings) based on the dynamic tree cutting method.
Identification of Clinically Significant Modules and Functional Annotation
After relating modules to traits, high correlations were observed in the trait of stage (OA or non-OA) and tissue (lateral tibial plateau and medial tibial plateau) (Figure 4). In terms of the trait of stage, the highest correlation was observed in the yellow-stage module (r = 0.71, p = 1e-08). As for tissue, the brown tissue module had the highest correlation (r = 0.77, p = 1e-10). Genes in the yellow (cor = 0.5, p = 2.9e-27, Figure 5) and brown modules (cor = 0.75, p = 8.7e-76, Figure 6) were characterized with high gene significance and module membership, based on an intramodular analysis. Supplementary Table 1 demonstrates that the yellow module was enriched in a variety of components including proteinaceous extracellular matrix, collagen trimers, endoplasmic reticulum lumen, extracellular regions, collagen catabolic processes, and components involved in osteoblast differentiation, etc., based on GO analysis (p < 0.001). Supplementary Table 2 shows that the yellow module included genes involved in protein digestion and absorption, axon guidance, ECM-receptor interaction, and the PI3K-Akt signaling pathway, etc. based on KEGG pathway analysis (p < 0.05). The brown module was enriched in components involved in extracellular space, extracellular region, extracellular matrix, cell adhesion, and brown fat cell differentiation, etc. (p < 0.001, Supplementary Table 3). In addition, the brown module contained components involved in tyrosine metabolism, drug metabolism (cytochrome P450), ECM-receptor interaction, and the regulation of lipolysis in adipocytes, etc. (p < 0.01, Supplementary Table 4). Finally, the yellow module, with 409 genes, and the brown module with 413 genes were deemed as clinically significant modules with associations with OA development.
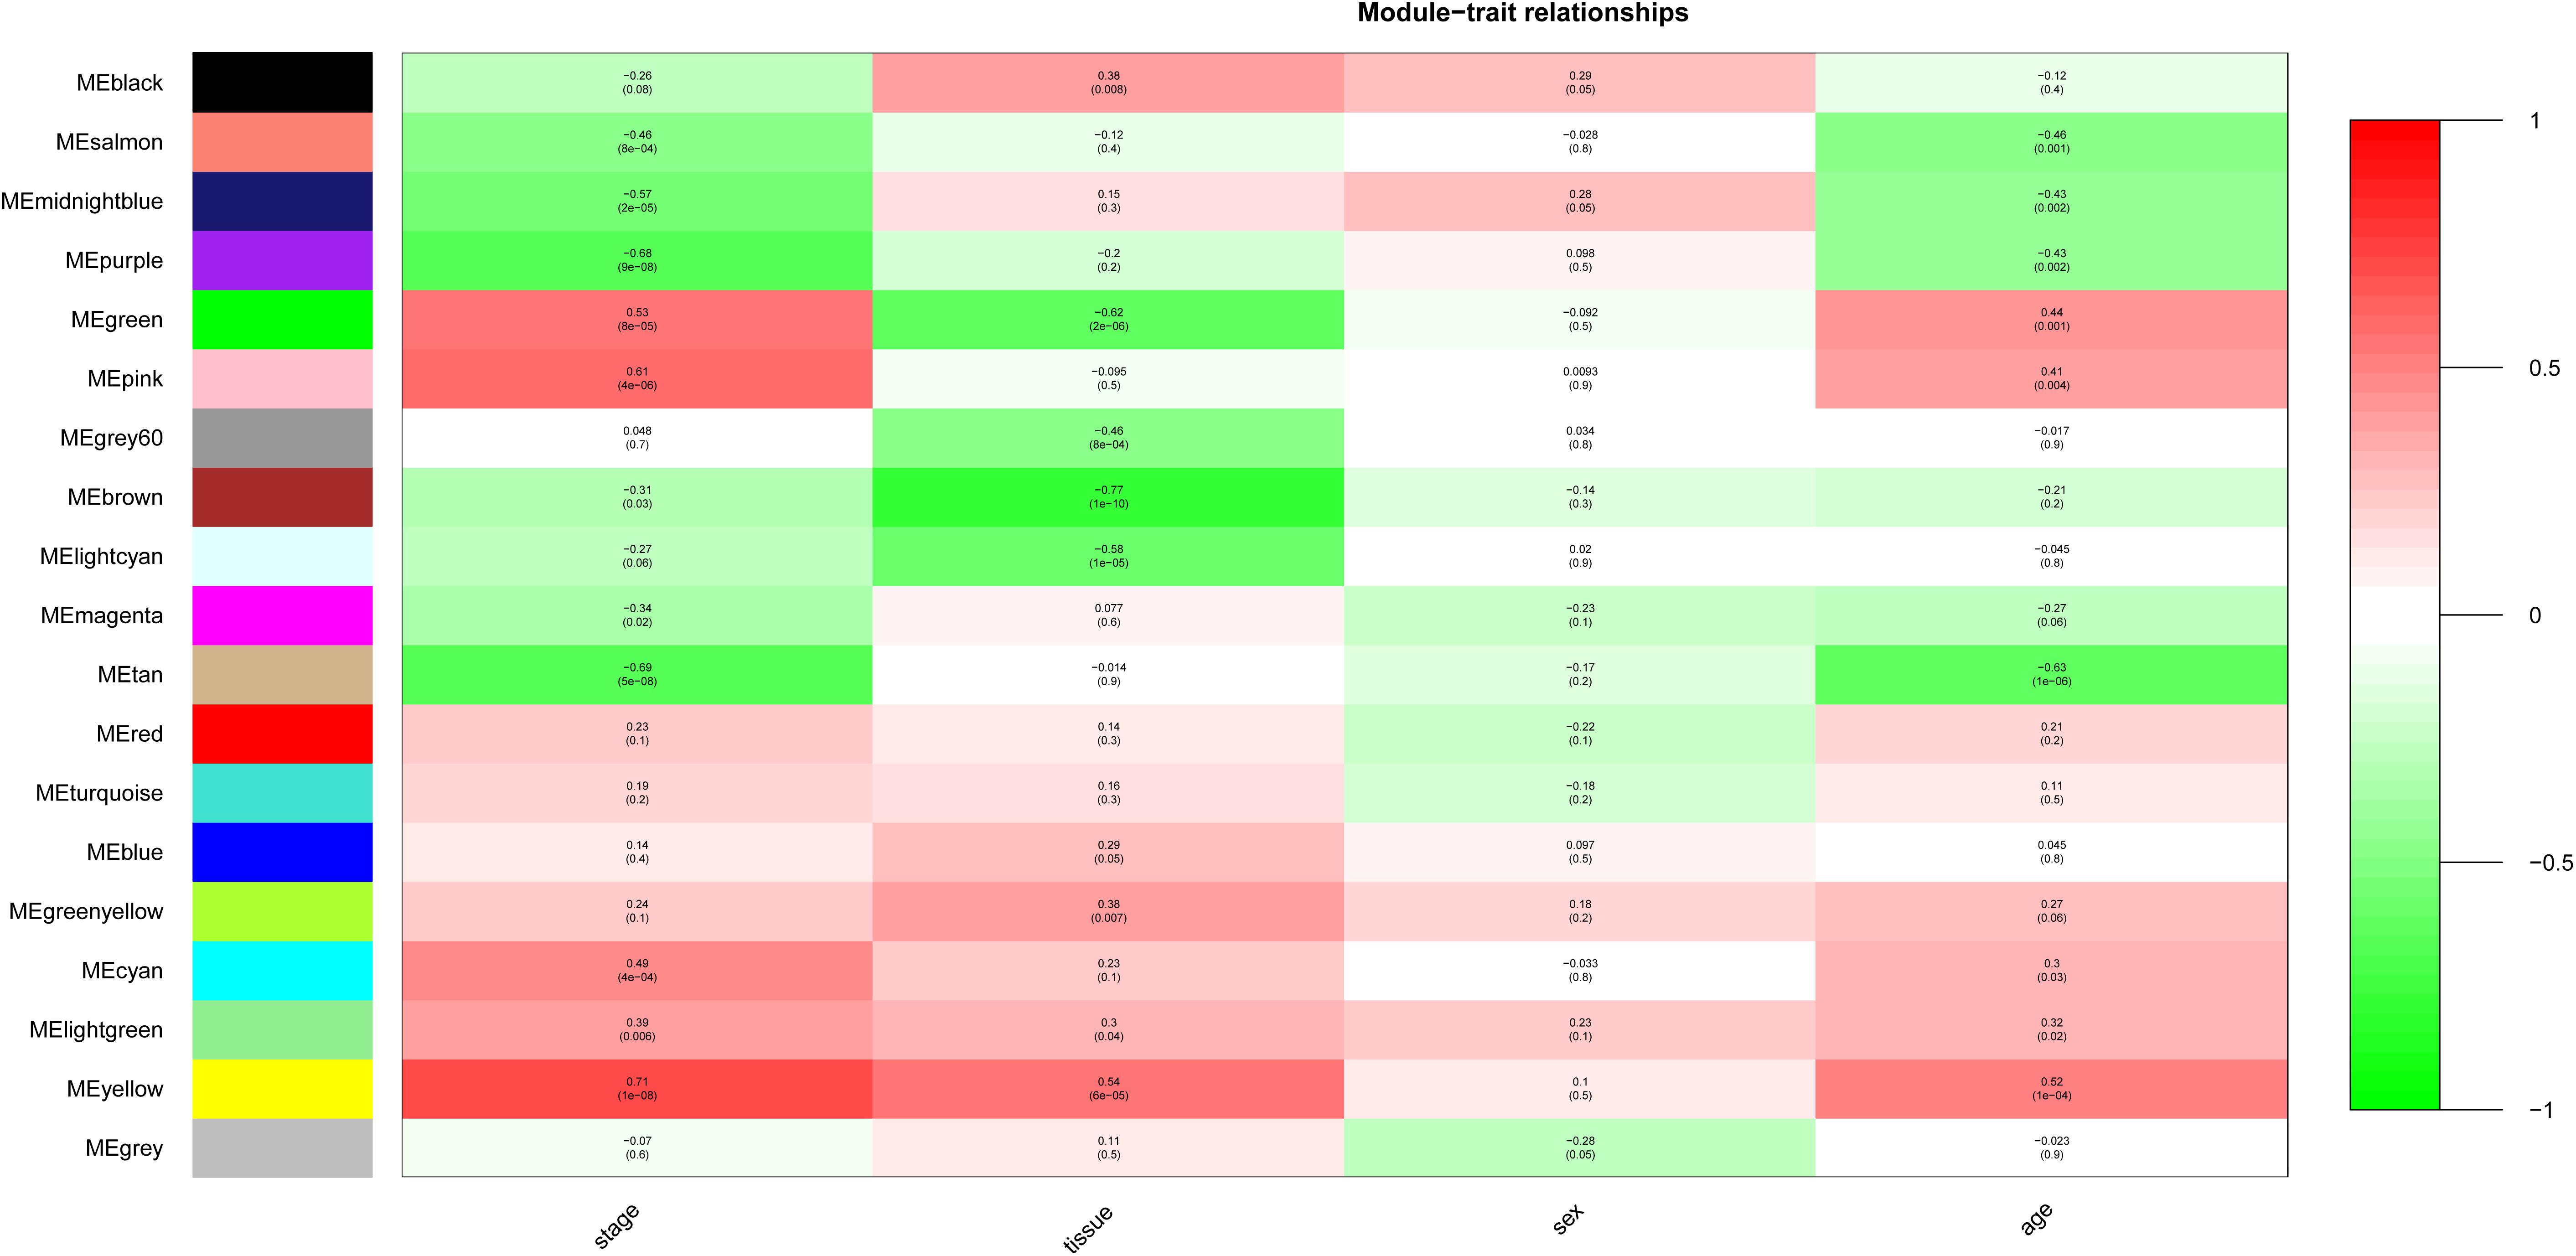
Figure 4. Module-trait relationships. Stage indicates OA and non-OA; tissue indicates samples from LT and MT.
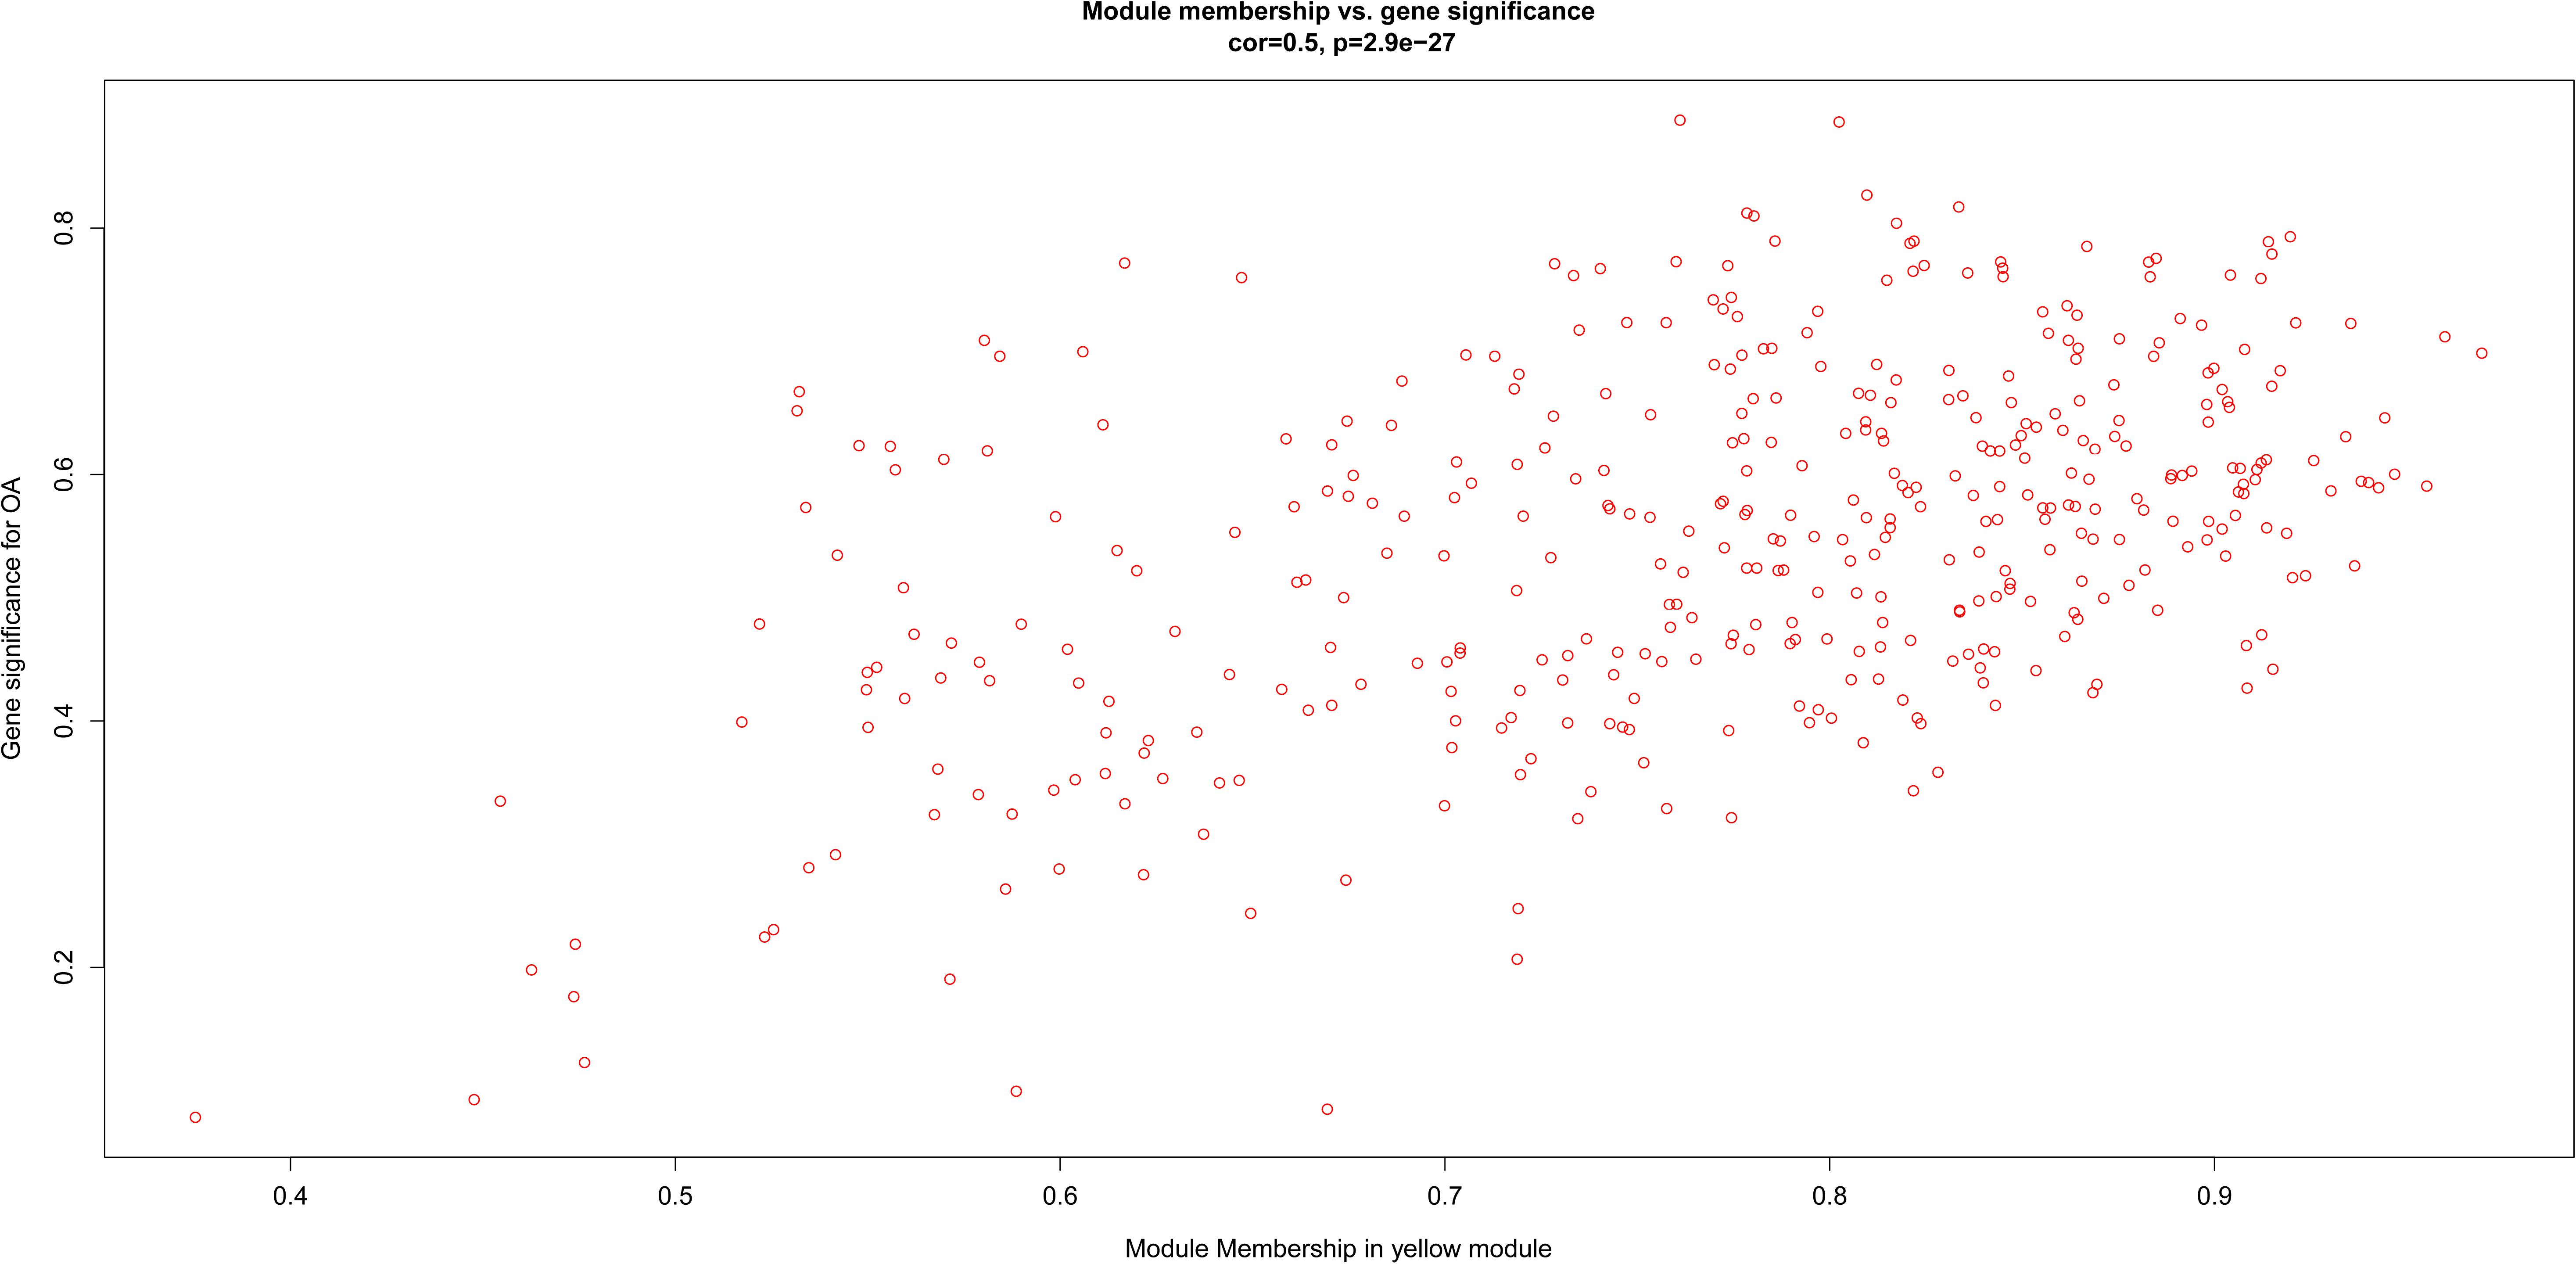
Figure 5. Scatter diagram for module membership vs. gene significance of stage (OA or non-OA) in yellow module.
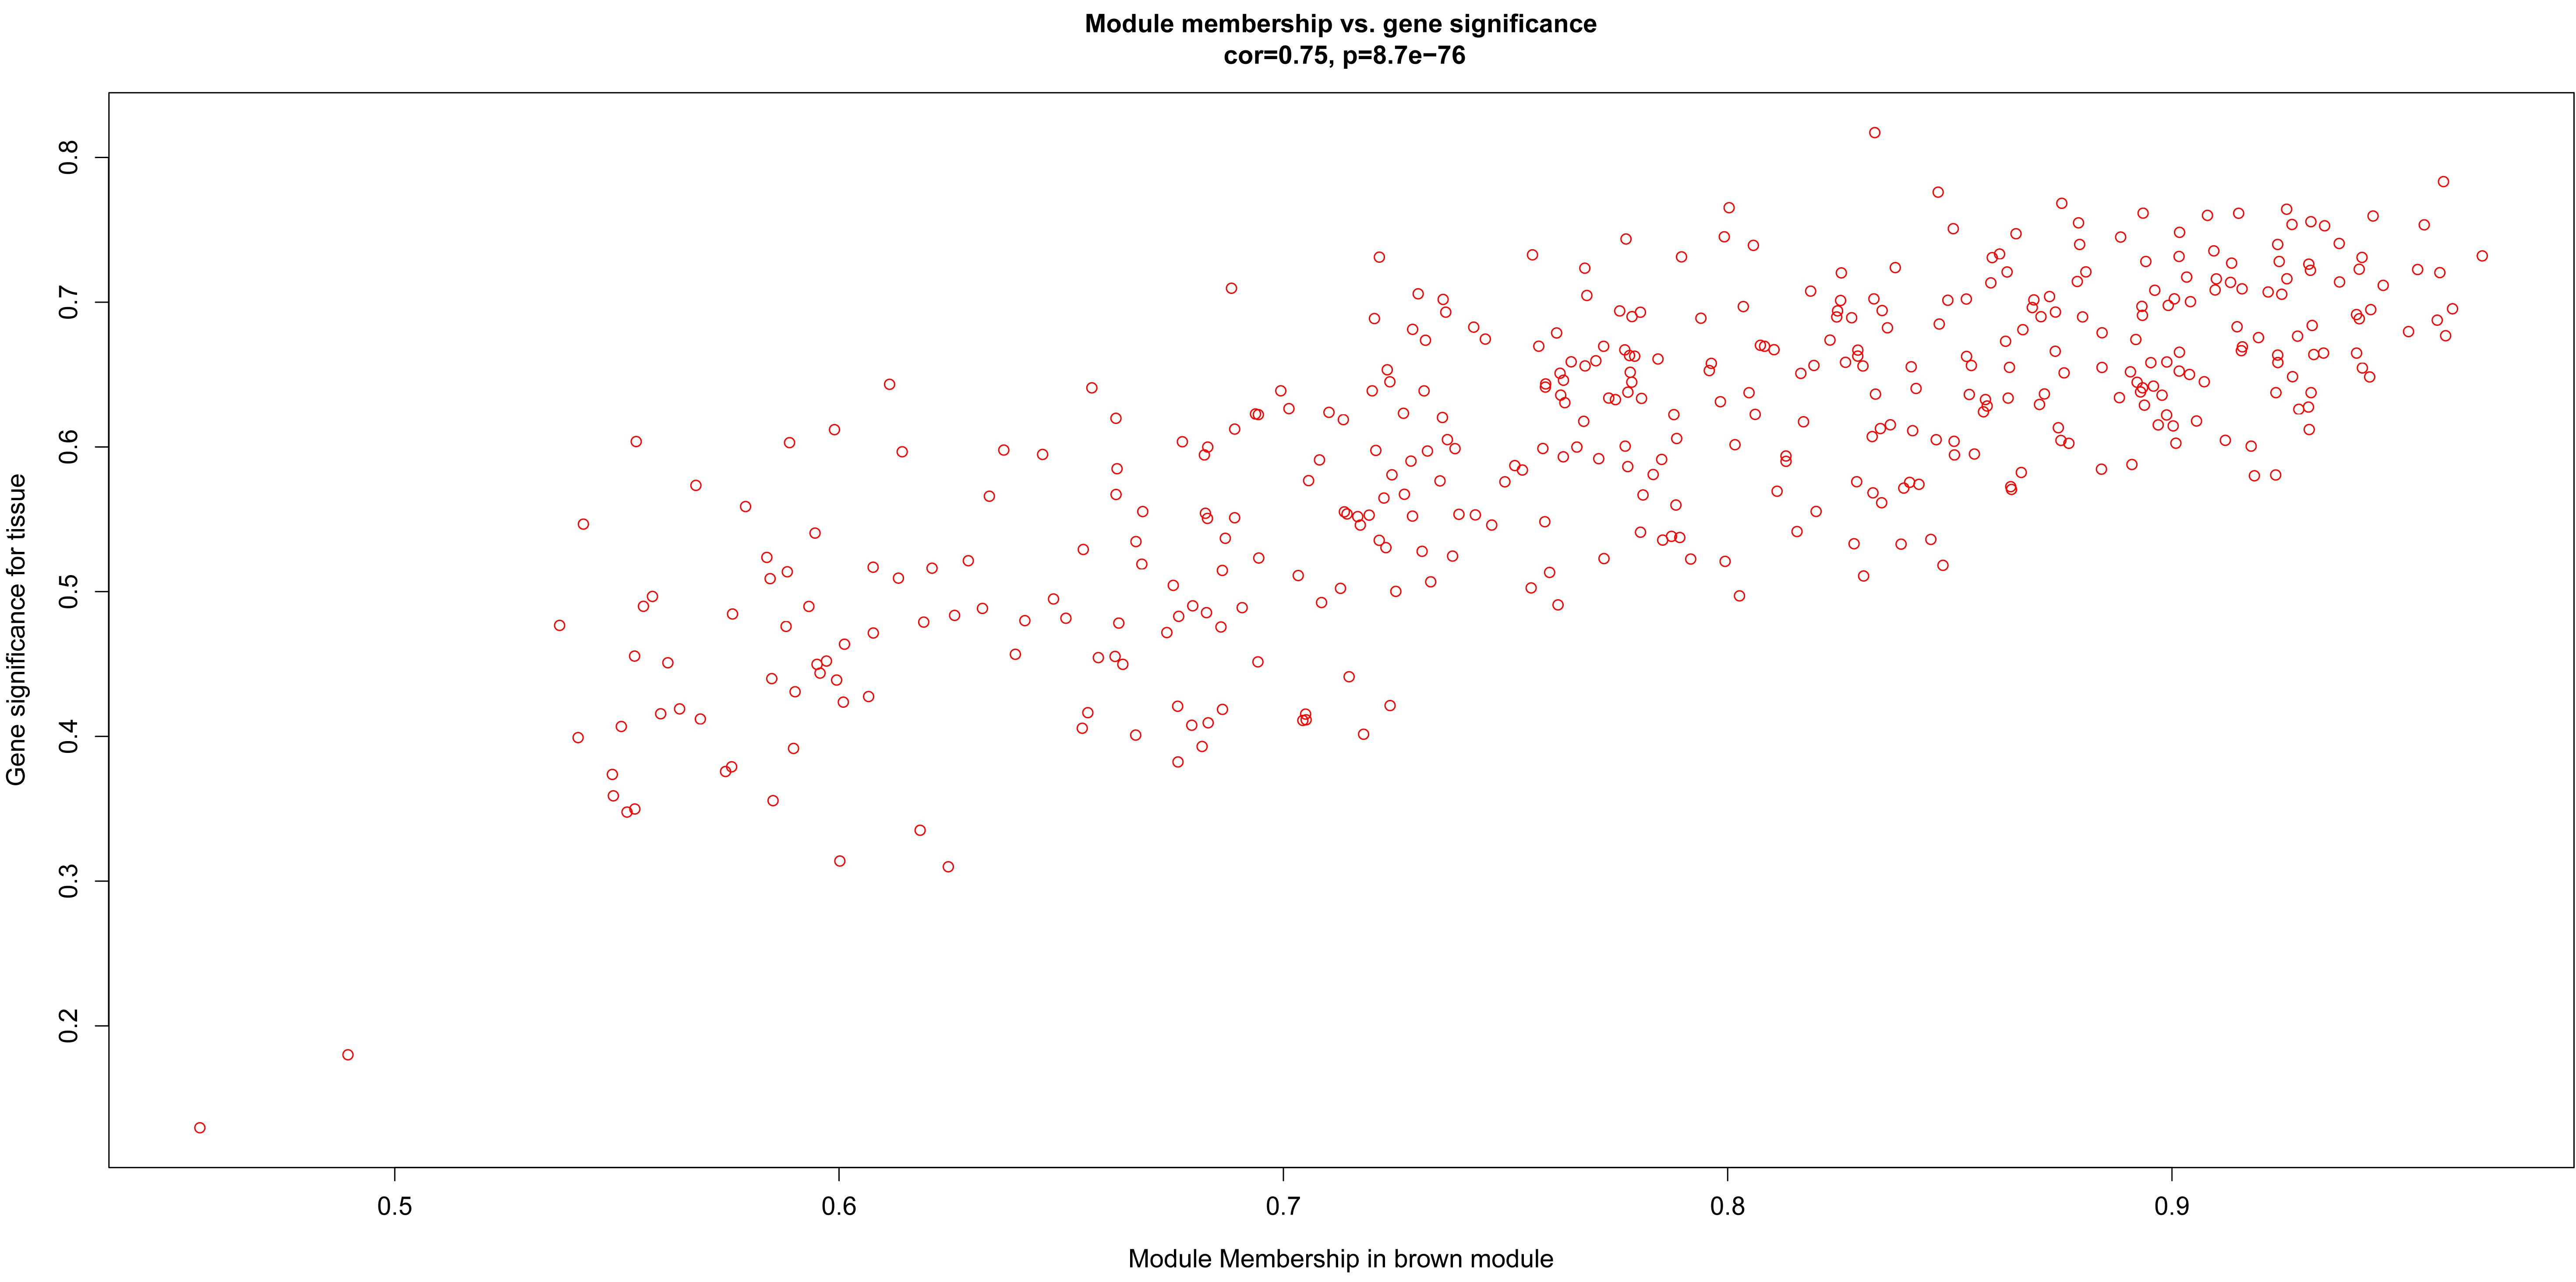
Figure 6. Scatter diagram for module membership vs. gene significance of tissue (LT or MT) in brown module.
Identification and Validation of Hub Genes
Based on an absolute value of the geneModuleMembership > 0.9 and geneTraitSignificance > 0.2, 45 hub genes and 72 hub genes were selected from the yellow module and brown module, respectively (Tables 1, 2). These hub genes were mapped into the PPI network. As shown in Table 1 and Supplementary Figure 1, five common genes (COL24A1, COL5A2, COL3A1, MMP2, and COL6A1) were observed in the yellow module and PPI network associated with OA stage. Eight common genes (LIPE, LPL, LEP, SLC2A4, FABP4, ADH1B, ALDH4A1, and ADIPOQ) were observed in the brown module and PPI network associated with OA tissue (Table 2 and Supplementary Figure 2). The results of the validation of the hub genes from the yellow and brown modules are displayed in Supplementary Table 5.
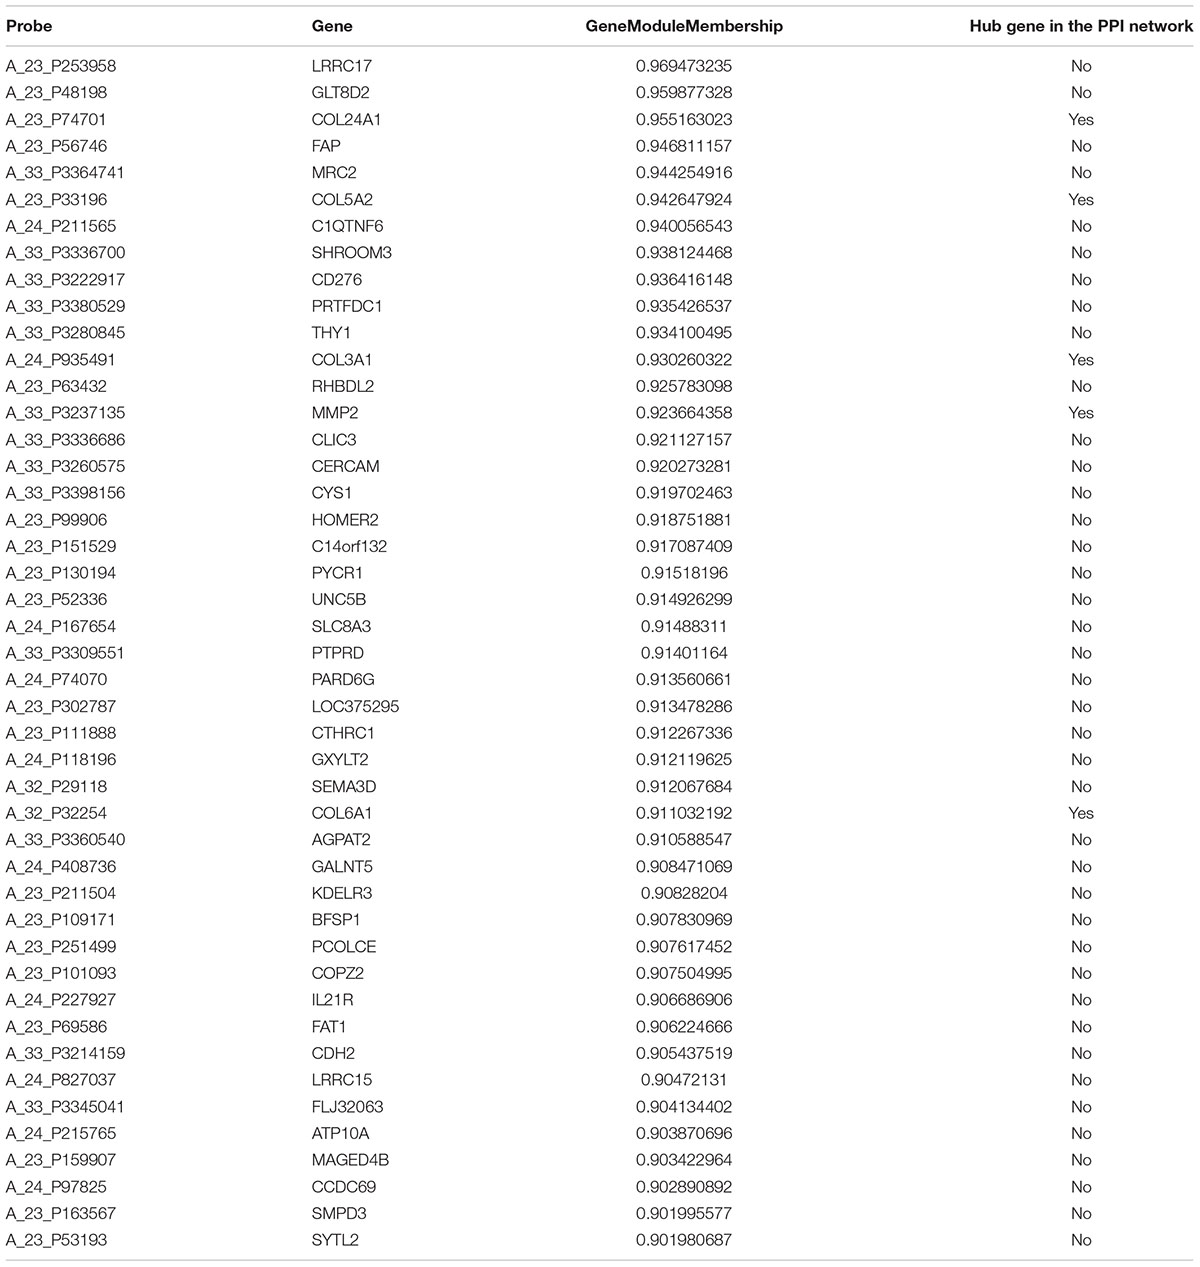
Table 1. Hub genes from the yellow module.
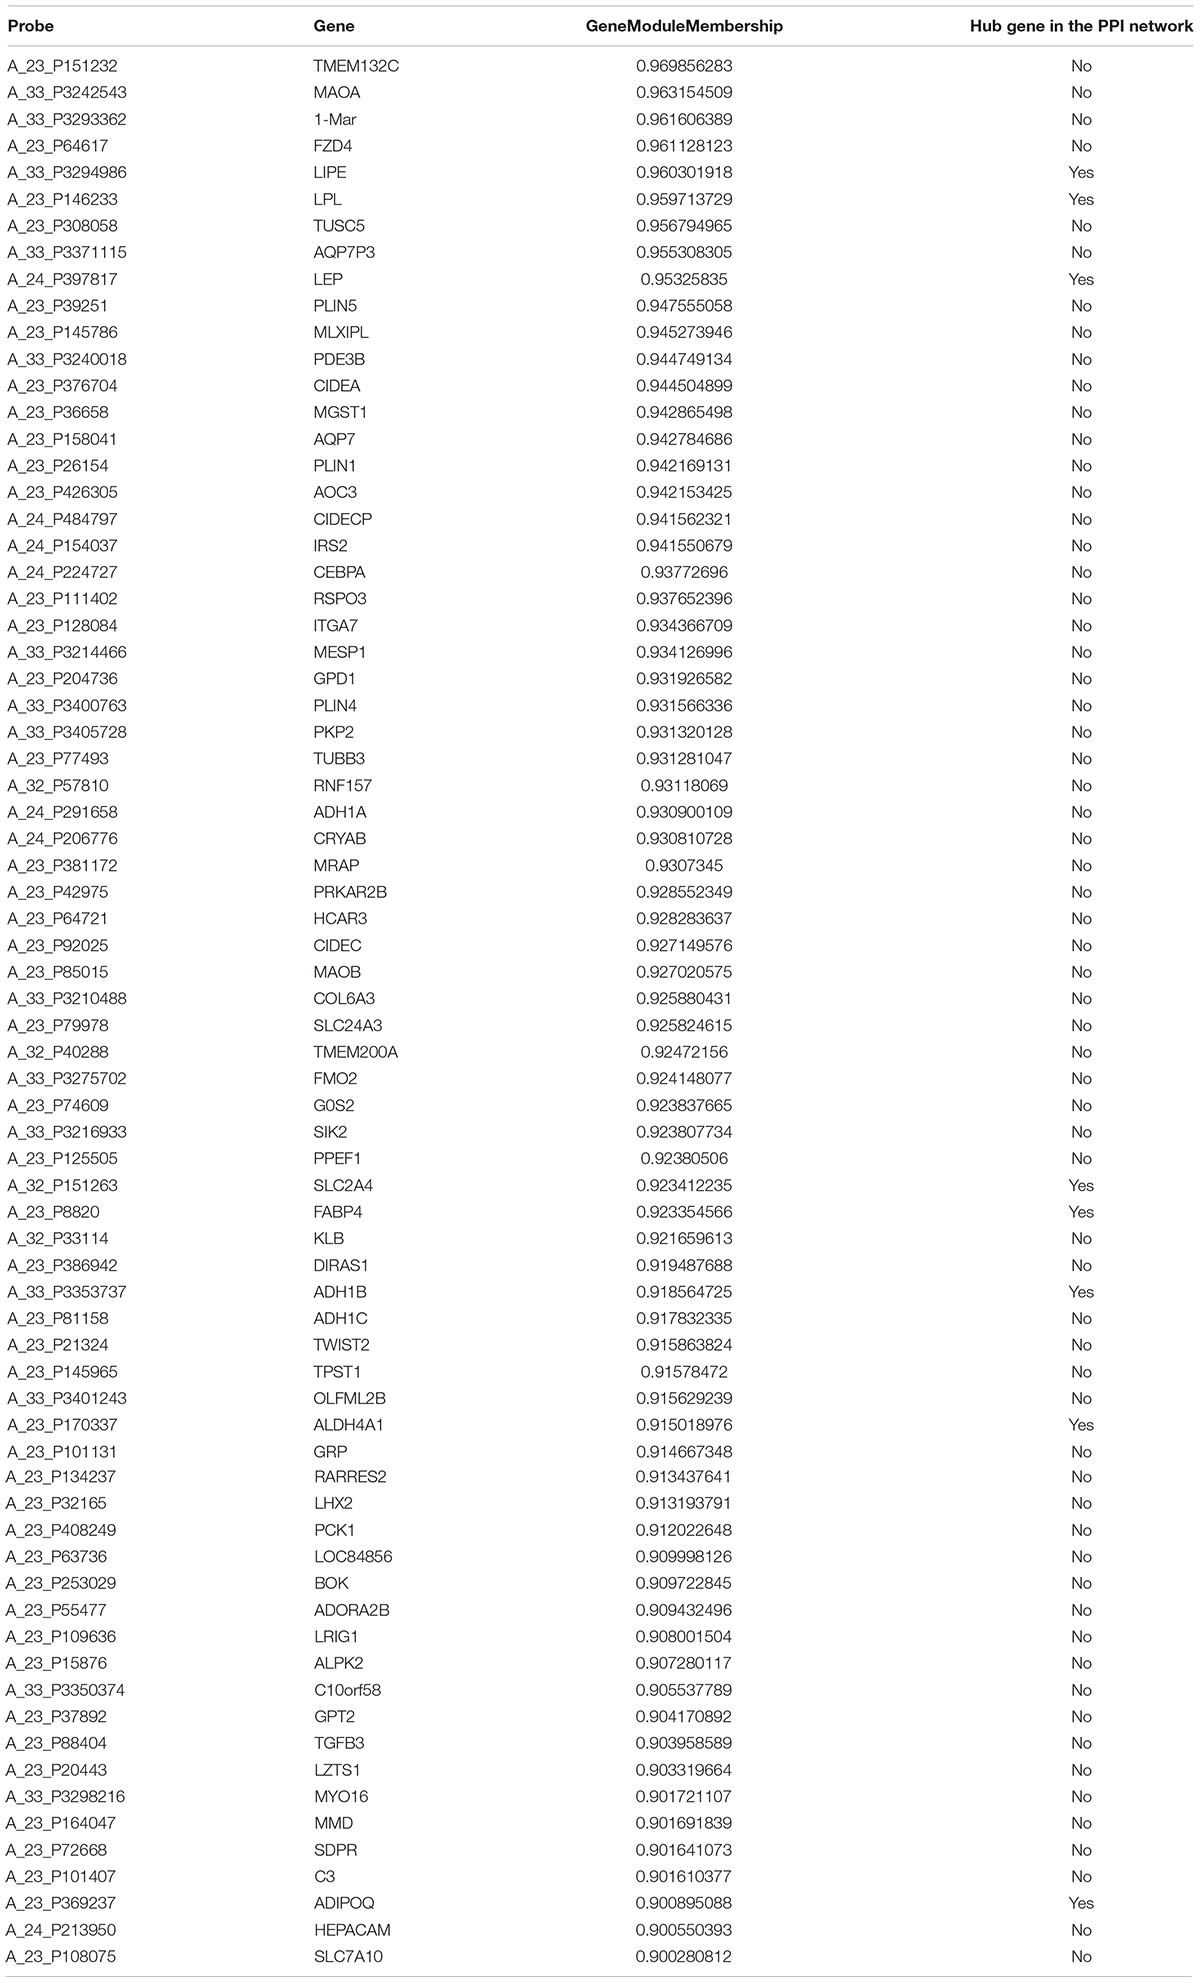
Table 2. Hub genes from the brown module.
Discussion
Because of the high rates of disability, low quality of life, major pain and the resulting huge economic burden caused by OA (Neogi and Zhang, 2013), a thorough study of OA, including risk factors, pathological processes, clinical manifestation, diagnosis, treatment, and prevention is particularly essential. In the current study, the WGCNA algorithm (Langfelder and Horvath, 2008) was adopted to explore OA biomarkers and pathological processes in samples of subchondral bone from OA and non-OA subjects.
After data set preprocessing, weighted gene network construction, and module identification, relating modules to traits and functional enrichment, we found that both the yellow and brown modules were associated with the occurrence of OA. Specifically, the yellow module with 45 hub genes played a key role in proteinaceous extracellular matrix, collagen trimers, and collagen catabolic processes, etc. and was highly associated with the formation of extracellular matrix and the development of the skeletal system. Extracellular matrix and collagen secreted by mesenchymal cells in subchondral bone (Matyas et al., 1997) are important components of cartilage and protect the articular surface from destruction in the early stage of OA (Sanchez et al., 2005). In addition, collagen is also a major component of bone. Therefore, collagen dysfunction could lead to bone and joint disease including OA.COL24A1, COL5A2, COL3A1, COL6A1 are members of the collagen gene family. COL24A1 was reported to play an important role in osteoblast differentiation and bone formation (Matsuo et al., 2008) through theTGF-β/Smads signaling pathway (Wang et al., 2012). To the best of our knowledge, COL5A2 has been associated with ischemic heart disease (Azuaje et al., 2013) and the development of cancers, such as bladder cancer (Li et al., 2017), glioblastoma (Vastrad et al., 2017), and gastric cancer (Cao et al., 2018), with no evidence for an association with OA. A similar role has been reported for COL3A1 (Yuan et al., 2017). COL6A1 was demonstrated as a hub gene in OA in a recent study (Guo et al., 2018). In the current study, the yellow module contained components involved in protein digestion and absorption, axon guidance, ECM-receptor interaction and the PI3K-Akt signaling pathway. The aforementioned four hub genes also identified in the PPI network could be regarded as real hub genes associated with OA through the ECM-receptor interaction and interaction with the PI3K-Akt signaling pathway.
MMP2, a common component of the yellow and PPI network encodes matrix metallopeptidase 2, which is released by inflammatory cells, contributing to the initiation and progression of OA (Alunno et al., 2017). Inflammation could directly affect synovial cells and chondrocytes through cytokines which would interfere with the repair of cartilage in OA patients.
To identify the difference between early-stage (lateral tibia) and end-stage (medial tibia) OA, we related the modules to tissue traits and the brown module with 72 hub genes was found to contain genes involved in extracellular processes and lipid metabolism. The GO analysis of the brown module demonstrated enrichment in components involved in the extracellular space, region and matrix, further demonstrating that the destruction of the extracellular matrix leads to the progression of OA. LIPE, LPL, LEP, SLC2A4, FABP4, ADH1B, ALDH4A1, and ADIPOQ are all involved in energy metabolism in subchondral bone cells. It was speculated that end-stage OA was associated with lower energy metabolism, compared with early-stage OA. Therefore, drugs to improve lipid metabolism could prevent OA progression.
The results of the validation demonstrated that COL5A2, COL3A1, and COL6A1 at the core of the yellow module and PPI network were associated with OA in samples collected from cartilage and subchondral bone. Other hub genes validated in the yellow module, including FAP, CD276, PRTFDC1, THY1, RHBDL2, CLIC3, CERCAM, CYS1, and HOMER2 had significant differences between OA and non-OA subjects and CD276 has been reported as a biomarker for OA in a previous study (Mobasheri and Henrotin, 2015). In the brown module, significant validation results were observed for FZD4, TUSC5, PDE3B, LIPE, LEP and SLC2A4 genes, of which, LIPE, LEP, and SLC2A4 were at the core of the module and PPI network. Although several hub genes did not demonstrate significant results in the GSE57218 validation, it is noted that these hub genes are still potentially associated with OA, because GSE57218 was obtained using cartilage samples rather than subchondral bone.
There are several highlights in the current study. Firstly, previous studies explored OA pathological processes and biomarkers using cartilage samples. Currently, few studies have focused on subchondral bone. An expression profile of subchondral bone could contribute to a comprehensive understanding of OA and provide more evidence to elucidate the initiation site of OA (bone or cartilage). Secondly, WGCNA has a particular advantage in processing gene expression datasets and the results of this study not only confirmed the findings of previous studies, but also provided new biomarkers for the further study of OA. However, the current study also possesses several limitations. Cartilage samples were used in the validation of hub genes in this study. These hub genes remain to be validated using subchondral bone samples in further studies.
Conclusion
In the current study, we applied the WGCNA algorithm to process gene expression datasets and devised a yellow module with 45 hub genes and a brown module with 72 hub genes associated with OA. Compared with early-stage OA, the brown module revealed that the subchondral bone cells of end-stage OA had lower lipid metabolism. Drugs designed to target these hub genes could prevent the progression of OA.
Author Contributions
H-YG, R-XW, CZ, and MY conceived and designed the study. R-XW, H-YG, L-LL, and YL performed the analysis procedures. JG, R-XW, L-LL, CZ, and YL analyzed the results. YL, L-LL, MY, and JG contributed to analysis tools. R-XW, H-YG, and CZ contributed to the writing of the manuscript. All authors reviewed the manuscript.
Conflict of Interest Statement
The authors declare that the research was conducted in the absence of any commercial or financial relationships that could be construed as a potential conflict of interest.
Supplementary Material
The Supplementary Material for this article can be found online at: https://www.frontiersin.org/articles/10.3389/fphys.2019.00275/full#supplementary-material
Footnotes
References
Alunno, A., Falcinelli, E., Luccioli, F., Petito, E., Bartoloni, E., Momi, S., et al. (2017). Platelets contribute to the accumulation of matrix metalloproteinase type 2 in synovial fluid in osteoarthritis. Thrombosis Haemostasis 117, 2116–2124. doi: 10.1160/TH17-06-0379
Azuaje, F., Zhang, L., Jeanty, C., Puhl, S. L., Rodius, S., and Wagner, D. R. (2013). Analysis of a gene co-expression network establishes robust association between Col5a2 and ischemic heart disease. BMC Med. Genom. 6:13. doi: 10.1186/1755-8794-6-13
Burr, D. B., and Gallant, M. A. (2012). Bone remodelling in osteoarthritis. Nat. Rev. Rheumatol. 8, 665–673. doi: 10.1038/nrrheum.2012.130
Cao, L., Chen, Y., Zhang, M., Xu, D. Q., Liu, Y., Liu, T., et al. (2018). Identification of hub genes and potential molecular mechanisms in gastric cancer by integrated bioinformatics analysis. PeerJ 6:e5180. doi: 10.7717/peerj.5180
Centers for Disease Control and Prevention [Cdc]. (2009). Prevalence and most common causes of disability among adults–United States, 2005. MMWR Morb. Mortal. Wkly. Rep. 58, 421–426.
Chou, C. H., Wu, C. C., Song, I. W., Chuang, H. P., Lu, L. S., Chang, J. H., et al. (2013). Genome-wide expression profiles of subchondral bone in osteoarthritis. Arthritis Res. Ther. 15:R190. doi: 10.1186/ar4380
Chu, C. R., Millis, M. B., and Olson, S. A. (2014). Osteoarthritis: from palliation to prevention: aoa critical issues. J. Bone Joint Surg. Am. 96:e130. doi: 10.2106/JBJS.M.01209
Dennis, G. Jr., Sherman, B. T., Hosack, D. A., Yang, J., Gao, W., Lane, H. C., et al. (2003). DAVID: database for annotation, visualization, and integrated discovery. Genome Biol. 4:3. doi: 10.1186/gb-2003-4-5-p3
Farber, C. R. (2010). Identification of a gene module associated with BMD through the integration of network analysis and genome-wide association data. J. Bone Miner. Res. 25, 2359–2367. doi: 10.1002/jbmr.138
Fuller, T. F., Ghazalpour, A., Aten, J. E., Drake, T. A., Lusis, A. J., and Horvath, S. (2007). Weighted gene coexpression network analysis strategies applied to mouse weight. Mamm. Genome 18, 463–472. doi: 10.1007/s00335-007-9043-3
Ghazalpour, A., Doss, S., Zhang, B., Wang, S., Plaisier, C., Castellanos, R., et al. (2006). Integrating genetic and network analysis to characterize genes related to mouse weight. PLoS Genetics 2:e130. doi: 10.1371/journal.pgen.0020130
Guo, S. M., Wang, J. X., Li, J., Xu, F. Y., Wei, Q., Wang, H. M., et al. (2018). Identification of gene expression profiles and key genes in subchondral bone of osteoarthritis using weighted gene coexpression network analysis. J. Cell. Biochem. 119, 7687–7695. doi: 10.1002/jcb.27118
Horvath, S., and Dong, J. (2008). Geometric interpretation of gene coexpression network analysis. PLoS Comput. Biol. 4:e1000117. doi: 10.1371/journal.pcbi.1000117
Horvath, S., Zhang, B., Carlson, M., Lu, K. V., Zhu, S., Felciano, R. M., et al. (2006). Analysis of oncogenic signaling networks in glioblastoma identifies ASPM as a molecular target. Proc. Natl. Acad. Sci. U.S.A. 103, 17402–17407. doi: 10.1073/pnas.0608396103
Keller, M. P., Choi, Y., Wang, P., Davis, D. B., Rabaglia, M. E., Oler, A. T., et al. (2008). A gene expression network model of type 2 diabetes links cell cycle regulation in islets with diabetes susceptibility. Genome Res. 18, 706–716. doi: 10.1101/gr.074914.107
Langfelder, P., and Horvath, S. (2008). WGCNA: an R package for weighted correlation network analysis. BMC Bioinformatics 9:559. doi: 10.1186/1471-2105-9-559
Langfelder, P., Zhang, B., and Horvath, S. (2008). Defining clusters from a hierarchical cluster tree: the dynamic tree cut package for R. Bioinformatics 24, 719–720. doi: 10.1093/bioinformatics/btm563
Li, S., Liu, X., Liu, T., Meng, X., Yin, X., Fang, C., et al. (2017). Identification of biomarkers correlated with the TNM Staging and overall survival of patients with bladder cancer. Front. Physiol. 8:947. doi: 10.3389/fphys.2017.00947
Matsuo, N., Tanaka, S., Yoshioka, H., Koch, M., Gordon, M. K., and Ramirez, F. (2008). Collagen XXIV (Col24a1) gene expression is a specific marker of osteoblast differentiation and bone formation. Connect. Tissue Res. 49, 68–75. doi: 10.1080/03008200801913502
Matyas, J. R., Sandell, L. J., and Adams, M. E. (1997). Gene expression of type II collagens in chondro-osteophytes in experimental osteoarthritis. Osteoarthr. Cartil. 5, 99–105. doi: 10.1016/S1063-4584(97)80003-9
Mobasheri, A., and Henrotin, Y. (2015). Biomarkers of (osteo)arthritis. Biomarkers 20, 513–518. doi: 10.3109/1354750X.2016.1140930
Murphy, L., and Helmick, C. G. (2012). The impact of osteoarthritis in the United States: a population-health perspective: a population-based review of the fourth most common cause of hospitalization in U.S. adults. Orthopedic Nurs. 31, 85–91. doi: 10.1097/NOR.0b013e31824fcd42
Neogi, T., and Zhang, Y. (2013). Epidemiology of osteoarthritis. Rheum. Dis. Clin. North Am. 39, 1–19. doi: 10.1016/j.rdc.2012.10.004
Picavet, H. S., and Hazes, J. M. (2003). Prevalence of self reported musculoskeletal diseases is high. Ann. Rheum. Dis. 62, 644–650. doi: 10.1136/ard.62.7.644
Ravasz, E., Somera, A. L., Mongru, D. A., Oltvai, Z. N., and Barabasi, A. L. (2002). Hierarchical organization of modularity in metabolic networks. Science 297, 1551–1555. doi: 10.1126/science.1073374
Ryd, L., Brittberg, M., Eriksson, K., Jurvelin, J. S., Lindahl, A., Marlovits, S., et al. (2015). Pre-osteoarthritis: definition and diagnosis of an elusive clinical entity. Cartilage 6, 156–165. doi: 10.1177/1947603515586048
Sanchez, C., Deberg, M. A., Piccardi, N., Msika, P., Reginster, J. Y., and Henrotin, Y. E. (2005). Subchondral bone osteoblasts induce phenotypic changes in human osteoarthritic chondrocytes. Osteoarthr. Cartilage 13, 988–997. doi: 10.1016/j.joca.2005.07.012
Shannon, P., Markiel, A., Ozier, O., Baliga, N. S., Wang, J. T., Ramage, D., et al. (2003). Cytoscape: a software environment for integrated models of biomolecular interaction networks. Genome Res. 13, 2498–2504. doi: 10.1101/gr.1239303
Stuart, J. M., Segal, E., Koller, D., and Kim, S. K. (2003). A gene-coexpression network for global discovery of conserved genetic modules. Science 302, 249–255. doi: 10.1126/science.1087447
Szklarczyk, D., Franceschini, A., Wyder, S., Forslund, K., Heller, D., Huerta-Cepas, J., et al. (2015). STRING v10: protein-protein interaction networks, integrated over the tree of life. Nucleic Acids Res. 43, D447–D452. doi: 10.1093/nar/gku1003
Valdes, A. M., and Spector, T. D. (2011). Genetic epidemiology of hip and knee osteoarthritis. Nat. Rev. Rheumatol. 7, 23–32. doi: 10.1038/nrrheum.2010.191
Vastrad, B., Vastrad, C., Godavarthi, A., and Chandrashekar, R. (2017). Molecular mechanisms underlying gliomas and glioblastoma pathogenesis revealed by bioinformatics analysis of microarray data. Med. Oncol. 34:182. doi: 10.1007/s12032-017-1043-x
Vukusic, K., Jonsson, M., Brantsing, C., Dellgren, G., Jeppsson, A., Lindahl, A., et al. (2013). High density sphere culture of adult cardiac cells increases the levels of cardiac and progenitor markers and shows signs of vasculogenesis. Biomed Res. Int. 2013:696837. doi: 10.1155/2013/696837
Wang, W., Olson, D., Liang, G., Franceschi, R. T., Li, C., Wang, B., et al. (2012). Collagen XXIV (Col24alpha1) promotes osteoblastic differentiation and mineralization through TGF-beta/Smads signaling pathway. Int. J. Biol. Sci. 8, 1310–1322. doi: 10.7150/ijbs.5136
Woolf, A. D., and Pfleger, B. (2003). Burden of major musculoskeletal conditions. Bull. World Health Organ. 81, 646–656.
Yuan, L., Shu, B., Chen, L., Qian, K., Wang, Y., Qian, G., et al. (2017). Overexpression of COL3A1 confers a poor prognosis in human bladder cancer identified by co-expression analysis. Oncotarget 8, 70508–70520. doi: 10.18632/oncotarget.19733
Keywords: osteoarthritis, biomarkers, WGCNA, pathological process, hub genes
Citation: Gu H-Y, Yang M, Guo J, Zhang C, Lin L-L, Liu Y and Wei R-X (2019) Identification of the Biomarkers and Pathological Process of Osteoarthritis: Weighted Gene Co-expression Network Analysis. Front. Physiol. 10:275. doi: 10.3389/fphys.2019.00275
Received: 23 November 2018; Accepted: 28 February 2019;
Published: 19 March 2019.
Edited by:
Brian James Morris, The University of Sydney, AustraliaReviewed by:
Rushita Bagchi, University of Colorado Denver, United StatesGiovanna Calabrese, Università degli Studi di Catania, Italy
Copyright © 2019 Gu, Yang, Guo, Zhang, Lin, Liu and Wei. This is an open-access article distributed under the terms of the Creative Commons Attribution License (CC BY). The use, distribution or reproduction in other forums is permitted, provided the original author(s) and the copyright owner(s) are credited and that the original publication in this journal is cited, in accordance with accepted academic practice. No use, distribution or reproduction is permitted which does not comply with these terms.
*Correspondence: Ren-Xiong Wei, d2xzMDgyMUAxMjYuY29t
†These authors have contributed equally to this work