 Alejandro Molina-Molina1*
 Emilio J. Ruiz-Malagón1
 Francisco Carrillo-Pérez2
 Luis E. Roche-Seruendo3
 Miguel Damas2Oresti Banos2
 Felipe García-Pinillos1,4
- 1Department of Physical Education and Sports, Faculty of Sport Sciences, Sport and Health University Research Institute (iMUDS), University of Granada, Granada, Spain
- 2Department of Computer Architecture and Technology, E.T.S.I.I.T.- C.I.T.I.C. University of Granada, Granada, Spain
- 3Universidad San Jorge, Campus Universitario, Zaragoza, Spain
- 4Department of Physical Education, Sports and Recreation, Universidad de La Frontera, Temuco, Chile
The mDurance® system is an innovative digital tool that combines wearable surface electromyography (sEMG), mobile computing and cloud analysis to streamline and automatize the assessment of muscle activity. The tool is particularly devised to support clinicians and sport professionals in their daily routines, as an assessment tool in the prevention, monitoring rehabilitation and training field. This study aimed at determining the validity of the mDurance system for measuring muscle activity by comparing sEMG output with a reference sEMG system, the Delsys® system. Fifteen participants were tested during isokinetic knee extensions at three different speeds (60, 180, and 300 deg/s), for two muscles (rectus femoris [RF] and vastus lateralis [VL]) and two different electrodes locations (proximal and distal placement). The maximum voluntary isometric contraction was carried out for the normalization of the signal, followed by dynamic isokinetic knee extensions for each speed. The sEMG output for both systems was obtained from the raw sEMG signal following mDurance's processing and filtering. Mean, median, first quartile, third quartile and 90th percentile was calculated from the sEMG amplitude signals for each system. The results show an almost perfect ICC relationship for the VL (ICC > 0.81) and substantial to almost perfect for the RF (ICC > 0.762) for all variables and speeds. The Bland-Altman plots revealed heteroscedasticity of error for mean, quartile 3 and 90th percentile (60 and 300 deg/s) for RF and at mean and 90th percentile for VL (300 deg/s). In conclusion, the results indicate that the mDurance® sEMG system is a valid tool to measure muscle activity during dynamic contractions over a range of speeds. This innovative system provides more time for clinicians (e.g., interpretation patients' pathologies) and sport trainers (e.g., advising athletes), thanks to automatic processing and filtering of the raw sEMG signal and generation of muscle activity reports in real-time.
Introduction
The application of surface electromyography (sEMG) has been widely used to measure muscle activity signals, facilitating access to electrophysiological processes that cause the muscle to generate force and produce movement (De Luca, 1997). In medical and physiotherapy research, sEMG has been used for diagnosis of chronic low back pain patients (Randy Neblett et al., 2014), or the assessment of isokinetic strength testing in patients with posterior cruciate-retaining and substituting knee arthroplasties (Bolanos et al., 1998). In addition, to monitor a physiotherapy exercise programme used as biofeedback for patellofemoral pain syndrome rehabilitation, through isokinetic knee extension strength (Yip and Ng, 2006). Additionally, the muscle activity has contributed to evaluate risk factors, performance and training intervention in sports sciences. For example, data from sEMG have been used to investigate changes in muscle activation patterns of lower limbs in runners wearing different types of footwear (Wakeling et al., 2002), or as a risk factor of injury in football players to prevent the anterior cruciate ligament tear, through isokinetic knee extension strength (De Ste Croix et al., 2015).
The electromyographs present valued benefits providing depth knowledge as an assessment tool in the prevention, monitoring rehabilitation, and training field. The most advanced and complex electromyographs in the field of research have incorporated numerous sEMG channels and synchronization with other technologies such as accelerometry, force platforms and motion capture systems (Bioengineering, 2020; Delsys Inc., 2020). Nevertheless, very few clinicians, physiotherapists and sport professional, working in private rehabilitation or sport centers, are familiar with the sEMG techniques. Traditionally, the prices of electromyographs used in research have been beyond the reach of most clinics, being one of the drawbacks of sEMG techniques. Another drawback, in the private field, is that the muscle activity signal usually needs to be processed and filtered to perform interpretations (De Luca, 1997; De Luca et al., 2010), and some commercial sEMG systems only record the sEMG raw signal without providing software for processing and filtering to the client. This would require preliminary knowledge on programming languages such as Matlab or Python, where programming skills are a must. In addition, it takes time to learn sEMG techniques, to learn these programming skills and to apply the code to process and filter the raw sEMG signal, as well as to create a user-friendly and individualized report for the patient or athlete. Time that private clinics and sports centers cannot afford. Due to the complexity and cost of the equipment, the non-intuitive software and the extensive time to learn and apply signal processing, the assessment of muscle activity becomes a difficult task for non-technical people, thus limiting the ability to make decisions instantly and efficiently.
In recent decades, the technological advances have propelled novel sEMG solutions expanding the range of possibilities in the market. Both traditional and new electromyograph companies are focusing their efforts on the design of portable and lightweight devices. Thus, for example, novel sEMG solutions have been embedded into regular sportswear by integrating electrodes in the textile, although these systems are mostly limited to measuring thigh muscles via sensorized sports tights (Athos, 2020; Myontec, 2020). In addition, some novel sEMG systems have automated their signal processing, generating reports for the patient immediately, hence lowering the complexity that private clinicians, physiotherapists and sport professionals would encounter in traditional neuromuscular analyses (Athos, 2020; BioZen, 2020; Myo, 2020; Myontec, 2020). The mDurance® system (mDurance) is one of such examples, a tool that combines a portable two-channel sEMG device with a mobile application and a cloud service (sEMG signal store, processing and analysis), guiding physiotherapists or sport professionals from placing electrodes by following the European recommendations, until provide a customized report immediately for the patient or athlete. The European recommendations followed by mDurance are part of the SENIAM project (Surface Electromyography for the Non-Invasive Assessment of Muscles) (Hermens et al., 2000). Besides, mDurance allows the possibility to evaluate several muscles along the body given the portable nature of the sensors (Banos et al., 2015; mDurance, 2020). The sEMG device used by mDurance is the Shimmer3 EMG unit (Shimmer), a hardware designed and manufactured by Realtime Technologies Ltd, Dublin, Ireland (Shimmer, 2020). Shimmer is known and used during last decade in engineering research, for being a portable, low-cost and open access device for users with programming skills (Burns et al., 2010a,b; Ahamed et al., 2012; Ibrahim et al., 2016). However, practitioners or coaches could hardly use Shimmer as programming skills are not part of these professional groups. Therefore, the mDurance system is a set made up of Shimmer and its proprietary mDurance software (android app and cloud service), trying to facilitate the sEMG techniques to private rehabilitation and sport centers, guiding its users throughout the neuromuscular assessment process, processing the signal and providing automated reports in real time.
However, all this new technological support must be validated; if not, interpretations after rehabilitation or a medical diagnosis could lead to misinterpretations, what would cause a risk to the patient's health or sports performance. To date, mDurance system, which is hardware (Shimmer) and software (proprietary android app and cloud service), has not been validated yet, so a joint validation (software and hardware) is found fundamental. Hence, the aim of the current study is to evaluate the concurrent validity of the mDurance system, both hardware and software, for measuring muscle activity by comparing sEMG output with a reference sEMG system (i.e., Delsys).
Materials and Methods
Participants
Fifteen participants (mean ± SD; age: 27 ± 6 years old; height: 1.76 ± 0.07 m; body mass: 76 ± 13 kg) were recruited for this study. All participants met the inclusion criteria: (1) older than 18 years old; (2) be able to extend and flex the knee with a range of motion >90° (between 90 and 180°); and (3) free of any neurological disorders or musculoskeletal injuries within the last 6 months. After receiving detailed information on the objectives and procedures of the study, each participant signed an informed consent form in order to participate, which complied with the ethical standards of the World Medical Association's Declaration of Helsinki (2013). It was made clear that the participants were free to leave the study at their convenience. The study was approved by the Universidad de La Frontera (Chile).
Procedures
Participants were refrained from severe physical activity for, at least, 48 h before the tests. All tests were conducted, at least, 3 h after eating. Prior to all testing, height and body mass were measured using a precision stadiometer and balance (SECA 222 and 634, respectively, SECA, Corp., Hamburg, Germany) for descriptive purposes. For the measurements, the vastus lateralis (VL) and rectus femoris (RF) were collected from both legs and with both sEMG systems simultaneously (Lynn et al., 2018). The SENIAM project recommendations for skin preparation and electrode location on VL and RF were followed (Hermens et al., 2000). Hence, (1) the skin was shaved if the skin surface was covered with hair (at which the electrodes had to be placed), and (2) was cleaned with alcohol and allowed to vaporize before the electrode was placed. Since this validation is intra-session and during the same muscle contraction, an impedance recording is not required (Elsais et al., 2020). Once the electrode area was found, we marked the place and positioned both mDurance and Delsys electrodes as close as possible to either sides of the mark. Delsys was placed proximally with respect to the mark for the right leg and distally for the left leg; otherwise, mDurance was placed opposite Delsys, distally on the right leg and proximally on the left leg (Figure 1). A reference electrode was placed on the knee at the patella for mDurance, by following its recommendations. Delsys does not require a reference electrode (Figure 1).
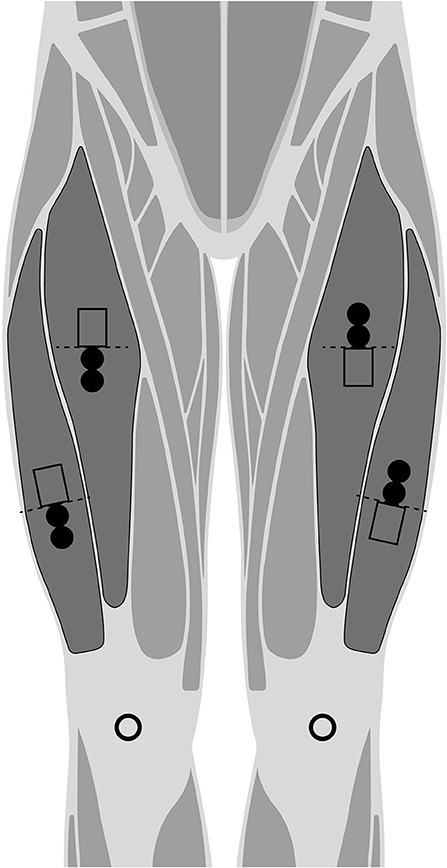
Figure 1. Representation for the placement of the mDurance muscle electrodes (filled circles), and Delsys sensors (bottomless rectangles) to either sides of the SENIAM recommendation (dashed line). Randomized proximal and distal position for mDurance and Delsys in each leg. The mDurance reference electrodes are represented by bottomless circles.
Material and Testing
For the validation, two-different sEMG systems were used: mDurance, as a novel sEMG system, and Delsys TrignoTM Wireless, as a reference system:
• The mDurance® system (mDurance Solutions SL, Granada, Spain) is a portable and low-cost sEMG system that consists of three parts. First, a Shimmer3 EMG unit (Realtime Technologies Ltd, Dublin, Ireland), that is a bipolar sEMG sensor for the acquisition of superficial muscle activity. Each Shimmer sensor is composed of two sEMG channels, with a sampling rate at 1,024 Hz. Shimmer applies a bandwidth 8.4 kHz, the EMG signal resolution is 24 bits and overall amplification of 100–10,000 V/V. The electrodes used were pre-gelled Ag/AgCl with a diameter of 10 mm and an interelectrode distance of 20 mm. Second, the mDurance (Android) mobile application is responsible for receiving data from the Shimmer unit and sending it to a cloud service. And, third, the mDurance cloud service where the sEMG signals are stored, filtered, and analyzed, generating the reports.
• TrignoTM Wireless System (Delsys, Inc., Natick, MA, USA), henceforth Delsys, was the reference system used to compare with the novel electromyograph. It is a widespread commercial sEMG system with 16 channels and a sampling rate at 2,000 Hz. Besides, Delsys applies a built-in filter of 20–450 Hz bandwidth, the EMG signal resolution is 16 bits, and the inter-sensor latency <500 us. The acquisition was carried out via the EMGworks® Software (Delsys, Inc., in Natick, MA., USA).
Both sEMG systems were compared through their natural hardware configurations despite their differences (i.e., sampling rate, bandwidth filter), and it was taken into account for the processing and filtering of the signal.
A HUMAC Norm (CSMi, Inc., Stoughton, MA, USA) isokinetic dynamometer was used to control and measure angular displacement during knee extension sets. The dynamometer was used to reduce variability in the performance of the movement by controlling motion speed and position.
For the validation testing, participants were instructed to cycle for 10-min on a stationary bike at a self-selected pace followed by mobility exercises (e.g., dynamics drills) for the warm up (Figure 2). Then, we carried out the placement of the electrodes and participants were then seated on the HUMAC Norm dynamometer (Figure 2). Then, they were positioned according to the HUMAC testing and rehabilitation user's manual (CSMi Solutions, 2013): hip angle at 85°, knee flexed at 90°, and the ankle in the anatomical position (sole of the foot perpendicular to the shank). The padded arm of the dynamometer was positioned 3 cm proximally to the lateral malleolus and the axis of rotation of the knee aligned with the axis of rotation of the dynamometer (Kay and Blazevich, 2009). This position was used to carry out the maximum voluntary isometric contraction (MVIC) for two repetitions of the knee extension isometric test during 5 s, separated by a 2 min rest period (Roberts et al., 2012; Luc et al., 2016) (Figure 2). In addition, this position was maintained during all subsequent dynamic tests and familiarization repetitions were included in all tests with each speed and movement (Figure 2). Following MVIC testing, participants performed two sets with three repetitions of concentric knee extension at 100% of intensity for each testing speed: 60, 180, and 300 deg/s (Lynn et al., 2018). No repetitions at sub-maximal intensity were performed to avoid failed attempts, thus reducing the risk of adding potential variables that influence the SEMG signal (such as accumulated fatigue or increased sweating). Three repetitions is a reliable amount to maintain the intensity between contractions and sets (Sole et al., 2007). Between sets, a 1 min and 30 s rest period was defined. Besides, during the concentric knee flexion, the isokinetic dynamometer did not offer any resistance to be useful as a rest period between repetitions (Lynn et al., 2018). The dynamic tests were carried out unilaterally, so all the sets of one leg were performed and followed by the other leg separately, with randomized order.
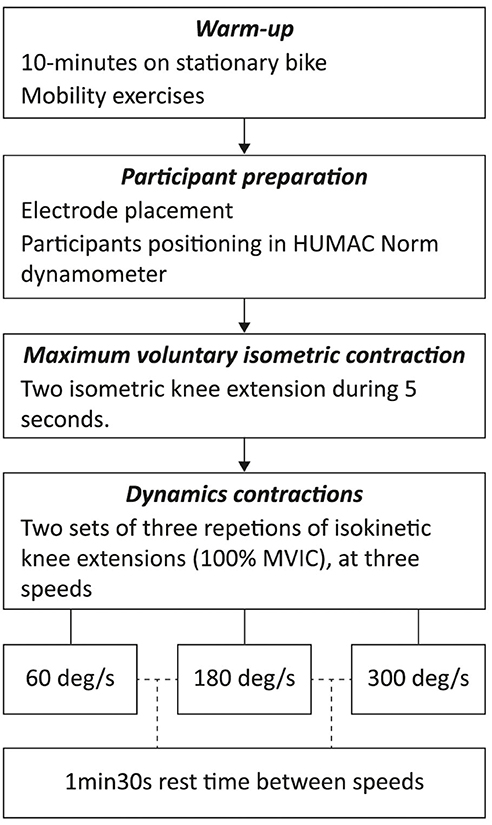
Figure 2. Overview diagram of the validation testing.
Signal Processing and Filtering
For the processing and filtering of the raw signals of the two independent systems into the sEMG output signal, we implemented in Python the mDurance methodology used in its cloud service. (1) First, both the isometric and dynamic tests were filtered using a fourth order Butterworth bandpass filter with a cut-off frequency at 20–450 Hz, only for mDurance raw signal since Delsys already includes this filter by the hardware. (2) Second, the signal was smoothed using a window size of 0.025 s root mean square (RMS) and a overlapping of 0.0125 s between windows for both systems separately. (3) And third, the MVIC value was calculated using the average of the three maximum peaks of the RMS signal during the 5 s isometric test, and being the MVIC used for normalized the RMS signal of each system. The use of the average (following mDurance mythology) instead of the peak for the MVIC calculation will not affect the magnitude of the sEMG outputs inter-systems (Burden, 2010). Python libraries used for the analysis were Numpy (Van Der Walt et al., 2011) for numerical computations, Scipy (Virtanen et al., 2020) for signal analysis and Pandas (McKinney, 2010) for processing the CSV files that contained the raw sEMG.
To determine the onset and offset of each muscle contraction, a threshold of 10% was applied to the normalized RMS signal from the MVIC (Figure 3) (De Luca, 1997). Subsequently and for the analysis of sEMG amplitude signals, we calculated the following variables of each contraction for each sEMG system separately: mean, median, first quartile (Q1), third quartile (Q3) and 90th percentile (PERC90). These metrics represent the different levels of the sEMG amplitude signal for each muscle contraction: (i) PERC90 represents the highest level of the contraction, (ii) Q3 is the next level, (iii) median and mean that represents the middle level of the muscle contraction and, (iv) Q1 represents the lowest level of the contraction (Figure 3). Finally, the average of each set executed with three useful contractions in all variables was calculated (i.e., mean, Q1, Q3, or PERC90), as sample for statistical analysis in this concurrent validation. The inclusion criteria for a useful contraction was established at a baseline noise below 15 μVrms and a correct execution of the participant respecting the contraction-rest times. These inclusion criteria were used to decide the useful sets for the statistical analysis. All sEMG outputs were based on the RMS amplitude since mDurance have no integrated a sEMG frequency analysis (i.e., Fourier transform).
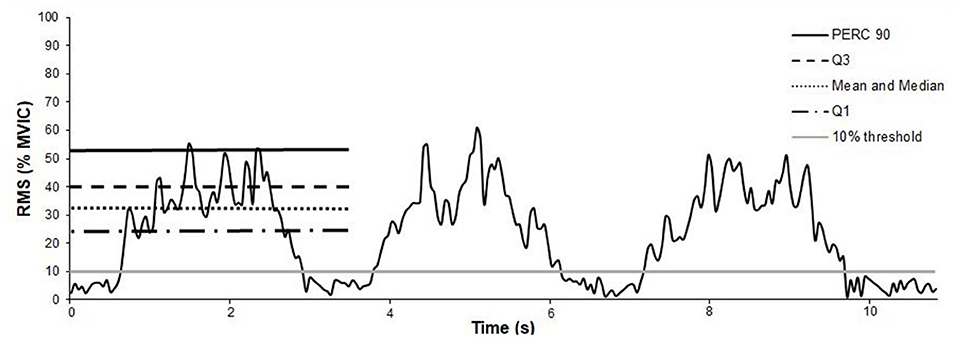
Figure 3. Representation of the 10% threshold (gray horizontal solid bar) applied to an exemplary set, with a root mean square (RMS) signal normalized by the maximum voluntary isometric contraction (MVIC). Besides, representation of the muscle activity parameters for an exemplary muscle contraction. sEMG amplitude parameters: 90th percentile (PERC 90), third quartile (Q3), mean and median, and first quartile (Q1).
Statistical Analysis
A total of thirty-eight sets were used, which correspond to the number of useful series that met the inclusion criteria. Data analysis was conducted using SPSS (vs. 25, SPSS Inc., Chicago, IL). Descriptive statistics are represented as mean and standard deviation (SD). In order to examine the concurrent validity between systems (i.e., mDurance vs. Delsys), the level of agreement between sEMG data from both devices was examined. To that end, a comparison of means (t-test) was conducted between systems, and the Cohen's d effect size (ES) was used to interpret the magnitude of the differences (Cohen, 1988) (i.e., trivial ES < 0.19, small 0.2–0.49, medium 0.5–0.79, and large ES ≥ 0.8). A Pearson correlation analysis was also conducted. To properly interpret the magnitude of the correlations, the following criteria were adopted: <0.1 (trivial), 0.1–0.3 (small), 0.3–0.5 (moderate), 0.5–0.7 (large), 0.7–0.9 (very large), and 0.9–1.0 (almost perfect) (Hopkins et al., 2009). The validity analysis was reinforced by calculating the intra class correlation coefficients (ICCs) between mDurance and the reference system. Based on a previous study (Koo and Li, 2016), the authors conducted a two-way random-effects model (ICC [2,k]), mean of measurements and absolute definition for the ICCs. The magnitude of the ICC was interpreted according to the following benchmarks (Landis et al., 1977): ICC <0 (poor), 0–0.20 (slight), 0.21–0.40 (fair), 0.4–0.60 (moderate), 0.61–0.80 (substantial), and >0.80 (almost perfect). Finally, Bland-Altman plots, based on the limits of agreement method (Bland and Altman, 1995), let us examine the presence of systematic and proportional bias between systems. Heteroscedasticity of error was defined as an r2 > 0.1 (Atkinson and Nevill, 1998). The level of significance used was p < 0.05.
Results
Despite the pairwise comparisons showed some significant differences (p < 0.05) between systems for measuring the sEMG activity of the RF at different speeds (Table 1), the ES resulted trivial and small differences in all cases. The Pearson correlation analysis reported very large relationships (r > 0.7) between data from both systems for all parameters at 60, 180, and 300 deg/s. The ICCs reported almost perfect relationships (ICC > 0.81) for every variable at any speed condition (60, 180, and 300 deg/s).
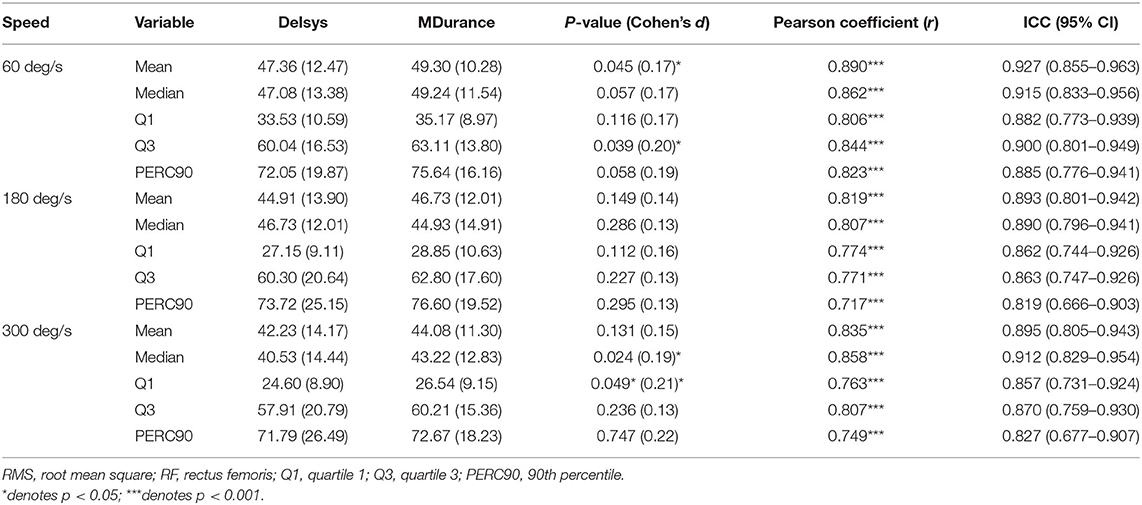
Table 1. Concurrent validity (i.e., Delsys vs. mDurance systems) of RMS normalized for the RF muscle at different speeds of movement (i.e., 60–180–300 deg/s).
Regarding the other muscle (i.e., VL), the means comparison revealed the lack of differences at any speed (Table 2). The correlation analysis reported significant correlation with large to very large Pearson coefficients (r > 0.609, p < 0.001), and substantial to almost perfect ICCs (ICC > 0.762) for all parameters at every speed.
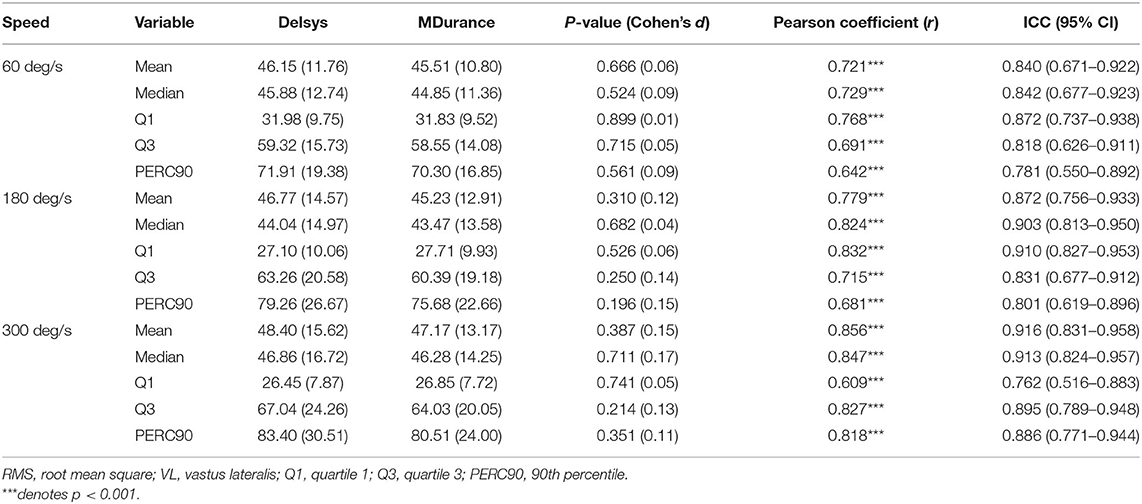
Table 2. Concurrent validity (i.e., Delsys vs. MDurance systems) of RMS normalized for the VL muscle at different speeds of movement (i.e., 60–180–300 deg/s).
In order to ensure the lack of effect of electrode position (i.e., proximal vs. distal), a between systems comparison (i.e., Delsys vs. MDurance) was performed for every parameter at every speed for both right and left leg. Almost perfect ICCs were obtained, with ICCs > 0.88, where the confidence interval spans between moderate and almost perfect (0.411–0.980) in all cases.
The Bland-Altman plots revealed heteroscedasticity of error for some sEMG-related parameters of the RF at 60 deg/s (i.e., mean, Q3, and PERC90), at 180 deg/s (i.e., PERC90), and 300 deg/s (i.e., mean, Q3, and PERC90) (Figure 4).
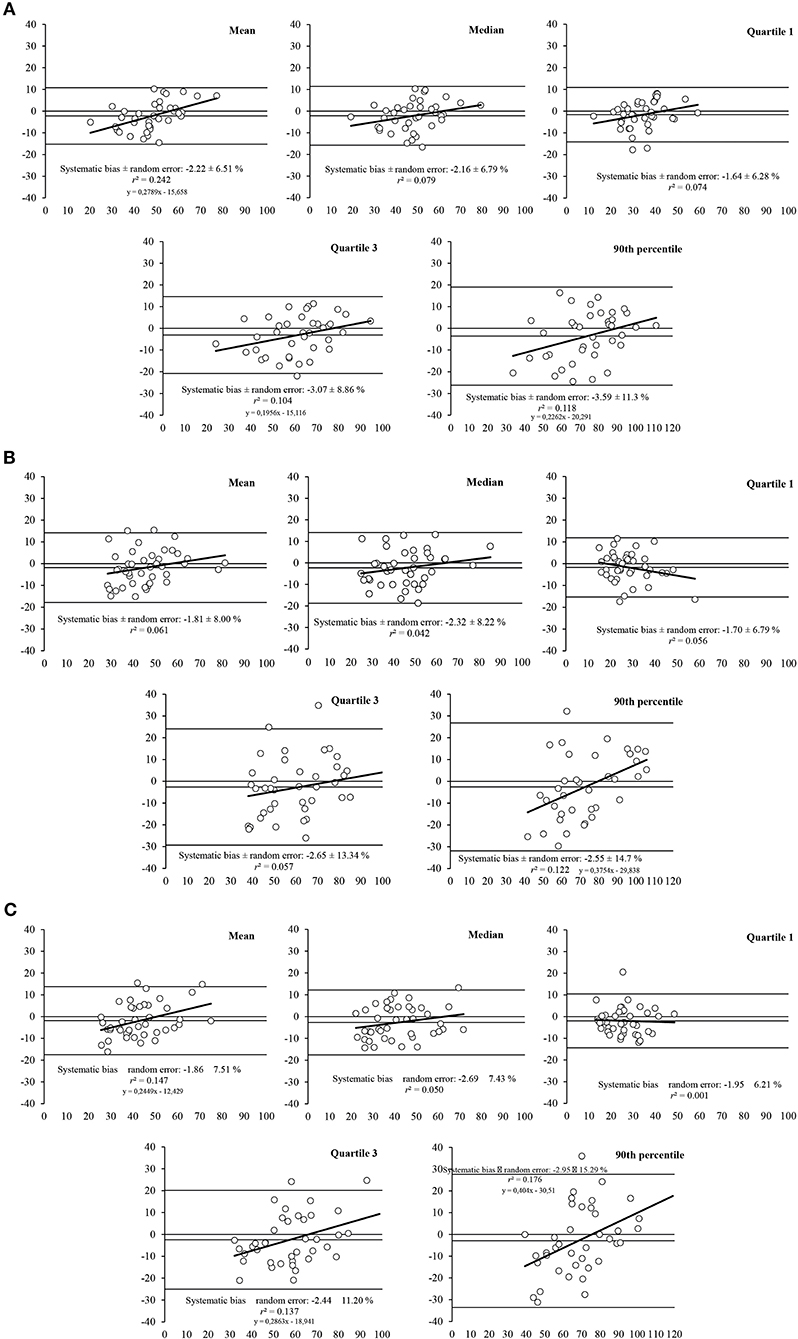
Figure 4. Bland-Altman plots for the measurement of muscle activity parameters (i.e., mean, median, first quartile, third quartile, and 90th percentile) for the RF muscle at different speeds of movement: (A) 60 deg/s, (B) 180 deg/s, and (C) at 300 deg/s. The plots includes the mean difference (dotted line) and 95% limits of agreement (dashed lined), along with the regression line (solid line).
For the VL (Figure 5), the Bland-Altman plots also revealed heteroscedasticity of error for mean and PERC90 at 300 deg/s, whereas no heteroscedasticity was found in any sEMG parameter at 60 or 180 deg/s.
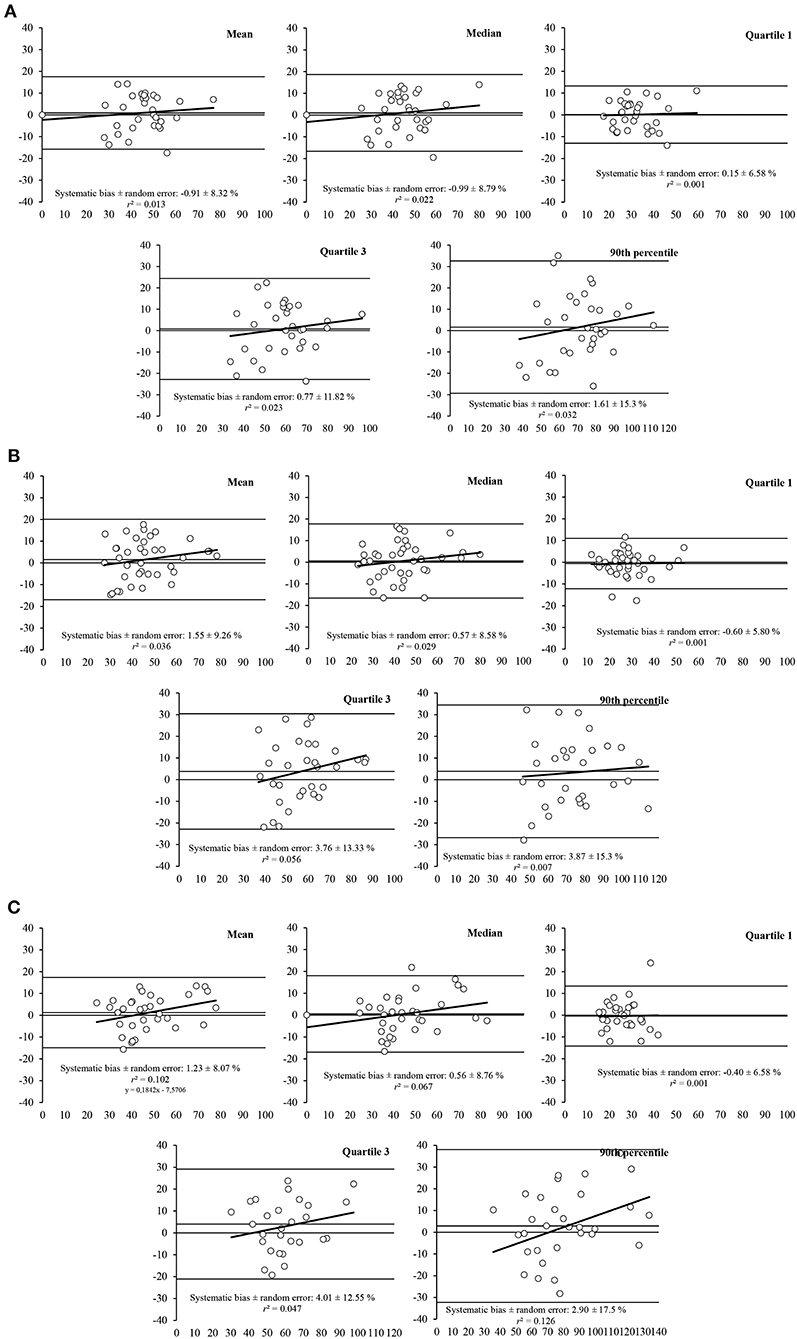
Figure 5. Bland-Altman plots for the measurement of muscle activity parameters (i.e., mean, median, first quartile, third quartile, and 90th percentile) for the VL muscle at different speeds of movement: (A) 60 deg/s, (B) 180 deg/s, and (C) at 300 deg/s. The plots includes the mean difference (dotted line) and 95% limits of agreement (dashed lined), along with the regression line (solid line).
Discussion
This study aimed at determining the validity of the mDurance system for measuring muscle activity during isokinetic knee extensions at three different speeds (i.e., 60, 180, and 300 deg/s), for two muscles (i.e., RF and VL) and two different electrodes locations (i.e., proximal and distal placement), by comparing sEMG output with a reference sEMG system, the Delsys. The results obtained suggest that the mDurance system provides valid sEMG output data for VL and RF during knee extensions at 60, 180, and 300 deg/s speed, showing a strong concurrent validity as compared to Delsys sEMG system, based on Pearson's coefficients and ICCs referring to a relative validity. However, Bland-Altman plots suggest an acceptable absolute validity, due to the random errors, going from ±8% for the mean to ±15% for the Perc90.
The main use of the mDurance is the muscle assessment for clinics and sports professionals, due to its low price, low weight and automated signal processing. Typical situations to use mDurance could be the clinical evaluation of low back pain through the endurance test (Banos et al., 2015) or the flexion-relaxation phenomenon (Carrillo-Perez et al., 2018), and the neuromuscular assessment of the curve sprint in football at high intensity, in the field of sport biomechanics (Filter et al., 2020). Nevertheless, the use of a non-validated novel sEMG system could be harmful to the health of patients or affect the performance of athletes, due to potential misinterpretations. Regarding relative validity, the ICCs where reported an almost perfect relationship for the VL (ICC > 0.81) and substantial or almost perfect relationship for the RF (ICC > 0.762), for all analyzed variables. Another interesting result has been a very large relationship (r > 0.7, p < 0.001) reported by the Pearson correlation analysis for the RF, and significant for the VL (r > 0.609, p < 0.001), for all speeds and all variables. In comparison with our results, Burns et al. (2010a) compared Shimmer with a commercial EMG system (Grass P511AC Amplifier system) in biceps brachii muscle during isometric contractions. They found a variation for the mean of approximately 8%, between systems. On the other hand, our results revealed a lack of differences at any speed for VL with 1–2% mean differences approximately and some differences for RF, being the effect size trivial in all cases, with 2–3% mean differences approximately.
We suggest that although RF and VL are part of the quadriceps and the longitudinal muscles, the slight differences found could be caused by slight anatomical differences between them. The anatomical differences could be related to the location of the muscle in relation to the quadriceps, the proximity of other muscles, tendons or ligaments affecting crosstalk (Blanc and Dimanico, 2014), and the difference in size for the optimal electrode placement site which is greater for RF (Hogrel et al., 1998; Barbero et al., 2012). Besides, a prior work showed that the RF muscle is regionally non-uniformly activated longitudinally (Watanabe et al., 2014).
A similar study compared a textile sEMG system with a traditional electromyograph for the quadriceps musculature in isokinetic knee extensions at 60, 180, and 300 deg/s (Lynn et al., 2018). Similar to our results, they observed that both systems had no significant differences for all of the computed variables. Moreover, their Pearson's coefficients showed a similar magnitude and directionality of correlation for both systems, without a significant inter-system difference. For instance, they found correlations between 0.69 and 0.74 for all their muscles at the speeds of 60 and 300 deg/s, which indicated a very large agreement between both. In the same way, a prior work compared a customized sEMG system also with Delsys, although using dynamic exercises (knee extension, squat, lunge, and jump). Their findings indicated a good to excellent agreement between both systems (Fuentes del Toro et al., 2019), with correlations between 0.51 and 0.96 in their results, with a mean of 0.60. Although, different types of correlation were performed, we recommend caution when establishing comparisons between studies. In comparison with our findings, we observed for the Pearson correlation analysis a result between 0.72 and 0.89 for the RF and between 0.61 and 0.83 for the VL. This represents a very large ratio for each muscle for the concurrent validation between mDurance and Delsys. Hence, we found similar results with significant and very large Pearson's correlation between mDurance and Delsys. Lastly, although the signal processing and the parameters obtained between Fuentes del Toro et al. (2019) and Lynn et al. (2018) are different from ours, they are comparing a reference system with a new one like we do here, and their findings and ours are quite similar, obtaining good and excellent agreements between both systems.
Regarding the absolute validity, the Bland–Altman plots evaluate the agreement between the mDurance and Delsys. Our plots for the RF revealed heteroscedasticity for the mean, Q3, and Per90 at 60 and 300 deg/s and only Per90 at 180 deg/s. Although for VL muscle, we only found heteroscedasticity for mean and Per90 at 300 deg/s. The heteroscedasticity refers to the relationship between the difference in the two methods and the size of the measured variable. In addition, the systematic bias for the mean was −2% with a random error of ±7.34%, and 1.23 ± 8.55% random error, for RF and VL, respectively and for all speeds. Being a good-enough systematic bias and random error for clinic assessments as the flexion-relaxation phenomenon associated with chronic low back pain (Alschuler et al., 2009) and testing the efficacy of sEMG biofeedback in knee osteoarthritis by knee extensions at 60 and 180 deg/s (Yilmaz et al., 2010). However, the Per90, which represents the top of the muscle contraction, showed a systematic bias for all speeds of 3.03% and a random error of ±13.76% for RF, and 2.8 ± 16.03%, being an acceptable systematic bias and random error in this context. This may result because sEMG is more variable as closer to the peak (Hibbs et al., 2011). In this direction, the random error was wider at higher speeds for all variables in both muscles. For example, Perc90 at 60 deg/s showed a random error of ±15.3%, however at 300 deg/s was ±17.5%.
All our findings indicate that there is an excellent agreement between mDurance and Delsys, although it should be noted that there are various limitations to this study. Firstly, all the tests were carried out at 100% of the MVIC, aiming to not make extra attempts, and avoid causing fatigue because of it. Limiting ourselves to not having information about the effect of fatigue on the different systems. Secondly, in order to create a controlled environment, only the quadriceps musculature and isokinetic knee extensions were assessed. Therefore, for future studies it is recommended to check the validity of other musculature in addition to checking more functional tests for clinical (i.e., lumbar flexion for low back pain patients or gait) and sports (i.e., running, squats, or jumps) applications. Thirdly, the lack of standardized methods and analysis for sEMG validations studies may make difficult to compare with similar validations. Finally, an important consideration is that validation data were obtained from an analysis based on within-participant variation (CV) rather than on different days (i.e., test-re-test) so, our current reliability statistics might not generalize to runs performed several days apart.
Conclusions
The results indicate that the mDurance® sEMG system is a valid tool to measure muscle activity during isokinetic contractions over a range of speeds, tested in laboratory conditions. Our results revealed an excellent relative validity for all variables, and an acceptable to good-enough absolute validity, with a systematic bias of 1.62 ± 8% random error for the mean. From a practical standpoint, mDurance as a system made up of Shimmer sensor and proprietary software, is a valid sEMG system, as compared to Delsys. This novel system includes a user-friendly software, a light hardware and a reasonable price, which make it more affordable and accessible for clinicians and sport trainers. In addition, it provides more time for interpretation and for addressing patients' pathologies or making recommendations to athletes instantly, thanks to the generation of real-time reports. Further research is required to establish reliability (test-re-test) over several days and to check the validity of mDurance measurements in more muscles from other areas and sizes, in more exercises modalities (i.e., walking, running, cycling) and at different submaximal intensities.
Data Availability Statement
The raw data supporting the conclusions of this article will be made available by the authors, without undue reservation.
Ethics Statement
The studies involving human participants were reviewed and approved by Universidad de La Frontera, Temuco, Chile. The patients/participants provided their written informed consent to participate in this study.
Author Contributions
AM-M, FC-P, MD, and OB defined the experimental design. AM-M and ER-M collected the data. FC-P carried out in Python the mDurance's cloud computing simulation for signal processing and filtering. FG-P carried out the statistical analysis. AM-M conceptualized the approach and together with FG-P wrote the paper. LR-S, MD, OB, ER-M and FG-P reviewed the manuscript for scientific content. All authors have read and agreed to the published version of the manuscript.
Conflict of Interest
MD and OB were affiliated with the company mDurance Solutions S.L.
The remaining authors declare that the research was conducted in the absence of any commercial or financial relationships that could be construed as a potential conflict of interest.
Acknowledgments
The authors wish to thank all participants for their assistance and to Irene Cantarero-Villanueva Ph.D. and Paula Postigo-Martín, of the Department of Physiotherapy (University of Granada, Spain), for providing us with their laboratories and materials so that this study could be carried out.
References
Ahamed, N., Sundaraj, K., Ahmad, R., Rahman, M., Islam, A., and Ali, A. (2012). Analysis of the effect on electrode placement on an adolescent's biceps brachii during muscle contractions using a wireless EMG sensor. J. Phys. Ther. Sci. 24, 609–611. doi: 10.1589/jpts.24.609
Alschuler, K. N., Neblett, R., Wiggert, E., Haig, A. J., and Geisser, M. E. (2009). Flexion-relaxation and clinical features associated with chronic low back pain. Clin. J. Pain 25, 760–766. doi: 10.1097/AJP.0b013e3181b56db6
Athos (2020). Live Athos. Available online at: https://www.liveathos.com/ (accessed February 28, 2020).
Atkinson, G., and Nevill, A. M. (1998). Statistical methods for assessing measurement error (reliability) in variables relevant to sports medicine. Sport. Med. 26, 217–238. doi: 10.2165/00007256-199826040-00002
Banos, O., Moral-Munoz, J. A., Diaz-Reyes, I., Arroyo-Morales, M., Damas, M., Herrera-Viedma, E., et al. (2015). MDurance: a novel mobile health system to support trunk endurance assessment. Sensors 15, 13159–13183. doi: 10.3390/s150613159
Barbero, M., Merletti, R., and Rainoldi, A. (2012). Atlas of Muscle Innervation Zones: Understanding Surface Electromyography and Its Applications. Milan.
Bioengineering, B. (2020). FREEEMG. Available online at: https://www.btsbioengineering.com/es/products/freeemg/ (accessed June 18, 2020).
BioZen (2020). NeuroSky®. Body and Mind. Quantified. Available online at: https://store.neurosky.com/products/biozen (accessed February 28, 2020).
Blanc, Y., and Dimanico, U. (2014). Electrode placement in surface electromyography (sEMG) “Minimal crosstalk area” (MCA). Open Rehabil. J. 3, 110–126. doi: 10.2174/1874943701003010110
Bland, J. M., and Altman, D. G. (1995). Comparing methods of measurement: why plotting difference against standard method is misleading. Lancet 346, 1085–1087. doi: 10.1016/S0140-6736(95)91748-9
Bolanos, A. A., Colizza, W. A., McCann, P. D., Gotlin, R. S., Wootten, M. E., Kahn, B. A., et al. (1998). A comparison of isokinetic strength testing and gait analysis in patients with posterior cruciate-retaining and substituting knee arthroplasties. J. Arthroplasty 13, 906–915. doi: 10.1016/S0883-5403(98)90198-X
Burden, A. (2010). How should we normalize electromyograms obtained from healthy participants? What we have learned from over 25 years of research. J. Electromyogr. Kinesiol. 20, 1023–1035. doi: 10.1016/j.jelekin.2010.07.004
Burns, A., Doheny, E. P., Greene, B. R., Foran, T., Leahy, D., O'Donovan, K., et al. (2010a). “SHIMMER™: an extensible platform for physiological signal capture,” in 2010 Annual International Conference of the IEEE Engineering in Medicine and Biology Society EMBC'10. Buenos Aires, 3759–3762. doi: 10.1109/IEMBS.2010.5627535
Burns, A., Greene, B. R., McGrath, M. J., O'Shea, T. J., Kuris, B., Ayer, S. M., et al. (2010b). SHIMMERTM–a wireless sensor platform for noninvasive biomedical research. IEEE Sens. J. 10, 1527–1534. doi: 10.1109/JSEN.2010.2045498
Carrillo-Perez, F., Diaz-Reyes, I., Damas, M., Banos, O., Soto-Hermoso, V. M., and Molina-Molina, A. (2018). “A novel automated algorithm for computing lumbar flexion test ratios enhancing athletes objective assessment of low back pain,” in Proceedings of the 6th International Congress on Sport Sciences Research and Technology Support (Seville: SCITEPRESS–Science and Technology Publications), 34–39. doi: 10.5220/0006922600340039
CSMi Solutions (2013). HUMAC NORM User Manual. Available online at: https://www.yumpu.com/en/document/view/8976833/300004d-409-humac-norm-user-manual-csmi-solutions (accessed August 11, 2020).
De Luca, C. J. (1997). The use of surface electromyography in biomechanics. J. Appl. Biomech. 13, 135–163.
De Luca, C. J., Donald Gilmore, L., Kuznetsov, M., and Roy, S. H. (2010). Filtering the surface EMG signal: movement artifact and baseline noise contamination. J. Biomech. 43, 1573–1579. doi: 10.1016/j.jbiomech.2010.01.027
De Ste Croix, M. B. A., Priestley, A. M., Lloyd, R. S., and Oliver, J. L. (2015). ACL injury risk in elite female youth soccer: changes in neuromuscular control of the knee following soccer-specific fatigue. Scand. J. Med. Sci. Sport. 25, e531–e538. doi: 10.1111/sms.12355
Delsys Inc. (2020). Wearable Sensors for Movement Sciences. Delsys Trigno. Available online at: https://delsys.com/trigno/ (Accessed June 18, 2020).
Elsais, W. M., Preece, S. J., Jones, R. K., and Herrington, L. (2020). Between-day repeatability of lower limb EMG measurement during running and walking. J. Electromyogr. Kinesiol. 55:102473. doi: 10.1016/j.jelekin.2020.102473
Filter, A., Olivares-Jabalera, J., Santalla, A., Morente-Sánchez, J., Robles-Rodríguez, J., Requena, B., et al. (2020). Curve sprinting in soccer: kinematic and neuromuscular analysis. Int. J. Sports Med. 41, 744–750. doi: 10.1055/a-1144-3175
Fuentes del Toro, S., Wei, Y., Olmeda, E., Ren, L., Guowu, W., and Díaz, V. (2019). Validation of a low-cost electromyography (EMG) system via a commercial and accurate EMG device: pilot study. Sensors 19:5214. doi: 10.3390/s19235214
Hermens, H. J., Freriks, B., Disselhorst-Klug, C., and Rau, G. (2000). Development of recommendations for SEMG sensors and sensor placement procedures. J. Electromyogr. Kinesiol. 10, 361–374. doi: 10.1016/S1050-6411(00)00027-4
Hibbs, A. E., Thompson, K. G., French, D. N., Hodgson, D., and Spears, I. R. (2011). Peak and average rectified EMG measures: which method of data reduction should be used for assessing core training exercises? J. Electromyogr. Kinesiol. 21, 102–111. doi: 10.1016/j.jelekin.2010.06.001
Hogrel, J. Y., Duchêne, J., and Marini, J. F. (1998). Variability of some SEMG parameter estimates with electrode location. J. Electromyogr. Kinesiol. 8, 305–315. doi: 10.1016/S1050-6411(97)00043-6
Hopkins, W. G., Marshall, S. W., Batterham, A. M., and Hanin, J. (2009). Progressive statistics for studies in sports medicine and exercise science. Med. Sci. Sports Exerc. 41, 3–13. doi: 10.1249/MSS.0b013e31818cb278
Ibrahim, A. F. T., Gannapathy, V. R., Chong, L. W., and Isa, I. S. M. (2016). Analysis of Electromyography (EMG) Signal for Human Arm Muscle: A Review. Cham.
Kay, A. D., and Blazevich, A. J. (2009). Moderate-duration static stretch reduces active and passive plantar flexor moment but not Achilles tendon stiffness or active muscle length. J. Appl. Physiol. 106, 1249–1256. doi: 10.1152/japplphysiol.91476.2008
Koo, T. K., and Li, M. Y. (2016). A guideline of selecting and reporting intraclass correlation coefficients for reliability research. J. Chiropr. Med. 15, 155–63. doi: 10.1016/j.jcm.2016.02.012
Landis, J. R., Koch, G. G., Landis, J. R., and Koch, G. G. (1977). The measurement of observer agreement for categorical data. Biometrics 33, 159–174.
Luc, B. A., Harkey, M. H., Arguelles, G. D., Blackburn, J. T., Ryan, E. D., and Pietrosimone, B. (2016). Measuring voluntary quadriceps activation: effect of visual feedback and stimulus delivery. J. Electromyogr. Kinesiol. 26, 73–81. doi: 10.1016/j.jelekin.2015.10.006
Lynn, S. K., Watkins, C. M., Wong, M. A., Balfany, K., and Feeney, D. F. (2018). Validity and reliability of surface electromyography measurements from a wearable athlete performance system. J. Sport. Sci. Med. 17, 205–215.
McKinney, W. (2010). “Data structures for statistical computing in python,” in Proceedings of the 9th Python in Science Conference, 51–56. Available online at: http://conference.scipy.org/proceedings/scipy2010/mckinney.html
mDurance (2020). mDurance Solition S.L. Available online at: https://www.mdurance.eu/ (accessed February 28, 2020).
Myo (2020). MyoTM Blog. Available online at: https://developerblog.myo.com/tag/emg/ (accessed February 28, 2020).
Myontec (2020). Myontec, Intelligent Clothing. Available online at: https://http//www.myontec.com/ (accessed February 28, 2020).
Randy Neblett, M. A., Emily Brede, R. N., Tom G. Mayer, M. D., and Gatchel, R. J. (2014). What is the best surface EMG measure of lumbar flexion-relaxation for distinguishing chronic low back pain patients from pain-free controls? Natl. Inst. Health 29, 334–340. doi: 10.1097/AJP.0b013e318267252d
Roberts, D., Kuenze, C., Saliba, S., and Hart, J. M. (2012). Accessory muscle activation during the superimposed burst technique. J. Electromyogr. Kinesiol. 22, 540–545. doi: 10.1016/j.jelekin.2012.01.008
Shimmer (2020). Realtime Technologies Ltd. Available online at: http://www.shimmersensing.com/ (accessed February 28, 2020).
Sole, G., Hamrén, J., Milosavljevic, S., Nicholson, H., and Sullivan, S. J. (2007). Test-retest reliability of isokinetic knee extension and flexion. Arch. Phys. Med. Rehabil. 88, 626–631. doi: 10.1016/j.apmr.2007.02.006
Van Der Walt, S., Colbert, S. C., and Varoquaux, G. (2011). The NumPy array: a structure for efficient numerical computation. Comput. Sci. Eng. 13, 22–30. doi: 10.1109/MCSE.2011.37
Virtanen, P., Gommers, R., Oliphant, T. E., Haberland, M., Reddy, T., Cournapeau, D., et al. (2020). SciPy 1.0: fundamental algorithms for scientific computing in Python. Nat. Methods 17, 261–272. doi: 10.1038/s41592-019-0686-2
Wakeling, J. M., Pascual, S. A., and Nigg, B. M. (2002). Altering muscle activity in the lower extremities by running with different shoes [Alteration de l' activite musculaire dans les extremites des membres inferieurs, en courant avec differentes chaussures]. Med. Sci. Sport. Exerc. 34, 1529–1532. doi: 10.1249/01.MSS.0000027714.70099.08
Watanabe, K., Kouzaki, M., and Moritani, T. (2014). Regional neuromuscular regulation within human rectus femoris muscle during gait. J. Biomech. 47, 3502–3508. doi: 10.1016/j.jbiomech.2014.09.001
Yilmaz, O. O., Senocak, O., Sahin, E., Baydar, M., Gulbahar, S., Bircan, C., et al. (2010). Efficacy of EMG-biofeedback in knee osteoarthritis. Rheumatol. Int. 30, 887–892. doi: 10.1007/s00296-009-1070-9
Keywords: wearable, electromyography, knee extension, EMG, validity, muscle contraction, mHealth
Citation: Molina-Molina A, Ruiz-Malagón EJ, Carrillo-Pérez F, Roche-Seruendo LE, Damas M, Banos O and García-Pinillos F (2020) Validation of mDurance, A Wearable Surface Electromyography System for Muscle Activity Assessment. Front. Physiol. 11:606287. doi: 10.3389/fphys.2020.606287
Received: 14 September 2020; Accepted: 06 November 2020;
Published: 27 November 2020.
Edited by:
Juan Manuel Murias, University of Calgary, CanadaReviewed by:
Rafael Azevedo, University of Calgary, CanadaJerome Koral, Université Jean Monnet, France
Luca Ruggiero, University of Milan, Italy
Copyright © 2020 Molina-Molina, Ruiz-Malagón, Carrillo-Pérez, Roche-Seruendo, Damas, Banos and García-Pinillos. This is an open-access article distributed under the terms of the Creative Commons Attribution License (CC BY). The use, distribution or reproduction in other forums is permitted, provided the original author(s) and the copyright owner(s) are credited and that the original publication in this journal is cited, in accordance with accepted academic practice. No use, distribution or reproduction is permitted which does not comply with these terms.
*Correspondence: Alejandro Molina-Molina, YWxqbmRyQGxpdmUuY29t