- 1Liver Transplantation Center, National Clinical Research Center for Digestive Diseases, Beijing Friendship Hospital, Capital Medical University, Beijing, China
- 2Clinical Center for Pediatric Liver Transplantation, Capital Medical University, Beijing, China
- 3Department of Intensive Care Unit, Beijing Friendship Hospital, Capital Medical University, Beijing, China
- 4Department of Gastroenterology and Hepatology, The First Medical Center, Chinese PLA General Hospital, Beijing, China
Background and Aims: Biliary atresia (BA) is an idiopathic neonatal cholestasis and is the most common indication in pediatric liver transplantation (LT). Previous studies have suggested that the gut microbiota (GM) in BA is disordered. However, the effect of LT on gut dysbiosis in patients with BA has not yet been elucidated.
Methods: Patients with BA (n = 16) and healthy controls (n = 10) were recruited. In the early life of children with BA, Kasai surgery is a typical procedure for restoring bile flow. According to whether BA patients had previously undergone Kasai surgery, we divided the post-LT patients into the with-Kasai group (n = 8) and non-Kasai group (n = 8). Fecal samples were collected in both the BA and the control group; among BA patients, samples were obtained again 6 months after LT. A total of 40 fecal samples were collected, of which 16 were pre-LT, 14 were post-LT (8 were with-Kasai, 6 were non-Kasai), and 10 were from the control group. Metagenomic sequencing was performed to evaluate the GM.
Results: The Kruskal-Wallis test showed a statistically significant difference in the number of genes between the pre-LT and the control group, the pre-LT and the post-LT group (P < 0.05), but no statistical difference between the post-LT and the control group. Principal coordinate analysis also showed that the microbiome structure was similar between the post-LT and control group (P > 0.05). Analysis of the GM composition showed a significant decrease in Serratia, Enterobacter, Morganella, Skunalikevirus, and Phifllikevirus while short chain fatty acid (SCFA)-producing bacteria such as Roseburia, Blautia, Clostridium, Akkermansia, and Ruminococcus were increased after LT (linear discriminant analysis > 2, P < 0.05). However, they still did not reach the normal control level. Concerning functional profiles, lipopolysaccharide metabolism, multidrug resistance, polyamine biosynthesis, GABA biosynthesis, and EHEC/EPEC pathogenicity signature were more enriched in the post-LT group compared with the control group. Prior Kasai surgery had a specific influence on the postoperative GM.
Conclusion: LT partly improved the GM in patients with BA, which provided new insight into understanding the role of LT in BA.
Introduction
The gut microbiome plays an important role in human health and comprises about 1014 resident microorganisms, including bacteria, viruses, fungi, and archaea. Among these, bacteria are dominant (Lozupone et al., 2012). Gut microbiota (GM) provides energy and nutrients to intestinal epithelial cells by producing short-chain fatty acids (SCFAs). It can also promote gut immunity by acting on the toll-like receptor (TLR) (Singh et al., 2017). Inversely, it will lead to systemic infections when the microbiota balance is broken (Zhang et al., 2015). Accumulating literature suggests that GM imbalance occurs in many diseases such as liver disease (Miura and Ohnishi, 2014; Tilg et al., 2016), metabolic disease (Burcelin, 2017), cardiovascular disease (Ahmadmehrabi and Tang, 2017; Kazemian et al., 2020), inflammatory bowel disease (Nishida et al., 2018) and neurodegenerative disease (Quigley, 2017), and it plays a driving role in disease progression. By studying the role of GM in the management of illness, therapeutic measures have been developed to intervene in disease progression or complications, such as antibiotics, probiotics, prebiotics, and symbiotics.
Concerning end-stage liver disease, liver transplantation (LT) is the only cure. Biliary atresia (BA) is one of the most common indications for LT in children. BA is a devastating fibro-inflammatory disease that affects both extra- and intrahepatic bile ducts, its incidence ranges from 1/5,000 to 1/18,000. Prolonged neonatal jaundice, pale stools, and conjugated hyperbilirubinemia are the typical symptoms. Moreover, BA is a major cause of pediatric cholestasis (Feldman and Mack, 2015). Kasai surgery is typically performed to restore bile flow in early BA; however, up to 80% of patients will eventually require LT. Thus, Kasai is the standard first procedure for BA, and LT is reserved as a complementary and final therapy. Sun et al. (2017) demonstrated that LT significantly improved GM in adults with liver disease; GM disorders were also demonstrated in children with BA in our previous study. Nevertheless, the effect of LT on BA has not been described. Wang et al. (2016) summarized the impact of prior Kasai surgery on the clinical outcomes of LT and concluded that it might increase the risk of postoperative infection. However, the effect of prior Kasai surgery on the GM after LT is unknown.
Therefore, the present study aimed to investigate the effect of LT and describe the status of GM after LT in children with BA and the effect of prior Kasai surgery on the postoperative GM. Metagenomic sequencing was performed to evaluate the composition and function of the gut microbiome in feces.
Materials and Methods
Study Design
We collected stool samples from BA and healthy subjects at Beijing Friendship Hospital, Capital Medical University. Samples from BA patients were collected before and 6 months after LT. The point of post-LT timeframe was chosen to avoid immediate and transient postoperative complications (Jiang et al., 2018). Patients and controls were age-matched. Their dietary habits were similar. The following conditions in the enrolled group were met: (1) No digestive diseases within 1 month; (2) No antibiotics and probiotics within 1 month; and (3) age < 3 years. The diagnosis of BA was confirmed by intraoperative cholangiography and liver biopsy. The liver function index of controls was in the normal range. In patients with BA, preoperative data included age, body mass index (BMI), sex, pediatric end-stage liver disease (PELD) score, liver enzymes (ALT: alanine aminotransferase, AST: aspartate aminotransferase, ALP: alkaline phosphatase, GGT: γ-glutamyltransferase), and inflammatory cytokines (IL-2: interleukin-2, IL-4: interleukin-4, IL-6: interleukin-6, IL-10: interleukin, TNFα: tumor necrosis factor α, IFN-γ: interferon-γ), We examined liver function indexes and inflammatory factors again after LT. Metagenomic sequencing can analyze species composition and functional metabolism in greater depth.
Sample Collection and DNA Extraction
All samples were stored at –80°C within four hours of collection. Bacterial DNA was extracted using the QIAamp Fast DNA Stool Mini Kit (51604; Qiagen, Hilden, Germany). Ten micrograms of stool sample was weighed in a centrifuge tube, approximately 25 mg of pre-cooled submerged beads were added, and then 200 μL of acetonitrile/methanol (v/v = 8:2) solvent containing 10 μL of an internal standard for homogenous mixing was added and centrifuged at 13,500 rpm and 4°C for 20 min to remove proteins. After centrifugation, 10 μL supernatant was obtained, diluted with 90 μL of 1:1 acetonitrile/methanol (v/v = 80/20) and ultrapure water mixed solvent, shaken and centrifuged for analysis. The injection volume was 5 μL. The detailed extraction steps followed the QIAamp® Fast DNA Stool Mini Handbook instructions. The DNA concentration was measured with a NanoDrop (Thermo Fisher Scientific, MA, United States) and Qubit®2.0 (Invitrogen, Carlsbad, CA, United States), and the molecular size was estimated by agarose gel electrophoresis.
Metagenomic Sequencing
Following the Illumina TruSeq DNA Sample Prep v2 Guide (San Diego, CA, United States), we constructed the DNA paired-end libraries with an insert size of 500 bp for the 40 stool samples (16 from pre-LT, 14 from post-LT, and 10 from controls). The quality of all libraries was evaluated using an Agilent 2100 bioAnalyzer (Agilent Technologies, Wokingham, United Kingdom) and an Agilent 2100 DNA 1000 kit. All samples were subjected to 150-bp paired-end sequencing on an Hiseq X-ten platform (Illumina). Illumina raw reads were screened according to the following criteria: (1) adaptor contamination reads were removed; (2) reads containing more than three ambiguous N bases were removed; (3) reads containing low quality (Q < 20) bases were trimmed; (4) reads containing less than 60% of high-quality bases (Phred score ≥ 20) were deleted.
Clean reads were subjected to bacterial genomes from the National Center for Biotechnology Information GenBank with SOAPaligner (version 2.21), and reads mapped to the host genome were abandoned.
For species classification, the NCBI database1 (National Center for Biological Information) was used to align the clean reads with known bacteria, fungi, viruses, and archaea by SOAPaligner 2.21. With regard to the functional profiles, the non-redundant genes were annotated against the KEGG (Kyoto Encyclopedia of Genes and Genomes) database using BLAST (v. 2.2.28 +). When the assembled protein sequence was similar (score ≥ 60 and E < 1e–5) to a protein sequence in the database, the assembled protein was considered to play the same role as the database protein. The relative abundance of all orthologous genes was accumulated to generate the relative abundance of each KO (KEGG ortholog).
Statistical Analysis
Statistical analyses were completed using R v.3.3.1. The non-parametric Wilcoxon test and Kruskal-Wallis test were performed to analyze the different species or functional profiles. Differences were considered significant at P < 0.05 or a false discovery rate (FDR) < 0.1. Differences in taxa and functional profiles at various levels were evaluated by Wilcoxon rank testing and linear discriminant analysis (LDA) effect size (LEfSe), where a higher LDA score reflected a more prominent difference in abundance between the different groups. The LDA score cut-off of 2.0 indicated a significant difference. Spearman’s rank correlation was used to examine associations among variables. Fishtaco was used to analyze the contribution of species to differential metabolic pathways.
Results
Study Population
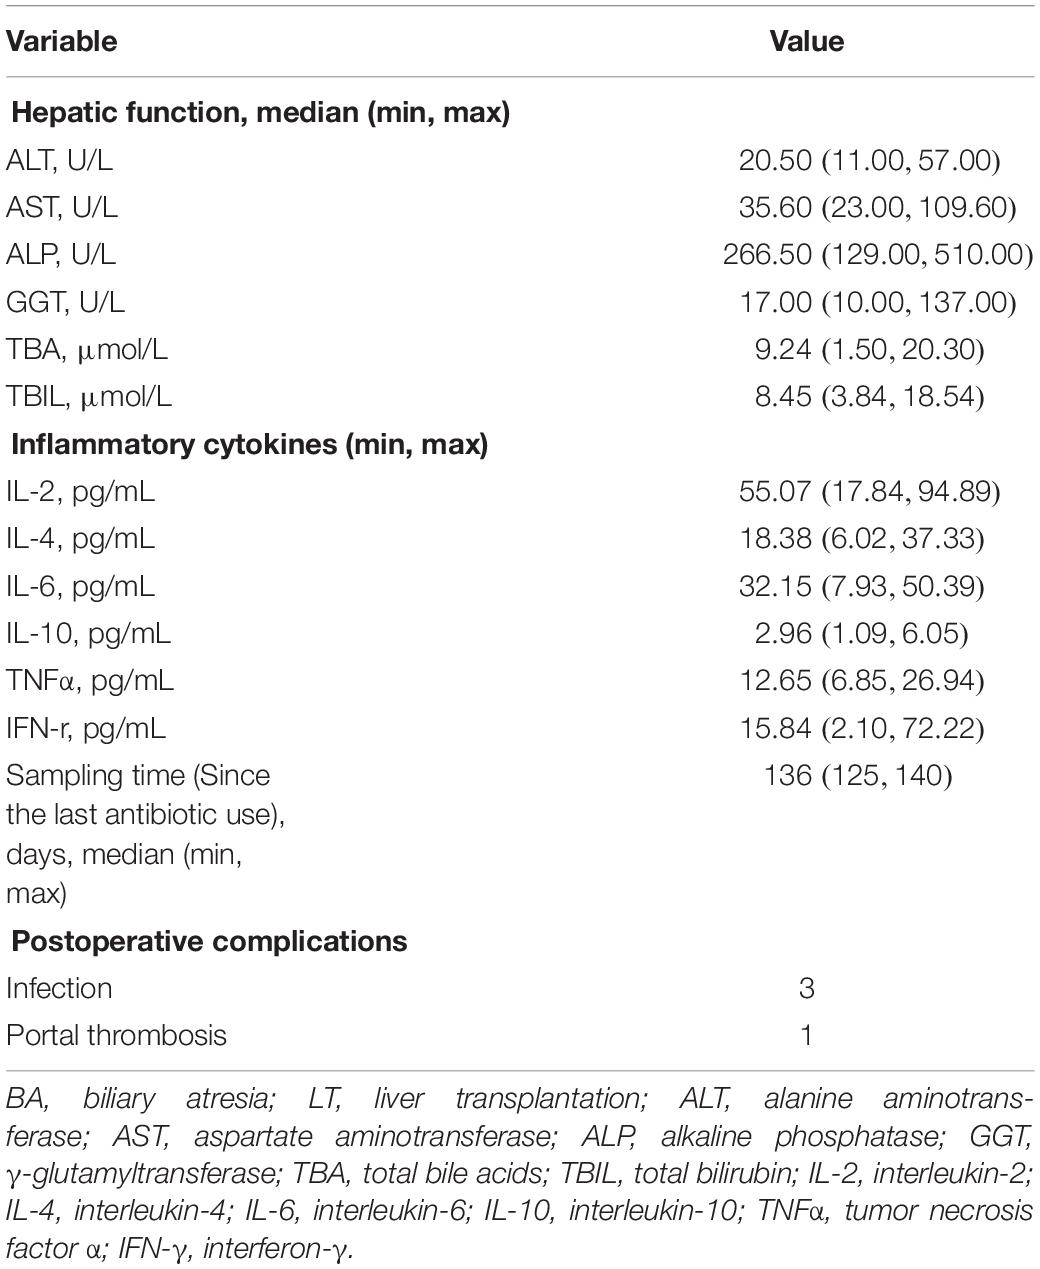
Forty stool samples were obtained from twenty-six participants enrolled in this study, including 16 pre-LT, 14 post-LT, and 10 control samples. In the post-LT group, two patients had diarrhea at the sampling time, which did not meet the inclusion criteria of this study, so their samples were not collected. All BA patients received orthotopic liver transplantation (OLT). After the operation, they were given immunosuppressive therapy with tacrolimus and methylprednisolone. In the first 5–7 days after LT, the patients received broad-spectrum antibiotics with cephalosporin to prevent infection. The clinical data of the enrolled individuals and demographic information are shown in Tables 1, 2. The results of metagenomic sequencing and assembly data in each sample are listed in Supplementary Table 2.
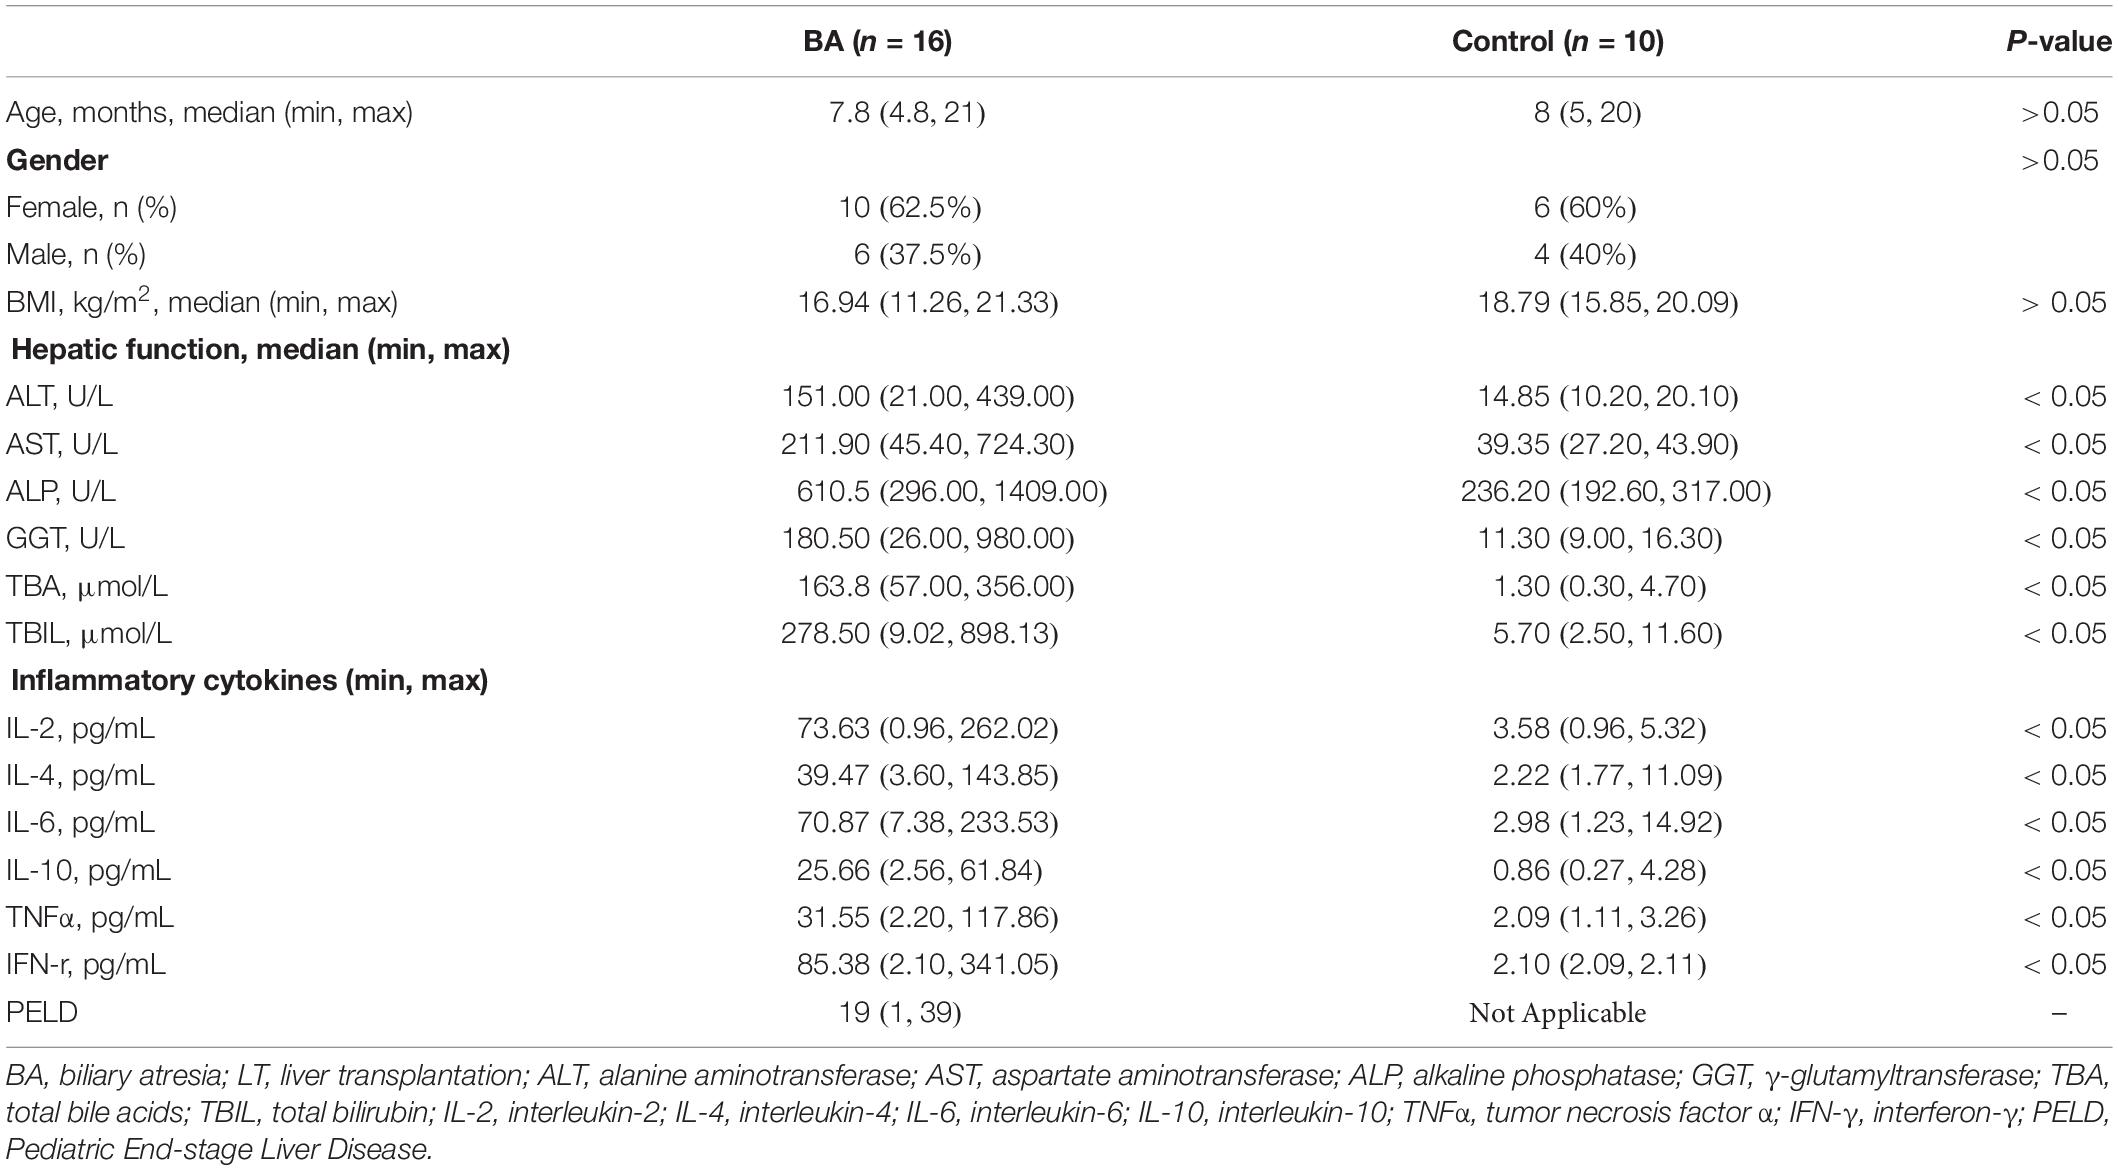
Table 1. Demographic information and clinical data on patients with BA (pre-LT) and control individuals.
Impact of LT on GM in BA Individuals
Principal coordinate analysis (PCoA) was performed to analyze GM composition structure between the three groups (pre-LT, post-LT, and control group), which showed that the structure of the post-LT group was between the pre-LT group and the control group (Figure 1A). Figure 1B shows that the microbiome structure was similar between the post-LT and control group (P > 0.05). The Kruskal-Wallis test showed a statistically significant difference in the number of genes between the pre-LT and the control group, the pre-LT, and the post-LT group, but no statistical difference between the post-LT and the control group (Figure 1C). The ternary plot also indicated the GM composition differences between the three groups (Figure 1D). More species were seen in the control group than in the other two groups. Bacteroidetes and Firmicutes were enriched in the control group. Proteobacteria was predominant in the pre-LT group, and the post-LT group consisted of a mixture of control and pre-LT species. Taken together, LT significantly changed GM composition in patients with BA.
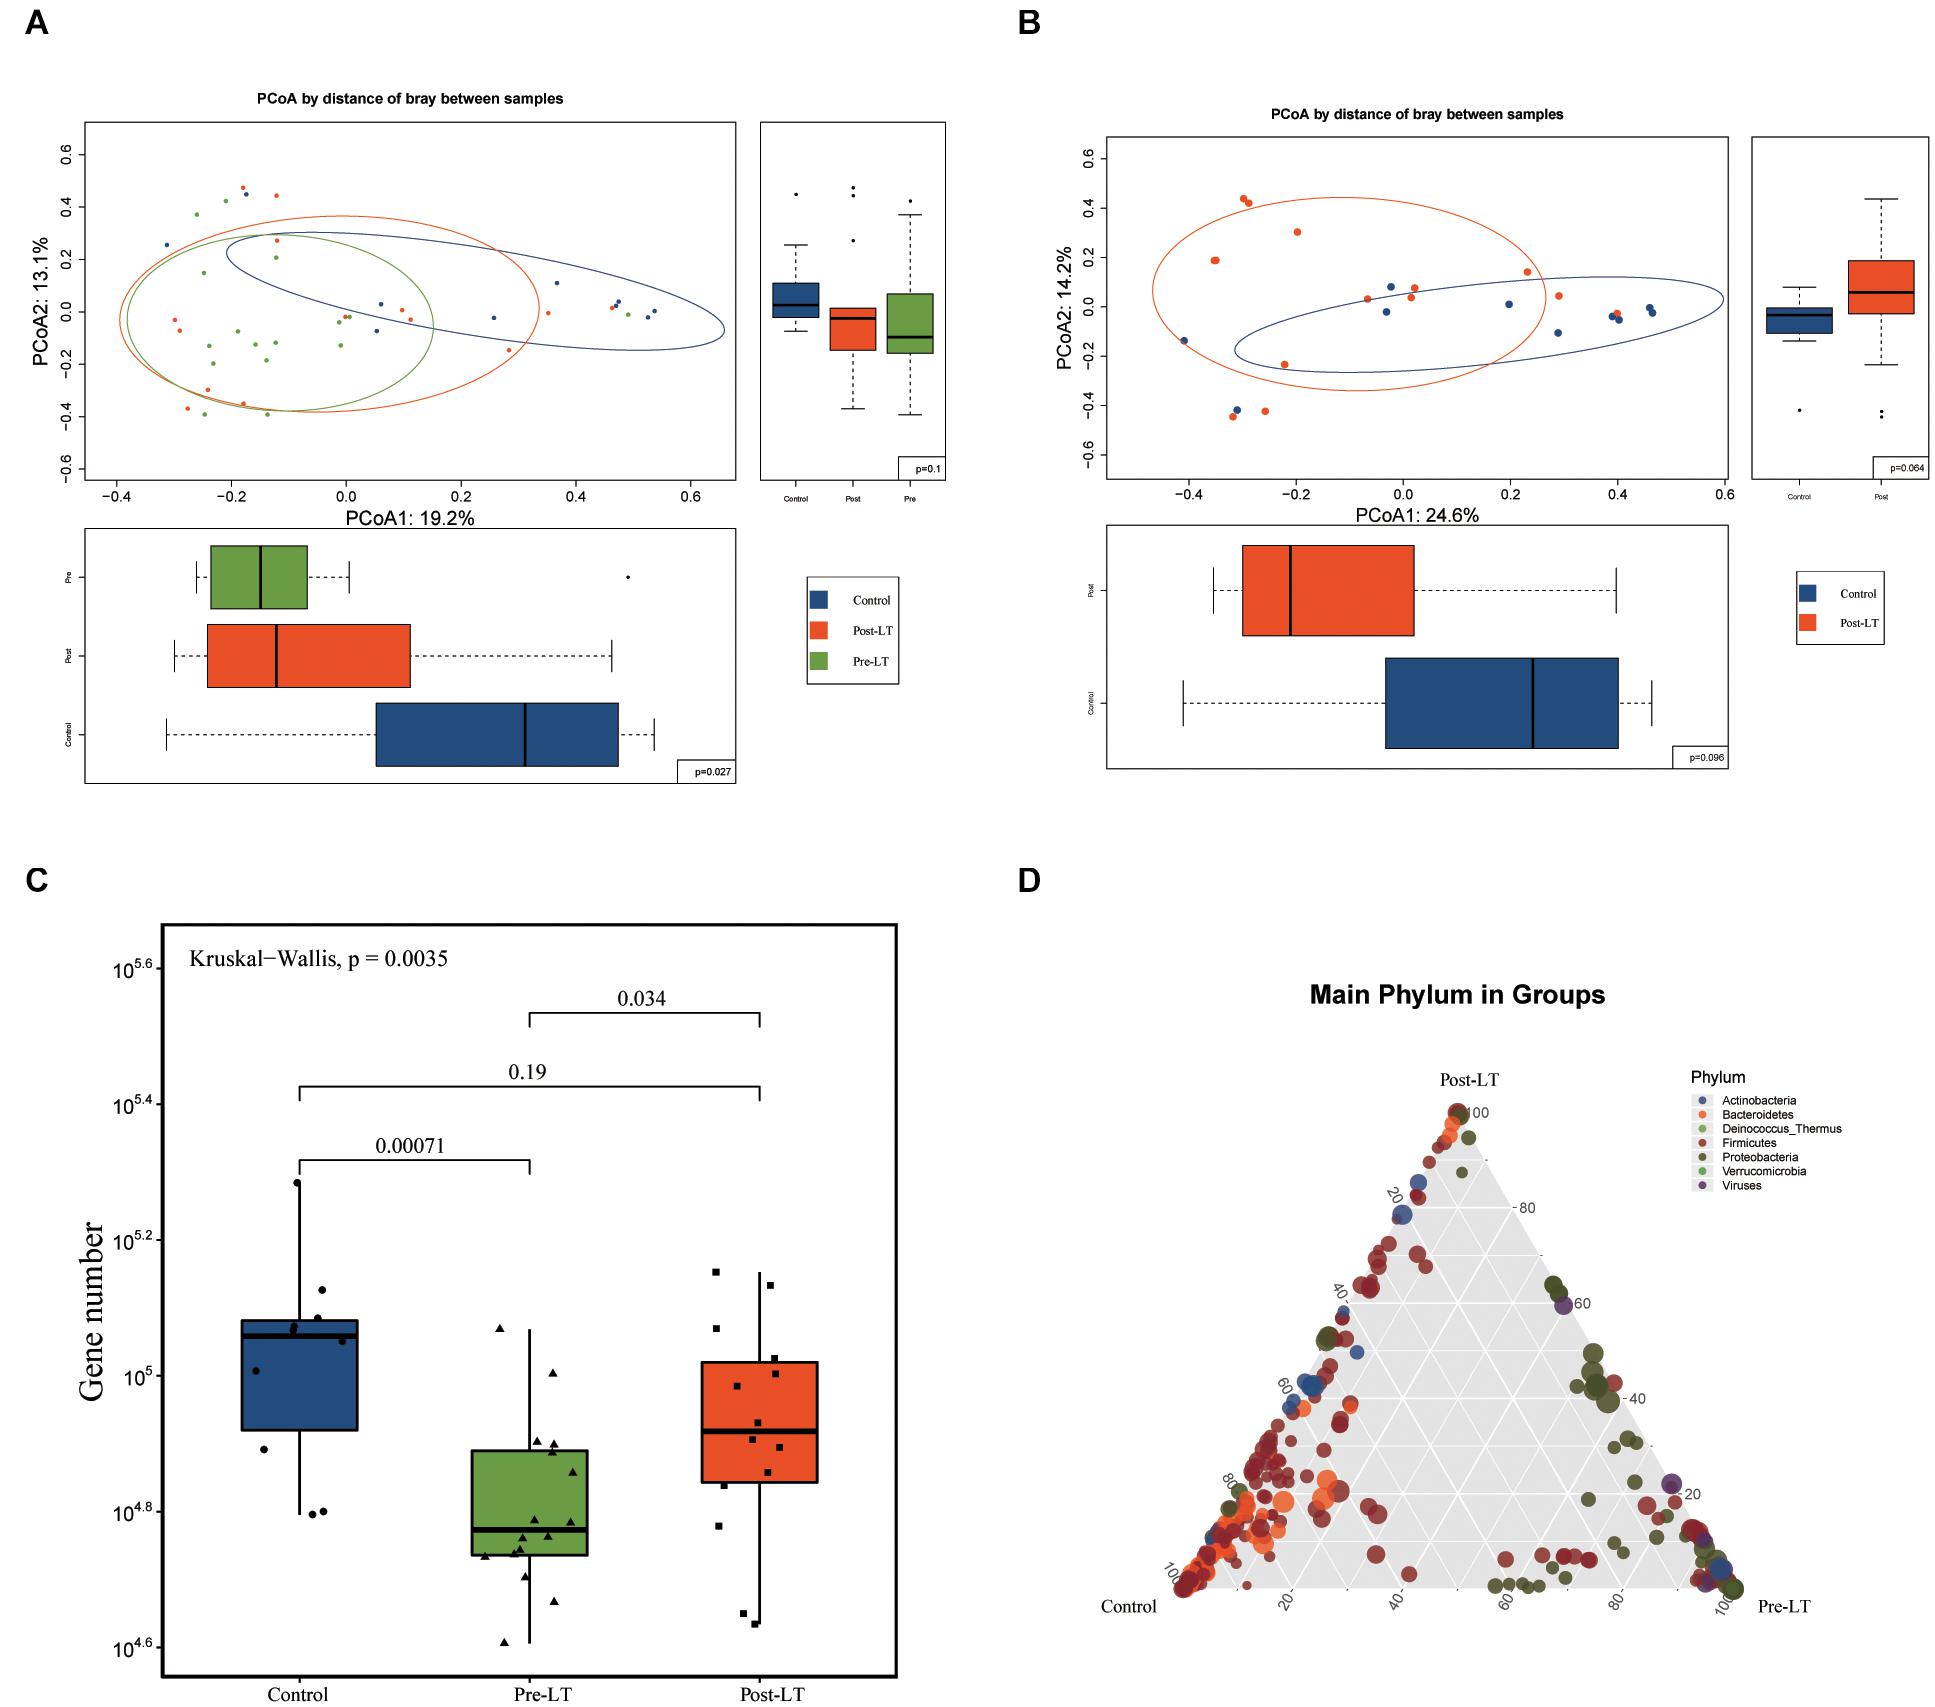
Figure 1. (A) Structural changes in the gut microbiota in pre-LT, post-LT, and control individuals (principal coordinate analysis based on the Bray–Curtis distance of species abundance). (B) Structural changes in the gut microbiota in pre-LT and post-LT individuals (principal coordinate analysis based on the Bray–Curtis distance of species abundance). (C) Different gene numbers between the three groups (Wilcoxon rank-sum test). (D) Ternary plot of different species. The three vertices represent the three different groups, the points represent the different species at the species level, and the size of the points represent the average abundance in the three groups of samples. Points that are enriched in a certain color at a vertex indicate higher species abundance at the phylum level represented by the color in the grouping.
The Venn diagram demonstrates the shared and unique genera between the three groups (Figure 2A). Nine hundred and eighty-nine genera were shared among the three groups, while 83, 125, and 204 were unique in the control, pre-LT, and post-LT groups, respectively. Moreover, 1,129 genera were shared between the control and post-LT groups, and 1,022 genera were shared between the control and pre-LT groups. It also proved a shift in GM composition to the control group after LT surgery.
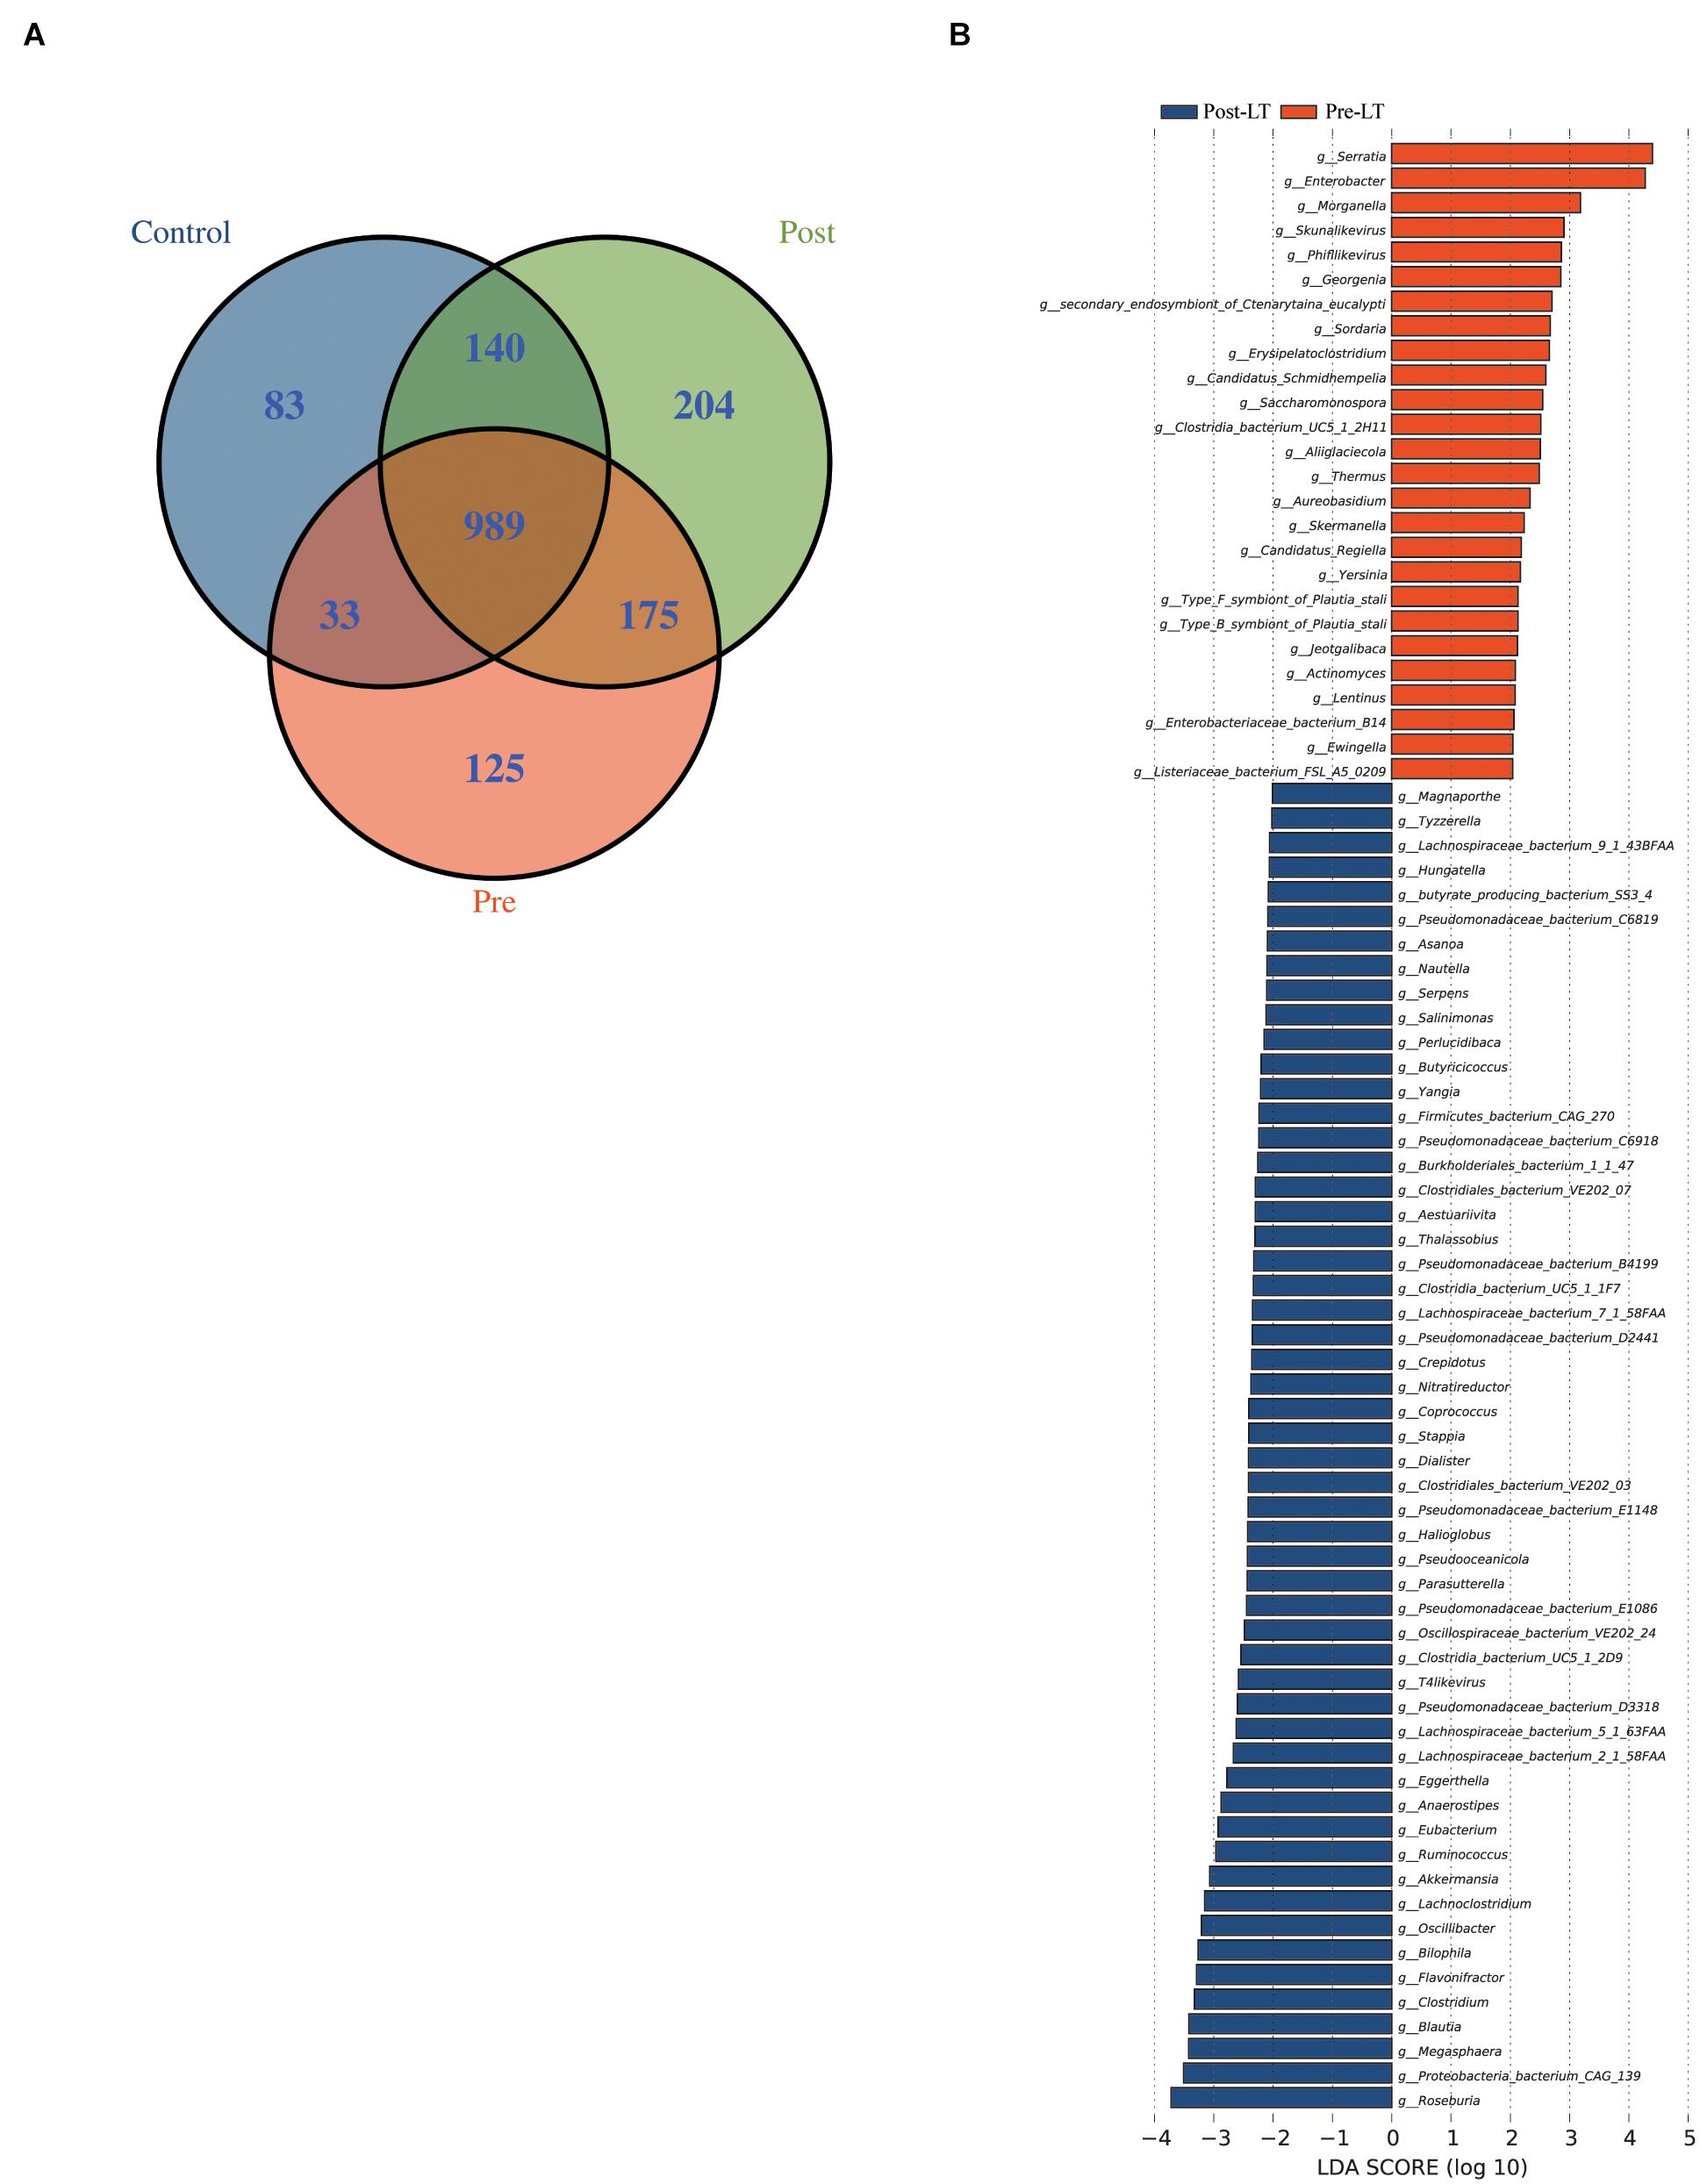
Figure 2. (A) Venn diagram of the pre-LT, post-LT, and control groups. (B) LEfSe analysis of the gut microbiota composition between the pre-LT and post-LT groups. Histogram of the LDA scores calculated for the differential abundance of genera in the two groups. Different colors represent different groups.
Next, LEfSe was performed to analyze the different species between the pre-LT and post-LT groups. It was shown that 26 and 54 genera were enriched in the pre-LT and post-LT groups, respectively. Serratia, Enterobacter, Morganella, Skunalikevirus, and Phifllikevirus were enriched in the pre-LT group, while Roseburia, Blautia, Clostridium, Akkermansia, Ruminococcus, and Eubacterium were enriched in the post-LT group (Figure 2B and Supplementary Table 3). Concerning functional profiles, the Wilcoxon test showed that M00004 (pentose phosphate pathway), M00007 (pentose phosphate pathway), M00019 (valine/isoleucine biosynthesis), M00165 (reductive pentose phosphate cycle), and M00376 (3-hydroxypropionate bi-cycle) were enriched in the pre-LT group. In contrast M00175 (nitrogen fixation), M00422 (acetyl-CoA pathway), and M00652 (vancomycin resistance) were enriched in the post-LT group (Figure 3A and Supplementary Table 4). An abundance clustering heat map of different modules shown in Figure 3B. In the pathways, lipid metabolism, amino acid metabolism, carbohydrate metabolism, energy metabolism, xenobiotics biodegradation and metabolism, and cell motility significantly increased after LT (Supplementary Figure 1). The contribution of GM to metabolic pathways indicated that Serratia spp., Proteobacteria bacterium CAG 139, Enterobacter, Veillonella sp. CAG 933, and Streptococcus spp. constituted in the pre-LT group (Figure 4A). These are all inflammatory pathogenic bacteria. The composition of GM and functional metabolism both improved after LT.
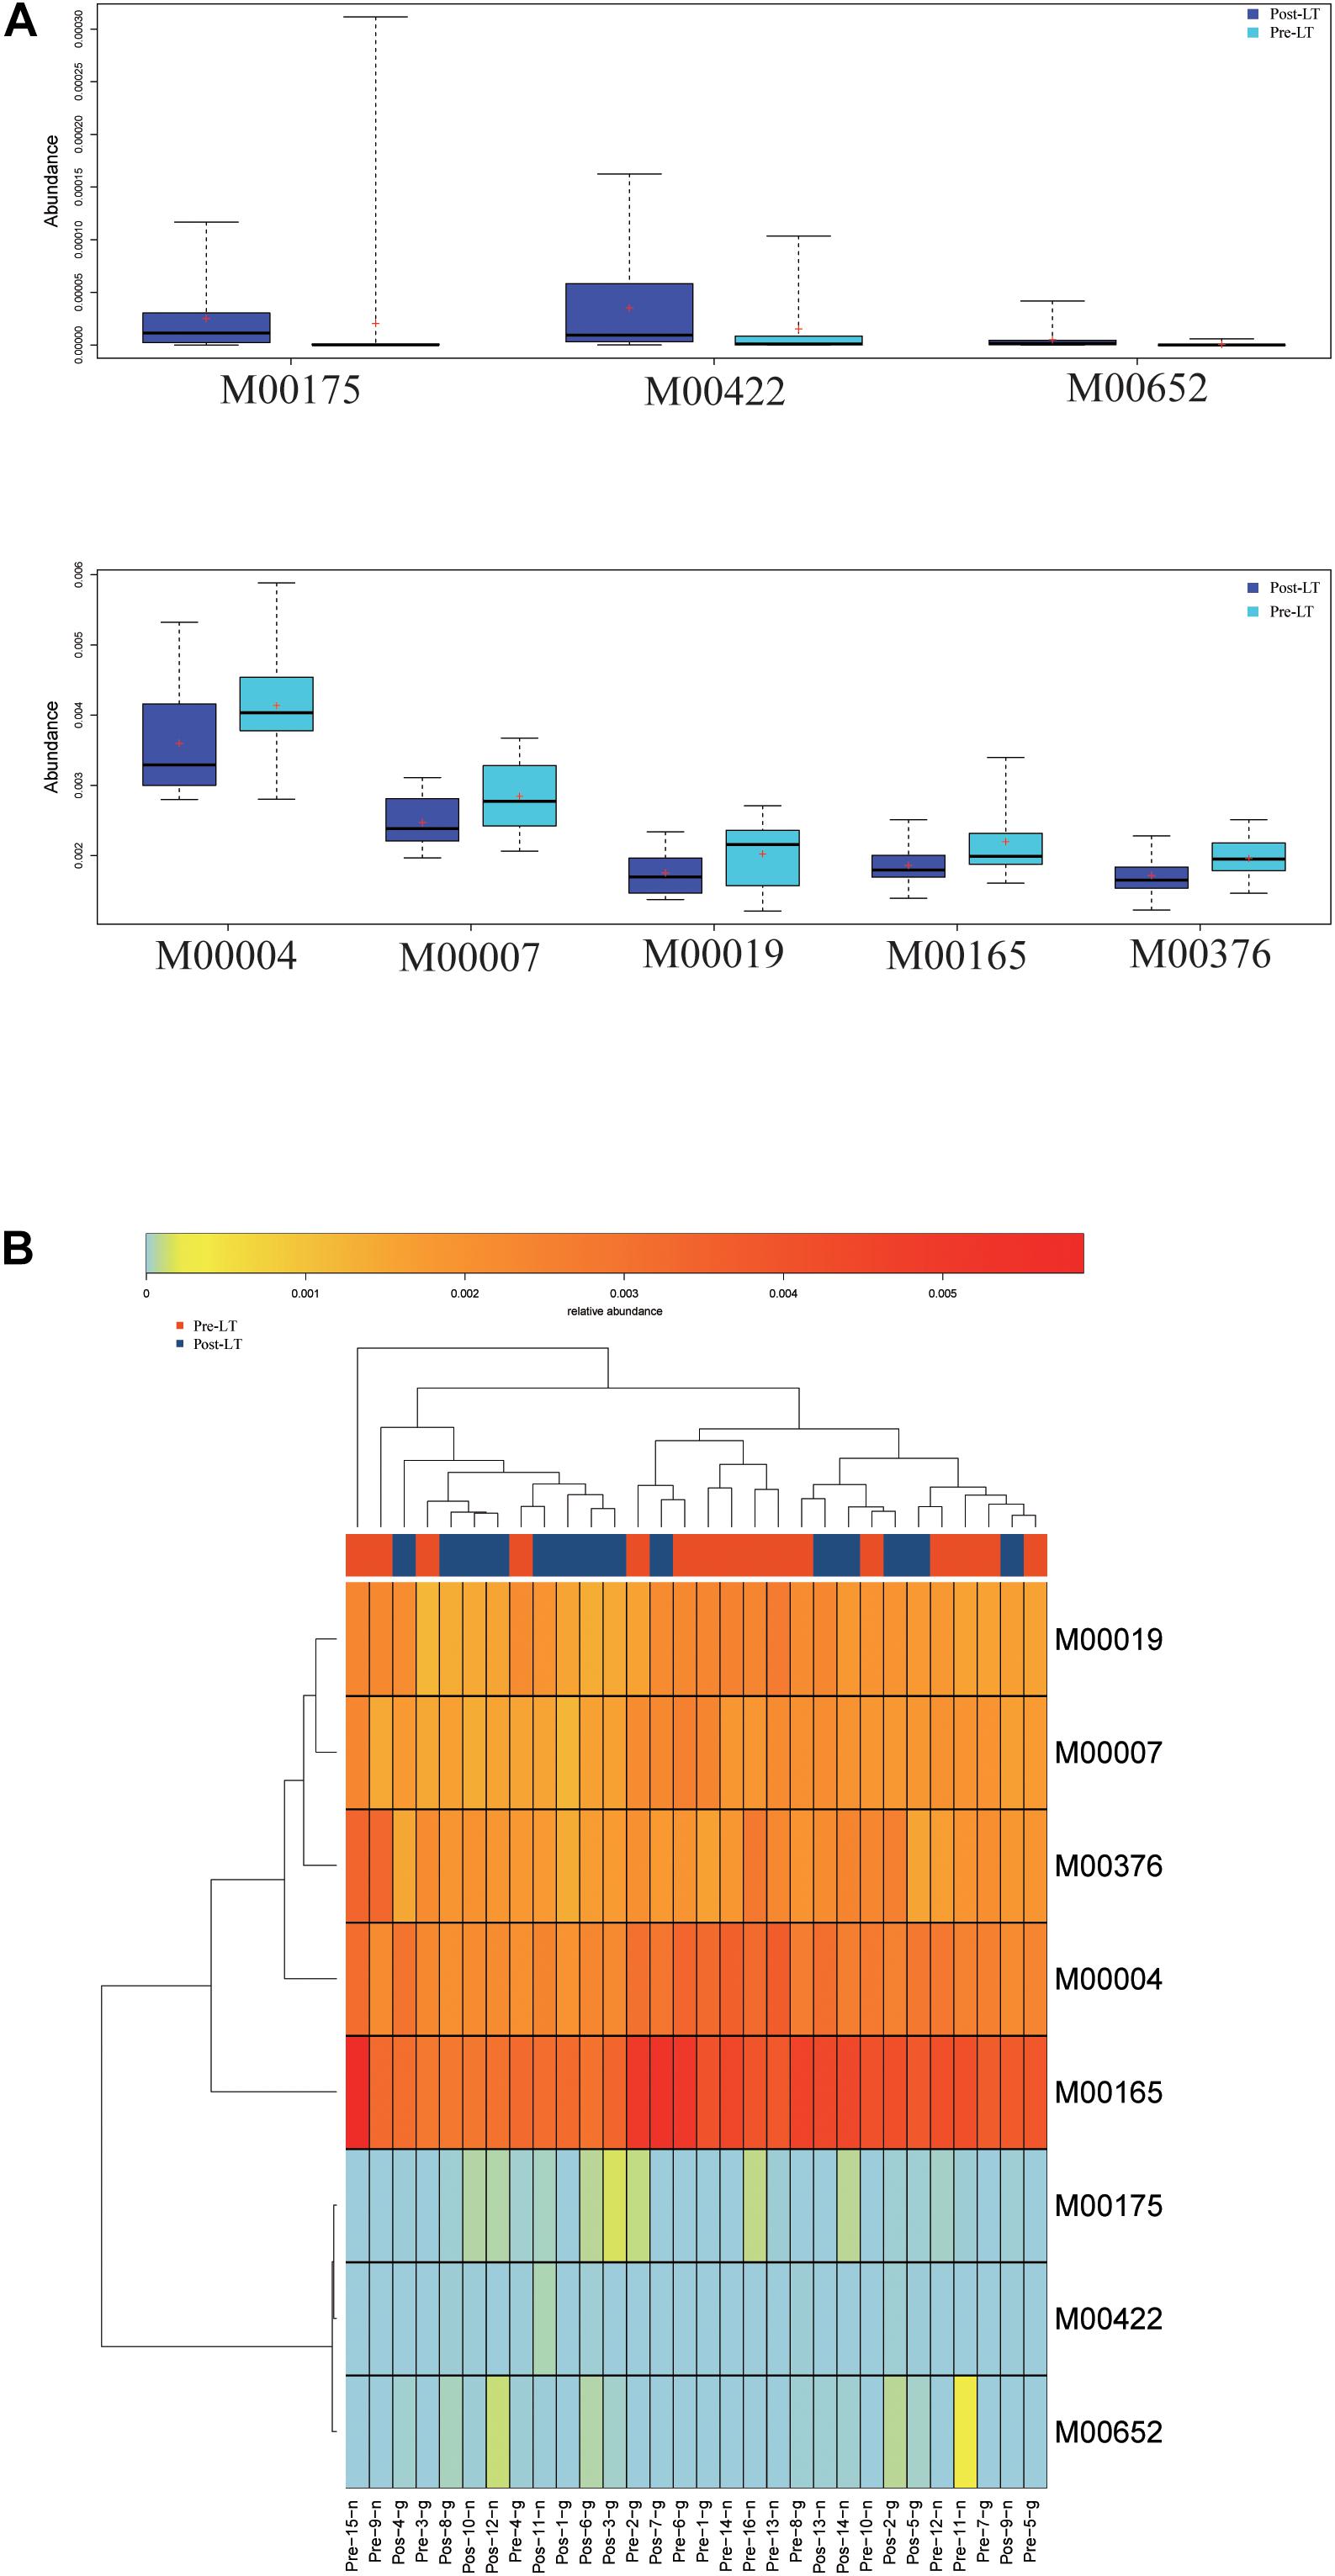
Figure 3. (A) Functional profiles with significantly different abundances at the module level between the pre-LT and post-LT groups (Wilcoxon rank-sum test, P < 0.05). Different colors represent different groups. (B) Hierarchical clustering between differential modules and samples.
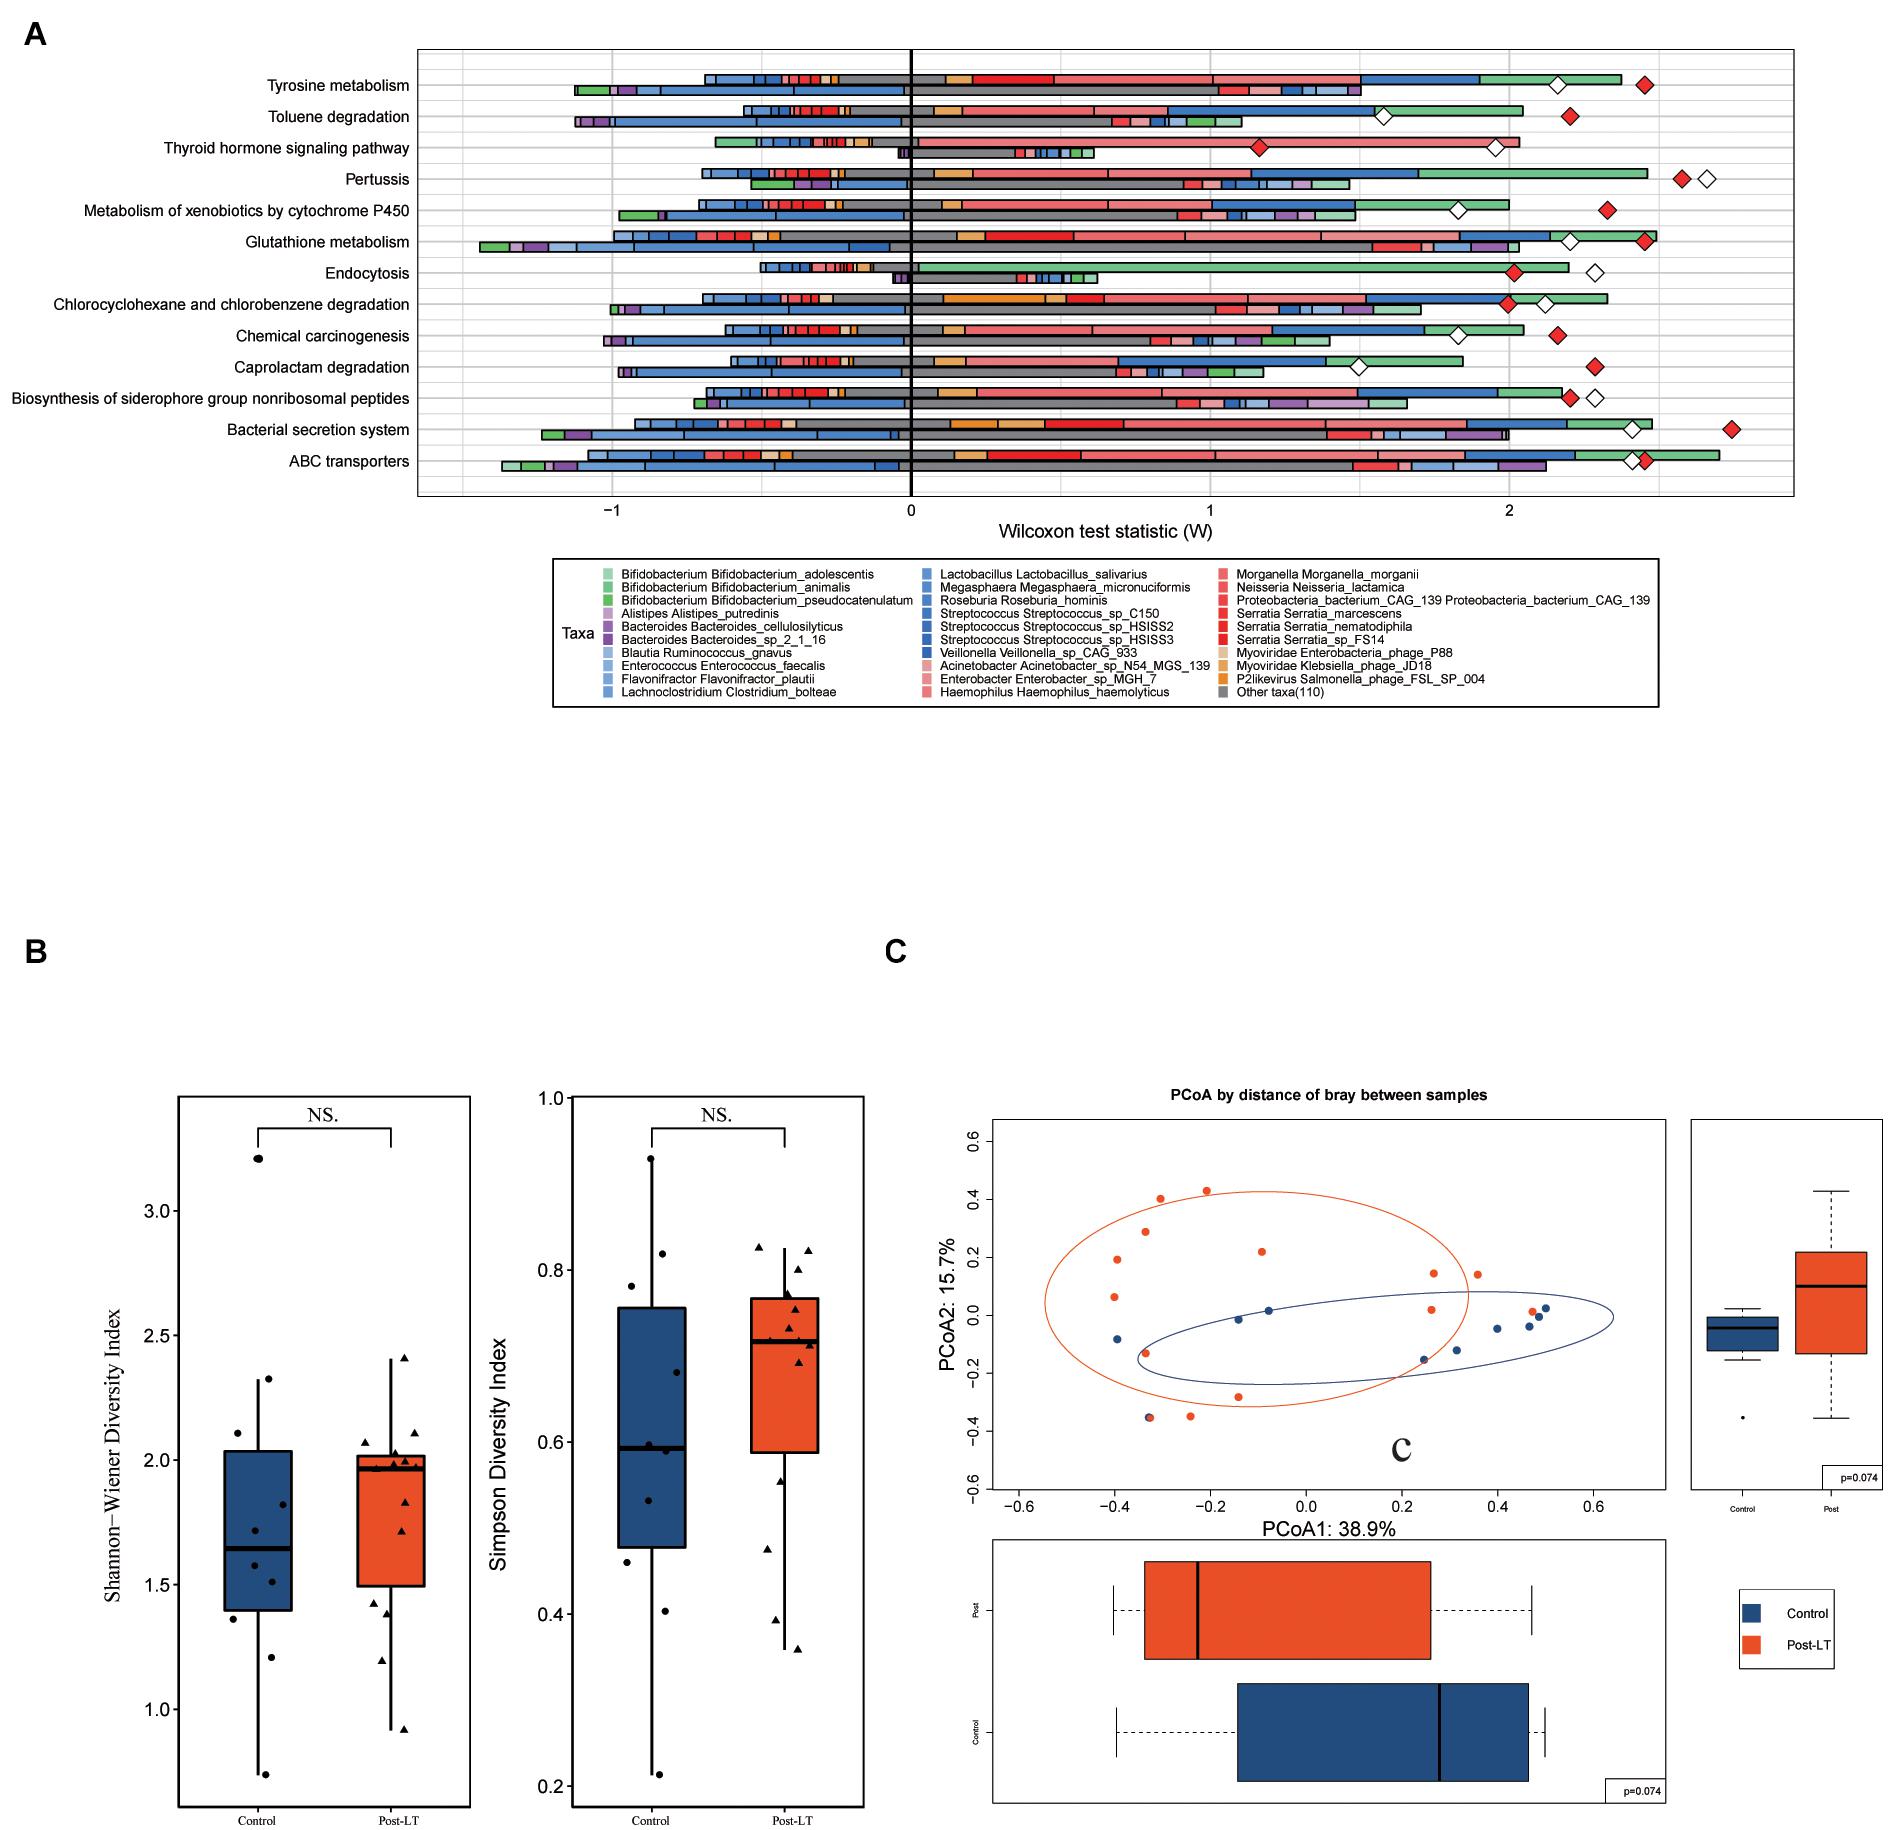
Figure 4. (A) Fishtaco analysis of species contribution to metabolic pathways between the pre-LT and post-LT groups. The x-axis represents the Wilcoxon test statistic scores, and the y-axis the related functions. The driving factors for each differential function transformation were divided into four parts, represented by a histogram in two directions. Gut microbiota in the pre-LT group that drove the increase in the corresponding functional abundance (top right); Gut microbiota in the pre-LT group that inhibited the increase in the corresponding functional abundance (top left); Gut microbiota in the post-LT group that drove the increase in the corresponding functional abundance (bottom right); and gut microbiota in the post-LT group that inhibited the increase in the corresponding functional abundance (bottom left). Different color bars represent the corresponding species. The longer the bar, the greater the driving or inhibiting effect of the species on the corresponding function. (B) Alpha diversity between the post-LT and control groups (box plot of richness, Shannon–Wiener Index, and Simpson Index). (C) Beta diversity between the post-LT and control groups (principal coordinate analysis based on the Bray–Curtis distance of species abundance).
Difference in GM Between the Post-LT and Control Groups
Alpha diversity was represented by the Shannon–Wiener Index and Simpson Index, and beta diversity by PCoA; there was no significant difference between the two groups (Figures 4B,C).
LEfSe analysis was used to further identify different species between the two groups. At the genus level, there were 37 different species. Enterobacteriaceae bacterium 291 EBAC, Oscillibacter, Klebsiella, Enterococcus, Epsilon15likevirus, Rouxiella, Bilophila, and Siphoviridae were enriched in the post-LT group. In contrast, Faecalibacterium, Blautia, Eubacterium, Clostridiales bacterium VE202 03, and Ruminococcus were enriched in the control group (Figure 5A and Supplementary Table 5). There were 41 and 68 different species enriched in the post-LT and control group at the species level, respectively. Shigella sp. PAMC 28760, Klebsiella sp. KTE92, Enterobacteriaceae bacterium 291 EBAC, Klebsiella pneumoniae, Escherichia phage phiV10, Klebsiella sp. MS 92 3, Klebsiella variicola, Klebsiella sp. D5A, Klebsiella sp. KGM IMP216, Klebsiella sp. 4 1 44FAA, and Escherichia phage TL 2011b were enriched in the post-LT group, while Faecalibacterium prausnitzii, uncultured Faecalibacterium sp., Roseburia sp. CAG 100, Bacteroides sp. D2, butyrate-producing bacterium SS3 4, Clostridiales bacterium VE202 03, Ruminococcus lactaris, Eubacterium eligens, Eubacterium eligens CAG 72, and Blautia sp. CAG 37 were enriched in the control group (Supplementary Figure 2 and Supplementary Table 6).
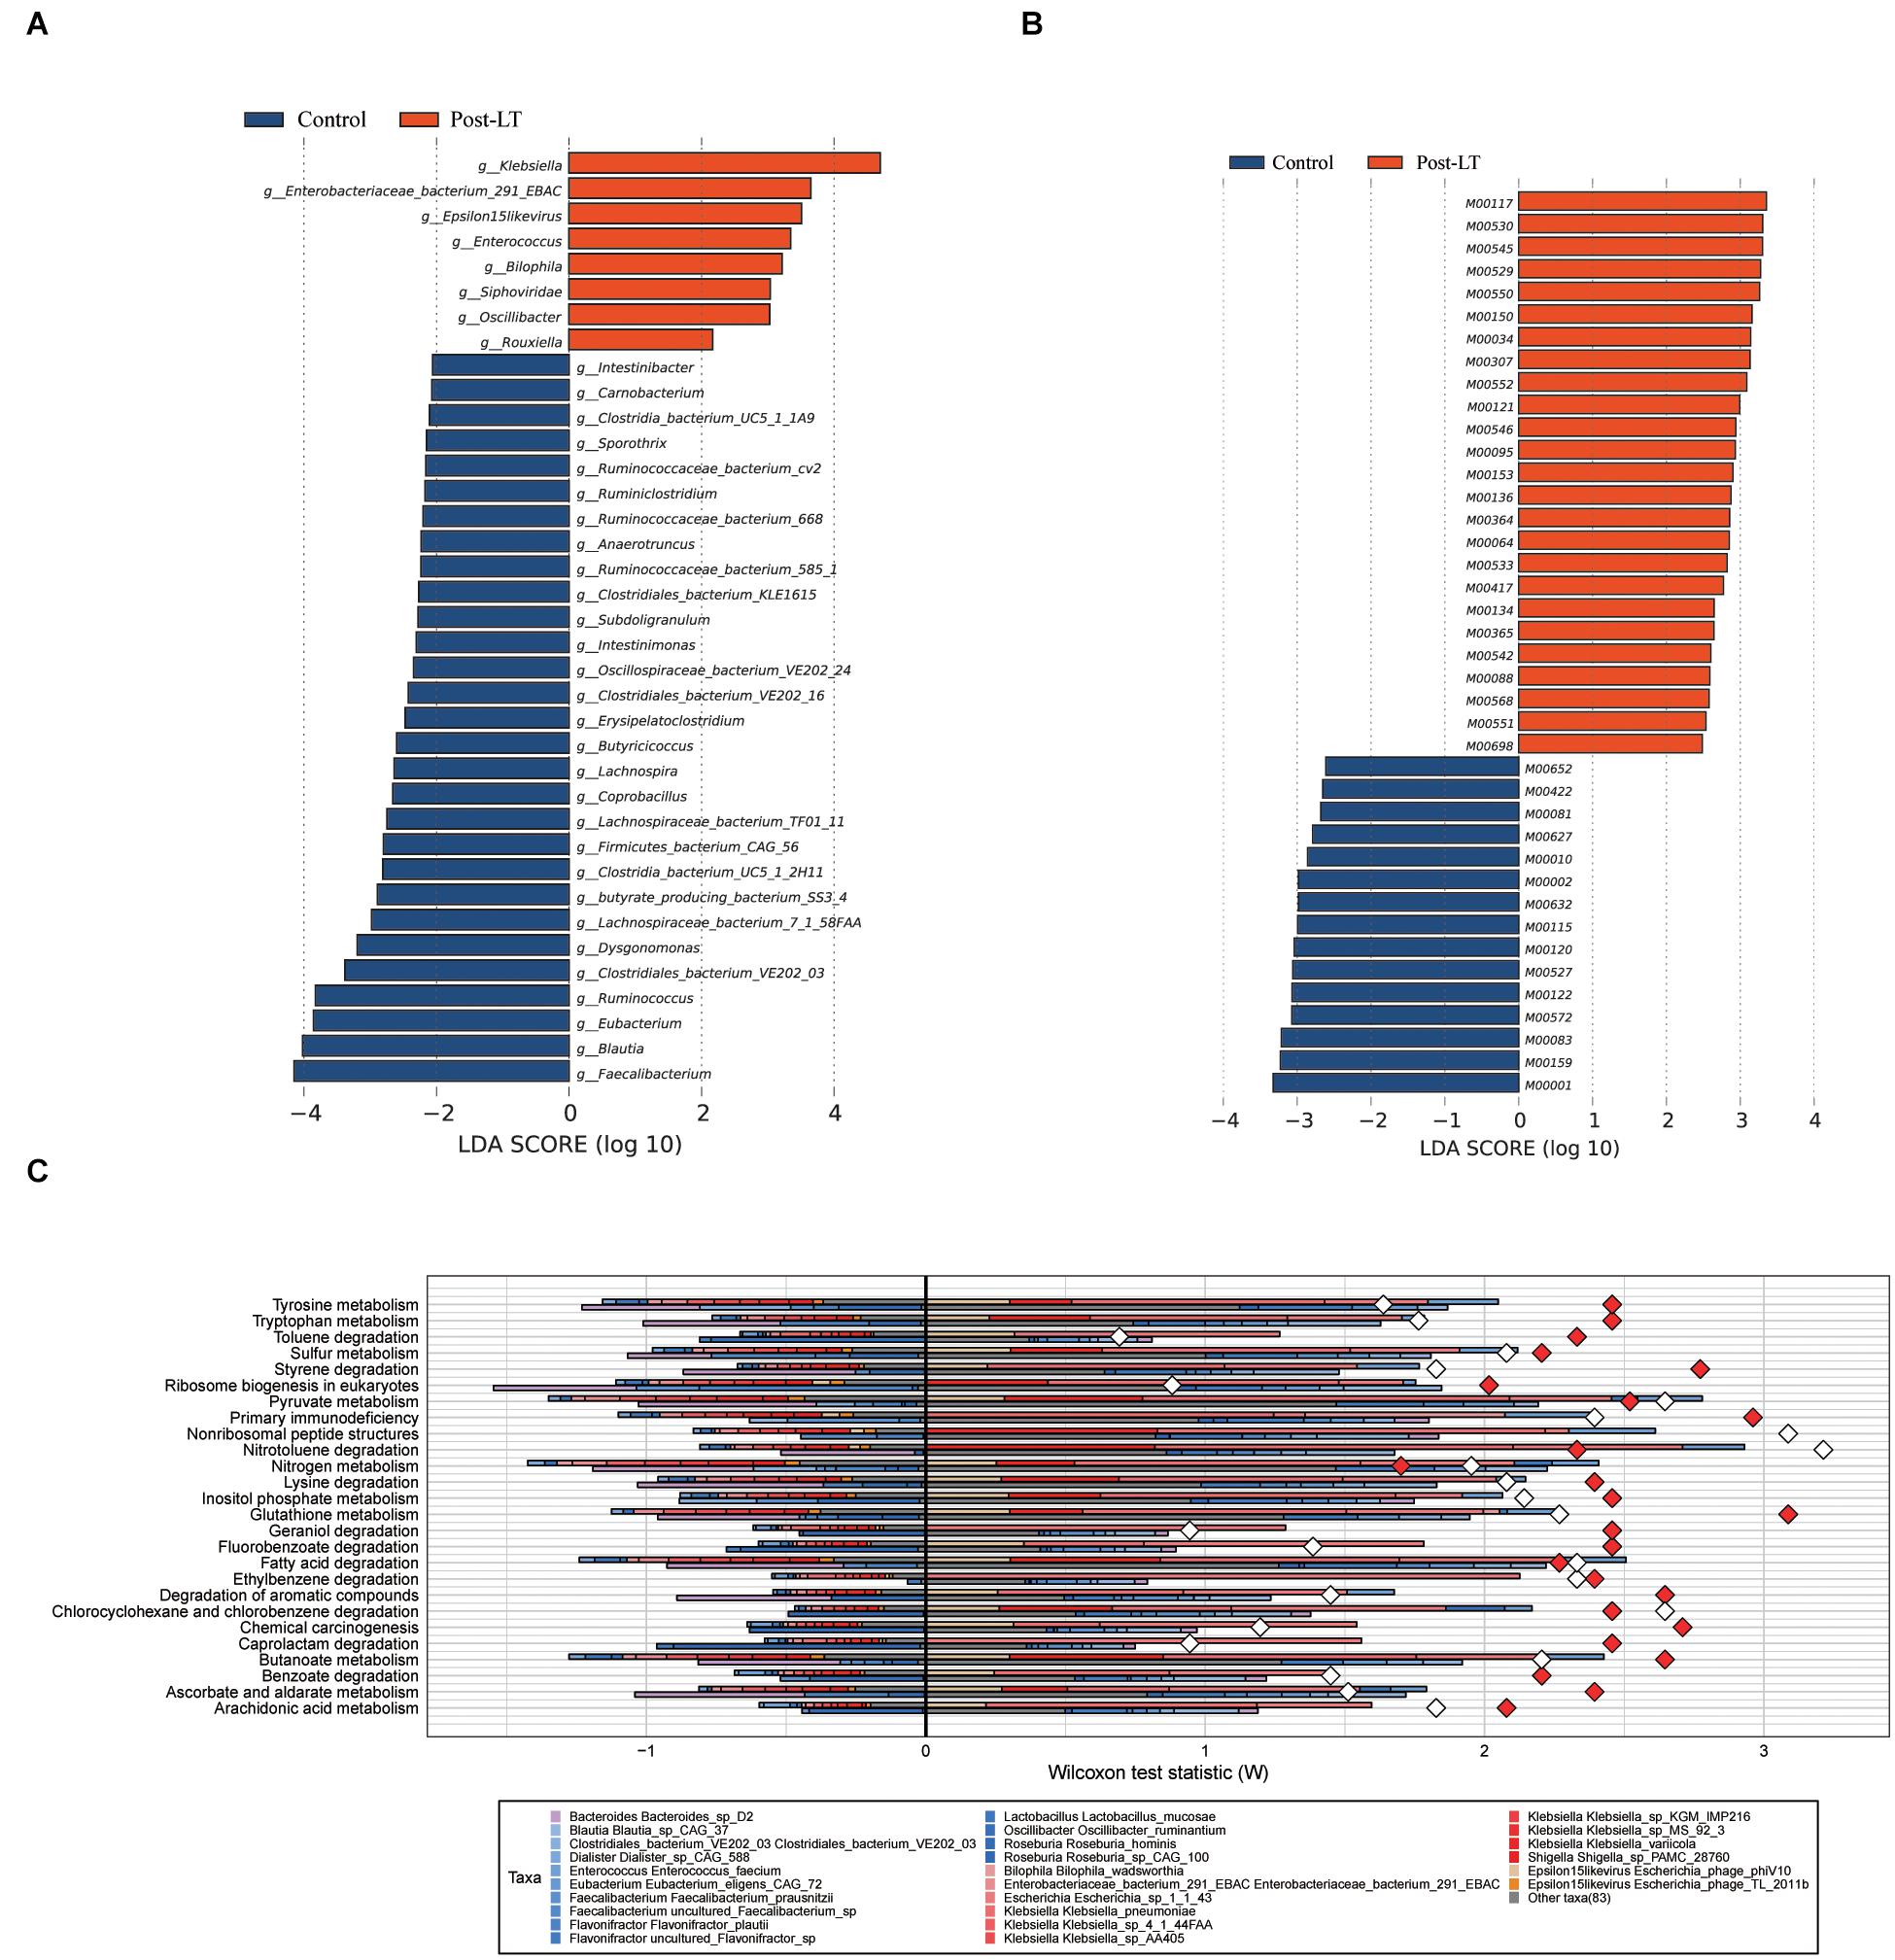
Figure 5. (A) LEfSe analysis of gut microbiota composition between post-LT and control groups. (B) LEfSe analysis of functional profiles between the two groups. Histogram of the LDA scores calculated for a differential abundance of genera in the two groups. Different colors represent different groups. (C) Fishtaco analysis of species contribution to metabolic pathways between the post-LT and control groups. The x-axis represents the Wilcoxon test statistic scores, and the y-axis the related functions. The driving factors for each differential function transformation were divided into four parts, represented by a histogram in two directions. Gut microbiota in the post-LT group that drove the increase in the corresponding functional abundance (top right); Gut microbiota in the post-LT group that inhibited the increase in the corresponding functional abundance (top left); Gut microbiota in the control group that drove the increase in the corresponding functional abundance (bottom right); and gut microbiota in the control group that inhibited the increase in the corresponding functional abundance (bottom left). Different color bars represent the corresponding species. The longer the bar, the greater the driving or inhibiting effect of the species on the corresponding function.
In functional metabolism, ABC transporters and Glycolysis/Gluconeogenesis were abundant in the post-LT group (Supplementary Table 7). LEfSe analysis showed that pathways related to lipopolysaccharide metabolism (M00064), multidrug resistance (M00698), cysteine and methionine metabolism (M00034), polyamine biosynthesis (M00134), GABA biosynthesis (M00136), and EHEC/EPEC pathogenicity signature (M00542) were enriched in the post-LT group. In contrast, beta-lactam resistance (M00627), vancomycin resistance (M00652), methane metabolism (M00422), and lysine metabolism (M00527) were enriched in the control group (Figure 5B, and Supplementary Table 8). Fishtaco analysis indicated that the composition of the GM that drove the metabolic pathways was different between the two groups (Figure 5C). Epsilon15likevirus, Shigella sp. PAMC 28760, Klebsiella spp., Escherichia sp. 1 1 43, Enterobacteriaceae bacterium 291 EBAC, and Bilophila wadsworthia played major driving roles in the post-LT group. In contrast, Roseburia sp. CAG 100, Roseburia hominis, Oscillibacter ruminantium, Lactobacillus mucosae, Flavonifractor spp., and Faecalibacterium prausnitzii were the primary driving species in the control group. Thus, the significantly different species between the post-LT and control groups were investigated; however, the overall structure of the GM was similar. In addition, the functional pathway was different between the two groups.
Relationship Between GM and Clinical Indicators
The relationship between different species identified in the post-LT and control groups and clinical indicators were analyzed by Spearman rank correlation (Figure 6A and Supplementary Table 9). It showed that Erysipelatoclostridium was positively correlated with ALT (P = 0.004, r = 0.71); Eubacterium sp. CAG 248 was negatively correlated with ALP (P = 0.004, r = −0.72); uncultured Faecalibacterium sp. was negatively correlated with GGT (P = 0.01, r = −0.65), while Enterococcus sp. GMD5E, Enterococcus sp. GMD3E, Enterococcus faecium, Escherichia phage TL 2011b, Enterococcus sp. GMD4E, and Enterococcus sp. GMD2E were all positively correlated with GGT (P = 0.01, r = 0.64; P = 0.01, r = 0.66; P = 0.01, r = 0.66; P = 0.01, r = 0.65; P = 0.01, r = 0.66; P = 0.01, r = 0.66, respectively); Shigella sp. PAMC 28760, Citrobacter sp. MGH100, and Escherichia sp. 1 1 43 were positively correlated with TBA (P = 0.004, r = 0.73; P = 0.02, r = 0.61; P = 0.006, r = 0.71, respectively), while uncultured Blautia sp., Lachnospiraceae bacterium TF01 11, Eubacterium sp. UNK MGS 26, Ruminococcus bromii, Eubacterium ventriosum, and Eubacterium eligens were negatively correlated with TBA (P = 0.02, r = −0.6; P = 0.02, r = −0.61; P = 0.02, r = −0.63; P = 0.01, r = −0.67; P = 0.002, r = −0.76; P = 0.02, r = −0.65, respectively). Taken together, liver functional indicators were positively correlated with species enriched in the post-LT group, while negatively correlated with the control group.
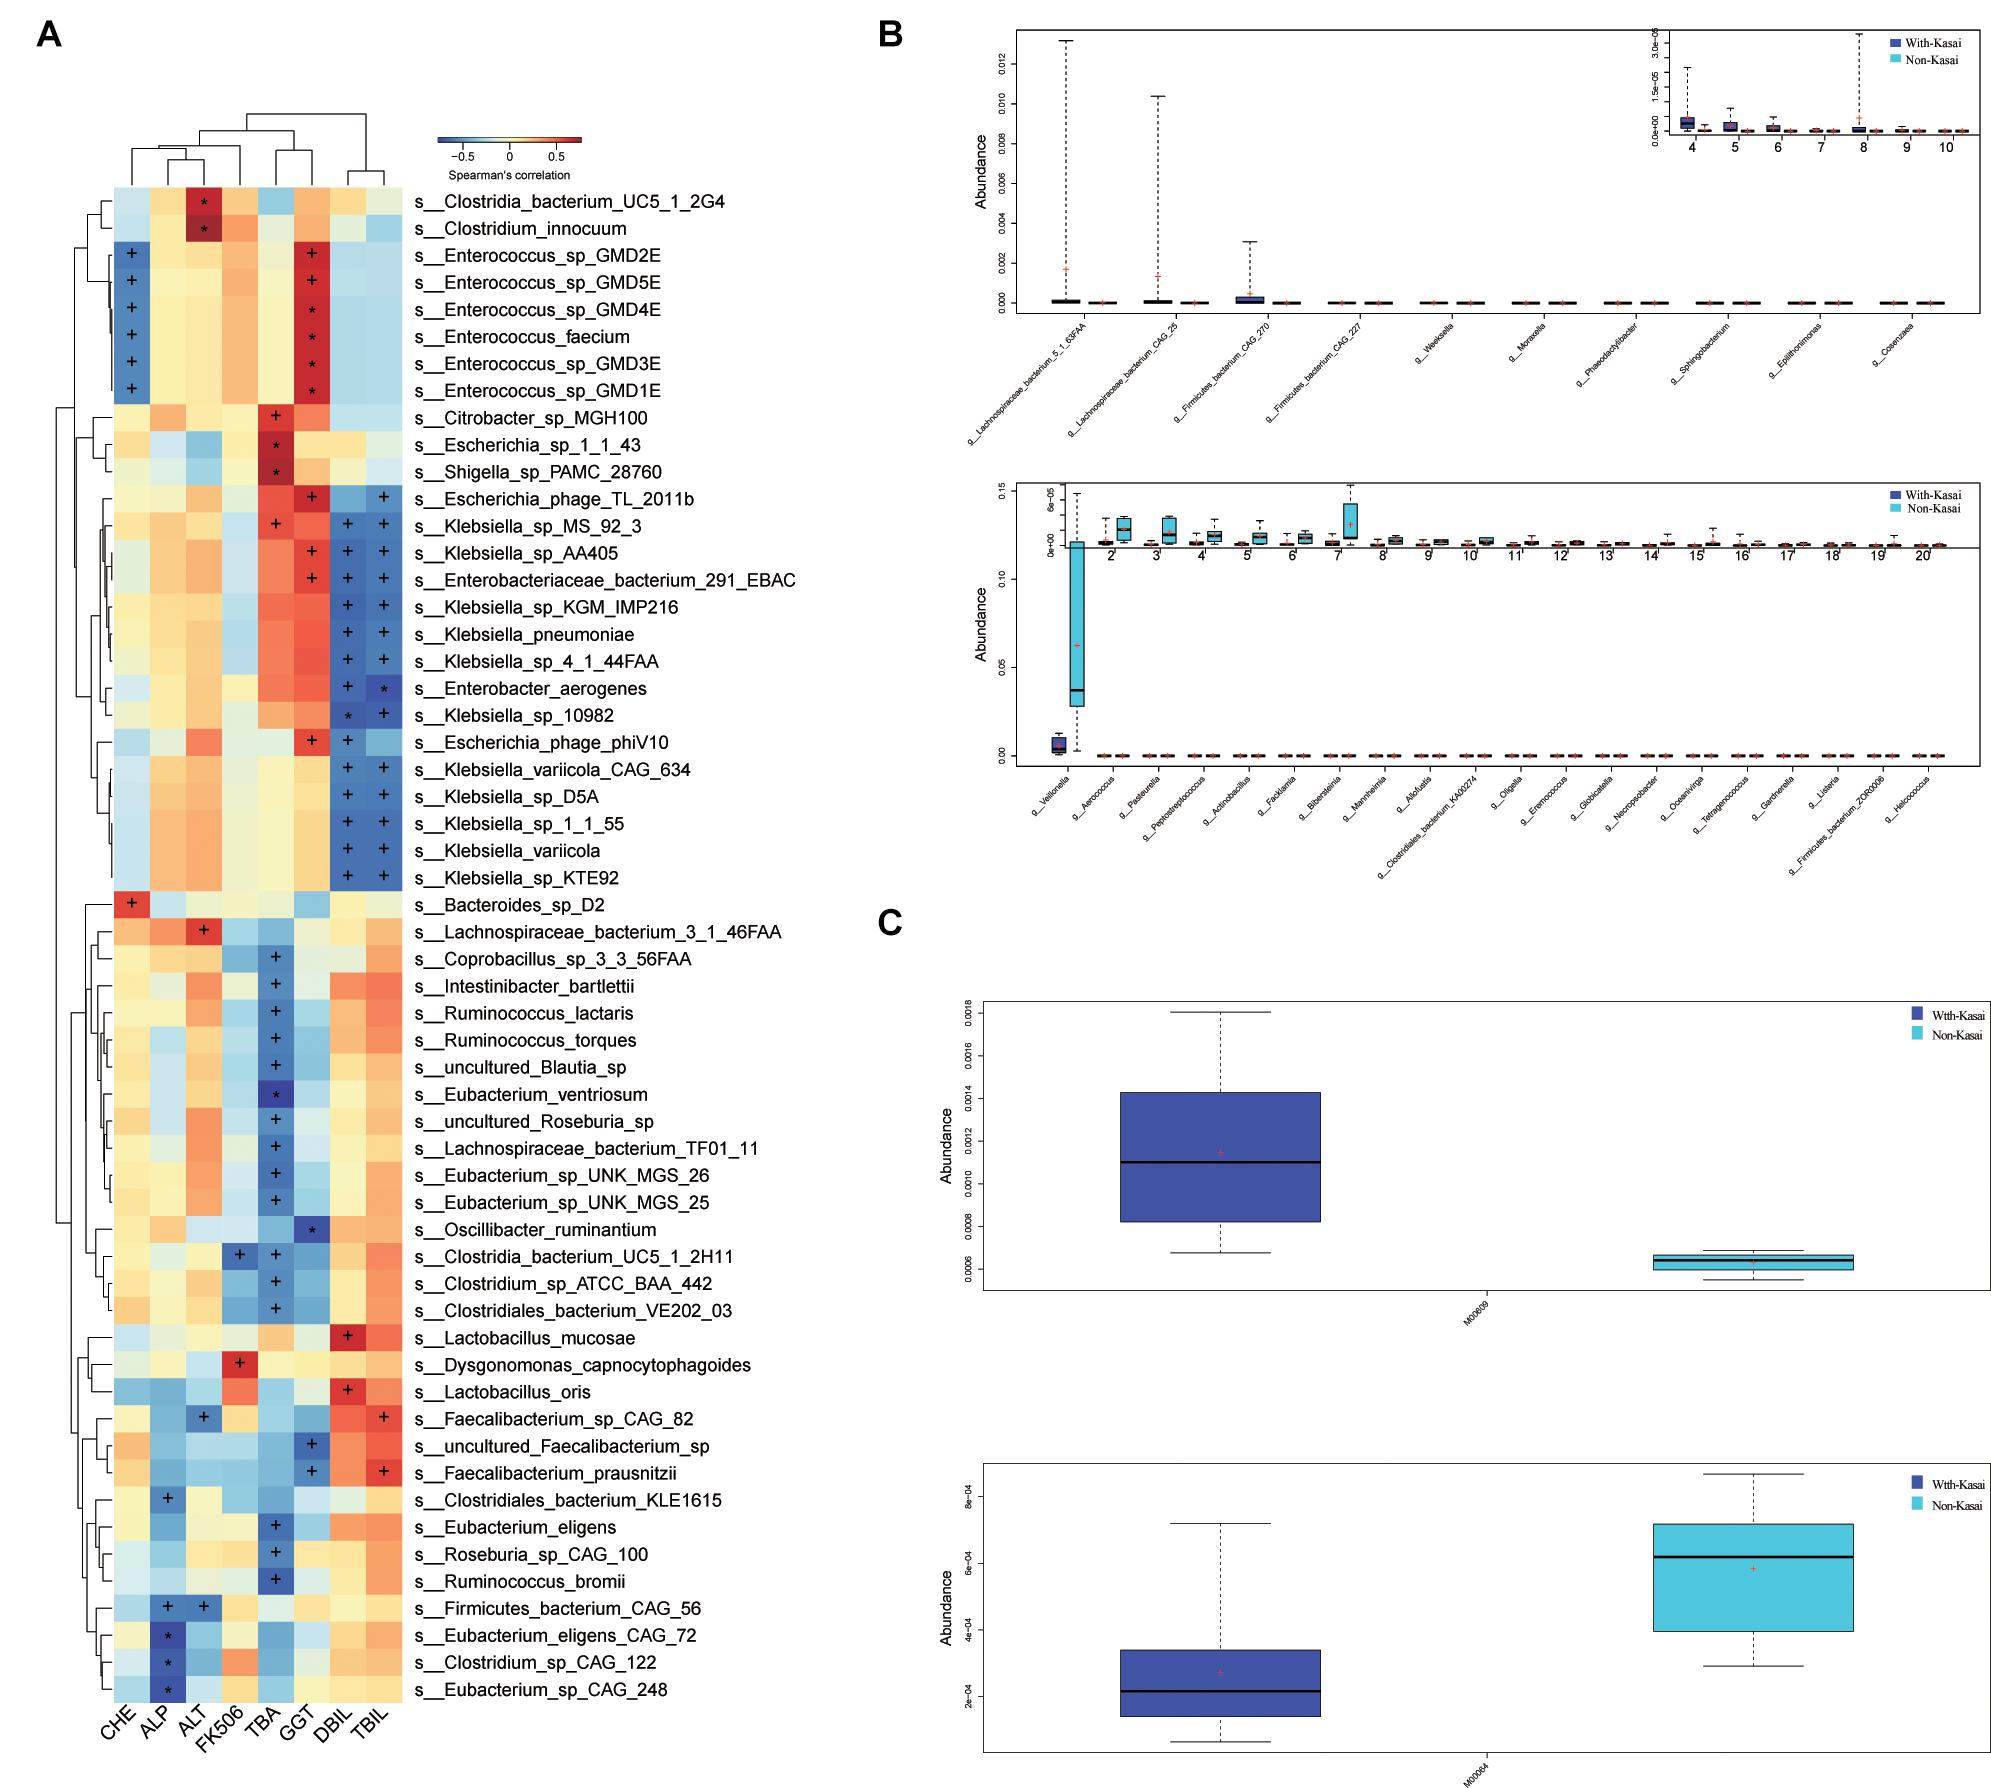
Figure 6. (A) Spearman correlations between species and clinical indices. The x-axis represents the environmental factors, and the y-axis the species. The depth of the color indicates the correlation between species and environmental factors (+P < 0.05, *P < 0.01). Blue denotes a negative correlation and red a positive correlation. (B,C) The effect of prior Kasai surgery on the gut microbiota after liver transplantation. (B) Species with significantly different abundances at the genus level in the with-Kasai and non-Kasai individuals (Wilcoxon rank-sum test, P < 0.05). The upper panel shows the abundance ranking of species in the with-Kasai group, and the lower panel the abundance ranking of species in the non-Kasai group. The x-axis represents the different taxa, and the y-axis the abundance of taxa. Different colors represent different groups. Lines inside the boxes indicate medians, “ + ” indicated means. (C) Functional profiles with significantly different abundances at the module level between the two groups (Wilcoxon rank-sum test, P < 0.05). Different colors represent different groups.
Effects of Kasai Procedure on Postoperative GM
According to whether patients had previously undergone the Kasai procedure, we categorized them into the with- and non-Kasai groups. In total, 8 and 6 children were categorized in the with-Kasai and non-Kasai groups. The results showed that GM overall structure and diversity were similar between the two groups. With regard to GM composition, the abundance of several species was different, Lachnospiraceae bacterium 5 1 63FAA, Lachnospiraceae bacterium CAG 25, Firmicutes bacterium CAG 270, Firmicutes bacterium CAG 227, Weeksella, Moraxella, and Phaeodactylibacter exhibited higher abundance in the with-Kasai group, while Veillonella, Aerococcus, and Actinobacillus did not (Figure 6B and Supplementary Table 10). In the functional profiles, cysteine and methionine metabolism (M00609) was enriched in the with-Kasai group, while lipopolysaccharide metabolism (M00064) was enriched in the non-Kasai group (Figure 6C and Supplementary Table 11). Taken together, these findings showed that a prior Kasai procedure had a certain effect on the GM after LT.
Discussion
BA is the major cause of neonatal cholestasis, and LT is currently the standard treatment (Sun et al., 2013; Feldman and Mack, 2015; Kasahara et al., 2017). Previous studies have suggested that the GM was altered during LT in adults with liver disease and animal models (Wu et al., 2012; Bajaj et al., 2017; Sun et al., 2017; Tian et al., 2018). In addition, the characteristics of GM after LT in children with BA have not been reported. The present study aimed to analyze the characteristics of GM in children with BA during LT.
Compared with the GM in patients before LT, the abundance of SCFA-producing bacteria (e.g., Roseburia, Blautia, Clostridium, Akkermansia, Ruminococcus, and Eubacterium) increased after LT. However, it was still lower than that in the control group. It demonstrated that LT partially improved dysbacteriosis in children with BA. With regard to functional profiles, it found that Serratia spp., Proteobacteria bacterium CAG 139, Veillonella sp. CAG 933, and Streptococcus spp. were predominant in pathogenic related metabolic pathways in the pre-LT group. After LT, the driving effect of these bacteria on metabolic pathways was reduced. Besides, lipid metabolism, amino acid metabolism, carbohydrate metabolism, energy metabolism, xenobiotics biodegradation and metabolism, and cell motility increased in the post-LT group. Therefore, functional metabolism also improved after LT. Among the contributing microorganisms, Streptococcus spp. and Veillonella spp. have been reported to be enriched in the intestinal tract and biliary tract in immune liver diseases (Wei et al., 2019; Abe et al., 2020; Liwinski et al., 2020), which are associated with the etiology of autoimmune liver disease and damage to the epithelial barrier (Kugathasan et al., 2017); thus, LT can reduce the occurrence of epithelial inflammation from the perspective of the gut flora. On the other hand, selecting appropriate antibiotics for these bacteria for clinical treatment is useful for the intestinal epithelial barrier’s integrity and resisting inflammation.
Bile acids are critically important for maintaining a healthy gut microbiota. It interacts closely with the intestinal microbiota through the gut-liver axis. After LT, bile drainage into the intestine can reduce the pH of the intestinal environment, inhibit the growth of pathogenic bacteria, maintain the balance of intestinal microorganisms, and affect the composition of GM. Consistent with this, we observed that there was no statistical difference in either α or β diversity between the post-LT and control groups, which indicated that the composition of GM between the two groups was similar. Besides, to investigate whether the improvement in GM post-transplant is related to replacing the diseased liver or simply due to the establishment of bile flow to the intestine, we also compared the GM between the patients who gained successful bile flow (successful Kasai) and others were not (failed Kasai). We found that the abundances of 30 and 192 species were significantly increased after Kasai and LT (P < 0.05, Supplementary Table 13), respectively. Of the species that increased after Kasai, five species also increased significantly after LT (Acidaminococcus, Catabacter, Clostridiales bacterium VE202 03, Erysipelatoclostridium, and Flavonifractor), and 21 species increased but did not reach statistical significance. These results suggested that the change of GM after LT was greater than that after Kasai. Moreover, most of the changes in GM after Kasai also occurred after LT. We believed that the changes in GM after LT were not caused by bile acid drainage alone. In the post-LT group, Proteobacteria was the dominant phylum, which contains many known human pathogens, such as Enterobacteriaceae, which are thought to be markers of inflammation, epithelial dysfunction, and disease (Litvak et al., 2017; Liwinski et al., 2020). In addition, Klebsiella, Enterobacteriaceae bacterium 291 EBAC, Enterococcus, and Bilophila were enriched in the post-LT group. Bilophila is a sulfate-reducing bacterium whose abundance leads to excessive hydrogen sulfide production in the gut, stimulating an inflammatory response (Ye et al., 2018). Enterococcus and Klebsiella have been detected in various liver diseases (Ray, 2017; Fukui, 2019; Liu et al., 2019; Nakamoto et al., 2019) and were associated with a predisposition to penetrating complications in pediatric patients (Steck et al., 2011). Enterobacteriaceae bacterium 291 EBAC is a member of Enterobacteriaceae, also associated with epithelial inflammation and functional disorders. The number of SCFA-producing bacteria with anti-inflammatory effects was lower than that in the control group (Riviere et al., 2016). In early period of post-LT, recipients are at increased risk for developing infections. The use of antibiotic can deplete gut commensal bacteria, resulting in intestinal dysbiosis. Besides, immunosuppressive drugs may have caused the difference between the post-LT and control groups, and may affect the postoperative recovery of patients and increase the probability of complications. Additionally, Jiang et al. (2018) indicated that an optimal dosage of FK506 induced immunosuppression, normal graft function and stable gut microbiota following LT in rats. Therefore, regular detection of FK506 concentration is of positive significance for the homeostasis of intestinal flora. In addition, taking appropriate antibiotics or butyric acid may positively affect prognosis.
With regard to the functional profiles, ABC transporters and Glycolysis/Gluconeogenesis were abundant in the post-LT group. ABC transporters are an important cell-protective mechanism, which remove toxins and drugs from cells, and their enhanced metabolism may indicate intensive antibacterial ability in the intestine (Wang et al., 2019a; Ahmad et al., 2020). The metabolism of Glycolysis/Gluconeogenesis needs an oxygen-free environment, and its augmentation suggests that the anaerobic metabolism of sugar was active after LT (Wang et al., 2019b). Pathogen-related metabolism such as lipopolysaccharide metabolism and EHEC/EPEC pathogenicity signature were also abundant in the post-LT group. Lipopolysaccharide, also known as endotoxin, is the product of gram-negative bacteria, which can bind to TLR4 to initiate the inflammatory response (Cochet and Peri, 2017; Del Chierico et al., 2018). These results were in line with the bacterial composition in the post-LT group. Taken together, we believed that the changed functional profiles after LT are related to the different intestinal enrichment. Besides, GM are likely to affect the gut environment of hosts through itself composition and corresponding metabolism patterns and influence the development of disease.
Kasai operation could effectively delay the requirement of LT. Moreover, Li et al. (2019) had demonstrated that there was no significant difference in post-LT survival rate between the patients who had a prior Kasai and not. However, Urahashi et al. (2013) investigated that repeat Kasai might have a negative effect on patients who undergo LT for BA patients with potential lethal complications such as bowel perforation. Neto et al. (2015) also believed that a previous Kasai can increase post-LT complications as biliary complications and bowel perforations. Taken together, several studies have suggested that patients with a previous Kasai are at increased risk for bowel perforations, postoperative infection, and biliary complications from LT. Infection is a fatal complication after LT. Enterogenic infection represents a major complication in LT recipients (Zheyu and Lunan, 2006; Yuan et al., 2016; Mu et al., 2019); Therefore, we divided the post-LT group into two groups based on whether they had previously undergone the Kasai procedure to investigate the effect of Kasai surgery on the GM after LT. The results showed that some species and functional pathways were different between the two groups; however, whether this difference affects clinical outcomes deserves further study.
GM has been shown to play a unique role in the diversity of bile acids in bile acid pools by bile salt hydrolase and bile acid-inducible enzymes (Long et al., 2017; Ramirez-Perez et al., 2017; Mullish et al., 2018). Eubacterium and Ruminococcus have been proved to contain bile acid conversion enzymes (Jia et al., 2018); we found Eubacterium sp. UNK MGS 26, Ruminococcus bromii, Eubacterium ventriosum, and Eubacterium eligens associated with blood bile acids level according to Spearman analysis. These bacteria belong to Eubacterium and Ruminococcus, so they may also have the ability to convert bile acid.
In conclusion, we confirmed that LT could significantly improve the GM in children with BA and described the characteristics of GM after LT. It provides new insight into understanding the role of LT in BA.
Data Availability Statement
The datasets presented in this study can be found in online repositories. The names of the repository/repositories and accession number(s) can be found below: NCBI SRA (https://www.ncbi.nlm.nih.gov/bioproject PRJNA730640), it can be accessed with the BioProject identifier PRJNA730640.
Ethics Statement
The studies involving human participants were reviewed and approved by the Beijing Friendship Hospital, Capital Medical University (Approval ID: 2019-P2–131-02). Written informed consent to participate in this study was provided by the participants’ legal guardian/next of kin.
Author Contributions
WS: study design, data collection, analysis and interpretation of the data, and writing of the report. L-YS: study design, study supervision, and critical revision of the manuscript for important intellectual content. Z-JZ, LW, WQ, and Z-GZ: clinical treatment assistance. Y-SY: critical revision of the manuscript for important intellectual content. All authors read and approved the final manuscript to be submitted.
Funding
This study was supported by the National Natural Science Foundation of China (Grant No. 81570586).
Conflict of Interest
The authors declare that the research was conducted in the absence of any commercial or financial relationships that could be construed as a potential conflict of interest.
Supplementary Material
The Supplementary Material for this article can be found online at: https://www.frontiersin.org/articles/10.3389/fphys.2021.704313/full#supplementary-material
Abbreviations
BA, biliary atresia; LT, liver transplantation; GM, gut microbiota; SCFAs, producing short-chain fatty acids; TLR, toll-like receptor; KO, KEGG ortholog; KEGG, Kyoto Encyclopedia of Genes and Genomes database; LEfSe, LDA effect size; LDA, Linear discriminant analysis; PCoA, Principal coordinate analysis; ALT, alanine aminotransferase; AST, aspartate aminotransferase; ALP, alkaline phosphatase; GGT, γ-glutaryltransferase; TBA, total bile acids; TBIL, total bilirubin; IL-2, interleukin-2; IL-4, interleukin-4; IL-6, interleukin-6; IL-10, interleukin; TNF α, tumor necrosis factor α; IFN- γ, interferon (IFN)- γ; PELD, Pediatric End-stage Liver Disease.
Footnotes
References
Abe, K., Fujita, M., Hayashi, M., Okai, K., Takahashi, A., and Ohira, H. (2020). Gut and oral microbiota in autoimmune liver disease. Fukushima J. Med. Sci. 65, 71–75. doi: 10.5387/fms.2019-21
Ahmad, A., Majaz, S., and Nouroz, F. (2020). Two-component systems regulate ABC transporters in antimicrobial peptide production, immunity and resistance. Microbiology 166, 4–20. doi: 10.1099/mic.0.000823
Ahmadmehrabi, S., and Tang, W. H. W. (2017). Gut microbiome and its role in cardiovascular diseases. Curr. Opin. Cardiol. 32, 761–766. doi: 10.1097/hco.0000000000000445
Bajaj, J. S., Fagan, A., Sikaroodi, M., White, M. B., Sterling, R. K., Gilles, H., et al. (2017). Liver transplant modulates gut microbial dysbiosis and cognitive function in cirrhosis. Liver Transpl. 23, 907–914. doi: 10.1002/lt.24754
Burcelin, R. (2017). [Gut microbiota and immune crosstalk in metabolic disease]. Biol. Aujourdhui 211, 1–18.
Cochet, F., and Peri, F. (2017). The role of carbohydrates in the lipopolysaccharide (LPS)/toll-like receptor 4 (TLR4) signalling. Int. J. Mol. Sci. 18:2318. doi: 10.3390/ijms18112318
Del Chierico, F., Abbatini, F., Russo, A., Quagliariello, A., Reddel, S., Capoccia, D., et al. (2018). Gut microbiota markers in obese adolescent and adult patients: age-dependent differential patterns. Front. Microbiol. 9:1210. doi: 10.3389/fmicb.2018.01210
Feldman, A. G., and Mack, C. L. (2015). Biliary atresia: clinical lessons learned. J. Pediatr. Gastroenterol. Nutr. 61, 167–175. doi: 10.1097/mpg.0000000000000755
Fukui, H. (2019). Role of gut dysbiosis in liver diseases: what have we learned so far? Diseases 7:58. doi: 10.3390/diseases7040058
Jia, W., Xie, G., and Jia, W. (2018). Bile acid-microbiota crosstalk in gastrointestinal inflammation and carcinogenesis. Nat. Rev. Gastroenterol. Hepatol. 15, 111–128. doi: 10.1038/nrgastro.2017.119
Jiang, J. W., Ren, Z. G., Lu, H. F., Zhang, H., Li, A., Cui, G. Y., et al. (2018). Optimal immunosuppressor induces stable gut microbiota after liver transplantation. World J. Gastroenterol. 24, 3871–3883. doi: 10.3748/wjg.v24.i34.3871
Kasahara, M., Umeshita, K., Sakamoto, S., Fukuda, A., Furukawa, H., and Uemoto, S. (2017). Liver transplantation for biliary atresia: a systematic review. Pediatr. Surg. Int. 33, 1289–1295. doi: 10.1007/s00383-017-4173-5
Kazemian, N., Mahmoudi, M., Halperin, F., Wu, J. C., and Pakpour, S. (2020). Gut microbiota and cardiovascular disease: opportunities and challenges. Microbiome 8:36.
Kugathasan, S., Denson, L. A., Walters, T. D., Kim, M. O., Marigorta, U. M., Schirmer, M., et al. (2017). Prediction of complicated disease course for children newly diagnosed with Crohn’s disease: a multicentre inception cohort study. Lancet 389, 1710–1718.
Li, S., Ma, N., Meng, X., Zhang, W., Sun, C., Dong, C., et al. (2019). The effects of Kasai procedure on living donor liver transplantation for children with biliary atresia. J. Pediatr. Surg. 54, 1436–1439. doi: 10.1016/j.jpedsurg.2018.07.022
Litvak, Y., Byndloss, M. X., Tsolis, R. M., and Bäumler, A. J. (2017). Dysbiotic Proteobacteria expansion: a microbial signature of epithelial dysfunction. Curr. Opin. Microbiol. 39, 1–6. doi: 10.1016/j.mib.2017.07.003
Liu, Q., Li, F., Zhuang, Y., Xu, J., Wang, J., Mao, X., et al. (2019). Alteration in gut microbiota associated with hepatitis B and non-hepatitis virus related hepatocellular carcinoma. Gut Pathog. 11:1.
Liwinski, T., Zenouzi, R., John, C., Ehlken, H., Ruhlemann, M. C., Bang, C., et al. (2020). Alterations of the bile microbiome in primary sclerosing cholangitis. Gut 69, 665–672.
Long, S. L., Gahan, C. G. M., and Joyce, S. A. (2017). Interactions between gut bacteria and bile in health and disease. Mol. Aspects Med. 56, 54–65. doi: 10.1016/j.mam.2017.06.002
Lozupone, C. A., Stombaugh, J. I., Gordon, J. I., Jansson, J. K., and Knight, R. (2012). Diversity, stability and resilience of the human gut microbiota. Nature 489, 220–230. doi: 10.1038/nature11550
Miura, K., and Ohnishi, H. (2014). Role of gut microbiota and Toll-like receptors in nonalcoholic fatty liver disease. World J. Gastroenterol. 20, 7381–7391. doi: 10.3748/wjg.v20.i23.7381
Mu, J., Chen, Q., Zhu, L., Wu, Y., Liu, S., Zhao, Y., et al. (2019). Influence of gut microbiota and intestinal barrier on enterogenic infection after liver transplantation. Curr. Med. Res. Opin. 35, 241–248. doi: 10.1080/03007995.2018.1470085
Mullish, B. H., Pechlivanis, A., Barker, G. F., Thursz, M. R., Marchesi, J. R., and McDonald, J. A. K. (2018). Functional microbiomics: evaluation of gut microbiota-bile acid metabolism interactions in health and disease. Methods 149, 49–58. doi: 10.1016/j.ymeth.2018.04.028
Nakamoto, N., Sasaki, N., Aoki, R., Miyamoto, K., Suda, W., Teratani, T., et al. (2019). Gut pathobionts underlie intestinal barrier dysfunction and liver T helper 17 cell immune response in primary sclerosing cholangitis. Nat. Microbiol. 4, 492–503. doi: 10.1038/s41564-018-0333-1
Neto, J. S., Feier, F. H., Bierrenbach, A. L., Toscano, C. M., Fonseca, E. A., Pugliese, R., et al. (2015). Impact of Kasai portoenterostomy on liver transplantation outcomes: a retrospective cohort study of 347 children with biliary atresia. Liver Transpl. 21, 922–927. doi: 10.1002/lt.24132
Nishida, A., Inoue, R., Inatomi, O., Bamba, S., Naito, Y., and Andoh, A. (2018). Gut microbiota in the pathogenesis of inflammatory bowel disease. Clin. J. Gastroenterol. 11, 1–10.
Quigley, E. M. M. (2017). Microbiota-brain-gut axis and neurodegenerative diseases. Curr. Neurol. Neurosci. Rep. 17:94.
Ramirez-Perez, O., Cruz-Ramon, V., Chinchilla-Lopez, P., and Mendez-Sanchez, N. (2017). The role of the gut microbiota in bile acid metabolism. Ann. Hepatol. 16(Suppl. 1), S21–S26.
Ray, K. (2017). Alcoholic liver disease: gut-liver axis: PPIs, Enterococcus and promotion of alcoholic liver disease. Nat. Rev. Gastroenterol. Hepatol. 14:689. doi: 10.1038/nrgastro.2017.152
Riviere, A., Selak, M., Lantin, D., Leroy, F., and De Vuyst, L. (2016). Bifidobacteria and butyrate-producing colon bacteria: importance and strategies for their stimulation in the human gut. Front. Microbiol. 7:979. doi: 10.3389/fmicb.2016.00979
Singh, R. K., Chang, H. W., Yan, D., Lee, K. M., Ucmak, D., Wong, K., et al. (2017). Influence of diet on the gut microbiome and implications for human health. J. Transl. Med. 15:73.
Steck, N., Hoffmann, M., Sava, I. G., Kim, S. C., Hahne, H., Tonkonogy, S. L., et al. (2011). Enterococcus faecalis metalloprotease compromises epithelial barrier and contributes to intestinal inflammation. Gastroenterology 141, 959–971. doi: 10.1053/j.gastro.2011.05.035
Sun, L. Y., Yang, Y. S., Qu, W., Zhu, Z. J., Wei, L., Ye, Z. S., et al. (2017). Gut microbiota of liver transplantation recipients. Sci. Rep. 7:3762.
Sun, L. Y., Yang, Y. S., Zhu, Z. J., Gao, W., Wei, L., Sun, X. Y., et al. (2013). Outcomes in children with biliary atresia following liver transplantation. Hepatobiliary Pancreat. Dis. Int. 12, 143–148.
Tian, X., Yang, Z., Luo, F., and Zheng, S. (2018). Gut microbial balance and liver transplantation: alteration, management, and prediction. Front. Med. 12:123–129. doi: 10.1007/s11684-017-0563-2
Tilg, H., Cani, P. D., and Mayer, E. A. (2016). Gut microbiome and liver diseases. Gut 65, 2035–2044. doi: 10.1136/gutjnl-2016-312729
Urahashi, T., Ihara, Y., Sanada, Y., Wakiya, T., Yamada, N., Okada, N., et al. (2013). Effect of repeat Kasai hepatic portoenterostomy on pediatric live-donor liver graft for biliary atresia. Exp. Clin. Transplant. 11, 259–263. doi: 10.6002/ect.2012.0188
Wang, P., Xun, P., He, K., and Cai, W. (2016). Comparison of liver transplantation outcomes in biliary atresia patients with and without prior portoenterostomy: a meta-analysis. Dig. Liver Dis. 48, 347–352. doi: 10.1016/j.dld.2015.11.021
Wang, Y., Gao, X., Zhang, X., Xiao, Y., Huang, J., Yu, D., et al. (2019a). Gut microbiota dysbiosis is associated with altered bile acid metabolism in infantile cholestasis. mSystems 4:e00463-19.
Wang, Y., Wang, S., Wu, C., Chen, X., Duan, Z., Xu, Q., et al. (2019b). Oral microbiome alterations associated with early childhood caries highlight the importance of carbohydrate metabolic activities. mSystems 4:e00450-19.
Wei, Y., Li, Y., Yan, L., Sun, C., Miao, Q., Wang, Q., et al. (2019). Alterations of gut microbiome in autoimmune hepatitis. Gut. 69, 569–577.
Wu, Z. W., Ling, Z. X., Lu, H. F., Zuo, J., Sheng, J. F., Zheng, S. S., et al. (2012). Changes of gut bacteria and immune parameters in liver transplant recipients. Hepatobiliary Pancreat. Dis. Int. 11, 40–50. doi: 10.1016/s1499-3872(11)60124-0
Ye, Z., Zhang, N., Wu, C., Zhang, X., Wang, Q., Huang, X., et al. (2018). A metagenomic study of the gut microbiome in Behcet’s disease. Microbiome 6:135.
Yuan, D. D., Chi, X. J., Jin, Y., Li, X., Ge, M., Gao, W. L., et al. (2016). Intestinal injury following liver transplantation was mediated by TLR4/NF-κB activation-induced cell apoptosis. Mol. Med. Rep. 13, 1525–1532. doi: 10.3892/mmr.2015.4719
Zhang, Y. J., Li, S., Gan, R. Y., Zhou, T., Xu, D. P., and Li, H. B. (2015). Impacts of gut bacteria on human health and diseases. Int. J. Mol. Sci. 16, 7493–7519. doi: 10.3390/ijms16047493
Keywords: biliary atresia, liver transplantation, gut microbiota, metagenomic sequencing, infection
Citation: Song W, Sun L-Y, Zhu Z-J, Wei L, Qu W, Zeng Z-G and Yang Y-S (2021) Characteristics of Gut Microbiota in Children With Biliary Atresia After Liver Transplantation. Front. Physiol. 12:704313. doi: 10.3389/fphys.2021.704313
Received: 02 May 2021; Accepted: 02 June 2021;
Published: 29 June 2021.
Edited by:
Phillipp Hartmann, University of California, San Diego, United StatesReviewed by:
Mostafa Sira, Menofia University, EgyptYuanqiang Zou, Beijing Genomics Institute (BGI), China
Wei Gao, Tianjin First Central Hospital, China
Copyright © 2021 Song, Sun, Zhu, Wei, Qu, Zeng and Yang. This is an open-access article distributed under the terms of the Creative Commons Attribution License (CC BY). The use, distribution or reproduction in other forums is permitted, provided the original author(s) and the copyright owner(s) are credited and that the original publication in this journal is cited, in accordance with accepted academic practice. No use, distribution or reproduction is permitted which does not comply with these terms.
*Correspondence: Li-Ying Sun, c3VueGx4QG91dGxvb2suY29t; Yun-Sheng Yang, U3VubnlkZGNAcGxhZ2gub3Jn
 Wei Song1,2
 Li-Ying Sun
 Zhi-Jun Zhu
 Yun-Sheng Yang