 Alexander Reshetnik
 Jonida Gjolli
 Markus van der Giet
 Friederike Compton
- Department of Nephrology and Intensive Care Medicine, Corporate Member of Freie Universität Berlin, Humboldt-Universität zu Berlin, Charité – Universitätsmedizin Berlin, Berlin, Germany
While invasive thermodilution techniques remain the reference methods for cardiac output (CO) measurement, there is a currently unmet need for non-invasive techniques to simplify CO determination, reduce complications related to invasive procedures required for indicator dilution CO measurement, and expand the application field toward emergency room, non-intensive care, or outpatient settings. We evaluated the performance of a non-invasive oscillometry-based CO estimation method compared to transpulmonary thermodilution. To assess agreement between the devices, we used Bland–Altman analysis. Four-quadrant plot analysis was used to visualize the ability of Mobil-O-Graph (MG) to track CO changes after a fluid challenge. Trending analysis of CO trajectories was used to compare MG and PiCCO® calibrated pulse wave analysis over time (6 h). We included 40 patients from the medical intensive care unit at the Charité – Universitätsmedizin Berlin, Campus Benjamin Franklin between November 2019 and June 2020. The median age was 73 years. Forty percent of the study population was male; 98% was ventilator-dependent and 75% vasopressor-dependent at study entry. The mean of the observed differences for the cardiac output index (COI) was 0.7 l∗min–1*m–2 and the lower, and upper 95% limits of agreement (LOA) were -1.9 and 3.3 l∗min–1*m–2, respectively. The 95% confidence interval for the LOA was ± 0.26 l∗min–1*m–2, the percentage error 83.6%. We observed concordant changes in CO with MG and PiCCO® in 50% of the measurements after a fluid challenge and over the course of 6 h. Cardiac output calculation with a novel oscillometry-based pulse wave analysis method is feasible and replicable in critically ill patients. However, we did not find clinically applicable agreement between MG and thermodilution or calibrated pulse wave analysis, respectively, assessed with established evaluation routine using the Bland–Altman approach and with trending analysis methods. In summary, we do not recommend the use of this method in critically ill patients at this time. As the basic approach is promising and the CO determination with MG very simple to perform, further studies should be undertaken both in hemodynamically stable patients, and in the critical care setting to allow additional adjustments of the underlying algorithm for CO estimation with MG.
Introduction
Cardiac output (CO) is a key determinant of oxygen delivery and thus an important parameter to assess the hemodynamic situation of critically ill patients, guide perioperative goal-directed therapy, and monitor response to therapeutic interventions (Cecconi et al., 2014). CO can be measured or estimated using invasive, minimally invasive, and non-invasive techniques as well (Sakka et al., 1999; Saugel et al., 2021). While invasive indicator dilution techniques such as pulmonary arterial or transpulmonary thermodilution remain the clinical gold standard and reference methods for CO measurement, and minimally invasive CO determination methods are also available for use in the intensive care unit (ICU), there is a currently unmet need for non-invasive techniques to further simplify CO estimation, reduce complications related to invasive techniques such as pulmonary artery catheterization, and to facilitate use in non-intensive care settings, e.g., for rapid hemodynamic assessment in the emergency room or even in outpatient settings.
In this study, we evaluated a non-invasive oscillometry-based pulse wave analysis CO estimation technique for use in critically ill patients.
Materials and Methods
Eligible patients treated in the medical ICU of the Charité – Universitätsmedizin Berlin, Campus Benjamin Franklin were enrolled between November 2019 and June 2020. The Charité – Universitätsmedizin Berlin regional research ethics committee approved the study (ref: EA1/184/15). All methods were performed following the relevant guidelines and regulations.
Only patients monitored hemodynamically with the invasive CO determination PiCCO® device (Pulsion Medical Systems, Feldkirchen, Germany) as part of their ICU treatment were included in the study. Exclusion criteria were age below 18 years, pregnancy, known severe aortic valve, aortic arch, axillary, or brachial artery stenosis, as well as cardiac arrhythmias precluding non-invasive calculation of haemodynamic parameters. Patients were considered haemodynamically unstable if mean arterial pressure (MAP) was <65 mmHg or vasopressor therapy was necessary to maintain MAP ≥ 65 mmHg.
The test device for non-invasive CO estimation was the Mobil-O-Graph (MG)® (MG; I.E.M., Stolberg, Germany) blood pressure monitoring device equipped with an improved CO calculation algorithm (Hypertension Management Software Client 5.2, 2018). With MG, CO is estimated from the arterial pulse wave derived with a high fidelity pressure sensor integrated into the blood pressure cuff while being inflated at diastolic blood pressure level for 10 s. Cuff size was chosen according to manufacturer instructions: regular size for arm circumferences of 24–34 cm, large size for arm circumference 32–42 cm. The measurement site was left or right upper arm. The construction of the aortic pressure waveform was made using generalized transfer functions (Fourier analysis and decompensation into wave harmonics) and transformation from aortic pressure to aortic flow waveform was performed with an adopted, and multidimensional Windkessel model. Basic principle used is derivation of stroke volume (SV) from pulse contour analysis (PCA) determined with oscillometry. SV is proportional to the area of the flow curve during systole. The computation of the aortic flow from pressure was based on the 3-element windkessel model determined by aortic characteristic impedance, aortic compliance and peripheral resistance. These parameters were identified using Levenberg–Marquardt algorithm. SV was derived from the time lag between aortic pressure and flow curve (characteristic impedance, Zc). Finally, CO was calculated by multiplying SV with the heart rate. Detailed underlying mathematical principles related to CO estimation with MG are described elsewhere (Wassertheurer et al., 2008). For comparison with reference CO, the mean value of two consecutive CO determinations performed with MG was used in each patient. CO was corrected for body surface area and expressed as cardiac output index (COI).
Reference CO was measured using transpulmonary thermodilution with the PiCCO® system: A bolus of 20 mL of cold (0–6°C) 5% glucose solution was manually injected (injection time ≤ 10 s) into the distal lumen of a central venous catheter while the patient was in a supine position and then detected in the systemic circulation by a thermistor-tipped femoral artery catheter (Pulsiocath PV2015L20, Pulsion Medical Systems, Feldkirchen, Germany). As with MG CO estimation, two consecutive CO measurements were performed, a mean was calculated for inclusion in the final analysis and COI calculated.
We performed CO measurements with the test (MG) and reference (thermodilution with PiCCO®) devices before, and after a fluid challenge with 150 mL of crystalloid solution. In addition, we performed trend analyses with MG and PiCCO® -calibrated pulse wave analysis over a maximum of 6 h (Laight and Levin, 2015). Furthermore, invasively and non-invasively measured blood pressure and heart rate were obtained from routine hemodynamic monitoring and included in the comparison analysis. Demographic and specific clinical patient characteristics were obtained from the hospital patient data management systems.
Statistics
Data were analyzed using Graph-Pad Prism 5 (GraphPad Software, La Jolla, CA, United States) and SPSS Statistics 25.0 (IBM, New York, NY, United States). Continuous variables are presented as median with quartiles. Categorical variables are presented as absolute numbers with percentages. Statistical differences between paired measurements were assessed using a nonparametric Wilcoxon test, and a two-sided p-value of <0.05 was regarded as statistically significant. Bland–Altman analysis was used to assess agreement between test and reference device where the mean of the observed differences was calculated as a measure for accuracy and the 95% LOA as a measure for precision including their 95% confidence intervals (Bland and Altman, 2007; Lu et al., 2016). Furthermore, we calculated the percentage error of agreement, which was computed from the one-sided width of the LOA divided by the average of CO. For trending analysis after the fluid challenge, the 4-quadrant plot technique was used. We expressed CO change after fluid challenge as relative change according to the following equation:
For the purpose of the study, we defined an exclusion zone of 15% (Saugel et al., 2015). To compare long-term trends in CO, slopes of the trajectories for each method were calculated as shown in the Supplementary Figures 1, 2. Within-subject method reliability was assessed with intraclass correlation coefficient calculated with the two-way mixed model.
Results
We included 45 participants in the study. Five patients had incomplete measurement data sets due to technical problems so that 40 patients were included in the final analysis. The median age was 73 years, 40% of the study population was male, 98% was ventilator-dependent, and 75% vasopressor-dependent at study entry. Clinical and demographic parameters are presented in Table 1. Concerning hemodynamic data, there were significant differences not only between CO determinations with MG and PiCCO®, respectively, but also between non-invasive and invasive blood pressure measurements: Both diastolic and MAPs were significantly higher with MG than measured invasively in the femoral artery (70 vs. 55 mmHg, p < 0,001, and 90 vs. 80 mmHg, p < 0,001, respectively). Conversely, systolic blood pressure was lower with MG than with invasive measurement (118 vs. 123 mmHg), even though this difference was not statistically significant. Both CO and COI were significantly lower with MG as compared with PiCCO® (4.9 vs. 6.1 l∗min–1 and 2.6 vs. 3.2 l∗min–1*m–2, respectively). Obtained CO values ranged from 3.2 to 10.7 l∗min–1 for MG and from 2.9 to 17.8 l∗min–1 for PiCCO®. Further details concerning hemodynamic parameters are depicted in Table 2.
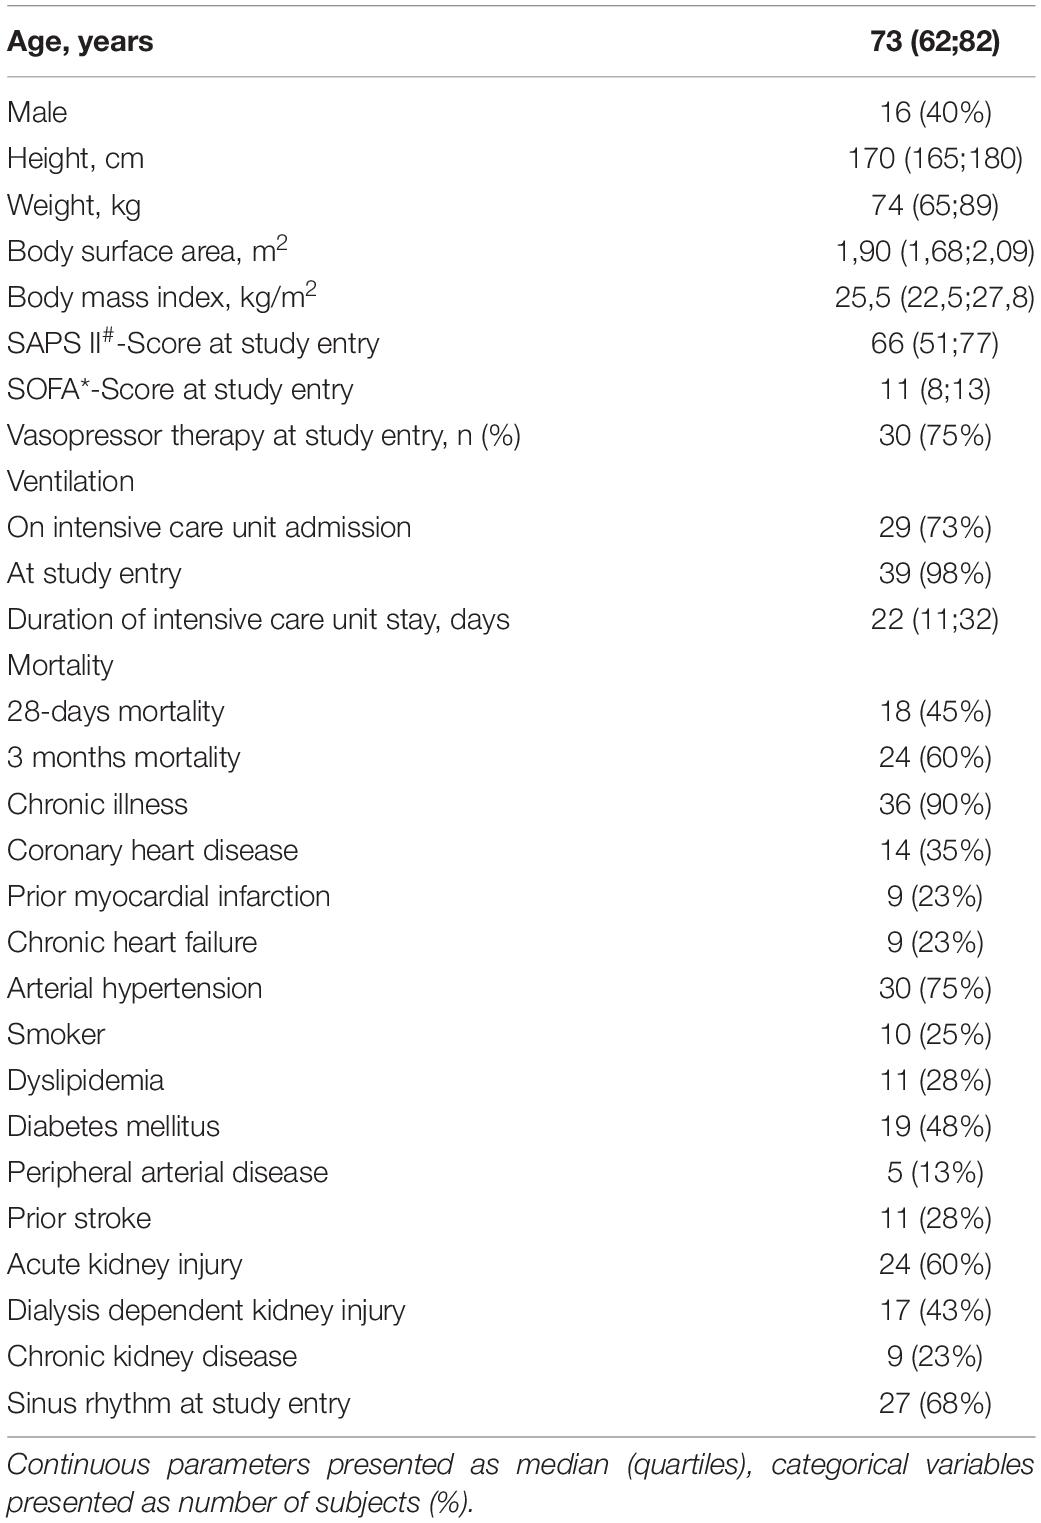
Table 1. Baseline patient characteristics.
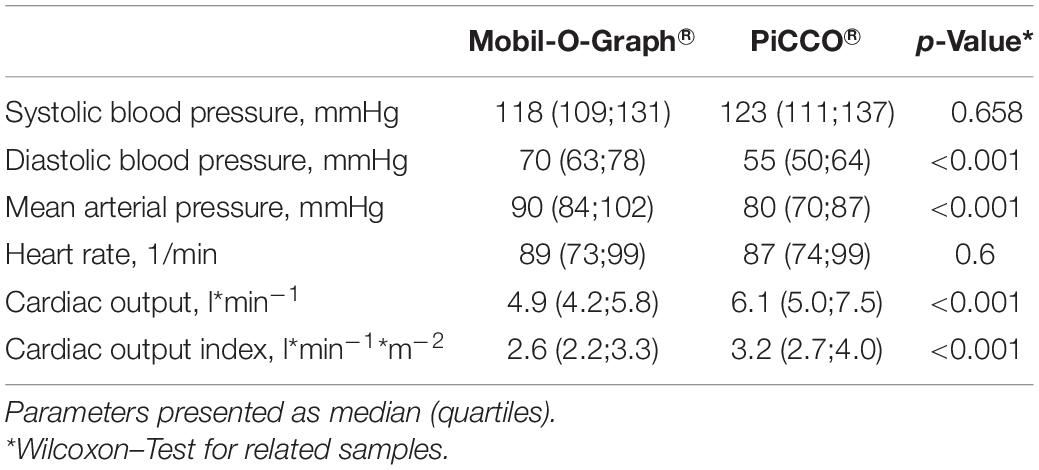
Table 2. Hemodynamic parameters with Mobil-O-Graph® and PiCCO®.
Cardiac output and COI obtained with MG significantly correlated with CO and COI obtained with reference device (Pearson’s r = 0.40; p < 0.0001). Findings for COI are presented in Figure 1. Using explorative data analysis, we identified four values as “outliers.” We performed addition correlation analysis with Pearson’s r = 0.28 (p = 0.02), which is shown in Supplementary Figure 2.
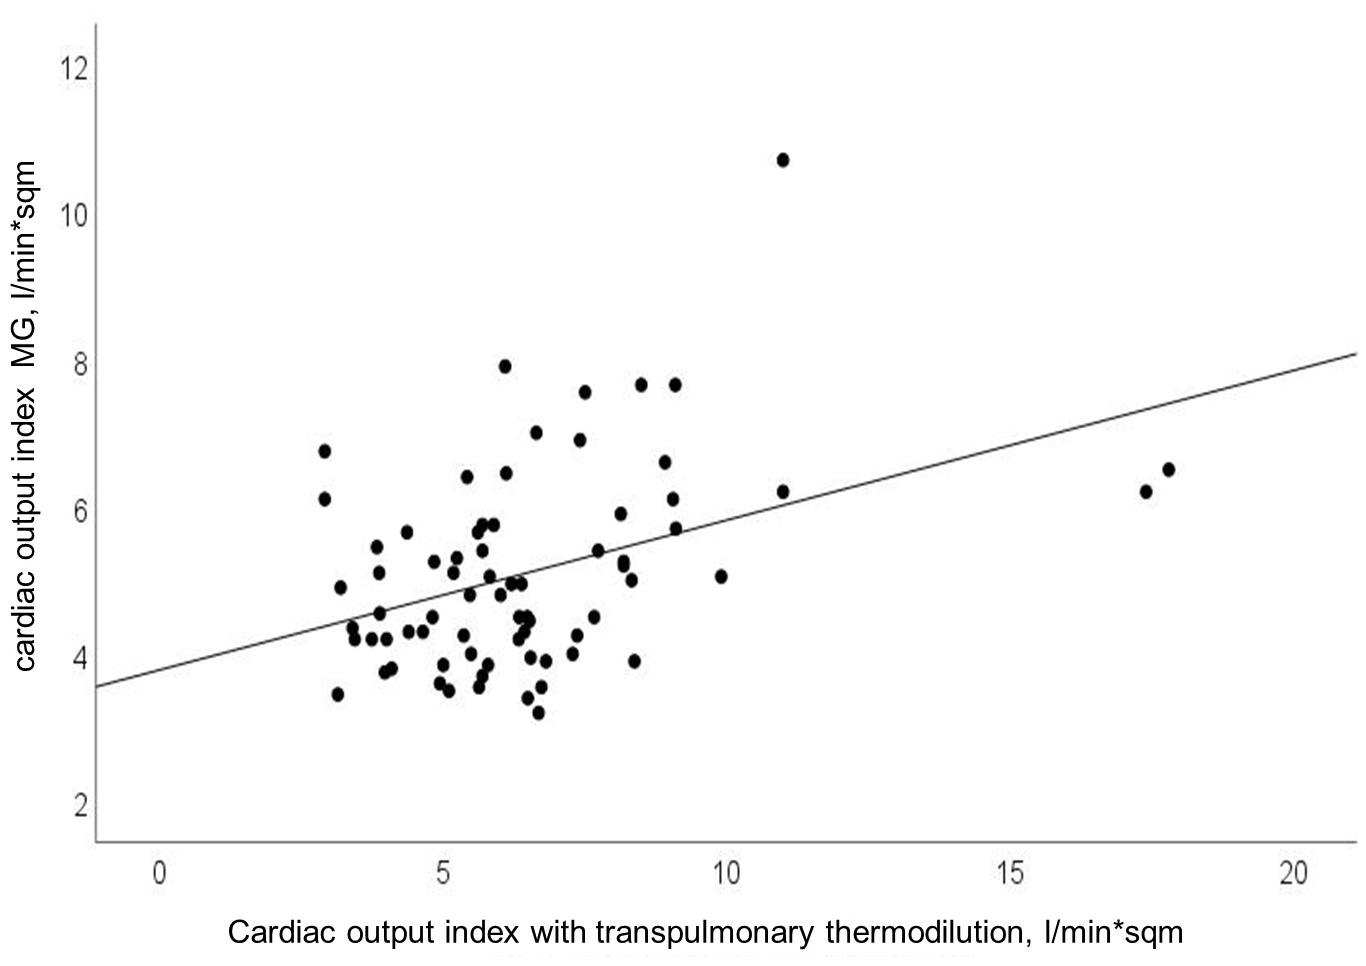
Figure 1. Relationship between cardiac output index (CO-Index) measured with transpulmonary thermodilution and Mobil-O-Graph (MG); Pearson’s r = 0.40; p < 0.0001.
The mean of the observed differences for the CO was 1.3 l∗min–1 and the lower, and upper 95% LOA were -3.5 and 6.1 l∗min–1, respectively. 95% confidence interval for the LOA was ± 0.49 l∗min–1. The mean of the observed differences for the COI was 0.7 l∗min–1*m–2 and the lower, and upper 95% limit of agreement is -1.9 and 3.3 l∗min–1*m–2, respectively. 95% confidence interval for the LOA was ± 0.26 l∗min–1*m–2 (Figure 2). The percentage error was 83.6%.
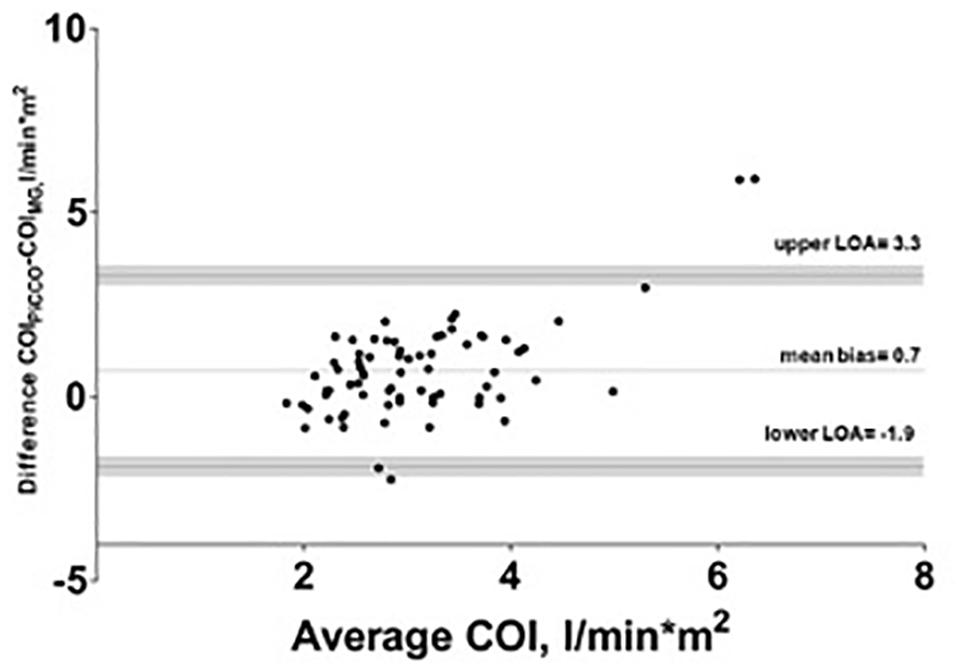
Figure 2. Bland–Altman analysis of cardiac output index (COI) with test (Mobil-O-Graph-MG) and reference method (PiCCO® thermodilution). Gray shaded area represents 95% confidence interval of limits of agreement (LOA).
The intraclass correlation coefficient for PiCCO® was 0.97 and for MG 0.89.
Bland–Altman plots for systolic, mean, diastolic BP are shown in Figure 3.
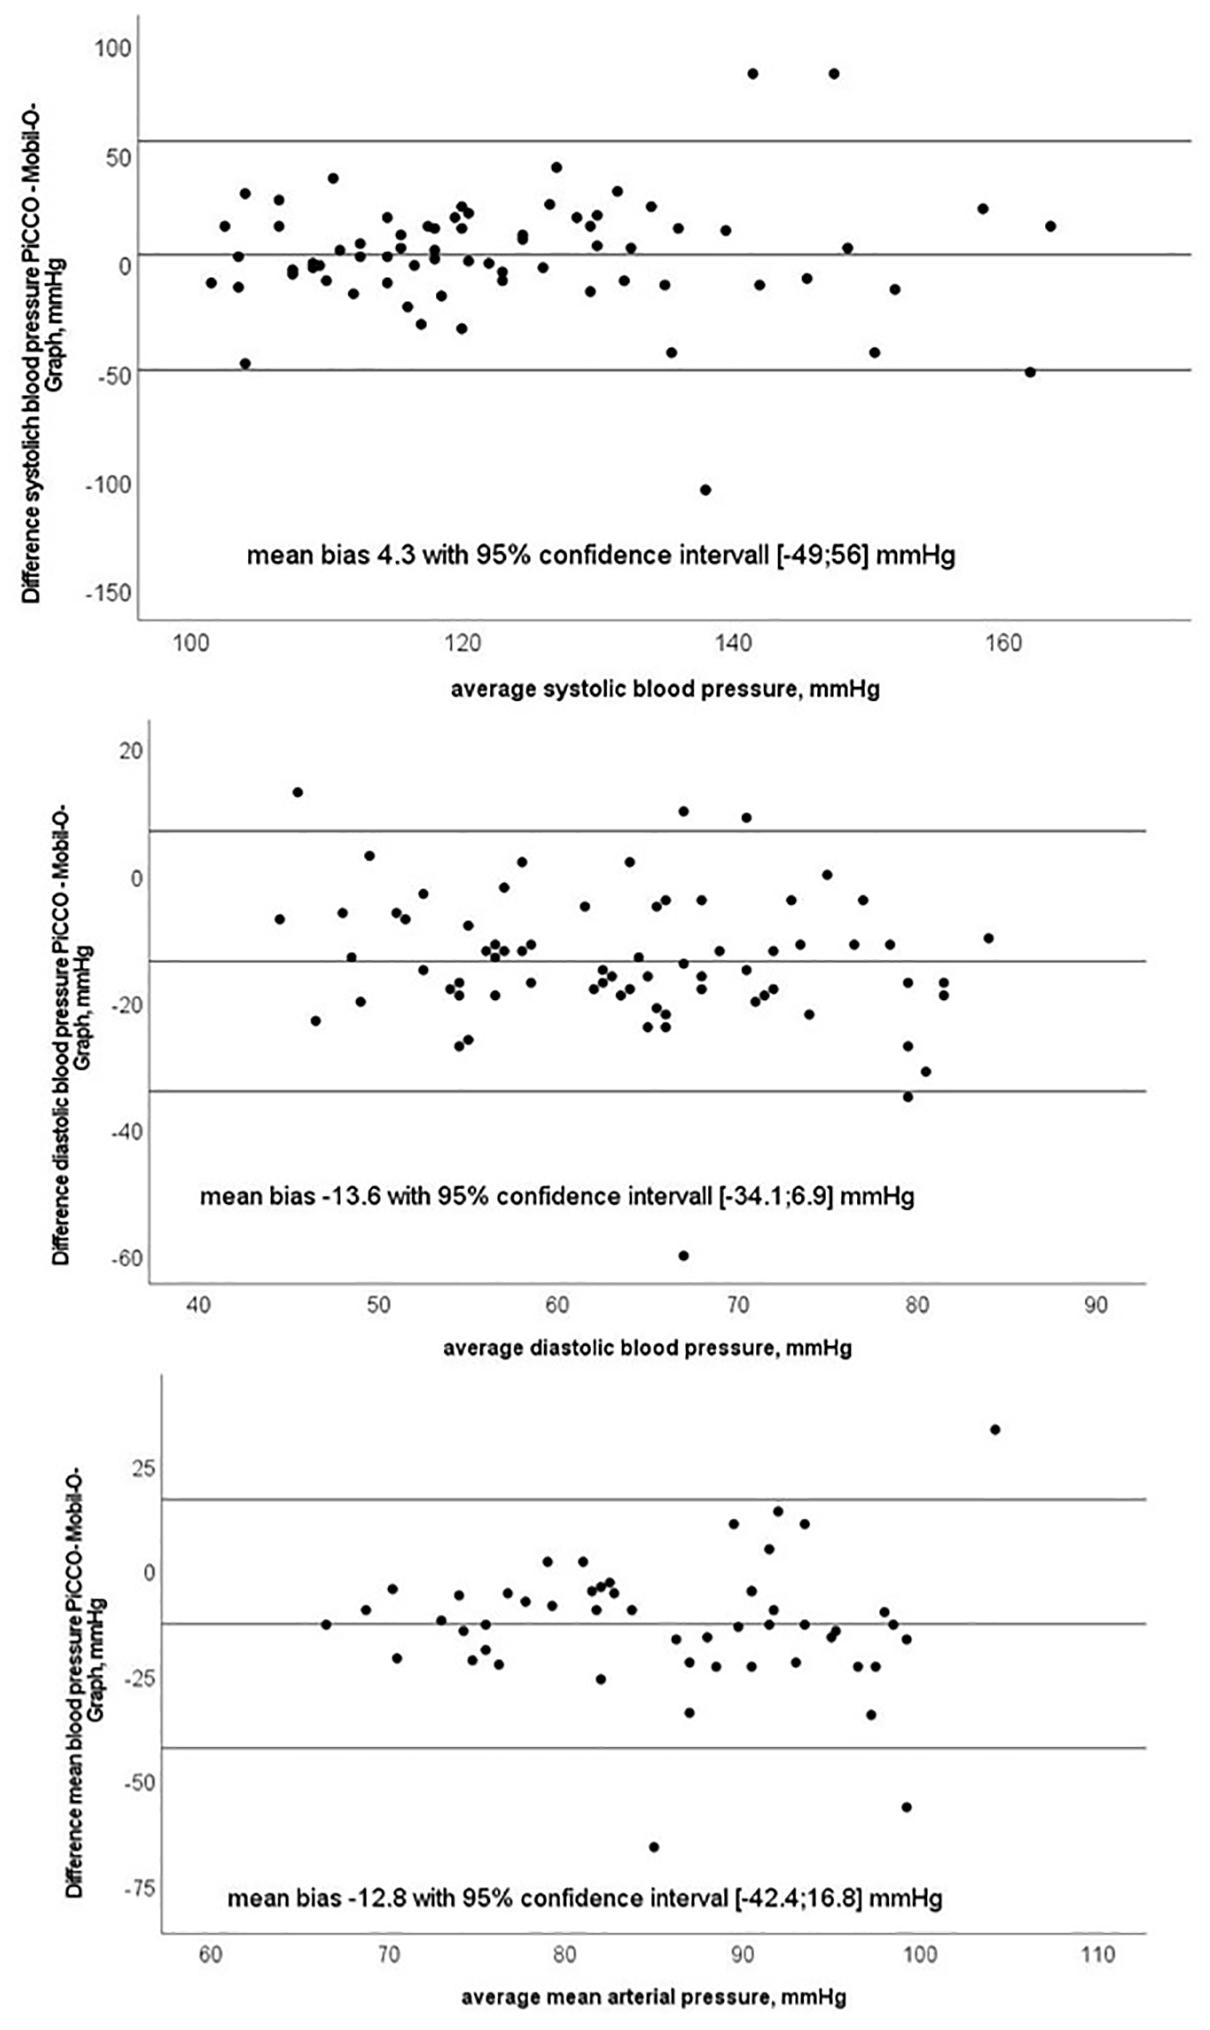
Figure 3. Bland–Altman plots of systolic, diastolic and mean blood pressure with test (Mobil-O-Graph-MG) and reference method (PiCCO® thermodilution).
We observed concordant changes in COI after fluid challenge in 50 percent of all measurements. Figure 4 shows relative CO change (per cent) after fluid challenge for the test and reference device.
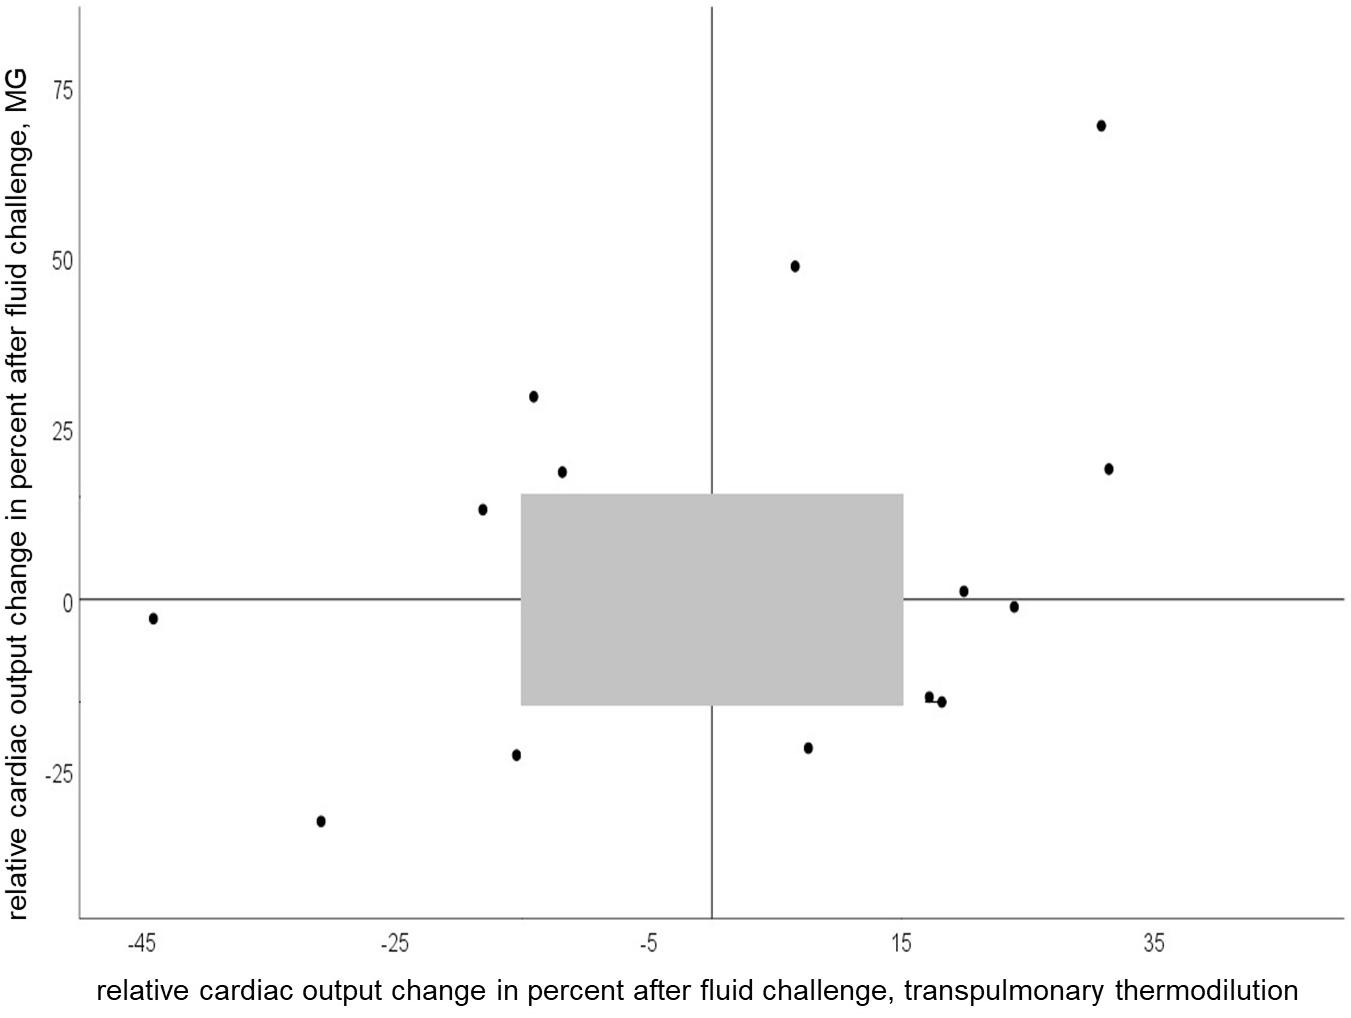
Figure 4. Four-quadrant plot of relative cardiac output change after a fluid challenge of 150 ml with Mobil-O-Graph and PiCCO® (concordance rate = 50%). Gray shaded area represents exclusion zone of 15%.
In the trending analysis of calculated CO with MG and PiCCO® over 6 h, we observed concordant increases or decreases in the CO slope in 50 percent of measurements as a correlate for the trend of changes.
Discussion
In the present study, we evaluated the performance of a non-invasive oscillometry-based method for CO determination (MG) under static conditions and its ability to trend the changes in CO after fluid challenge and over a course of several hours in critically ill patients. We found a moderate correlation between CO estimation with MG and reference PiCCO® measurements and an acceptable mean bias between test and reference device with wide margins in LOA and a high percentage error. Since we performed repeated measurements per subject, high LOA and percentage error may be partly caused by the imprecision of either method (Saugel et al., 2020). We, thus, performed reliability analysis for the test and reference methods, respectively, and observed excellent intraclass correlation coefficients indicating low within-subject variance and high reliability of both methods. The algorithm used in MG relies on the precise derivation of the arterial pressure curve. Indeed, the exact determination of the arterial pressure curve with MG is a challenging process as data acquisition is realized using an occlusive cuff applied to the upper arm recording a wide range of oscillometric amplitudes (Wassertheurer et al., 2008). In our study cohort consisting of critically ill and vasopressor-dependent patients, the arterial pressure waveform signal in the brachial artery can be disturbed or differ significantly from that in the femoral artery (Teboul et al., 2016). Usually, diastolic and mean blood pressure are similar in peripheral and central arteries, and systolic blood pressure is higher in the femoral compared to brachial artery due to wave reflection (Kroeker and Wood, 1955). However, we observed clinically relevant lower systolic and clinically relevant higher diastolic and MAP with even statistical significance for diastolic and MAP between MG and PiCCO®, which is a common finding when blood pressure levels between peripheral (non-invasive), and central (invasive) measurements have been compared in critically ill patients. Imprecise estimation of central arterial pressure during hemodynamic instability can influence the accuracy of derived CO (Compton et al., 2008; Compton and Schafer, 2009).
Plenty of non-invasive CO monitoring devices, which rely on non-invasive pulse wave analysis, pulse wave transit time, or thoracic bioimpedance as a basic principle for CO calculation, have been described in the literature (Papaioannou et al., 2020). Acknowledging that direct comparison with other non-invasive CO determination methods based only on published literature has its limitations due to different reference methods used and different study populations, our data ranged within the margins of published evidence. However, a very recent review on currently available technologies for CO determination using pulse wave analysis does not mention oscillometry as a potential method (Saugel et al., 2021), even though it has some very practical advantages like easiness, and rapidity of measurements as well as no requirement for any specific operator training.
Algorithmic refinements had been made by the manufacturer in 2018. Compared to a previous study with the older software we observed a lower mean bias with comparable LOA and higher percentage error in this study (Reshetnik et al., 2017). A recent study by Papaioannou et al. (2020) showed a comparable mean bias in a smaller cohort in the ICU. According to the cut-off of 30 percent for the percentage error, proposed by Critchley and Critchley (1999) the percentage error found in our study points to precision in need for improvement. As visualized in Figures 1, 2, we observed some extreme values, which can be considered as outliers. Additional correlation analysis without outliers showed same finding of poor correlation between test and reference device.
In the clinical setting tracking CO changes with therapy or overtime is usually more important than the determination of single absolute CO values. Our study is one of the few, in which not only CO response to a singular fluid challenge was considered, but also the ability to track CO changes over a longer period. We observed concordant changes in CO with MG and PiCCO® in 50 percent of the measurements after volume change and over several hours, which points to a weak concordance. Of note, in 67% of cases with non-concordant CO changes recordings were performed while the patients received high-dose vasopressor therapy. Similar findings were reported for other CO calculation methods (Monnet et al., 2010). Indeed, there is evidence that pulse wave analysis devices may struggle to adapt to changes in vascular tone induced by vasopressors (Meng et al., 2011).
We acknowledge several limitations of the study. The number of enrolled subjects was relatively small. We did not use pulmonary artery catheter as the reference method. The vasopressor doses possibly contributing to significant variation in calculated CO varied between the subjects. Arterial compliance has a major influence on CO estimation derived from pulse wave analysis. Rapid changes in vasomotor tone, in particular with higher vasopressor dose, can have an impact on arterial compliance and consequently impair the CO estimation. Due to the non-randomized study design, we cannot account for all possible confounding factors, which may influence the CO. We did not compare BP values between both arms prior to the validation.
Conclusion
To conclude that CO calculation with a novel oscillometry-based pulse wave analysis method is feasible and replicable in critically ill patients. However, a clinically applicable agreement between MG and thermodilution used as a reference method in critically ill patients was not observed using the Bland–Altman approach and with trending analysis methods. In summary, we do not recommend using this method in critically ill patients at this time. As the basic approach is promising and the CO calculation with MG very simple, further studies should be performed in hemodynamic stable patients and critical care setting to gain additional data to be able to further adjust the underlying algorithm for CO determination in this device.
Data Availability Statement
The raw data supporting the conclusions of this article will be made available by the authors, without undue reservation.
Ethics Statement
The studies involving human participants were reviewed and approved by Charité Ethics Committee. The patients/participants provided their written informed consent to participate in this study.
Author Contributions
AR: conception of design, analysis and interpretation of the data, drafting the article, and final approval of the version to be published. JG: conception of design, analysis and interpretation of the data, and drafting the article. MG: conception of design and providing intellectual content of critical importance. FC: interpretation of the data, revising the article, and final approval of the version to be published. All authors contributed to the article and approved the submitted version.
Conflict of Interest
The authors declare that the research was conducted in the absence of any commercial or financial relationships that could be construed as a potential conflict of interest.
Publisher’s Note
All claims expressed in this article are solely those of the authors and do not necessarily represent those of their affiliated organizations, or those of the publisher, the editors and the reviewers. Any product that may be evaluated in this article, or claim that may be made by its manufacturer, is not guaranteed or endorsed by the publisher.
Supplementary Material
The Supplementary Material for this article can be found online at: https://www.frontiersin.org/articles/10.3389/fphys.2021.704425/full#supplementary-material
Supplementary Figure 1 | Cardiac output change in a patient over the time course registered with Mobil-O-Graph® and PiCCO® pulse contour analysis.
Supplementary Figure 2 | Relationship between cardiac output index (CO-Index) measured with transpulmonary thermodilution and Mobil-O-Graph (MG) after exclusion of outliers; Pearson’s r = 0.28; p = 0.02.
References
Bland, J. M., and Altman, D. G. (2007). Agreement between methods of measurement with multiple observations per individual. J. Biopharm. Stat. 17, 571–582. doi: 10.1080/10543400701329422
Cecconi, M., De Backer, D., Antonelli, M., Beale, R., Bakker, J., Hofer, C., et al. (2014). Consensus on circulatory shock and hemodynamic monitoring. Task force of the European Society of Intensive Care Medicine. Intens. Care Med. 40, 1795–1815. doi: 10.1007/s00134-014-3525-z
Compton, F. D., Zukunft, B., Hoffmann, C., Zidek, W., and Schaefer, J. H. (2008). Performance of a minimally invasive uncalibrated cardiac output monitoring system (Flotrac/Vigileo) in haemodynamically unstable patients. Br. J. Anaesth. 100, 451–456. doi: 10.1093/bja/aem409
Compton, F., and Schafer, J. H. (2009). Noninvasive cardiac output determination: broadening the applicability of hemodynamic monitoring. Semin. Cardiothor. Vascul. Anesth. 13, 44–55. doi: 10.1177/1089253208330711
Critchley, L. A., and Critchley, J. A. (1999). A meta-analysis of studies using bias and precision statistics to compare cardiac output measurement techniques. J. Clin. Monitor. Comput. 15, 85–91.
Kroeker, E. J., and Wood, E. H. (1955). Comparison of simultaneously recorded central and peripheral arterial pressure pulses during rest, exercise and tilted position in man. Circulat. Res. 3, 623–632. doi: 10.1161/01.res.3.6.623
Laight, N. S., and Levin, A. I. (2015). Transcardiopulmonary thermodilution-calibrated arterial waveform analysis: a primer for anesthesiologists and intensivists. J. Cardiothor. Vascul. Anesth. 29, 1051–1064.
Lu, M. J., Zhong, W. H., Liu, Y. X., Miao, H. Z., Li, Y. C., and Ji, M. H. (2016). Sample size for assessing agreement between two methods of measurement by bland-altman method. Int. J. Biostat. 12:39.
Meng, L., Tran, N. P., Alexander, B. S., Laning, K., Chen, G., Kain, Z. N., et al. (2011). The impact of phenylephrine, ephedrine, and increased preload on third-generation Vigileo-FloTrac and esophageal doppler cardiac output measurements. Anesth. Analg. 113, 751–757. doi: 10.1213/ane.0b013e31822649fb
Monnet, X., Anguel, N., Naudin, B., Jabot, J., Richard, C., and Teboul, J. L. (2010). Arterial pressure-based cardiac output in septic patients: different accuracy of pulse contour and uncalibrated pressure waveform devices. Crit. Care 14:R109.
Papaioannou, T. G., Xanthis, D., Argyris, A., Vernikos, P., Mastakoura, G., Samara, S., et al. (2020). Accuracy and precision of cardiac output estimation by an automated, brachial cuff-based oscillometric device in patients with shock. Proc. Inst. Mech. Eng. H 234, 1330–1336. doi: 10.1177/0954411919888321
Reshetnik, A., Compton, F., Scholzel, A., Tolle, M., Zidek, W., and Giet, M. V. (2017). Noninvasive oscillometric cardiac output determination in the intensive care unit–comparison with invasive transpulmonary thermodilution. Sci. Rep. 7:9997.
Sakka, S. G., Reinhart, K., and Meier-Hellmann, A. (1999). Comparison of pulmonary artery and arterial thermodilution cardiac output in critically ill patients. Intens. Care Med. 25, 843–846. doi: 10.1007/s001340050962
Saugel, B., Grothe, O., and Wagner, J. Y. (2015). Tracking changes in cardiac output: statistical considerations on the 4-quadrant plot and the polar plot methodology. Anesth. Analg. 121, 514–524. doi: 10.1213/ane.0000000000000725
Saugel, B., Kouz, K., Scheeren, T. W. L., Greiwe, G., Hoppe, P., Romagnoli, S., et al. (2021). Cardiac output estimation using pulse wave analysis-physiology, algorithms, and technologies: a narrative review. Br. J. Anaesth. 126, 67–76. doi: 10.1016/j.bja.2020.09.049
Saugel, B., Thiele, R. H., Hapfelmeier, A., and Cannesson, M. (2020). Technological assessment and objective evaluation of minimally invasive and noninvasive cardiac output monitoring systems. Anesthesiology 133, 921–928. doi: 10.1097/aln.0000000000003483
Teboul, J. L., Saugel, B., Cecconi, M., De Backer, D., Hofer, C. K., Monnet, X., et al. (2016). Less invasive hemodynamic monitoring in critically ill patients. Intens. Care Med. 42, 1350–1359.
Keywords: non-invasive, cardiac output measurement, thermodilution, oscillometric, pulse wave analysis
Citation: Reshetnik A, Gjolli J, van der Giet M and Compton F (2021) Non-invasive Oscillometry-Based Estimation of Cardiac Output – Can We Use It in Clinical Practice? Front. Physiol. 12:704425. doi: 10.3389/fphys.2021.704425
Received: 02 May 2021; Accepted: 16 July 2021;
Published: 03 August 2021.
Edited by:
Bingmei M. Fu, City College of New York (CUNY), United StatesReviewed by:
Gabriele Mulliri, University of Cagliari, ItalyRamakrishna Mukkamala, University of Pittsburgh, United States
Copyright © 2021 Reshetnik, Gjolli, van der Giet and Compton. This is an open-access article distributed under the terms of the Creative Commons Attribution License (CC BY). The use, distribution or reproduction in other forums is permitted, provided the original author(s) and the copyright owner(s) are credited and that the original publication in this journal is cited, in accordance with accepted academic practice. No use, distribution or reproduction is permitted which does not comply with these terms.
*Correspondence: Alexander Reshetnik, YWxleGFuZGVyLnJlc2hldG5pa0BjaGFyaXRlLmRl