 Javier Fernández1,2,3†
 Manuel Fernández-Sanjurjo2,4†
 Eduardo Iglesias-Gutiérrez2,4Pablo Martínez-Camblor5
 Claudio J. Villar1,2,3
 Cristina Tomás-Zapico2,4*
 Benjamin Fernández-García2,6‡
 Felipe Lombó1,2,3‡
- 1Department of Functional Biology, Microbiology, University of Oviedo, Oviedo, Spain
- 2Health Research Institute of the Principality of Asturias (ISPA), Oviedo, Spain
- 3Instituto Universitario de Oncología del Principado de Asturias (IUOPA), University of Oviedo, Oviedo, Spain
- 4Department of Functional Biology, Physiology, University of Oviedo, Oviedo, Spain
- 5Department of Biomedical Data Science, Geisel School of Medicine at Dartmouth, Hanover, NH, United States
- 6Department of Morphology and Cell Biology, Anatomy, University of Oviedo, Oviedo, Spain
Background: The effect of resistance training on gut microbiota composition has not been explored, despite the evidence about endurance exercise. The aim of this study was to compare the effect of resistance and endurance training on gut microbiota composition in mice.
Methods: Cecal samples were collected from 26 C57BL/6N mice, divided into three groups: sedentary (CTL), endurance training on a treadmill (END), and resistance training on a vertical ladder (RES). After 2 weeks of adaption, mice were trained for 4 weeks, 5 days/week. Maximal endurance and resistance capacity test were performed before and after training. Genomic DNA was extracted and 16S Ribosomal RNA sequenced for metagenomics analysis. The percentages for each phylum, class, order, family, or genus/species were obtained using an open-source bioinformatics pipeline.
Results: END showed higher diversity and evenness. Significant differences among groups in microbiota composition were only observed at genera and species level. END showed a significantly higher relative abundance of Desulfovibrio and Desulfovibrio sp., while Clostridium and C. cocleatum where higher for RES. Trained mice showed significantly lower relative abundance of Ruminococcus gnavus and higher of the genus Parabacteroides compared to CTL. We explored the relationship between relative taxa abundance and maximal endurance and resistance capacities after the training period. Lachnospiraceae and Lactobacillaceae families were negatively associated with endurance performance, while several taxa, including Prevotellaceae family, Prevotella genus, and Akkermansia muciniphila, were positively correlated. About resistance performance, Desulfovibrio sp. was negatively correlated, while Alistipes showed a positive correlation.
Conclusion: Resistance and endurance training differentially modify gut microbiota composition in mice, under a high-controlled environment. Interestingly, taxa associated with anti- and proinflammatory responses presented the same pattern after both models of exercise. Furthermore, the abundance of several taxa was differently related to maximal endurance or resistance performance, most of them did not respond to training.
Introduction
Regular exercise is strongly associated with a lower risk of mortality (Myers et al., 2002), in addition to a reduced incidence of most prevalent chronic pathologies in developed countries (Fiuza-Luces et al., 2013; Pedersen and Saltin, 2015). On the other hand, gut microbiota alterations have emerged as one of the common drivers in several highly prevalent conditions, such as metabolic and cardiovascular diseases, as well as in ageing (Qin et al., 2012; O’toole and Jeffery, 2015; Tang et al., 2019). Thus, exercise and gut microbiota have common points of incidence in pathology and health. However, the exact mechanisms through which they carry out this protective effect are not yet entirely elucidated.
In humans, it has been described that regular exercise, mainly endurance (aerobic) exercise, modifies both the general diversity and the abundance of certain gut bacterial phyla or families (Barton et al., 2018). These changes are independent of diet, but they can be reversed once the exercise regime is ceased (Allen et al., 2018). Moreover, acute changes in gut microbiota composition have been also described after a highly exigent endurance exercise such as marathon, precisely in relation to the acute changes in the metabolic demand of this activity (Zhao et al., 2018; Scheiman et al., 2019), suggesting that exercise induces gut microbiome adaptations in a relatively fast way. However, the difficulty in isolating the effect of exercise on human gut microbiome, due to the presence of confounding environmental factors, such as diet (Flint et al., 2015), alcohol and drug use, and even anthropometric characteristics (Rothschild et al., 2018), has led researchers to consider the use of animal models, mainly murine. Although obvious interspecific differences are present, using mouse models for a better comprehension of exercise-induced gut microbiome changes shows many advantages, as reviewed by Nguyen et al. (2015).
Nevertheless, the extrapolation of mice gut microbiota data to humans must be developed with caution. In fact, we have recently highlighted the relevance of having a good knowledge of the composition of the microbiota in mice before performing exercise studies (Fernandez-Sanjurjo et al., 2020), since differences in gut microbiota composition between humans and mice may lead to biased results (Hildebrand et al., 2013; Nguyen et al., 2015; Scheiman et al., 2019). In this regard, several studies have been done exploring the effect of endurance exercise in the mouse gut microbiota under different genetic backgrounds and substrains (Hildebrand et al., 2013). However, these works suffer also from confounding factors that make it difficult to compare between different mouse studies. Thus, differences between endurance exercise protocols, such as voluntary wheel running (VWR) and forced treadmill running (FTR), intensity and duration within sessions, time of intervention, diet composition, and even genetic background (Hildebrand et al., 2013), give rise to different results along the mouse studies on the effect of this model of exercise on gut microbiota profile (Choi et al., 2013; Evans et al., 2014; Allen et al., 2015; Campbell et al., 2016; Lamoureux et al., 2017). Therefore, only when VWR and FTR are compared within the same study, and all other variables are controlled, it can be considered that differences due to distinct endurance exercise regimes in mouse gut microbiota are really observed (Allen et al., 2015; Lamoureux et al., 2017).
Given this consideration regarding mouse models of endurance exercise, where the most common approaches differently affect gut microbiota, there is still a lack of information regarding resistance exercise. Despite its overwhelming relevance for health (Westcott, 2012), the effect of regular resistance exercise on gut microbiota composition has not been analyzed in experimental animal models, although some authors have explored this question in humans, with divergent results (Bycura et al., 2021; McKenna et al., 2021).
Considering the markedly different physiological, metabolic, and molecular mechanisms involved in the response to resistance in contrast to endurance training (Hawley et al., 2014), we hypothesize that both training modalities will exert differential changes in gut microbiota composition. Therefore, the aim of this study was to explore and compare the effect of long-term resistance and endurance training on gut microbiota composition in mice, under controlled conditions, such as diet composition and genetic background.
Materials and Methods
Animals and Experimental Design
A total of 26 C57BL6N male mice, 8-week-old, were randomly divided into three groups: sedentary control (CTL, n = 6), resistance training (RES, n = 8), and endurance training (END, n = 12).
Mice were maintained on a 12 h light/dark cycle (onset at 8:00 AM) and under controlled temperature (22 ± 2°C) at the Animal Facilities of the University of Oviedo, Spain (authorized facility No. ES330440003591). All procedures were conducted during the early light portion of the cycle and performed in accordance with the institutional guidelines approved by The Research Ethics Committee of the University of Oviedo, Spain (PROAE 10/2016). Mice were fed a pellet rodent diet (Teklad Irradiated Global 18% Protein Rodent Diet, Envigo, Spain) and water ad libitum. The food intake and body weight were measured weekly.
Training Devices
Endurance training was performed on a treadmill without any aversive stimuli. We used a four-lane commercial rat treadmill (TSE Systems, Germany), with adjustable speed and slope. Rat treadmill is adequate for running four mice at the same time in a lane, maintaining the cage’s group. Resistance training was carried out in an own-manufactured ladder, as described by Codina-Martinez et al. (2020).
Training Protocols
The same researcher handled and trained the mice during the different stages of training, as previously described by Codina-Martinez et al. (2020): acclimation period, physical performance tests (pre- and post-training), and training protocols.
Acclimation Period
Before starting the training program, mice were acclimatized to the training devices for 2 weeks, 5 sessions per week, and 15 min per training session (Kregel et al., 2006). This period was designed to maintain training load to a minimum, avoiding training adaptations that could interfere with pre-training maximal performance tests and guaranteeing no mouse rejects forced exercise training (Kregel et al., 2006).
During the first week, mice were placed on the treadmill without movement and in the resting area at the top of the ladder for periods of 20 min. The following week, acclimatation with movement was performed. Thus, mice walked on the treadmill at 6 m/min. Additionally, they were taught to climb the ladder from the 5th top step to the resting area, increasing the number of climbed rungs gradually to 10. A piece of clinical tape was placed on their tails, where the weight will be placed during the training period, as they climbed the ladder to familiarize the mice with this procedure. After a few days, a lightweight load (5 g) was attached to the mice’ tails with clinical tape. Mice were adapted to run on the treadmill and to climb the ladder without any aversive stimuli throughout all stages of the training protocol, to diminish confounder factors and favoring repeatability maximal tests (Kregel et al., 2006; Knab et al., 2009; Conner et al., 2014; Allen et al., 2015), allowing us to train all the mice without refusals.
Maximal Performance Tests
Forty-eight hours after the end of the acclimation period, mice were randomly distributed in the above-mentioned groups. Then, those at the END and RES groups performed a maximal endurance or resistance test, respectively.
Maximal endurance capacity was determined by an incremental test in the treadmill, as described before by Codina-Martinez et al. (2020). After a 10-min warm-up at 9 m/min with 10° slope, the incremental test started at 12 m/min. Every 3 min speed was increased by 3 m/min, until exhaustion. Maximum speed (m/min) and total time (min) were recorded, to calculate the total distance (m) as a measurement of endurance capacity.
Maximal resistance capacity was tested in the ladder, following a protocol adapted from previous studies (Codina-Martinez et al., 2020). Mice performed a warm-up consisting of 3 series of 10 repetitions, 10 steps/repetition, at 90° of slope, without external load. The mice rested for 60 s between series. Then, the slope was set at 85° and the mice performed successive series of 10 steps with increasing external loads until exhaustion. The starting external load was 10 g, increasing 5 g in each series. The mice rested for 120 s in the resting area after each series. If the mice failed to climb 10 steps with a particular weight load, they were allowed another try with the same load after 120 s of rest. If they failed again, the weight load of the last complete series was recorded as their maximal weight load. The maximal resistance capacity was expressed as the maximal weight load relative to body weight (%).
Both tests were repeated at the end of the training period, following the same protocols.
Training Protocols
All END and RES mice were trained for 4 weeks, 5 days/week (Monday to Friday). Training protocols were adapted from previous works (Kregel et al., 2006; Codina-Martinez et al., 2020) in terms of intensity and duration of sessions. To reduce mice anxiety, they were trained in groups of four animals from the same cage. Aversive stimuli were also avoided, to minimize stress.
Endurance training sessions started with identical warm-up as for the maximal endurance performance test. Then, all sessions of continuous running had a mean duration of 60 min and the distance covered every day was 1,000 m. However, the intensity in terms of maximal speed, number of stages, as well as the speed and duration of each stage, varied along the week according to this structure: 2 days at high intensity (Tuesday and Friday), 2 days at moderate intensity (Monday and Thursday), and 1 day at low intensity (Wednesday). Speed ranged from 12 to 24 m/min, which corresponded to 40–80% of mean maximal speed at the pre-training test (Kemi et al., 2002). The duration of each stage varied inversely with speed, between 15 and 5 min (Kemi et al., 2002). The slope was fixed at 10°. Maximal intensity increased throughout the training period, although maintaining the weekly schedule and the duration and the distance covered in training sessions.
Resistance training sessions started with an identical warm-up as for the maximal resistance performance test. Then, all sessions were designed to achieve the same exercise volume through a combination of the number of steps climbed (or distance against gravity) and weight load (Figueiredo et al., 2018). Considering the combination of these parameters, an accumulated work of 260 mJ (g m2/s2), was achieved daily. The number of steps per training session varied between 400 and 2,000 depending on the maximal weight load, which ranged between 20 and 50 g or 25–65% of the maximal weight load at the pre-training test. We selected these maximum weight ranges because it has been described that below 75% of 1 repetition maximum there is no velocity loss, which is important for standardizing intensity of submaximal efforts (Gentil et al., 2018). Week planning was: 2 days with high weight load and low number of steps (Tuesday and Friday), 2 days of intermediate weight load and the number of steps (Monday and Thursday), and 1 day without weight load but a high number of steps (Wednesday). The number of steps and the maximum weight loads increased throughout the training period, although maintaining the weekly schedule, as well as the accumulated work and the percentages of maximum weight load.
CTL mice remained in a cage, in the same room, while END and RES groups were training.
Genomic DNA Extraction and 16S rRNA Sequencing for Metagenomics
All mice were sacrificed at 16 weeks of age by CO2 inhalation, 24 h after the last exercise bout. Caeca were extracted and preserved at −80°C until extraction. E.Z.N.A.® DNA Stool Kit (VWR International, Spain) was used for genomic DNA (gDNA) extraction (200 mg of frozen cecal content). A BioPhotometer® (Eppendorf Ibérica S.L.U., Spain) was used for gDNA quantification, a prior step before preparing working solutions diluted to 6 ng/μl, which were needed for PCR amplification. 16S rRNA PCR amplification was carried out with the 16TM Metagenomics Kit (A26216, Fisher Scientific, Spain), using 7 out of 9 hypervariable regions in this gene, via two PCR amplifications (two sets of oligonucleotides pools: on one side, the regions V2, V4, and V8 (amplicons 250, 288, and 295 bp respectively); and on the other side the regions V3, V6-V7, and V9 (amplicons 215, 260, and 209 bp respectively). PCR amplicons were used to generate a library (Ion Plus Fragment Library kit for AB Library Builder™ System, Fisher Scientific). The indexing of each sample was carried out with the Ion Xpress™ Barcode Adapters 1–96 kit (Thermo Fischer Scientific). The ION OneTouch™ 2 System and the ION PGM™ Hi-Q™ OT2 kit (Fisher Scientific) was used for preparing the templates. The ION™ PGM Hi-Q™ Sequencing kit (Fisher Scientific) on the ION PGM™ System was used for metagenomics sequencing. The ION 318™ v2 Chip (Fisher Scientific) was used (Fernandez et al., 2018).
For each mouse metagenomics, the consensus spreadsheet (ION Reporter software 5.6, Fisher Scientific, Spain) included the percentages for each phylum, class, order, family, or genus/species. Shannon and Simpson diversity indexes were calculated using ION Reporter software. These data were used to compare frequencies between groups. Taxonomic adscription up to species level was performed using the QIIME 2 (v.2017.6.0) open-source bioinformatics pipeline (Caporaso et al., 2010). The reference library used was the Curated MicroSEQ(R) 16S Reference Library v2013.1; Curated Greengenes v13.5 (Fernandez et al., 2018). The number of mapped reads (after the ignored ones due to less than 10 copies) per sample was always over 100,000. Counts were normalized by sum scaling. All raw metagenomics data have been deposited at NCBI SRA database (accession number PRJNA558220).
For further analysis, only those taxa with a relative abundance ≥0.1% in at least one of the groups were used (Supplementary Table S1).
Statistical Analysis
Normality of the variables was tested by means of the Shapiro–Wilk test. Initial comparison between the three experimental groups for families, species and genera were performed using PERMANOVA tests. Principal component analysis was used for dimension reduction. Bivariate representation of the participant using the two main components are also provided. Comparison between the three experimental groups was performed using one-way ANOVA test with Tukey’s post hoc test. Spearman’s correlation coefficient was calculated to explore associations between variables. Graph Pad Prism 8 (Graph Pad Software, La Jolla, CA, United States) and R.4.01 (www.r-project.org) including the PERMANOVA package were used for statistical analysis. Differences between groups were considered significant when value of p < 0.05. The statistical significances are indicated in the text and in the figures.
Results
Trained Mice Characteristics
During the four-week training period, no differences were observed among the three groups (CTL, END, and RES) in daily food intake or body weight. All groups increased their body weight at the end of the intervention with respect to baseline (data not shown). Regarding physical capacities, both END and RES groups significantly improved the respective trained capacity after the four-week training period (Figure 1).
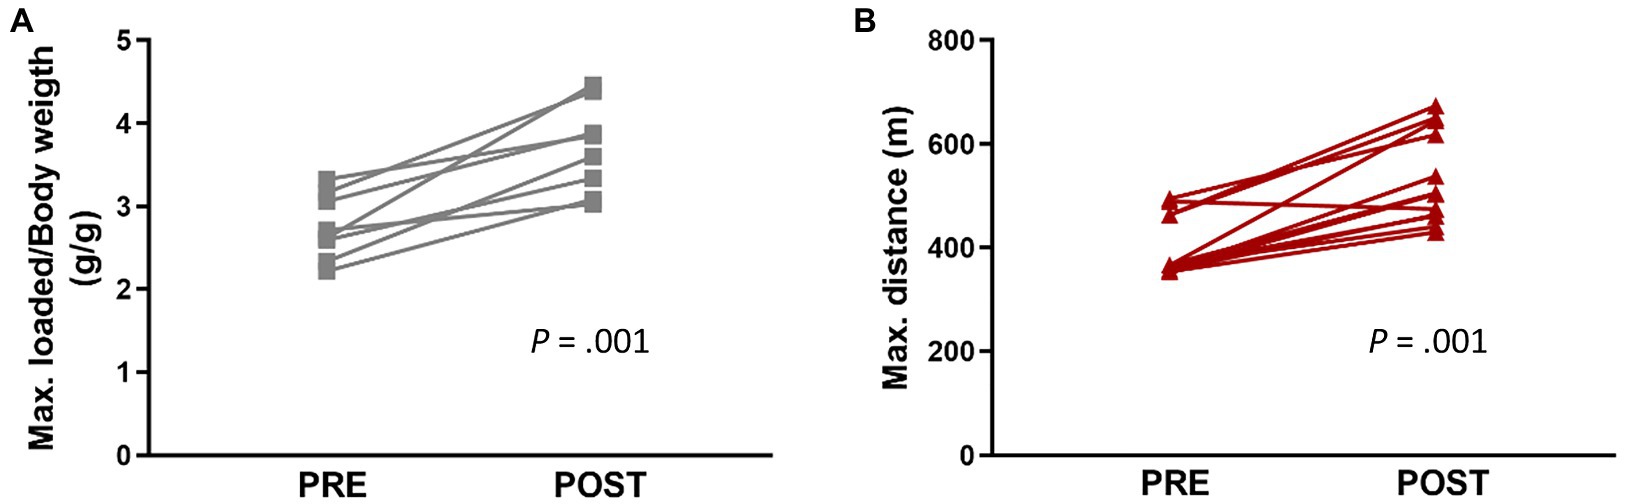
Figure 1. Maximal performance tests developed before (Pre) and after (Post) exercise intervention in resistance (A, n = 8) and endurance (B, n = 12) groups. Each dot represents one mouse. Statistically significant differences are marked with the value of p for each comparison.
An Overview of Gut Microbiome Composition
Considering all mice data, cecal 16S metagenomic dataset yielded a total of 11 phyla, 21 classes, 42 orders, 90 families, 64 genera, and 68 species. For further analysis, only those taxa with a relative abundance ≥0.1% were used (Supplementary Table S1).
Gut microbiota biodiversity was determined by Shannon and Simpson indexes. Our results show that END mice presented significantly higher values for both indexes in comparison to CTL mice (Figures 2A,B). Although Shannon and Simpson indexes reflect diversity, Shannon index has a higher sensitivity to species richness, whereas Simpson index to species evenness (Johnson and Burnet, 2016), suggesting that not only END mice had more different species within their microbiome, but also that this diversity is more uniform. No differences among training groups were found at phylum, class, order, nor family level. For instance, at family level, the PERMANOVA gives a value of p of 0.086. Figure 2C shows the points and the centroids for the three different groups projected on the two main dimensions of the principal component analysis (PCA) for the families, which explain a 30% of the total variance. Firmicutes (~60%) and Bacteroidetes (~30%) were the most abundant phyla in all mice, followed by Proteobacteria (~5%), whereas Lachnospiraceae (~24%), Phorphyromonaceae (~16%), Clostridiaceae (~14%), Lactobacillaceae (~9%), and Bacteroidaceae (~8%) account for the most abundant families. Significant differences among training groups were observed at genus and species level (value of p of 0.009). In Figure 2D, genera and species in the first two main dimensions of PCA, which explain 37% of the total variance, are plotted.
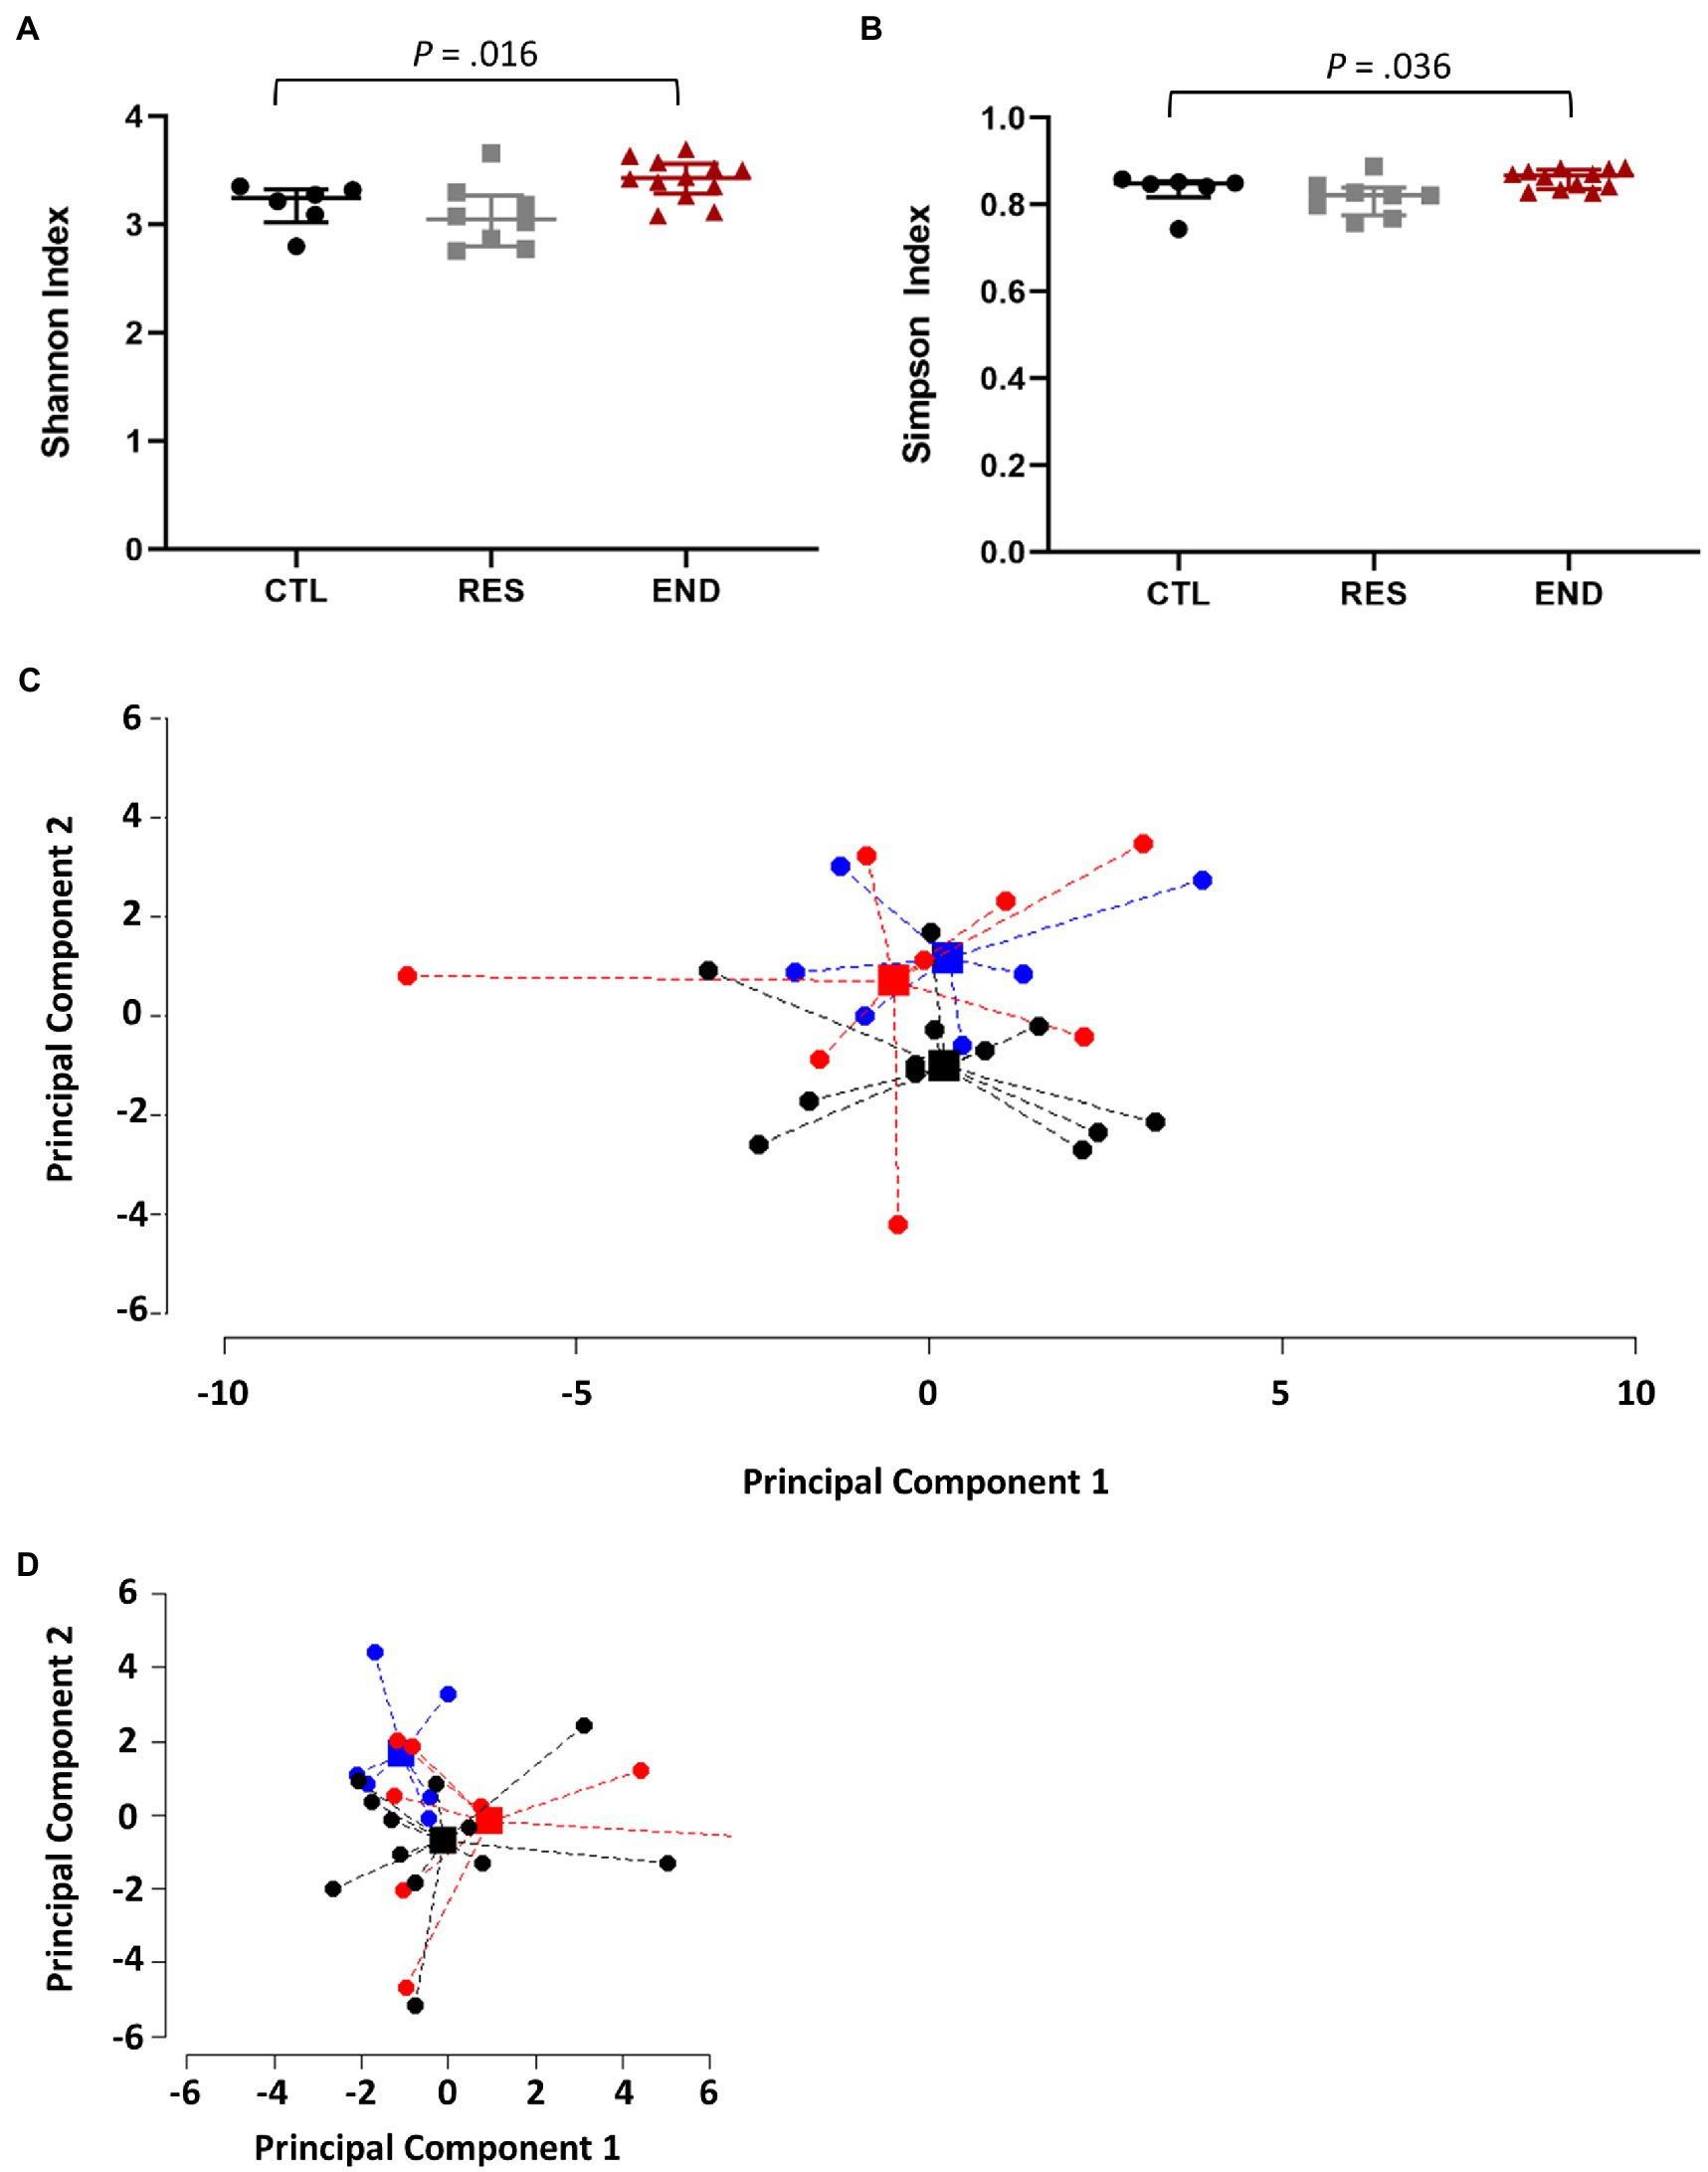
Figure 2. Gut microbiome composition. (A) Gut microbiome diversity using the Shannon index. (B) Gut microbiome evenness using the Simpson index. (C) Points and centroids of the PERMANOVA analysis for the three different groups projected on the two main dimensions of the principal component analysis (PCA) at family level. (D) Points and centroids of the PERMANOVA analysis for the three different groups projected on the two main dimensions of the principal component analysis (PCA) at genera and species levels. CTL: control (n = 6), RES: resistance (n = 8), END: endurance (n = 12). Data are presented as mean ± SEM. Each dot represents one mouse. Statistically significant differences are marked with the value of p for each comparison.
Comparing Exercise Models
Within Firmicutes phylum, both END and RES mice showed significantly less relative abundance of the species Ruminococcus gnavus regarding CTL (Figure 3A). Interestingly, within the second most abundant phylum, Bacteroidetes, the genus Parabacteroides presented higher relative abundance in both END and RES groups as compared to CTL (Figure 3B).
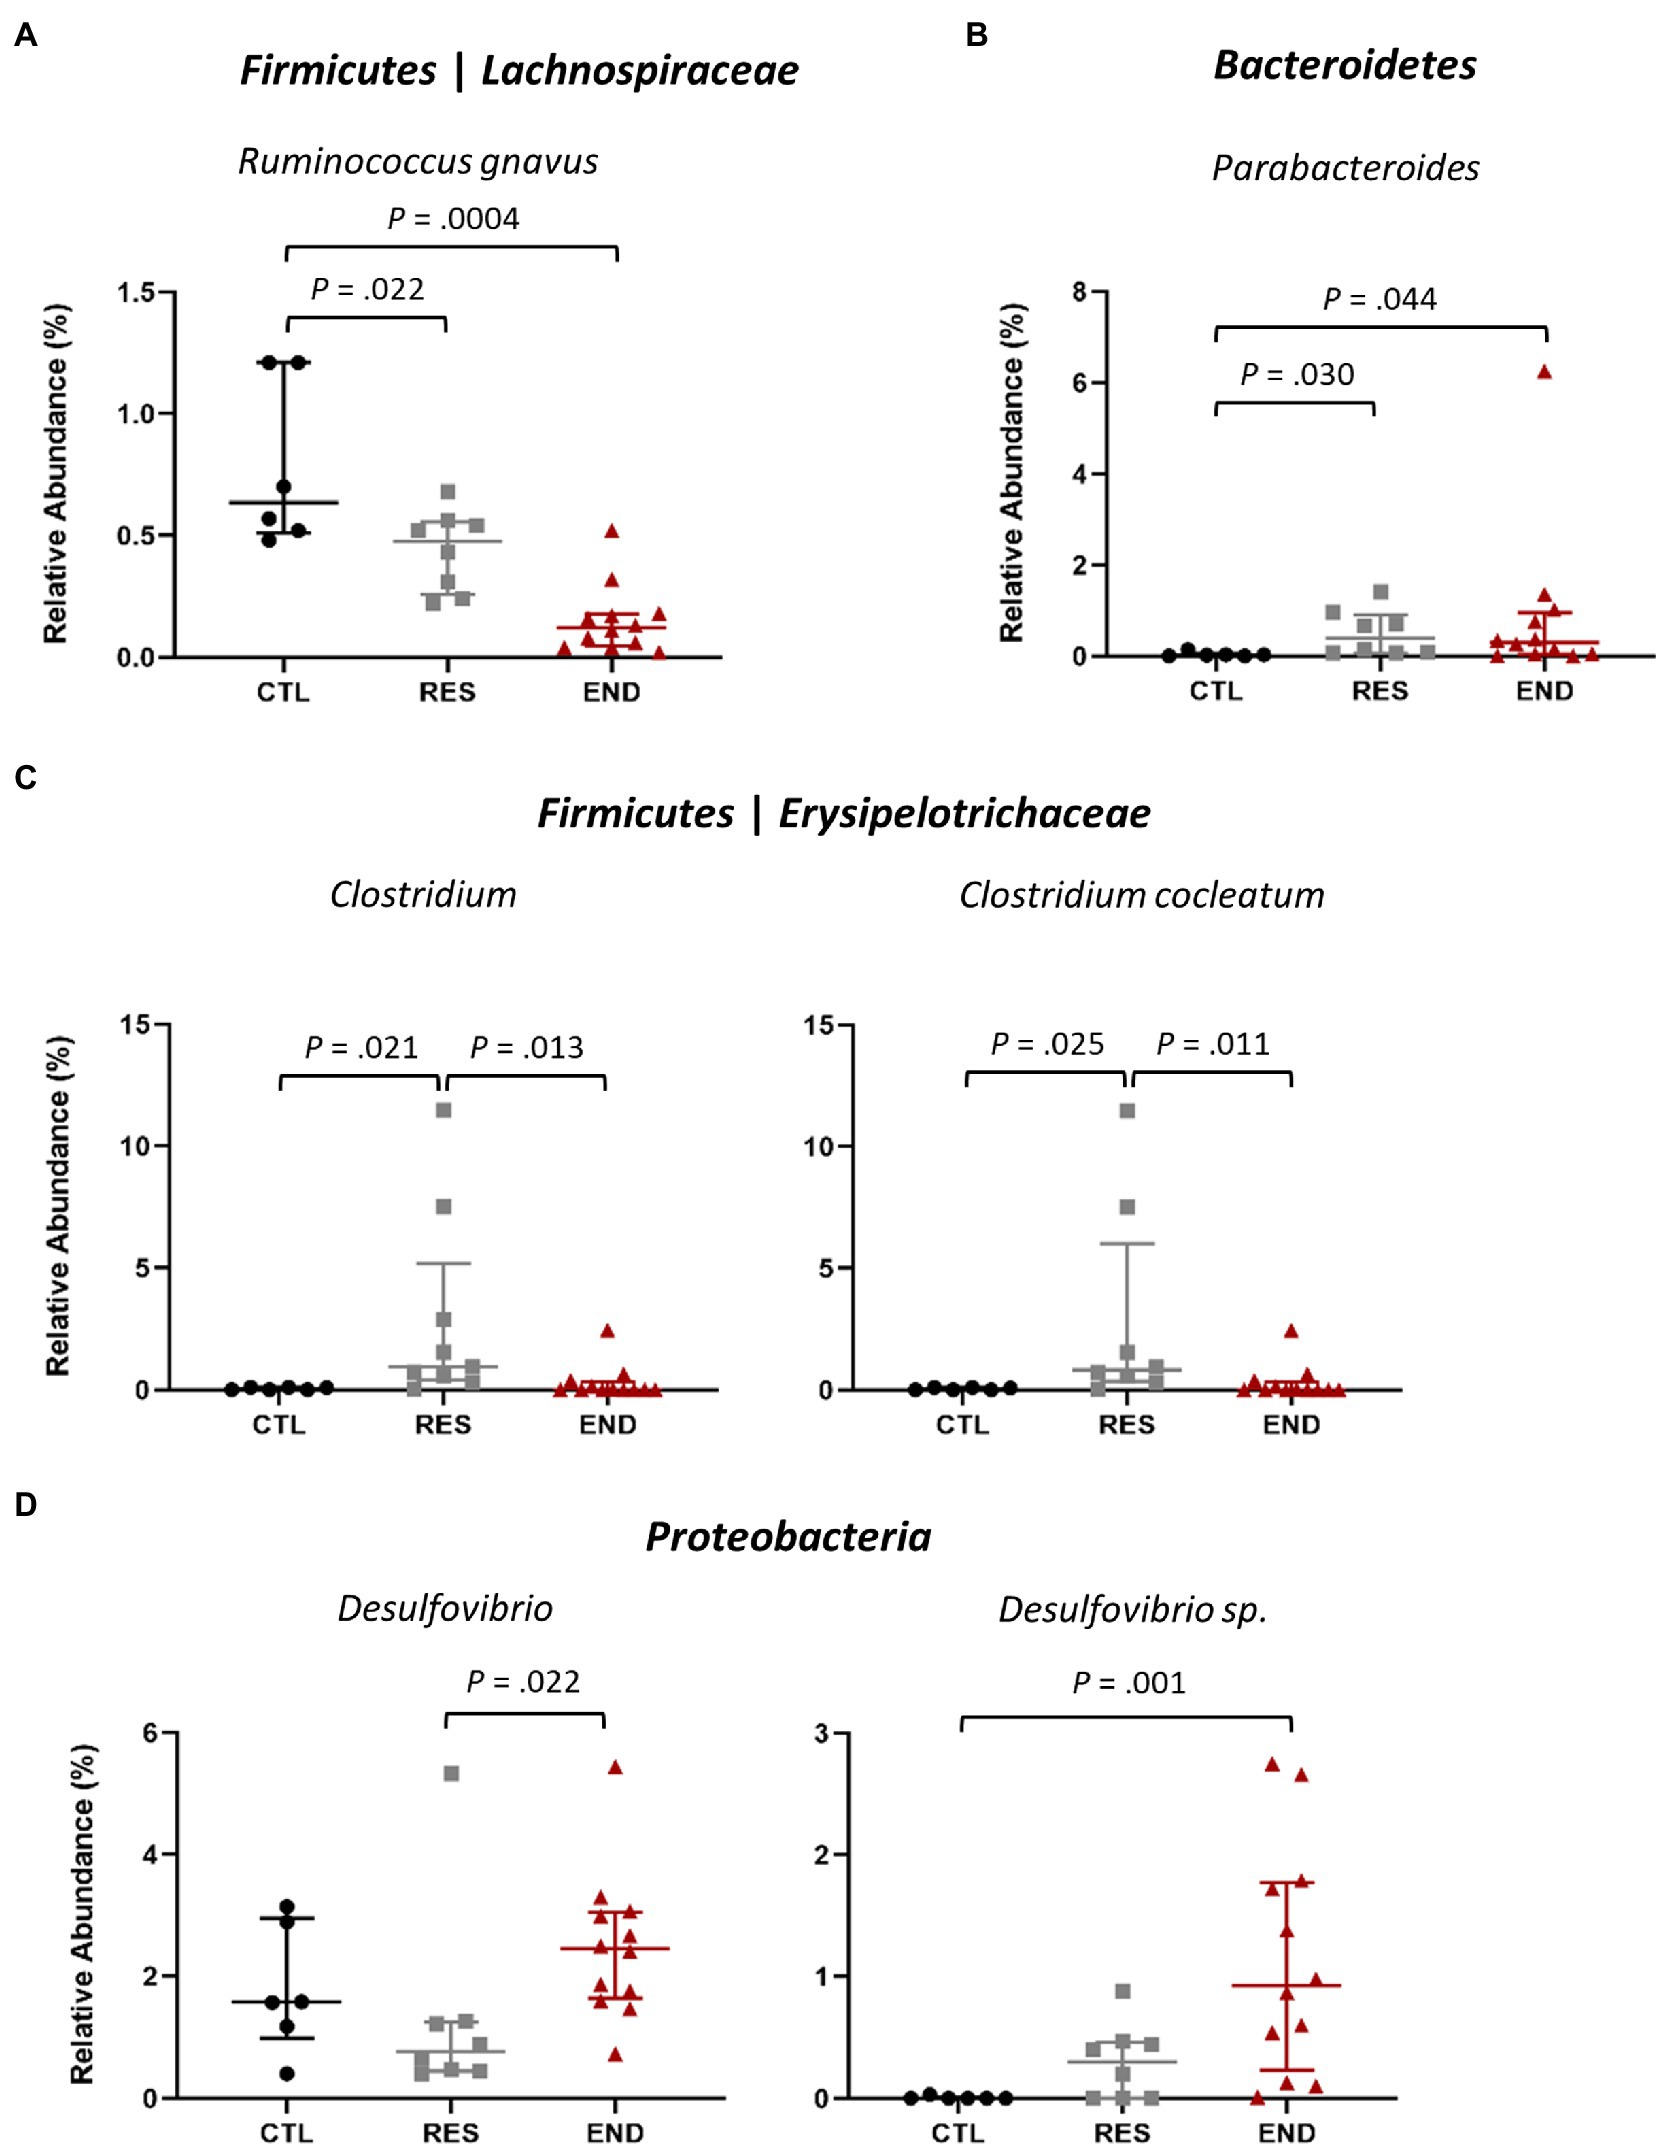
Figure 3. Relative abundance at genus and species after exercise intervention. (A) Ruminococcus gnavus. (B) Parabacteroides. (C) Clostridium and the species C. cocleatum. (D) Desulfovibrio, including the taxon Desulfovibrio sp. CTL: control (n = 6), RES: resistance (n = 8), END: endurance (n = 12). Data are presented as mean ± SEM. Each dot represents one mouse. Statistically significant differences are marked with the value of p for each comparison.
RES group displayed higher relative abundance of Clostridium and C. cocleatum compared to CTL and END (Figure 3C), while Desulfovibrio and Desulfovibrio sp., belonging to the phylum Proteobacteria, yielded higher relative abundance in END group regarding RES and CTL (Figure 3D).
Correlations Between Gut Microbiome Relative Abundance and Physical Performance
We further explored the possible correlation of the different detected taxa with performance in the incremental test after exercise intervention. Thus, we estimated the relationship between the cecal microbiota relative abundance detected after exercise training and the physical performance of the mice at the post-training test, corrected by the body weight of each mouse. When considering RES group, we found that the Proteobacteria taxon Desulfovibrio sp. had a negative correlation with resistance performance (Figure 4A), while the genus Alistipes (phylum Bacteroidetes) was positively correlated (Figure 4B). Interestingly, END mice presented a higher number of taxa which correlated with physical performance (Figure 4C). For instance, Firmicutes phylum showed a negative correlation with endurance performance, and such negative correlation was also seen in the family Lachnospiraceae and in the species Lactobacillus taiwanensis, from the Lactobacilljaceae family. Additionally, the genera Parasutterella, a Proteobacteria, and the phylum Deferribacteres also presented a negative correlation with endurance final performance test (Figures 4D,E). On the other hand, the phylum Bacteroidetes showed a strong positive correlation with endurance performance, being the family Prevotellaceae and the genus Prevotella great contributors to this correlation (Figure 4F). Lastly, the phylum Verrucomicrobia also displayed a positive correlation with endurance performance, having as its only representative the bacterium Akkermansia muciniphila (Figure 4G).
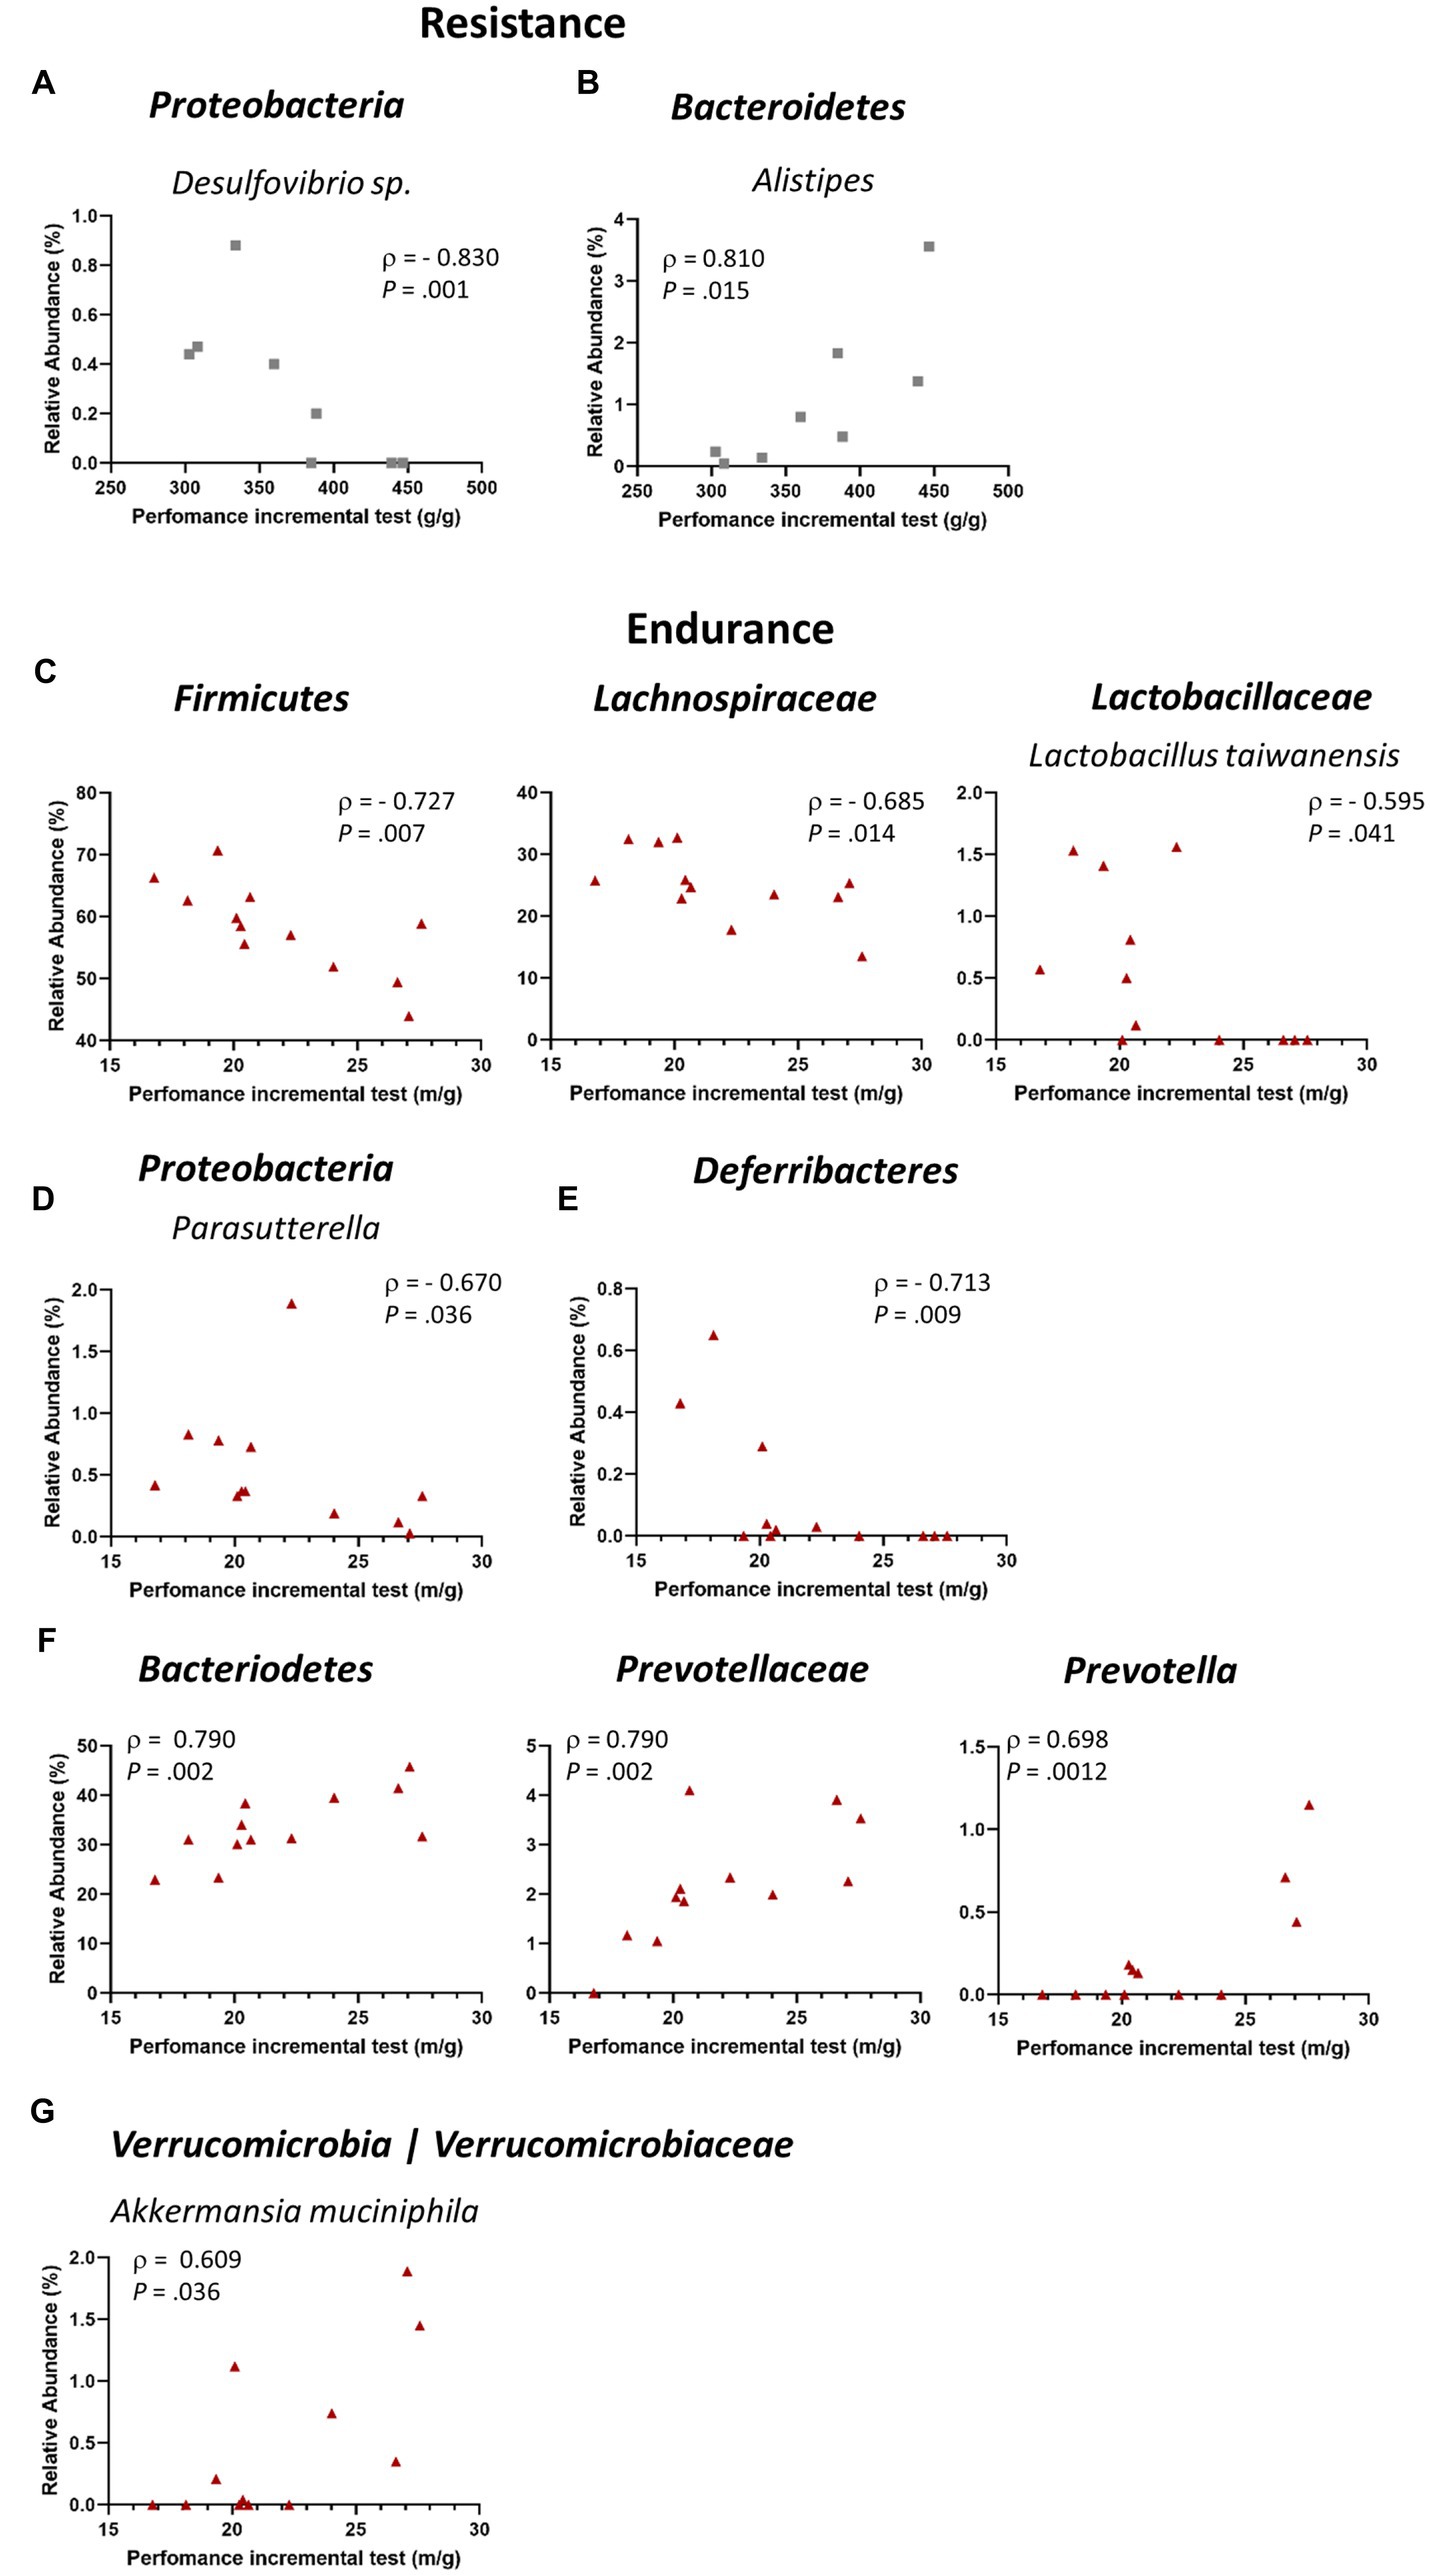
Figure 4. Correlations between gut microbiome relative abundance and physical performance. (A,B) Correlations between relative abundance and final resistance performance (n = 8); (A) Proteobacteria (species Desulfovibrio sp.); (B) Bacteroidetes (genus Alistipes). (C–G) Correlations between relative abundance and final endurance performance (n = 12); (C) Firmicutes (including the family Lachnospiraceae and the species L. taiwanensis); (D) Proteobacteria (genus Parasutterella); (E) Deferribacteres; (F) Bacteroidetes (including the family Prevotellaceae and the genus Prevotella). Each dot represents one mouse. Spearman’s rank correlation coefficient, ρ, and value of p are shown for each correlation.
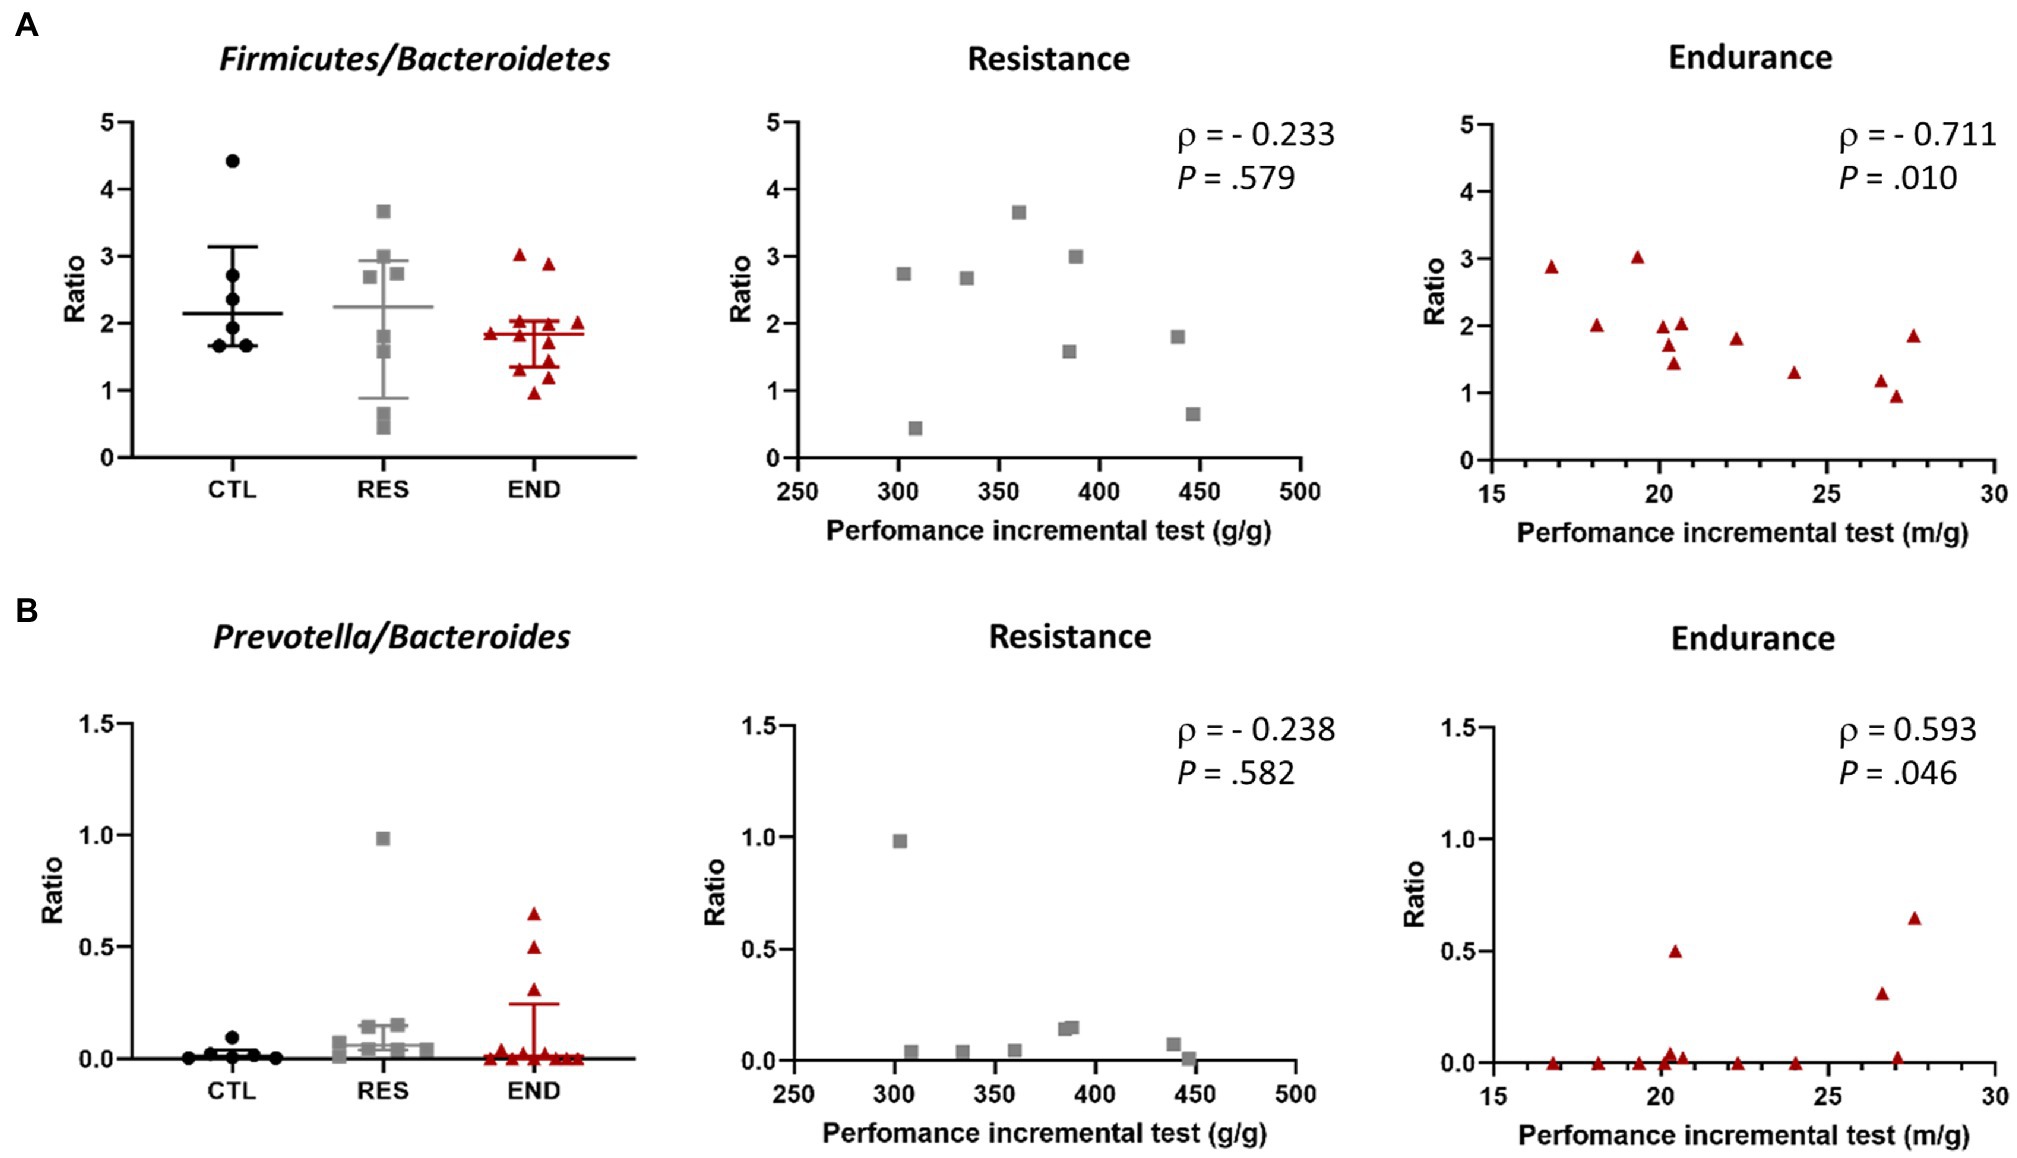
Figure 5. (A) Firmicutes/Bacteroidetes ratio in the three groups, and its correlation with exercise performance in resistance and endurance groups. (B) Prevotella/Bacteroidetes ratio in the three groups, and its correlation with exercise performance in resistance and endurance groups. CTL: control (n = 6), RES: resistance (n = 8), END: endurance (n = 12). Ratios are presented as mean ± SEM. Each dot represents one mouse. Spearman’s rank correlation coefficient, ρ, and value of p are shown for each correlation.
The Firmicutes to Bacteroidetes ratio and the Prevotella to Bacteroides ratio were calculated. We did not observe differences among intervention groups (Figures 5A,B). Strikingly, maximal endurance capacity at the end of the training period showed a negative correlation with Firmicutes to Bacteroidetes ratio (Figure 5A), while a positive correlation was observed with the Prevotella to Bacteroides ratio (Figure 5B).
Discussion
Murine models used in early microbiome studies in the context of exercise suggested the profound effect intestinal microbiota composition has on exercise performance, since germ-free and gnotobiotic mice showed a lower endurance capacity (Hsu et al., 2015). Similarly, it is known that endurance training induces in gut microbiota composition, both in human (Allen et al., 2018) and mouse (Campbell et al., 2016), while no information is available about resistance exercise in mice. In this regard, Chen et al. (2021) reported that strength training modified the gut microbiota composition of healthy and multiple sclerosis mice, although it seems unlikely that the training device used by the authors allows for specific resistance training. Therefore, these results should be taken with caution regarding the effect of resistance training on gut microbiota composition in mice.
One of the main concerns in the analysis of gut microbiota is the confounding effect of both environmental (Rothschild et al., 2018) and genetic (Hildebrand et al., 2013) variables, that make it difficult to isolate the effect of exercise. In this sense, the analysis of samples obtained from experimental animals has several advantages, despite important interspecific differences in gut microbiota composition with humans (Ley et al., 2005). On the one hand, there is a more feasible possibility of accessing cecal samples, which gives a closer idea of the established microbiota (Marteau et al., 2001). In addition, the use of a homogeneous diet allows the elimination of the confusing effect of different food components (Flint et al., 2015). Finally, experimental animal models are inbred, providing a more homogenous genetic background (Nguyen et al., 2015), considering the strong influence of host genetics on gut microbiome composition (Goodrich et al., 2014). Thus, taking this into consideration, we explored here, for the first time, the effect of long-term resistance training on gut microbiota in mice. We have found that exercise training modifies gut microbiota composition and that some of these changes show a specific profile depending on the capacity most emphasized during training, resistance or endurance.
In our study, endurance training favored both high diversity and evenness, according to Shannon and Simpson indexes, respectively. However, neither END or RES showed differences with CTL in terms of phyla and families compositions. Differences were observed at genus and species levels, suggesting that the potential rearrangements promoted by exercise affect mainly lower taxonomic levels in our model. In fact, we found that some taxa are modified by training, independently of the model of exercise, while others are specific for endurance or resistance training. In this way, the Firmicutes genus Clostridium, and the species C. cocleatum, is specifically changed after resistance exercise. C. cocleatum has been previously implicated in the prevention of C. difficile infections in mice (Boureau et al., 1993) and it was found to be increased after metformin treatment of high-fat diet mice, positively correlated with AMPKα1 levels in liver (Lee and Ko, 2014), which suggests its possible association with metabolic improvement (Lee and Ko, 2014). Interestingly, the genus Clostridium has been earlier shown to be more abundant in cecal samples from a FTR endurance mouse model regarding sedentary mice, although not reaching species level (Allen et al., 2015). In that study, the FTR training design had a lower intensity than our FTR endurance model, and mice were from a different substrain (C57BL/6J vs. C57BL/6N), which can account for the differences observed between both studies (Hildebrand et al., 2013; Table 1). However, we found that high intensity endurance exercise specifically changes the Proteobacteria genus Desulfovibrio, and the species Desulfovibrio sp. Desulfovibrio is a hydrogen sulfide (H2S) producer, a compound which has been proposed to act, in conjunction with the SIRT1 pathway, in the prevention of endothelial cells age-associated apoptosis after endurance exercise in mice (Das et al., 2018). Thus, H2S production by Desulfovibrio may improve endothelial function during endurance training, at least in mice, favoring the appropriate oxygen supply to cells, something that deserves to be studied in more depth.
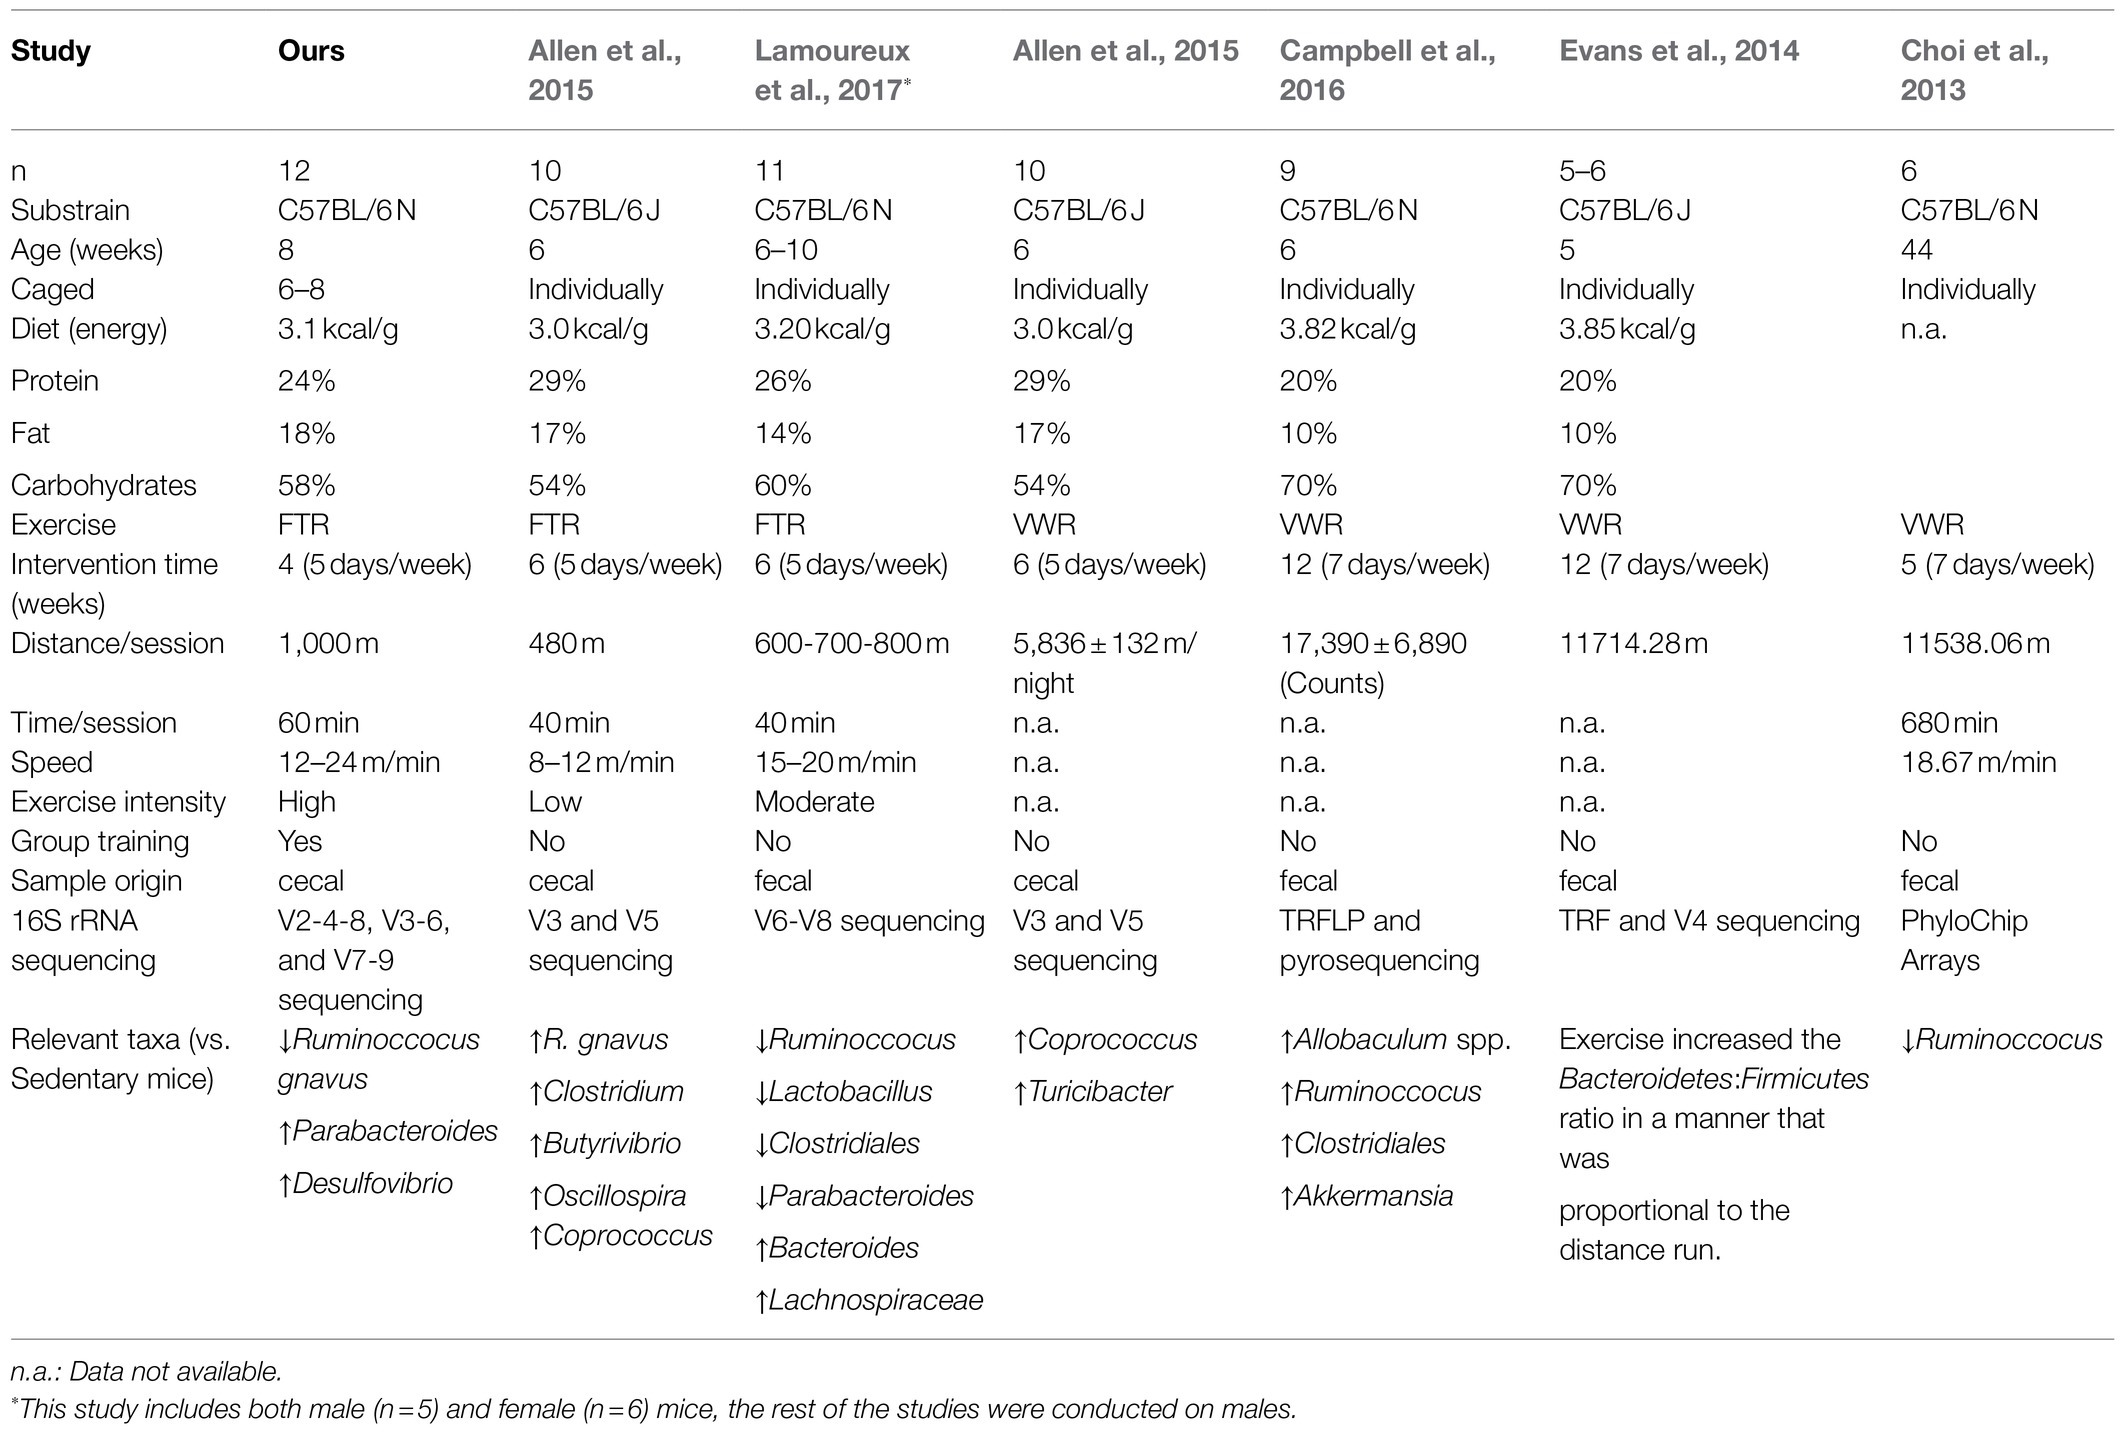
Table 1. Comparison of our study and previous studies regarding gut microbiota in mice that have undergone endurance exercise.
In addition to these model of exercise dependent taxa, other taxonomic groups responded to physical training independently of the model of exercise. In this sense, the increase in anti-inflammatory Parabacteroides and the decrease in pro-inflammatory bacterium Ruminoccoccus gnavus showed similar patterns for END and RES, suggesting a role of exercise in the modulation of the balance between pro- and anti-inflammatory microbiota (Le Chatelier et al., 2013). Interestingly, a previous study developed in rats subjected to concurrent training also showed an increase in Parabacteroides (Carbajo-Pescador et al., 2019). However, differences in the behavior of R. gnavus are seen among previous works regarding endurance exercise (Table 1). In fact, our results showed that R. gnavus relative abundance is lower in trained than in sedentary mice. These results contrast with other endurance FTR models, of lower intensity, where this species was found increased after endurance exercise (Allen et al., 2015). Interestingly, the genus Ruminoccocus has different behavior among endurance studies, since it could appear either increased (Campbell et al., 2016) or decreased (Choi et al., 2013; Lamoureux et al., 2017), reinforcing the fact that comparison among different studies have to be made with great caution in order to understand what the origin of the discrepancies at this level could be (Table 1).
Apart from the analysis of the effect of physical training on gut microbiota composition, another point of interest is the study of the relationship between gut microbiota composition and physical performance. To better understand which taxa are the most relevant in terms of exercise performance, we correlated the relative abundance with resistance or endurance performance after the training intervention (Fernandez-Sanjurjo et al., 2020). Interestingly, most of the performance-related taxa were not modified by training.
Two taxa were found to be correlated with resistance exercise in our model. Interestingly, Desulfovibrio sp. was negatively correlated with resistance performance, a species which relative abundance was higher in the endurance exercise group. Thus, this H2S producer could be favoring endurance adaptations, through endothelial function improvement (Das et al., 2018), but strikingly it seems to be disadvantageous for resistance exercise, although the exact mechanism is unknown. On the other hand, Alistipes, a genus belonging to the Bacteroidetes family Rikenellaceae was positively correlated with resistance performance. Alistipes is one of the newest genera within the phylum Bacteroidetes, and it has been implicated in the fermentation of unprocessed proteins within the gut, producing toxic metabolites (Parker et al., 2020). In humans, Alistipes has been shown to participate both in health and disease, and some studies in mice suggested its protective role against colitis, as reviewed by Parker et al. (2020). Considering its relationship with protein metabolism, the possible involvement of Alistipes in metabolic adaptations to resistance training deserves further analysis.
In the case of endurance exercise, we have previously shown that Lactobacillaceae family was negatively correlated with endurance performance when considering only Firmicutes phylum (Fernandez-Sanjurjo et al., 2020). Within the same paradigm, we showed in this study that this phylum was indeed negatively associated with endurance performance, and Lachnospiraceae and Lactobacillaceae families can account for this effect. Moreover, the Firmicutes-to-Bacteroidetes ratio was also negatively correlated with endurance performance, reinforcing the association between Firmicutes and lower endurance capacity. In fact, higher relative abundance of Firmicutes over Bacteroidetes has been previously associated to obesity in both mice and humans, as reviewed in Crovesy et al. (2020) and Mohr et al. (2020), and for this reason this ratio is considered a marker of health. Accordingly, our results showed that Bacteroidetes were positively correlated with endurance performance, and it is possible that Prevotellaceae family and Prevotella genus may play a role in this. In fact, the relation between the relative abundance of Prevotella and the amount of exercise has been previously observed in cyclists, where the higher abundance of Prevotella, the higher time exercising per week (Mohr et al., 2020). Higher abundance of Prevotella is one of the three enterotypes described in humans, along with Bacteroides and Ruminoccocus (Arumugam et al., 2011), associated with diet patterns (Wu et al., 2011). In mice, two enterotypes were suggested, Bacteroides and Ruminoccocus, being the last one associated with C57BL/6 substrains (Hildebrand et al., 2013). Thus, it could be possible that Prevotellaceae and Prevotella taxa may be implicated in the adaptive response to endurance exercise in both humans (Mohr et al., 2020) and mice. Moreover, the Ruminoccocus enterotype observed in C57BL/6 substrains usually coexists with Akkermansia (Arumugam et al., 2011). Interestingly, Akkermansia muciniphila relative abundance was positively related with endurance performance in our study. This bacterium has been previously shown to promote health in mice, even increasing their lifespan, and it was observed that centenarian subjects presented higher abundance (Barcena et al., 2019). Thus, in light of our results, Akkermansia may be also involved in endurance exercise adaptions in mice.
Strengths and Limitations
Our study has several strengths. First, the design and implementation of a specific and highly controlled strength training model in experimental animals allows us to obtain information, for the first time, on the effect of this type of exercise on the gut microbiota in mice. On the other hand, the use of experimental animals, with a homogeneous genetic background and diet, makes it possible to isolate the effect of exercise on the composition of the gut microbiota, minimizing the influence of confounding variables. In addition, the analysis of caecal samples gives a more approximate idea of the native microbiota compared to fecal samples. Finally, the sequencing analysis of 16S rRNA also allows for a better resolution. In many studies the V4 hypervariable region of 16S rRNA is used as universal amplification zone, allowing representative data to be given at the genus level. However, the combination of data from the different hypervariable regions, as in our study, gives a higher resolution, distinguishing more deeply the different taxa. Including the V1 to V3 regions allows a better resolution of the families detected and the V3 to V5 regions give a greater specificity in the studied prokaryotic kingdom (Colston and Jackson, 2016; Davidson and Epperson, 2018; Grogan et al., 2019).
Some limitations of the present study should be noted. First, a larger sample of individuals would have been desirable, although similar sample sizes, typically 6–10, have been usually reported in studies following endurance training, as it is now shown in Table 1. Since resistance training is more complex than endurance in terms of design and execution, and requires individual animal manipulation, a smaller number of animals were included in the RES group. The CTL group also initially consisted of 8 animals. During sample extraction and processing, two samples were discarded for technical or quality control reasons. Therefore, samples from 6 animals were finally included in the CTL group. Second, generalization of results is limited, since only male mice were included. Given the limited availability of studies in which the effect of exercise on gut microbiota composition in females has been analyzed and considering the potential translational significance and public health relevance of these results, it would be necessary to extend this study to trained females. Finally, to remark that, since the number of studied categories increases with the specificity of the taxonomy considered, the risk of multiplicity/overfitting increases. This study is observational and following the STROBE guidelines, no multi-testing correction has been considered. Therefore, inferential results should be taken with caution.
Conclusion
Resistance and endurance training modify the composition of the gut microbiota in mice, under a high-controlled environment. In a pioneering approach, we have observed that some taxonomic groups are differently affected by the model of exercise, which opens the possibility for the definition of resistance and endurance exercise gut microbiome profiles. Interestingly, taxa associated with anti- and proinflammatory responses presented the same pattern after both models of exercise, making it also possible to distinguish between sedentary and trained mice and highlighting its role in the anti-inflammatory adaptive response to regular training.
Interestingly, the abundance of several taxa was differently related to maximal endurance and resistance performance, although most of them did not respond to training. This opens the possibility to explore other ways to modulate those taxa associated with performance, e.g., through diet.
All in all, even though exercise murine models can help in understanding the effect of exercise on gut microbiome, differences between studies (e. g. species, diet, genetic background, exercise intensity, and even 16S rRNA sequencing strategy) makes it complicated to compare the results obtained from the different studies, which nowadays limits the possibility of designing oriented interventions. Therefore, as we have previously suggested (Fernandez-Sanjurjo et al., 2020), there is the need for prior in-depth knowledge of the baseline microbiota response to exercise to better understand the effect of potential subsequent interventions oriented towards the modification of gut microbiota composition for health promotion or for performance purposes.
Data Availability Statement
The datasets presented in this study can be found in online repositories. The names of the repository/repositories and accession number(s) can be found at: https://www.ncbi.nlm.nih.gov/, PRJNA558220.
Ethics Statement
The animal study was reviewed and approved by the Research Ethics Committee of the University of Oviedo, Spain (PROAE 10/2016).
Author Contributions
JF and MF-S performed the experiments, analyzed the data, and wrote the manuscript. CT-Z and PM-C analyzed the data, prepared the figures, and wrote the manuscript. CJV analyzed the data. EI-G, FL, and BF-G designed and supervised the study and wrote the manuscript. All authors have read and approved the final version of the manuscript and agree with the order of the presentation of the authors.
Funding
This work was supported by Ministerio de Economía y Competitividad under Grant DEP2015-69980-P to BF-G and by Programa de Ayudas a Grupos de Investigación del Principado de Asturias to FL (FC-GRUPIN-IDI/2018/000120).
Conflict of Interest
The authors declare that the research was conducted in the absence of any commercial or financial relationships that could be construed as a potential conflict of interest.
Publisher’s Note
All claims expressed in this article are solely those of the authors and do not necessarily represent those of their affiliated organizations, or those of the publisher, the editors and the reviewers. Any product that may be evaluated in this article, or claim that may be made by its manufacturer, is not guaranteed or endorsed by the publisher.
Acknowledgments
The authors acknowledge the technical support provided by Servicios Científico-Técnicos de la Universidad de Oviedo and the Biostatistics and Epidemiology Unit from ISPA.
Supplementary Material
The Supplementary Material for this article can be found online at: https://www.frontiersin.org/articles/10.3389/fphys.2021.748854/full#supplementary-material
References
Allen, J. M., Berg Miller, M. E., Pence, B. D., Whitlock, K., Nehra, V., Gaskins, H. R., et al. (2015). Voluntary and forced exercise differentially alters the gut microbiome in C57BL/6J mice. J. Appl. Physiol. 118, 1059–1066. doi: 10.1152/japplphysiol.01077.2014
Allen, J. M., Mailing, L. J., Niemiro, G. M., Moore, R., Cook, M. D., White, B. A., et al. (2018). Exercise alters gut microbiota composition and function in lean and obese humans. Med. Sci. Sports Exerc. 50, 747–757. doi: 10.1249/MSS.0000000000001495
Arumugam, M., Raes, J., Pelletier, E., Le Paslier, D., Yamada, T., Mende, D. R., et al. (2011). Enterotypes of the human gut microbiome. Nature 473, 174–180. doi: 10.1038/nature09944
Barcena, C., Valdes-Mas, R., Mayoral, P., Garabaya, C., Durand, S., Rodriguez, F., et al. (2019). Healthspan and lifespan extension by fecal microbiota transplantation into progeroid mice. Nat. Med. 25, 1234–1242. doi: 10.1038/s41591-019-0504-5
Barton, W., Penney, N. C., Cronin, O., Garcia-Perez, I., Molloy, M. G., Holmes, E., et al. (2018). The microbiome of professional athletes differs from that of more sedentary subjects in composition and particularly at the functional metabolic level. Gut 67, 625–633. doi: 10.1136/gutjnl-2016-313627
Boureau, H., Decre, D., Carlier, J. P., Guichet, C., and Bourlioux, P. (1993). Identification of a Clostridium cocleatum strain involved in an anti-Clostridium difficile barrier effect and determination of its mucin-degrading enzymes. Res. Microbiol. 144, 405–410. doi: 10.1016/0923-2508(93)90198-B
Bycura, D., Santos, A. C., Shiffer, A., Kyman, S., Winfree, K., Sutliffe, J., et al. (2021). Impact of different exercise modalities on the human gut microbiome. Sports 9:14. doi: 10.3390/sports9020014
Campbell, S. C., Wisniewski, P. J., Noji, M., Mcguinness, L. R., Haggblom, M. M., Lightfoot, S. A., et al. (2016). The effect of diet and exercise on intestinal integrity and microbial diversity in mice. PLoS One 11:e0150502. doi: 10.1371/journal.pone.0150502
Caporaso, J. G., Kuczynski, J., Stombaugh, J., Bittinger, K., Bushman, F. D., Costello, E. K., et al. (2010). QIIME allows analysis of high-throughput community sequencing data. Nat. Methods 7, 335–336. doi: 10.1038/nmeth.f.303
Carbajo-Pescador, S., Porras, D., Garcia-Mediavilla, M. V., Martinez-Florez, S., Juarez-Fernandez, M., Cuevas, M. J., et al. (2019). Beneficial effects of exercise on gut microbiota functionality and barrier integrity, and gut-liver crosstalk in an in vivo model of early obesity and non-alcoholic fatty liver disease. Dis. Model. Mech. 12:dmm039206. doi: 10.1242/dmm.039206
Chen, H., Shen, L., Liu, Y., Ma, X., Long, L., Ma, X., et al. (2021). Strength exercise confers protection in central nervous system autoimmunity by altering the gut microbiota. Front. Immunol. 12:628629. doi: 10.3389/fimmu.2021.628629
Choi, J. J., Eum, S. Y., Rampersaud, E., Daunert, S., Abreu, M. T., and Toborek, M. (2013). Exercise attenuates PCB-induced changes in the mouse gut microbiome. Environ. Health Perspect. 121, 725–730. doi: 10.1289/ehp.1306534
Codina-Martinez, H., Fernandez-Garcia, B., Diez-Planelles, C., Fernandez, A. F., Higarza, S. G., Fernandez-Sanjurjo, M., et al. (2020). Autophagy is required for performance adaptive response to resistance training and exercise-induced adult neurogenesis. Scand. J. Med. Sci. Sports 30, 238–253. doi: 10.1111/sms.13586
Colston, T. J., and Jackson, C. R. (2016). Microbiome evolution along divergent branches of the vertebrate tree of life: what is known and unknown. Mol. Ecol. 25, 3776–3800. doi: 10.1111/mec.13730
Conner, J. D., Wolden-Hanson, T., and Quinn, L. S. (2014). Assessment of murine exercise endurance without the use of a shock grid: an alternative to forced exercise. J. Vis. Exp. 90:e51846. doi: 10.3791/51846
Crovesy, L., Masterson, D., and Rosado, E. L. (2020). Profile of the gut microbiota of adults with obesity: a systematic review. Eur. J. Clin. Nutr. 74, 1251–1262. doi: 10.1038/s41430-020-0607-6
Das, A., Huang, G. X., Bonkowski, M. S., Longchamp, A., Li, C., Schultz, M. B., et al. (2018). Impairment of an endothelial NAD(+)-H2S signaling network is a reversible cause of vascular aging. Cell 173, 74.e20–89.e20. doi: 10.1016/j.cell.2018.02.008
Davidson, R. M., and Epperson, L. E. (2018). Microbiome sequencing methods for studying human diseases. Methods Mol. Biol. 1706, 77–90. doi: 10.1007/978-1-4939-7471-9_5
Evans, C. C., Lepard, K. J., Kwak, J. W., Stancukas, M. C., Laskowski, S., Dougherty, J., et al. (2014). Exercise prevents weight gain and alters the gut microbiota in a mouse model of high fat diet-induced obesity. PLoS One 9:e92193. doi: 10.1371/journal.pone.0092193
Fernandez, J., Garcia, L., Monte, J., Villar, C. J., and Lombo, F. (2018). Functional anthocyanin-rich sausages diminish colorectal cancer in an animal model and reduce pro-inflammatory bacteria in the intestinal microbiota. Genes (Basel) 9:133. doi: 10.3390/genes9030133
Fernandez-Sanjurjo, M., Fernandez, J., Tomas-Zapico, C., Fernandez-Garcia, B., Villar, C. J., Lombo, F., et al. (2020). Is physical performance (in mice) increased by Veillonella atypica or decreased by Lactobacillus bulgaricus? J. Sport Health Sci. 9, 197–200. doi: 10.1016/j.jshs.2020.02.005
Figueiredo, V. C., De Salles, B. F., and Trajano, G. S. (2018). Volume for muscle hypertrophy and health outcomes: the most effective variable in resistance training. Sports Med. 48, 499–505. doi: 10.1007/s40279-017-0793-0
Fiuza-Luces, C., Garatachea, N., Berger, N. A., and Lucia, A. (2013). Exercise is the real polypill. Physiology 28, 330–358. doi: 10.1152/physiol.00019.2013
Flint, H. J., Duncan, S. H., Scott, K. P., and Louis, P. (2015). Links between diet, gut microbiota composition and gut metabolism. Proc. Nutr. Soc. 74, 13–22. doi: 10.1017/S0029665114001463
Gentil, P., Marques, V. A., Neto, J. P. P., Santos, A. C. G., Steele, J., Fisher, J., et al. (2018). Using velocity loss for monitoring resistance training effort in a real-world setting. Appl. Physiol. Nutr. Metab. 43, 833–837. doi: 10.1139/apnm-2018-0011
Goodrich, J. K., Waters, J. L., Poole, A. C., Sutter, J. L., Koren, O., Blekhman, R., et al. (2014). Human genetics shape the gut microbiome. Cell 159, 789–799. doi: 10.1016/j.cell.2014.09.053
Grogan, M. D., Bartow-Mckenney, C., Flowers, L., Knight, S. A. B., Uberoi, A., and Grice, E. A. (2019). Research techniques made simple: profiling the skin microbiota. J. Invest. Dermatol. 139, 747.e1–752.e1. doi: 10.1016/j.jid.2019.01.024
Hawley, J. A., Hargreaves, M., Joyner, M. J., and Zierath, J. R. (2014). Integrative biology of exercise. Cell 159, 738–749. doi: 10.1016/j.cell.2014.10.029
Hildebrand, F., Nguyen, T. L., Brinkman, B., Yunta, R. G., Cauwe, B., Vandenabeele, P., et al. (2013). Inflammation-associated enterotypes, host genotype, cage and inter-individual effects drive gut microbiota variation in common laboratory mice. Genome Biol. 14:R4. doi: 10.1186/gb-2013-14-1-r4
Hsu, Y. J., Chiu, C. C., Li, Y. P., Huang, W. C., Huang, Y. T., Huang, C. C., et al. (2015). Effect of intestinal microbiota on exercise performance in mice. J. Strength Cond. Res. 29, 552–558. doi: 10.1519/JSC.0000000000000644
Johnson, K. V., and Burnet, P. W. (2016). Microbiome: should we diversify from diversity? Gut Microbes 7, 455–458. doi: 10.1080/19490976.2016.1241933
Kemi, O. J., Loennechen, J. P., Wisloff, U., and Ellingsen, O. (2002). Intensity-controlled treadmill running in mice: cardiac and skeletal muscle hypertrophy. J. Appl. Physiol. 93, 1301–1309. doi: 10.1152/japplphysiol.00231.2002
Knab, A. M., Bowen, R. S., Moore-Harrison, T., Hamilton, A. T., Turner, M. J., and Lightfoot, J. T. (2009). Repeatability of exercise behaviors in mice. Physiol. Behav. 98, 433–440. doi: 10.1016/j.physbeh.2009.07.006
Kregel, K. C., Allen, D. L., Booth, F. W., Fleshner, M. R., Henriksen, E. J., Musch, T. I., et al. (2006). Resource book for the design of animal exercise protocols. Am. J. Vet. Res. 68:583. doi: 10.2460/ajvr.68.6.583
Lamoureux, E. V., Grandy, S. A., and Langille, M. G. I. (2017). Moderate exercise has limited but distinguishable effects on the mouse microbiome. mSystems 2, e00006–e00017. doi: 10.1128/mSystems.00006-17
Le Chatelier, E., Nielsen, T., Qin, J., Prifti, E., Hildebrand, F., Falony, G., et al. (2013). Richness of human gut microbiome correlates with metabolic markers. Nature 500, 541–546. doi: 10.1038/nature12506
Lee, H., and Ko, G. (2014). Effect of metformin on metabolic improvement and gut microbiota. Appl. Environ. Microbiol. 80, 5935–5943. doi: 10.1128/AEM.01357-14
Ley, R. E., Backhed, F., Turnbaugh, P., Lozupone, C. A., Knight, R. D., and Gordon, J. I. (2005). Obesity alters gut microbial ecology. Proc. Natl. Acad. Sci. U. S. A. 102, 11070–11075. doi: 10.1073/pnas.0504978102
Marteau, P., Pochart, P., Dore, J., Bera-Maillet, C., Bernalier, A., and Corthier, G. (2001). Comparative study of bacterial groups within the human cecal and fecal microbiota. Appl. Environ. Microbiol. 67, 4939–4942. doi: 10.1128/AEM.67.10.4939-4942.2001
McKenna, C. F., Salvador, A. F., Hughes, R. L., Scaroni, S. E., Alamilla, R. A., Askow, A. T., et al. (2021). Higher protein intake during resistance training does not potentiate strength, but modulates gut microbiota, in middle-aged adults: a randomized control trial. Am. J. Physiol. Endocrinol. Metab. 320, E900–E913. doi: 10.1152/ajpendo.00574.2020
Mohr, A. E., Jager, R., Carpenter, K. C., Kerksick, C. M., Purpura, M., Townsend, J. R., et al. (2020). The athletic gut microbiota. J. Int. Soc. Sports Nutr. 17:24. doi: 10.1186/s12970-020-00353-w
Myers, J., Prakash, M., Froelicher, V., Do, D., Partington, S., and Atwood, J. E. (2002). Exercise capacity and mortality among men referred for exercise testing. N. Engl. J. Med. 346, 793–801. doi: 10.1056/NEJMoa011858
Nguyen, T. L., Vieira-Silva, S., Liston, A., and Raes, J. (2015). How informative is the mouse for human gut microbiota research? Dis. Model. Mech. 8, 1–16. doi: 10.1242/dmm.017400
O'toole, P. W., and Jeffery, I. B. (2015). Gut microbiota and aging. Science 350, 1214–1215. doi: 10.1126/science.aac8469
Parker, B. J., Wearsch, P. A., Veloo, A. C. M., and Rodriguez-Palacios, A. (2020). The genus Alistipes: gut bacteria with emerging implications to inflammation, cancer, and mental health. Front. Immunol. 11:906. doi: 10.3389/fimmu.2020.00906
Pedersen, B. K., and Saltin, B. (2015). Exercise as medicine - evidence for prescribing exercise as therapy in 26 different chronic diseases. Scand. J. Med. Sci. Sports 25(Suppl. 3), 1–72. doi: 10.1111/sms.12581
Qin, J., Li, Y., Cai, Z., Li, S., Zhu, J., Zhang, F., et al. (2012). A metagenome-wide association study of gut microbiota in type 2 diabetes. Nature 490, 55–60. doi: 10.1038/nature11450
Rothschild, D., Weissbrod, O., Barkan, E., Kurilshikov, A., Korem, T., Zeevi, D., et al. (2018). Environment dominates over host genetics in shaping human gut microbiota. Nature 555, 210–215. doi: 10.1038/nature25973
Scheiman, J., Luber, J. M., Chavkin, T. A., Macdonald, T., Tung, A., Pham, L. D., et al. (2019). Meta-omics analysis of elite athletes identifies a performance-enhancing microbe that functions via lactate metabolism. Nat. Med. 25, 1104–1109. doi: 10.1038/s41591-019-0485-4
Tang, W. H. W., Li, D. Y., and Hazen, S. L. (2019). Dietary metabolism, the gut microbiome, and heart failure. Nat. Rev. Cardiol. 16, 137–154. doi: 10.1038/s41569-018-0108-7
Westcott, W. L. (2012). Resistance training is medicine: effects of strength training on health. Curr. Sports Med. Rep. 11, 209–216. doi: 10.1249/JSR.0b013e31825dabb8
Wu, G. D., Chen, J., Hoffmann, C., Bittinger, K., Chen, Y. Y., Keilbaugh, S. A., et al. (2011). Linking long-term dietary patterns with gut microbial enterotypes. Science 334, 105–108. doi: 10.1126/science.1208344
Keywords: resistance exercise, endurance exercise, murine models, metagenomics, physical performance
Citation: Fernández J, Fernández-Sanjurjo M, Iglesias-Gutiérrez E, Martínez-Camblor P, Villar CJ, Tomás-Zapico C, Fernández-García B and Lombó F (2021) Resistance and Endurance Exercise Training Induce Differential Changes in Gut Microbiota Composition in Murine Models. Front. Physiol. 12:748854. doi: 10.3389/fphys.2021.748854
Edited by:
Silvia Turroni, University of Bologna, ItalyCopyright © 2021 Fernández, Fernández-Sanjurjo, Iglesias-Gutiérrez, Martínez-Camblor, Villar, Tomás-Zapico, Fernández-García and Lombó. This is an open-access article distributed under the terms of the Creative Commons Attribution License (CC BY). The use, distribution or reproduction in other forums is permitted, provided the original author(s) and the copyright owner(s) are credited and that the original publication in this journal is cited, in accordance with accepted academic practice. No use, distribution or reproduction is permitted which does not comply with these terms.
*Correspondence: Cristina Tomás-Zapico, dG9tYXNjcmlzdGluYUB1bmlvdmkuZXM=
†These authors have contributed equally to this work and share first authorship
‡These authors have contributed equally to this work and share senior authorship