Abstract
p-Tyramine (TYR) is an endogenous trace amine, which can also be synthesized by intestinal microbiota, and is present in commonly consumed diets. TYR is an agonist for the intracellular trace amine-associated receptor 1, which has been implicated in psychiatric, metabolic, and immune-related disorders. We have previously demonstrated TYR readily diffuses across lipid bilayers, while transport across Caco-2 cell membranes involves Organic Cation Transporter 2 (OCT2) and a Na+-dependent active transporter. Here we developed mathematical models to determine whether known kinetics for these processes are sufficient to explain observed transcellular TYR passage. Ordinary differential equations were developed for known TYR transport processes to predict concentration-time relationships. Michaelis-Menten kinetics were assumed for all transporter-mediated processes and a one phase exponential function used for simple diffusion. Modelled concentration-time plots were compared to published experimental results. Additional transporter functions were sequentially added to models to improve consistency, and a least squares error minimization approach utilized to determine added transporter kinetics. Finally, possible TYR compartmentalization was also modelled. Following apical loading, transport across the apical, but not the basolateral, membrane was modelled without additional transporters, suggesting a basolateral transporter was missing. Consistent with this, models of basolateral compartment loading did not match experimental observations, indicating missing basolateral transporters were bidirectional. Addition of a transporter with the kinetic characteristics of OCT2 did not improve models. Varying the kinetic parameters of the added transporter improved models of basolateral, but worsened apical, loading models, suggesting the need for either a directional preference in transporters, or intracellular TYR compartmentalization. Experimental parameters were recapitulated by introducing asymmetry into the apical OCT2 (Kt_OCT2_apicaltocell = 110.4 nM, Kt_OCT2_celltoapical = 1,227.9 nM), and a symmetric basolateral facilitated diffusion transporter (Vmax = 6.0 nM/s, Kt = 628.3 nM). The apparent directionality of OCT2 may reflect altered TYR ionization due to known pH differences between compartments. Models for asymmetry and compartmentalization were compared by root mean square deviation from experimental data, and it was found that TYR compartmentalization could only partially replace the need for asymmetry of OCT2. In conclusion, modelling indicates that known TYR transport processes are insufficient to explain experimental concentration-time profiles and that asymmetry of the apical membrane OCT2 combined with additional, low affinity, basolateral membrane facilitated diffusion transporters are required.
1 Introduction
p-Tyramine (TYR) is a member of the trace amine (TA) family that has very low endogenous tissue concentrations (<10 ng/g; 100 nM), at least 100-fold lower than the classical monoamine neurotransmitters (Berry, 2004). Endogenous production of TYR takes place by the action of aromatic L-amino acid decarboxylase (EC 4.1.1.28) mediated decarboxylation (Berry et al., 2017) of L-tyrosine. Other sources of TYR include the intestinal microbiota (Wolken et al., 2006; Landete et al., 2007; Bonnin-Jusserand et al., 2012; Mazzoli and Pessione, 2016; Yang et al., 2016; Fujisaka et al., 2018) and common dietary items including red wine (Nalazek-Rudnicka and Wasik, 2017), chocolate (Martin and Vij, 2016), aged cheeses (Liu et al., 2018), fermented meats (Zhang et al., 2019), and seafood (An et al., 2015; Biji et al., 2016). TYR is an agonist at trace amine-associated receptor 1 (TAAR1) (Bonner et al., 2019), a G protein-coupled receptor that was discovered in 2001 (Borowsky et al., 2001; Bunzow et al., 2001) and has since been established as a therapeutic target for psychiatric (Berry et al., 2017; Nazimek J et al., 2017; Koblan et al., 2020; Nair et al., 2022), metabolic (Revel et al., 2012; Adriaenssens et al., 2015; Ferragud et al., 2016; Raab et al., 2016; Michael et al., 2019; Cripps et al., 2020) and immune-related disorders (Christian and Berry, 2018; Barnes et al., 2021). Accordingly, TAAR1 has been shown to be present in various cells in the brain (Borowsky et al., 2001; Lindemann et al., 2005; Revel et al., 2012; Cisneros and Ghorpade, 2014), spinal cord (Borowsky et al., 2001; Lindemann et al., 2008; Gozal et al., 2014), pancreatic β cells, stomach D cells (Chiellini et al., 2012; Revel et al., 2012; Adriaenssens et al., 2015; Raab et al., 2016), intestinal enterochromaffin mucosal cells (Kidd et al., 2008; Ito et al., 2009; Revel et al., 2012; Raab et al., 2016), and human leukocytes (D’Andrea et al., 2003; Nelson et al., 2007; Babusyte et al., 2013; Barnes et al., 2021). In all these cell types, TAAR1 exhibits a primarily intracellular localization (Lindemann et al., 2005; Barak et al., 2008; Pei et al., 2016; Raab et al., 2016; Barnes et al., 2021). It is important, therefore, to understand the transport properties of TYR across cell membranes to access TAAR1. Further, such transport processes in intestinal epithelial cells will be relevant to microbiota and food-derived TYR interaction with cells of the immune system (Christian and Berry, 2018).
Previous studies examining TYR membrane passage in different cellular systems, have confirmed that TYR can readily diffuse across synthetic lipid bilayers with a permeability coefficient (ρ) of 22.6 ± 4.3 Å/s (Berry et al., 2013), and via a facilitated diffusion transport process mediated by a transporter with the pharmacological characteristics of organic cation transporter 2 (OCT2; Slc22A2) in native neuronal preparations (Kt = 101.5 nM; Vmax = 30.2 fmol/mg protein/s) (Berry et al., 2016). In Caco-2 intestinal epithelial cells, we have previously shown that TYR is also transported across the apical membrane by OCT2 (Sarkar and Berry, 2020). In contrast, TYR transport across the basolateral membrane involves an unidentified, Na+-dependent, active transporter (Figure 1), with a Kt = 33.1 nM and a Vmax = 43.0 nM/s (Sarkar and Berry, 2020). The presence of such an active transport process could mask the presence of additional TYR transporters, particularly in the basolateral membrane. The current study has, therefore, used computer modelling to determine whether the known kinetics of the identified transporter systems are sufficient to explain the experimentally observed TYR concentration-time relationships in the Caco-2 experimental system (Sarkar and Berry, 2020), or whether additional transport factors are required.
FIGURE 1
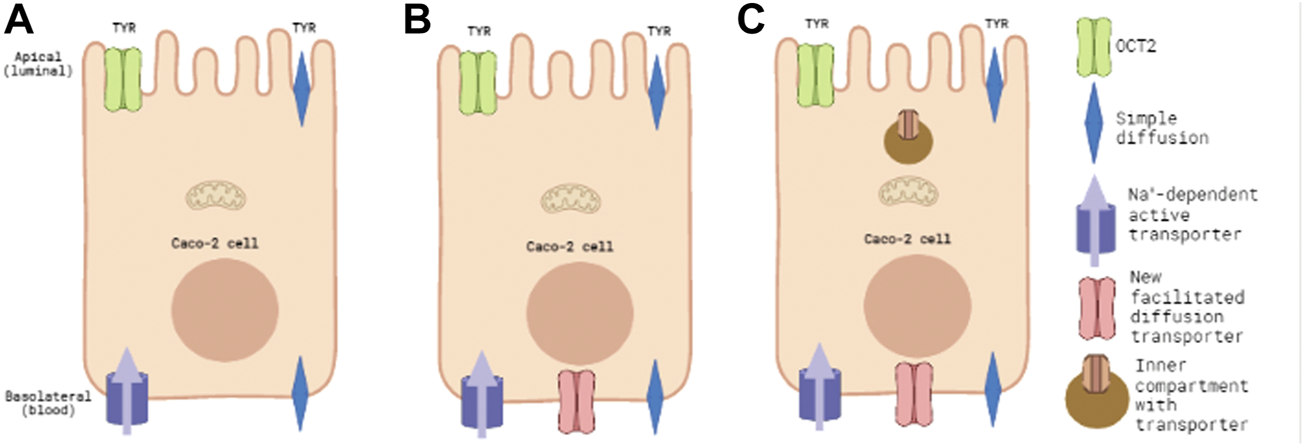
Known and predicted TYR transporters used for modelling transcellular passage in Caco-2 cells. Panel 1(A) represents the baseline model of known TYR transport processes in the Caco-2 intestinal cell line, where TYR can cross Caco-2 plasma membranes by simple diffusion, be transported across the apical membrane by the bi-directional facilitated diffusion transporter OCT2, or actively accumulated within the cell from the basolateral compartment by an as yet unidentified Na+-dependent active transporter. Panel 1(B) represents the model where an additional facilitated diffusion transporter in the basolateral membrane has been added and optimal kinetic parameters that maximized consistency with experimental concentration-time relationships determined. Panel 1(C) represents the model where an intracellular compartment is introduced to sequester uptaken TYR as an alternative to assymetric facilitated diffusion transport.
2 Methods
2.1 Study model
For known TYR transport processes (Berry et al., 2013; Berry et al., 2016; Sarkar and Berry, 2020) ordinary differential equations (ODEs) were developed. Michaelis-Menten kinetics were assumed for all transporter-mediated processes, and the generalized equations (Friedman, 2008) for facilitated diffusion Eqn. 1 and active Eqn. 2 transporters used, where X1 represents the concentration of TYR in the donor compartment and X2 the concentration in the receiver compartment.
A one phase exponential decay function was used for simple (non-transporter mediated) diffusion (Friedman, 2008) (Eq. 3), where represents the surface area of the membrane. This was assumed to be equal to the surface area of the transwell insert for a Caco-2 monolayer.
These ODEs were used to develop a three-compartment mathematical model using MATLAB (R2021a) to predict the concentration-time relationship of TYR changes in each of the apical (Eq. 4), intracellular (Eq. 5), and basolateral compartments (Eq. 6) for both luminal-to-blood (apical loading) and blood-to-luminal (basolateral loading; see Figure 1A) transport. In all equations, blue text corresponds to simple diffusion, green text to OCT2 mediated facilitated diffusion transport, and purple text to the basolateral Na+-dependent active transporter. The term represents a constant which is the product of ρ and . Volume terms are incorporated in to equations representing active and facilitated transporters (e.g. Eqs 4–6) as the Vmax values were determined for the cellular compartment. Since there is a large volume difference between the cellular compartment and the apical and basolateral compartments, in order to properly account for mass transfer, volume ratios needed to be included for the apical and basolateral compartments, which differ in volume from the cellular compartment since, for example, a molecular flux between compartments will cause a smaller change in concentration in the larger compartment compared to the smaller compartment. Volapical (= 100 μL) and Volbaso (= 600 μL), represent the experimental volumes of the apical and basolateral compartments, respectively. Volcell (= 0.8168 μL) represents the previously calculated intracellular volume of the Caco-2 monolayer (Sarkar and Berry, 2020).
The previously reported literature value for synaptosomal OCT2 Vmax of 30.2 fmol/mg protein/s (Berry et al., 2016) was converted to nM/s (0.11 nM/s) using the known protein content that had previously been determined for each synaptosomal preparation. Starting concentrations in apical and basolateral compartments were set to those previously determined experimentally (Sarkar and Berry, 2020) and predicted concentration-time relationships in each compartment were compared to our previously published experimental observations (Sarkar and Berry, 2020).
2.2 Addition of facilitated diffusion transporters to the Caco-2 basolateral membrane
On the basis of initial modelling, an additional facilitated diffusion transporter (red text) was introduced to the basolateral membrane (Eqs 7 and 8; Figure 1B).
Initially, kinetic parameters were set to those of OCT2, as this transporter is already identified as contributing to TYR transport in Caco-2 cells (Sarkar and Berry, 2020). Since OCT2 is present in the apical membrane (Sarkar and Berry, 2020), we reasoned that its presence in the basolateral membrane could also be possible. To test for putative density differences in OCT2 between the apical and basolateral membranes, the Vmax_baso_new_FD term was allowed to vary from the experimentally determined Vmax_OCT2 term in the apical membrane. Vmax_baso_new_FD was varied from 0.1x to 20x the apical membrane Vmax of OCT2. To determine if a basolateral membrane facilitated diffusion transporter distinct from OCT2 improved consistency with experimental observations, both Vmax_baso_new_FD and Kt_baso_new_FD were systematically varied (Eqs 7 and 8), red text).
2.3 Incorporation of asymmetry in facilitated diffusion transporters
Results from the modelling described in section 2.2 indicated that asymmetry of TYR facilitated diffusion transporters may be required in order to match experimental observations. To attain this, distinct Kt values were introduced for OCT2 transport in the apical to cell (Kt_OCT2_apicaltocell) and cell to apical (Kt_OCT2_celltoapical) directions (Eqs 9 and 10). Similarly, different Kt values for the basolateral to cell (Kt_baso_new_FD_basotocell) and cell to basolateral (Kt_baso_new_FD_celltobaso) directions of the added basolateral membrane facilitated diffusion transporter were introduced (Eqs 10 and 11).
2.4 Introduction of TYR intracellular compartmentalization
To model for potential intracellular compartmentalization of TYR, a compartmentalization factor, ‘z’, was introduced to restrict the amount of intracellular TYR that was available for transport out of Caco-2 cells (Eqs 12–14), where 0 ≤ z ≤ 1.
To provide a more refined description of such potential compartmentalization, Michaelis-Menten terms (brown text) for the transport of TYR into an inner compartment were also introduced (Eqs 15–18); Figure 1C), and the volume of the intracellular compartment (Volinner) set at 10% of the total volume of the cell, to estimate a likely upper boundary for an intracellular compartment.
2.5 Least squares determination of the kinetic parameters of unknown TYR transporter kinetics.
In order to estimate transporter parameters from experimental data, e.g., the various Vmax and Kt values on the right-hand sides (RHSs) of Eqs 9–11, two least-squares fitting procedures were employed. The first involved comparing experimental values for the rate of change of the concentration for a compartment, e.g., the left-hand sides of Eqs 9–11, with model predictions (the RHSs). The second procedure involved solving the ODEs at each iteration of the fitting procedure and comparing model and experimental concentrations. As the fits were non-linear with several parameters, choices for the initial values of the parameters for the fitting procedures were informed by considering constraints on parameter values implied by the model, given the experimental data, reducing the need for exhaustive searches over initial parameter values. Some of these fitting calculations were carried using Mathematica (v12.1.1).
We first describe the fitting procedure for determining model parameters by considering the rate of change of the concentration. As an illustrative example, we consider fitting Vmax_OCT2 and Kt_OCT2 in the model comprising Eqs 4–6. Note that compartmental volumes and α are given and are therefore not fit parameters.
Step 1Linear fit of the experimental dataLinear regression analysis was performed on previously published (Sarkar and Berry, 2020) concentration-time relationships in order to determine the rate of change of TYR concentration in each of the apical, cellular, and basolateral compartments following both apical and basolateral compartment TYR loading. In all six cases, the data were well described by constant rates of change (concentrations changing linearly in time). Thus, all the experimental data are described by six “slopes”.
Step 2Development of objective functionsEqs 4–6 were rearranged (Eqs 19–21 respectively) so that all experimentally known quantities including the determined rate, appear on the right-hand side (RHS). Terms with parameters to be solved appear on the left-hand side (LHS).This rearrangement suggests using the LHSs to define fitting functions Fapical, Fcell and Fbaso (Eqs 22–24),The compartmental concentrations were determined experimentally from t = 0 to t = 30 min at intervals of 5 min, and thus these three functions can be written as functions of time, e.g. Eq. 25,We also use the RHSs of equations 19)–21) to define known, time-dependent quantities fapical(t), fcell(t) and fbaso(t), respectively. The ‘f’ is a term that contains small diffusive terms and derivatives of TYR concentration of TYR with respect to time (dX/dt). The TYR concentration data in all the compartments have been fit by linear regression. In that case, all of the dX/dt terms in the ‘f’ terms become constant and, therefore, the ‘f’ terms have only a very weak time dependence because of the very small diffusive termsObjective functions (Q) were then defined for each compartment as shown in Eqs 26–28 and represent the squared differences between and calculated at each time point t.Global objective functions were then written for apical ( and basolateral ) loading as the sum of the individual compartment objective functions following apical or basolateral loading respectively (Eqs 29 and 30).QA and QB can then be minimized simultaneously by defining an overall function Q (Eqs 31), providing a least squares minimized solution for the individual kinetic terms in Eqs 19–21
Step3Objective functions based on concentrationsIn this fitting procedure, which we used to complement and validate the first one, the F functions in Eqs 26–28 were redefined to be the solutions to Eqs 19–21. For example, Fapical (Vmax_OCT2, Kt_OCT2; t) = Xapical(t), where Xapical(t) comes from the numerical solution for Eqs 19–21. The quantities f in Eqs 26–28 were simply redefined to be the compartmental concentrations determined from experiment e.g. fapical = Xapical(t), where Xapical(t) was determined from experiment. As the cellular concentrations were generally larger than in the other two compartments, we reduced both Qcell,apical and Qcell,basolateral in QA and QB, respectively, by a factor w. The value of w affects the results, and we found that a value of 1,000 worked well. The dependence of the fitting procedure on w was mitigated by choosing good initial parameter values, as described in Step 4.
Step 4Introduction of model order reductionNon-linear fitting with many fit parameters can be difficult: there are in general many local minima of the objective function in parameter space, meaning similar fits can be achieved with very different parameter values. Results depend on the initial parameter values chosen when minimizing the objective function. In this final step, approximations were introduced to decrease the number of parameters that needed to be solved simultaneously, thereby simplifying the computational complexity. This allowed us to interactively explore ranges of parameter values and thus determine reasonable starting values. The procedure was based on approximating experimental concentrations as constant values or as being linear in time and on simplifying the model ODEs. For example, for the model represented by Eqs 12–14, was approximated as follows.Considering Eq. 12, we assumed that simple diffusion was negligible, which allowed Eq. 12 to be simplified to Eq. 32,For basolateral addition at timepoint t = 0, we then substituted for the following experimental parameters: at t = 0, nM (refer to Figure 4B) and dXapical/dt = 0.3168 nM/min = 0.00528 nM/s (the slope of the linear fit of the experimental data). This allows Eq. 32 to be reduced to Eq. 33.Rearranging to Eq. 34 allows to be expressed as a function of other variables. For solutions where no intracellular compartment was modelled z was set to 1.
Similar approximation techniques were also used for expressing:
1) in relation to and z
2) in relation to
3) in relation to , , and z
3 Results
3.1 Known TYR transporters do not recapitulate experimental observations
Modelling TYR transport across a Caco-2 cell barrier following basolateral compartment loading, using the kinetics of previously identified transporter systems, was not able to recapitulate experimental observations (Figures 2A–C). Conversely, following apical compartment loading, restricting the model to known transporter kinetics partially matched experimental observations for apical to cellular transport (Figures 3A,B), but not for cellular to basolateral transport (Figures 3B,C).
FIGURE 2
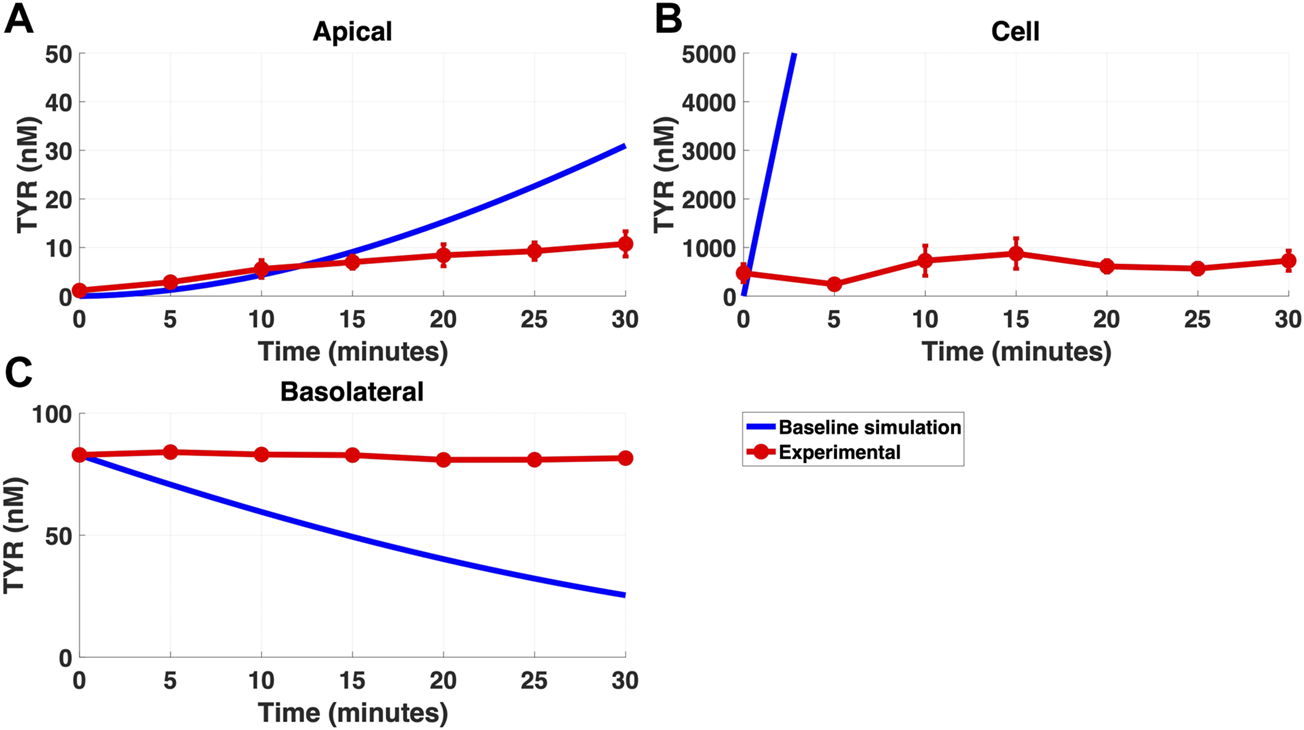
The baseline model does not recapitulate experimental data for TYR transport following basolateral loading. The transport of 82.9 nM TYR across Caco-2 cells was modeled for basolateral loading by solving Eqs 4–6, using the values mentioned in Supplementary Table S2, using MATLAB vR 2021a. Comparisons were made between the baseline model (representing known TYR transporters that have been characterized; blue curve) for the apical Panel 2(A), cellular Panel 2(B) and basolateral compartments Panel 2(C), versus experimental observations; red curves (Sarkar and Berry, 2020). Kinetic parameters used for this modelling were: Vmax_OCT2 = 0.1 nM/s, Kt _OCT2_apicaltocell = 101.5 nM, Vmax_baso_active = 43.0 nM/s and Kt_baso_active = 33.1 nM.
FIGURE 3
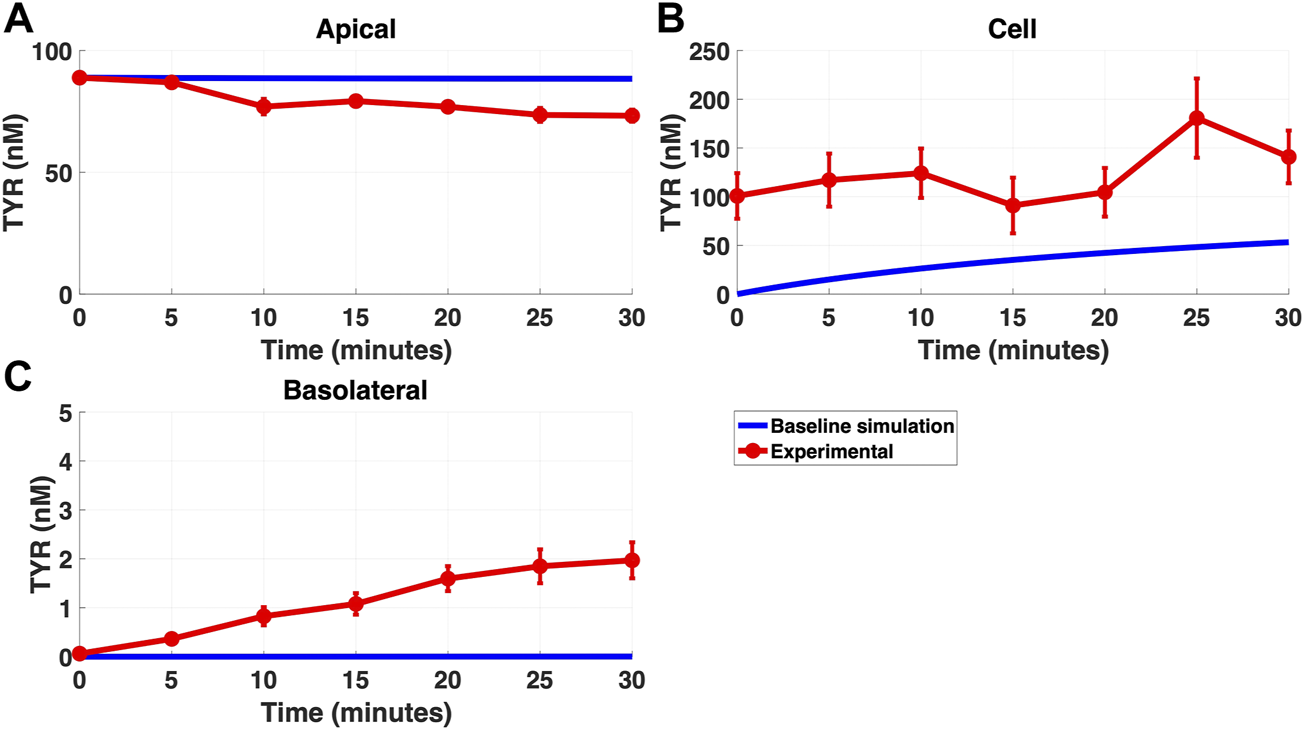
The baseline model does not fully recapitulate experimental data for TYR transport following apical loading. The transport of 88.9 nM TYR across Caco-2 cells was modeled for apical loading by solving Eqs 4–6, using the values mentioned in Supplementary Table S2, using MATLAB vR 2021a. Comparisons were made between the baseline model (representing known TYR transporters been characterized; blue curve) for the apical Figure 3(A), cellular Figure 3(B) and basolateral compartments Figure 3(C), versus experimental observations; red curves (Sarkar and Berry, 2020). Kinetic parameters used for this modelling were: Vmax_OCT2 = 0.1 nM/s, Kt _OCT2_apicaltocell = 101.5 nM, Vmax_baso_active = 43.0 nM/s and Kt_baso_active = 33.1 nM.
3.2 Addition of a basolateral membrane facilitated diffusion transporter does not improve modelling
Addition of OCT2 to the basolateral membrane at densities ranging from 0.1-20X that observed in the apical membrane, did not improve model accuracy following either basolateral (Figures 4A–C) or apical (Figures 5A–C) compartment loading with TYR.
FIGURE 4
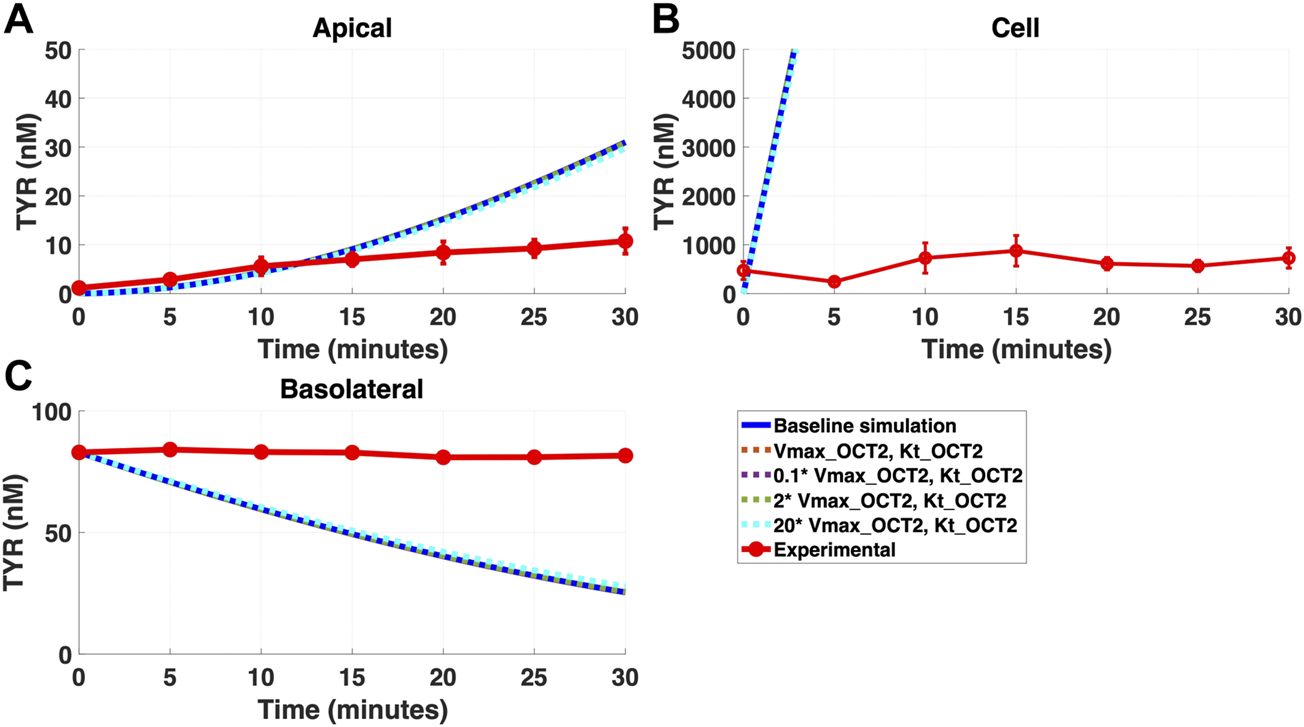
Introduction of OCT2, at a range of densities, to the Caco-2 basolateral membrane does not improve model accuracy for basolateral TYR loading. The transport of 82.9 nM of TYR across Caco-2 cells was modeled following basolateral loading by solving Eqs 4–8, using the values mentioned in Supplementary Table S2, using MATLAB vR 2021a. Comparisons were made between the models (baseline = blue curve; modified = dotted curves) for the apical Panel 4(A), cellular Panel 4(B) and basolateral compartments Panel 4(C), versus experimental observations; red curve (Sarkar and Berry, 2020). Addition of an OCT2-like transporter to the basolateral membrane at varying densities did not significantly alter modelled TYR concentration-time profiles. All of the curves have overlapped except experimental curve. Kinetic parameters used for this modelling were: Vmax_OCT2 = 0.1 nM/s, Kt _OCT2_apicaltocell = 101.5 nM, Vmax_baso_active = 43.0 nM/s, Kt_baso_active = 33.1 nM, Vmax_baso_new_FD = 0.01–2 nM/s and Kt_baso_new_FD_basotocell = 101.5 nM.
FIGURE 5
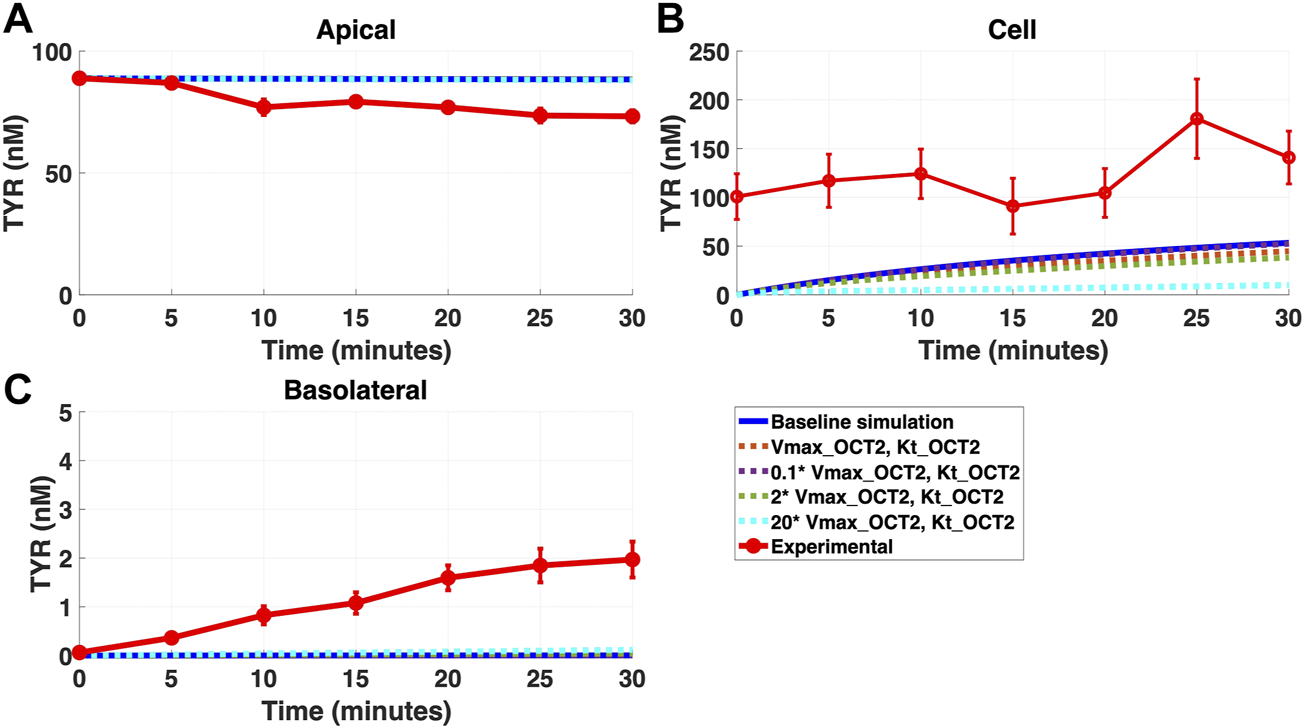
Introduction of OCT2 at variable densities to the Caco-2 basolateral membrane worsens model accuracy following apical TYR loading. The transport of 88.9 nM TYR across Caco-2 cells was modeled following basolateral loading by solving Eqs 4–8, using the values mentioned in Supplementary Table S2, using MATLAB vR 2021a. Comparisons were made between the models (baseline = blue curve; modified = dotted curves) for the apical Panel 5(A), cellular Panel 5(B) and basolateral compartments Panel 5(C), versus experimental observations; red curve (Sarkar and Berry, 2020). Addition of an OCT2-like transporter to the basolateral membrane at varying densities either had no effect, or worsened, modelling of TYR concentration-time profiles. Some of the curves have overlapped except experimental curve. Kinetic parameters used for this modelling were: Vmax_OCT2 = 0.1 nM/s, Kt _OCT2_apicaltocell = 101.5 nM, Vmax_baso_active = 43.0 nM/s, Kt_baso_active = 33.1 nM, Vmax_baso_new_FD = 0.01–2 nM/s and Kt_baso_new_FD_basotocell = 101.5 nM.
In contrast, addition of a facilitated diffusion transporter not confined to OCT2 Kt provided a closer match to experimental results following basolateral loading (Figures 6A–C) when kinetic parameters of Vmax = 55 nM/s and Kt = 203–507.5 nM were utilized. These kinetic parameters, however, worsened the matching to experimental data following apical loading (Figures 7A–C).
FIGURE 6
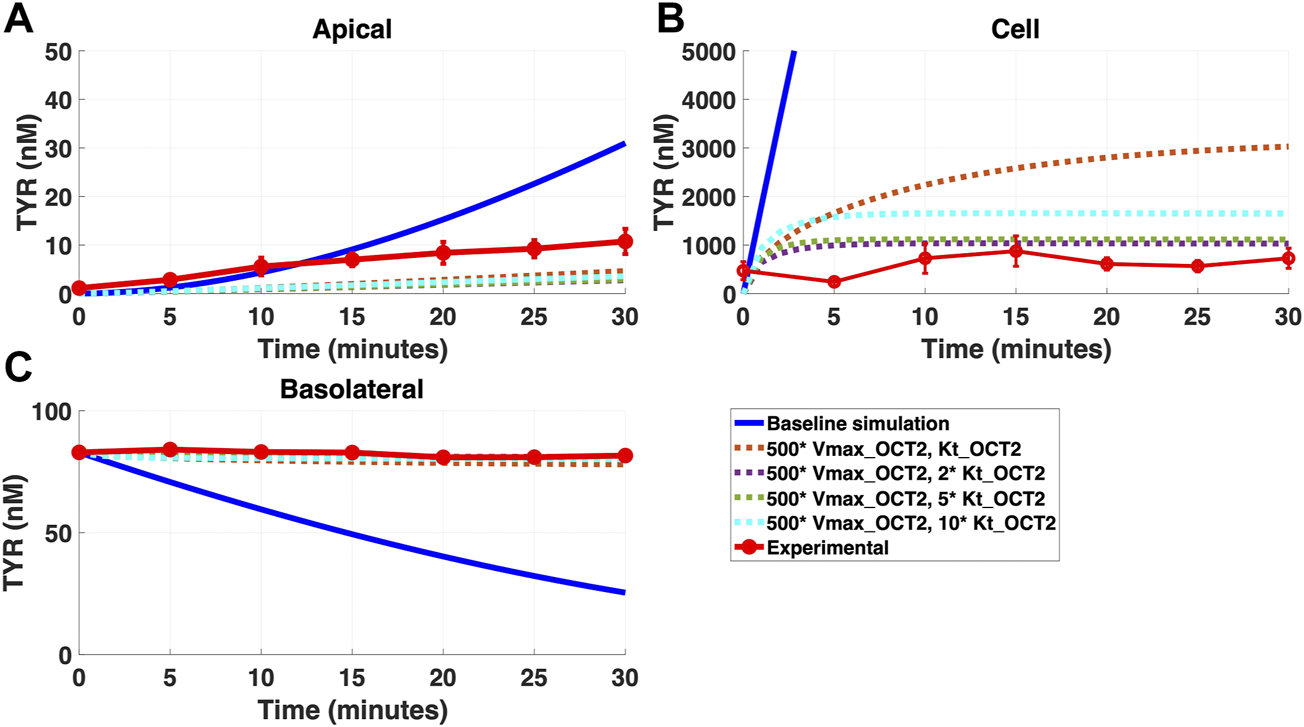
Introduction of a non-OCT2 facilitated diffusion transporter to the Caco-2 basolateral membrane improves model accuracy following basolateral TYR loading. The transport of 82.9 nM TYR across Caco-2 cells was modeled following basolateral loading by solving Eqs 4–8, using the values mentioned in Supplementary Table S2, using MATLAB vR 2021a. Comparisons were made between the models (baseline = blue curve; modified = dotted curves) and experimental observations; red curve (Sarkar and Berry, 2020)for the apical Panel 6(A), cellular Panel 6(B) and basolateral compartments Panel 6(C). Good agreement with experimental observations were obtained at Vmax = 50 nM/s (500*Vmax_OCT2) and Kt = 507.5–1,015 nM (5–10 *Kt_OCT2). Kinetic parameters used for this modelling were: Vmax_OCT2 = 0.1 nM/s, Kt _OCT2_apicaltocell = 101.5 nM, Vmax_baso_active = 43.0 nM/s, Kt_baso_active = 33.1 nM, Vmax_baso_new_FD = 50 nM/s and Kt_baso_new_FD_basotocell = 101.5–1,015 nM.
FIGURE 7
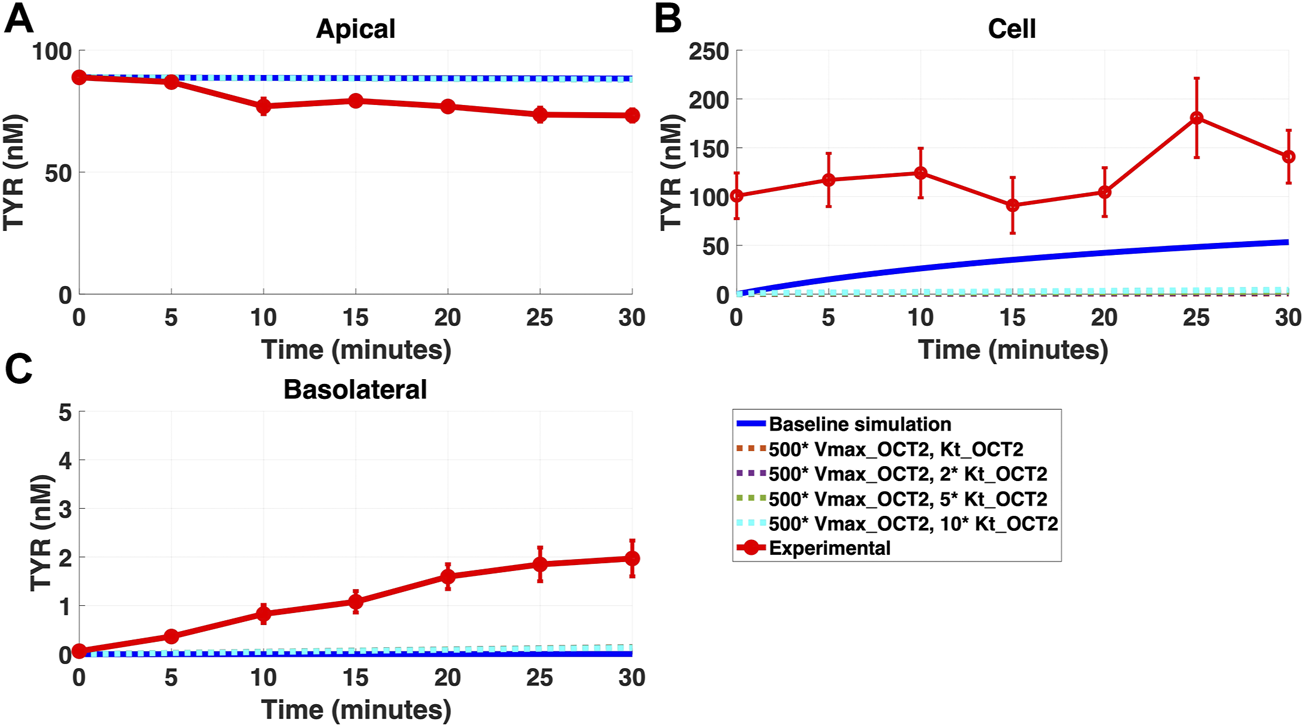
Introduction of a non-OCT2 facilitated diffusion transporter to basolateral membranes worsens model matching to experimental data following apical TYR loading. The transport of 88.9 nM of TYR across Caco-2 cells was modeled for apical loading by solving Eqs 4–8, using the values mentioned in Supplementary Table S2, using MATLAB vR 2021a. Comparisons were made between the models (baseline = blue curve; modified = dotted curves) and experimental observations; red curve (Sarkar and Berry, 2020) for the apical Panel 7(A), cellular Panel 7(B) and basolateral compartments Panel 7(C). Addition of the additional transporter to the basolateral membrane decreased the ability to model experimental data. Kinetic parameters used for this modelling were: Vmax_OCT2 = 0.1 nM/s, Kt _OCT2_apicaltocell = 101.5 nM, Vmax_baso_active = 43.0 nM/s, Kt_baso_active = 33.1 nM, Vmax_baso_new_FD = 50 nM/s and Kt_baso_new_FD_basotocell = 101.5–1,015 nM.
3.3 Asymmetric apical membrane TYR transport by OCT2 allows recapitulation of experimental findings
Since improvement in model accuracy for basolateral loading came at a cost of worsening the accuracy for apical loading, we reasoned that one or more of the facilitated diffusion transporters needed to show asymmetric transport characteristics. Introducing such asymmetry allowed experimental concentration-time relationships to be recapitulated (Figures 8A–C and 9A–C) when an approximate 10-fold asymmetry in OCT2 was present in combination with symmetric transport by the added basolateral membrane facilitated diffusion transporter (Table 1).
FIGURE 8
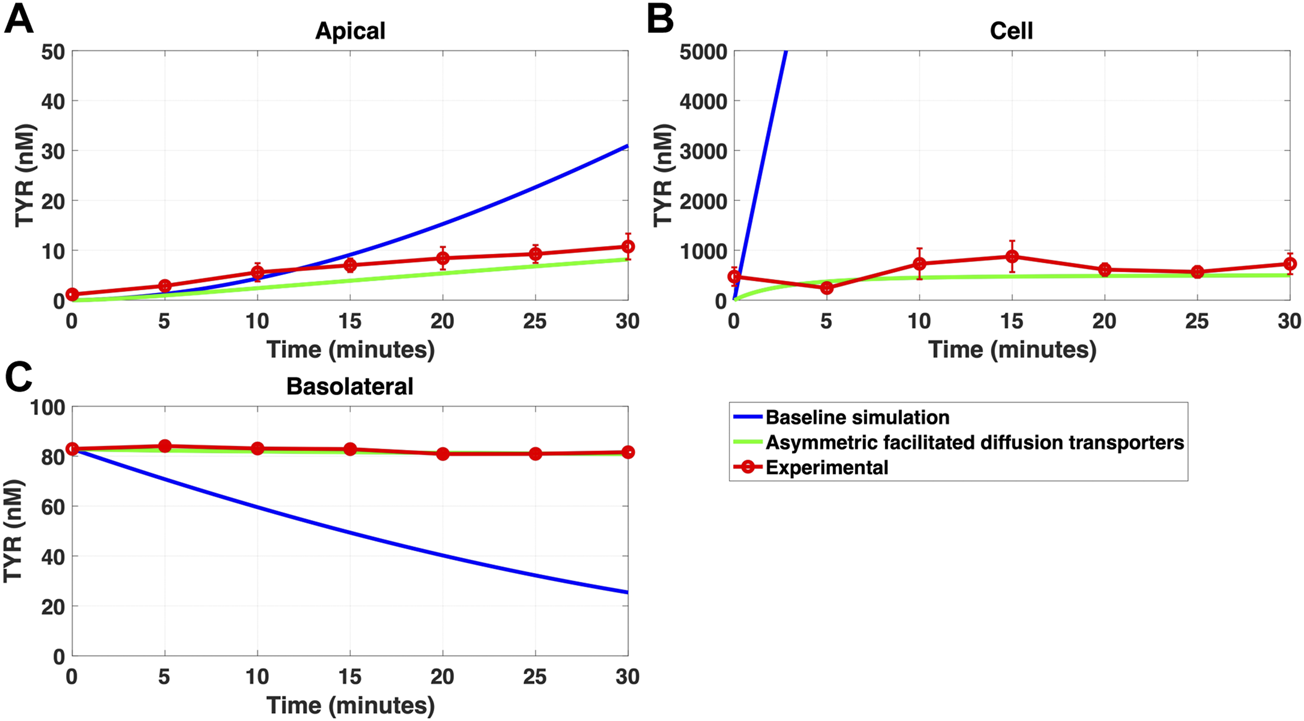
Asymmetry of OCT2 mediated transport recapitulates experimental observations following basolateral TYR loading. The transport of 82.9 nM TYR across Caco-2 cells was modeled following basolateral loading by solving Eqs 9–11, using the values mentioned in Supplementary Table S2, using MATLAB vR 2021a. Comparisons were made between the models (baseline = blue curve; modified = green curves) and experimental observations; red curve (Sarkar and Berry, 2020) for the apical Panel 8(A), cellular Panel 8(B) and basolateral compartments Panel 8(C). Asymmetric OCT2 transport combined with a fully bidirectional basolateral membrane facilitated diffusion transporter allowed experimental data to be modelled. Solved kinetic parameters from this modelling were: Vmax_OCT2 = 2.3 nM/s, Kt _OCT2_apicaltocell = 110.4 nM, Kt _OCT2_celltoapical = 1,227.9 nM, Vmax_baso_active = 3.3 nM/s, Kt_baso_active = 29.0 nM, Vmax_baso_new_FD = 6.0 nM/s, Kt_baso_new_FD_basotocell = 584.1 nM and Kt_baso_new_FD_celltobaso = 672.4 nM.
FIGURE 9
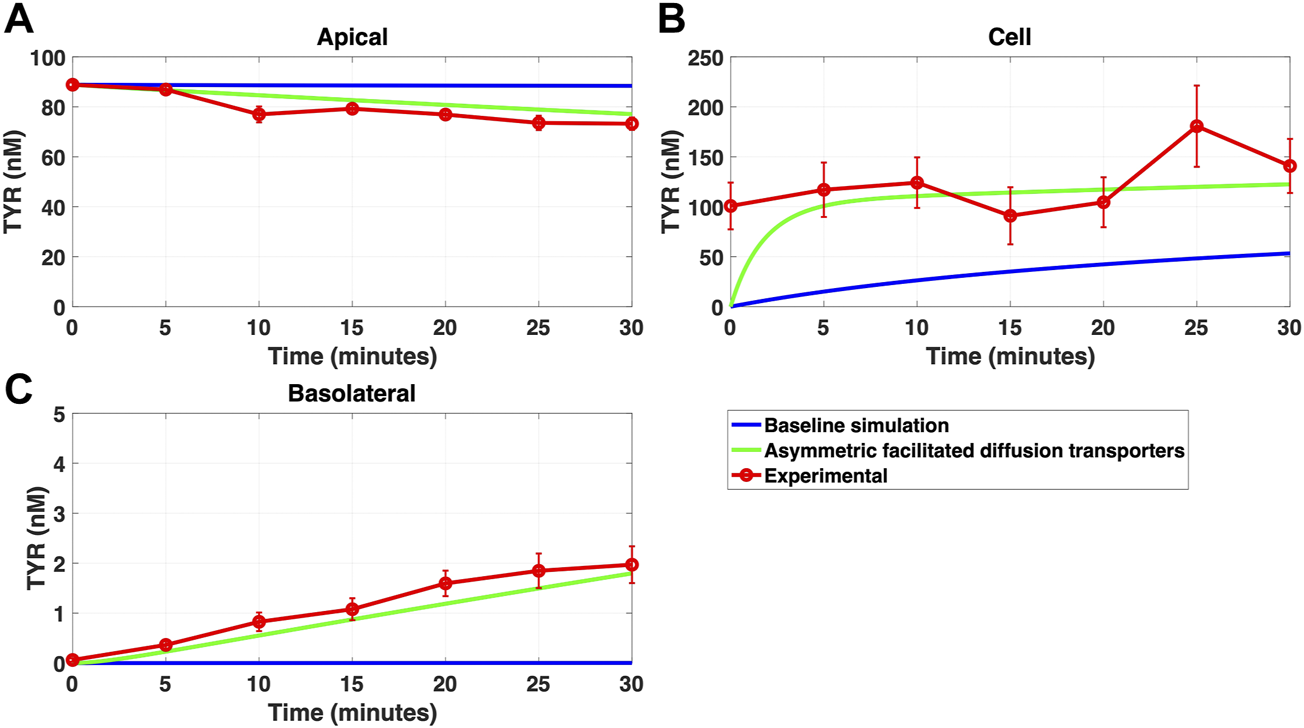
Introduction of asymmetry in the apical membrane OCT2 successfully recapitulates experimental observations following apical TYR loading. The transport of 88.9 nM of TYR across Caco-2 cells was modeled following apical loading by solving Eqs 9–11, using the values mentioned in Supplementary Table S2, using MATLAB vR 2021a. Comparisons were made between the models (baseline = blue curve; modified = green curves) and experimental observations; red curve (Sarkar and Berry, 2020) for the apical Panel 9(A), cellular (Panel 9(B) and basolateral compartments (Panel 9(C). The model reproduced experimental findings when asymmetric OCT2 transport was combined with a fully bidirectional basolateral membrane facilitated diffusion transporter. Solved kinetic parameters from this modelling were: Vmax_OCT2 = 2.3 nM/s, Kt _OCT2_apicaltocell = 110.4 nM, Kt _OCT2_celltoapical = 1,227.9 nM, Vmax_baso_active = 3.3 nM/s, Kt_baso_active = 29.0 nM, Vmax_baso_new_FD = 6.0 nM/s, Kt_baso_new_FD_basotocell = 584.1 nM and Kt_baso_new_FD_celltobaso = 672.4 nM.
TABLE 1
| Parameter | Predicted kinetics from model | Experimentally determined kinetics |
|---|---|---|
| Vmax_OCT2 | 2.3 nM/s | 0.1 nM/s |
| Kt _OCT2_apicaltocell | 110.4 nM | 101.5 nM |
| Kt _OCT2_celltoapical | 1,227.9 nM | 101.5 nM |
| Vmax_baso_active | 3.3 nM/s | 43.0 nM/s |
| Kt_baso_active | 29.0 nM | 33.1 nM |
| Vmax_baso_new_FD | 6.0 nM/s | n/a |
| Kt_baso_new_FD_basotocell | 584.1 nM* | n/a |
| Kt_baso_new_FD_celltobaso | 672.4 nM* | n/a |
Required facilitated diffusion transporter kinetics for modelling of experimentally determined concentration-time relationships of TYR in each compartment.
Kinetic parameters of OCT2 and the added basolateral membrane transporter necessary to reproduce experimental concentration-time relationships in each compartment following either apical or basolateral TYR loading were solved for by least squares minimization following the development of objective functions to describe trans-cellular transport in each direction. *Kt_baso_new_FD_basotocell and Kt_baso_new_FD_celltobaso did not show a meaningful directional preference and so for future plots, the average value of 628.3 nM was used as the Kt for the basolateral bidirectional facilitated diffusion transporter.
3.4 Compartmentalization partially, but not fully, replaces the need for OCT2 asymmetry
While a compartmentalization factor of 0.36 (64% of intracellular TYR is sequestered into one or more intracellular compartments) allowed a partial matching to experimental observations following basolateral compartment loading (Figures 10A–C), it was not as effective as asymmetric OCT2 transport (c.f. Figure 8), confirmed by generally lower root mean square deviation (RMSD) values for asymmetric OCT2 transport (2.75, 289.76 and 0.9868 for apical, cellular and basolateral compartments respectively) than for compartmentalization model fits (4.23, 228.39 and 1.88, respectively). Similarly following apical loading, while some improvements compared to the baseline model were possible with compartmentalization (RMSD = 7.52, 46.22 and 0.84 for apical, cellular and basolateral compartments; Figures 11A–C), these were not as robust as with asymmetric OCT2 transport (c.f. Figure 9; RMSD = 4.34, 48.86 and 0.26) with RMSD values 2-4 fold lower for asymmetric OCT2 transport in two of the three compartments. We could not attribute significance to the difference in RMSD values for the cellular compartment between the two models, given the large relative uncertainties in concentration in the cellular compartment. However, for both basolateral and apical loading, the OCT2 asymmetry model provided quantitatively better fits for the apical and basolateral concentrations: the RMSD values were approximately twice as small compared to the compartmentalization model. Furthermore, solved kinetics for the required intracellular compartment transporter (Vmax = 5.2 × 10⁻²¹ M/s; Kt = 154.5 nM; when using Eqs 15–18 were physiologically inconsequential.
FIGURE 10
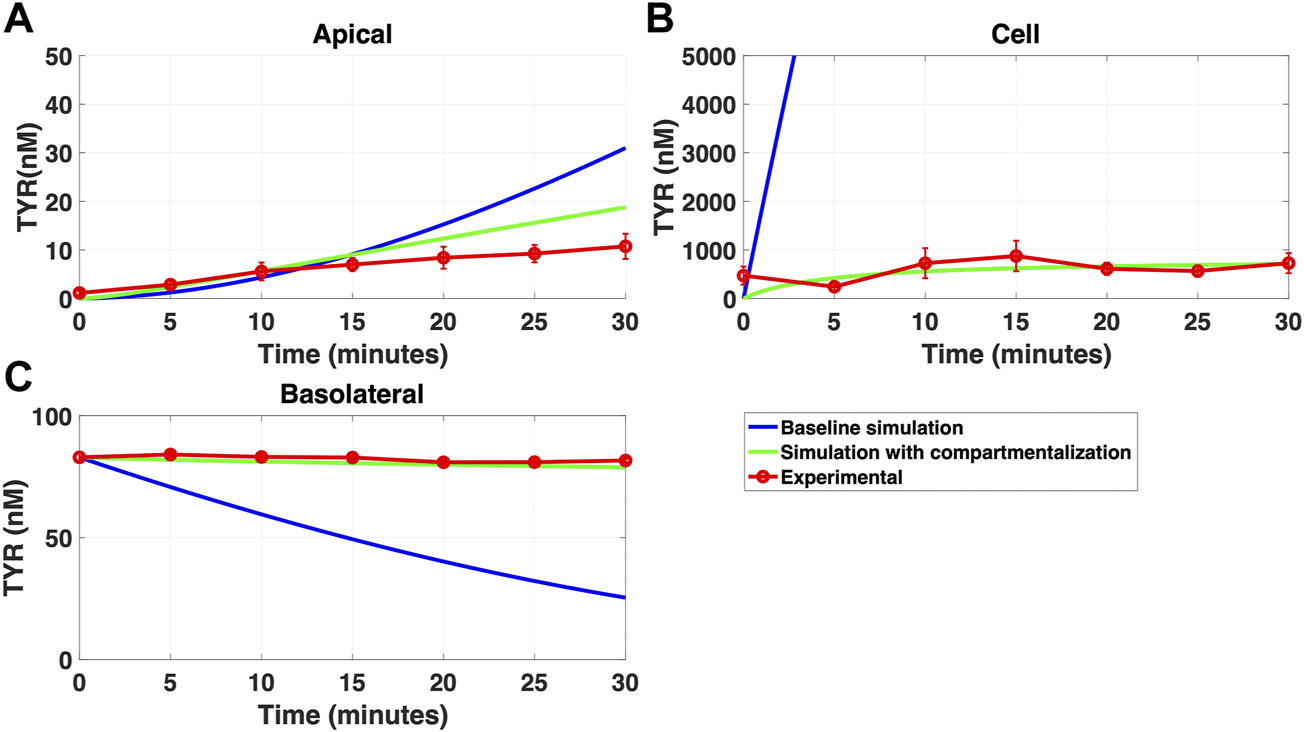
Compartmentalization is needed with introduction of symmetry in the facilitated diffusion transporters with basolateral TYR loading. The transport of 82.9 nM TYR across Caco-2 cells was modeled following basolateral loading by solving Eqs 12–14, using the values mentioned in Supplementary Table S2, using MATLAB vR 2021a. Comparisons were made between the models (baseline = blue curve; modified = green curves) and experimental observations; red curve (Sarkar and Berry, 2020) for the apical Panel 10(A), cellular Panel 10(B) and basolateral compartments Panel 10(C). When symmetry is introduced in the facilitated diffusion transporters, compartmentalization is needed. Kinetic parameters used for this modelling were: Vmax_OCT2 = 2.3 nM/s, Kt _OCT2_apicaltocell = 110.4 nM, Kt _OCT2_celltoapical = 110.4 nM, Vmax_baso_active = 3.3 nM/s, Kt_baso_active = 29.0 nM, Vmax_baso_new_FD = 6.0 nM/s, Kt_baso_new_FD_basotocell = 628.3 nM* and Kt_baso_new_FD_celltobaso = 628.3 nM*. *Kt_baso_new_FD_basotocell and Kt_baso_new_FD_celltobaso from Figures 8 and 9 did not show a meaningful directional preference, and so the average value of 628.3 nM was used in each direction for the basolateral bidirectional facilitated diffusion transporter.
FIGURE 11
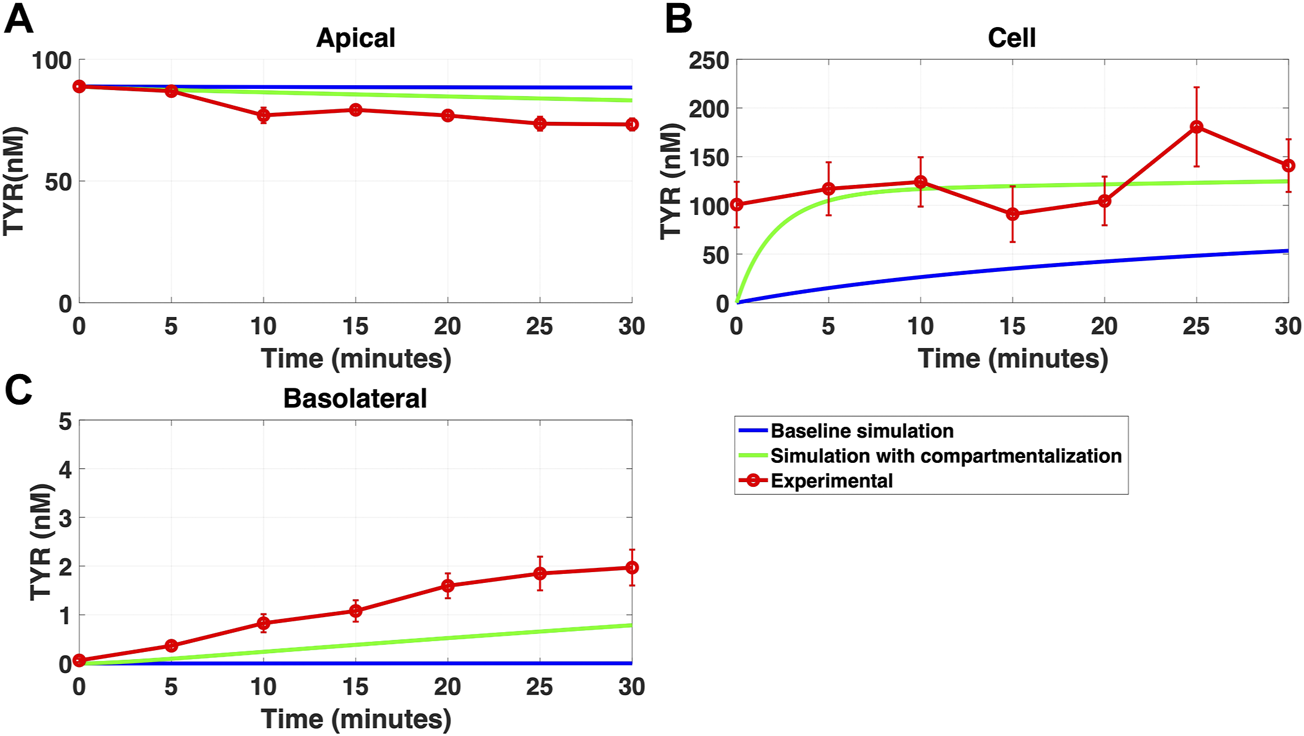
Compartmentalization is needed with introduction of symmetry in the facilitated diffusion transporters with apical loading. The transport of 88.9 nM TYR across Caco-2 cells was modeled following apical loading by solving Eqs 12–14, using the values mentioned in Supplementary Table S2, using MATLAB vR 2021a. Comparisons were made between the models (baseline = blue curve; modified = green curves) and experimental observations; red curve (Sarkar and Berry, 2020) for the apical Panel 11(A), cellular Panel 11(B) and basolateral compartments Panel 11(C). When symmetry is introduced in the facilitated diffusion transporters, compartmentalization is needed. Kinetic parameters used for this modelling were: Vmax_OCT2 = 2.3 nM/s, Kt _OCT2_apicaltocell = 110.4 nM, Kt _OCT2_celltoapical = 110.4 nM, Vmax_baso_active = 3.3 nM/s, Kt_baso_active = 29.0 nM, Vmax_baso_new_FD = 6.0 nM/s, Kt_baso_new_FD_basotocell = 628.3 nM* and Kt_baso_new_FD_celltobaso = 628.3 nM*. *Kt_baso_new_FD_basotocell and Kt_baso_new_FD_celltobaso from Figures 8 and 9 did not show a meaningful directional preference, and so the average value of 628.3 nM was used as the Kt in each direction for the basolateral bidirectional facilitated diffusion transporter.
4 Discussion
The role of TYR in maintaining various physiological functions by activating intracellularly localized TAAR1 has been well established (Berry et al., 2017; Christian and Berry, 2018; Gainetdinov et al., 2018). Previous literature has reported and characterized distinct TYR transport processes that include simple diffusion across synthetic lipid bilayers (Berry et al., 2013), an OCT2-mediated facilitated diffusion transport process across membranes in native neuronal preparations (Berry et al., 2016) and Caco-2 cells (Sarkar and Berry, 2020), and a novel Na+-dependent active transporter across the basolateral membrane of Caco-2 cells (Sarkar and Berry, 2020). It is possible other TYR transport processes exist in intestinal cells that were masked due to the active accumulation of TYR across the basolateral Caco-2 cell membrane in this previous study. Hence, here we developed a model based on known transport kinetics, to determine whether these were sufficient to explain previously obtained (Sarkar and Berry, 2020) experimental concentration-time relationships in the Caco-2 model system.
Simulating TYR transport across Caco-2 cells using known transporter kinetics (Figure 1A) did not match experimental concentration-time relationships (Sarkar and Berry, 2020) for basolateral addition (Figures 2A–C). Similarly, for apical addition, this model was unable to recreate experimental concentration-time relationships in each compartment (Figures 3A–C). This suggested the presence of one or more additional TYR transporters in the basolateral membrane. Since OCT2 was already known to be expressed in the apical membrane (Sarkar and Berry, 2020), we first investigated whether adding OCT2 to the basolateral membrane would improve the model. Even if the density of the added basolateral membrane OCT2 was allowed to vary between 0.1x and 20x that in the apical membrane, experimental TYR concentration-time relationships still could not be recreated (Figures 4A–C and 5A–C), suggesting that the additional, basolateral, facilitated diffusion transporter is not OCT2.
We then systematically varied both the Vmax and Kt values for the added basolateral membrane transporter to model a facilitated diffusion transporter with non-OCT2 kinetics. With a Vmax = 55 nM/s and Kt = 203–507.5 nM improvement in modelling accuracy was observed for TYR basolateral addition (Figures 6A–C), but not apical addition (Figures 7A–C). Since model improvements following basolateral loading came at the expense of decreased performance following apical loading, we hypothesized that either asymmetry was needed in one or more of the facilitated diffusion transporters, or that compartmentalization of TYR within the cell was occurring at the high cellular concentrations seen following basolateral loading.
Asymmetry was introduced by allowing Kt to vary in each direction of transport for both of the facilitated diffusion transporters, OCT2 in the apical membrane and the added basolateral membrane facilitated diffusion transporter. On introduction of asymmetry, recapitulation of experimental results was possible in all compartments for both apical-to-basolateral and basolateral-to-apical TYR transport (Figures 8A–C and 9A–C). This required an approximate 10-fold preference of OCT2 for transporting TYR into the cell from the apical compartment, while no meaningful directional preference was required for the basolateral membrane facilitated diffusion transporter. The asymmetric transport also allowed for modelling of the marginally higher Xcell compared to Xapical for apical loading (Figure 9). Interestingly, asymmetric bidirectional facilitated diffusion transporters have previously been described with respect to amino acid transport across the blood brain barrier (Zaragozá, 2020), although we are unaware of any previous reports of directionality exhibited by OCT2. Physiologically this directionality may reflect known differences in pH between the intestinal lumen and cytosolic compartments with typical luminal (apical) pH ranging from 6.0–6.5 while the cytosolic space has a pH of 7.4 (Neuhoff et al., 2005). Such a difference in pH between the apical and cellular compartments, would result in a close to 10-fold difference in the ionization state of TYR between the two compartments. This would be seen as a 10-fold increase in protonated TYR in the luminal space compared to the cytosol suggesting thatOCT2 preferentially binds, and therefore transports, the protonated (positively charged) form of TYR.
As a possible alternative to asymmetry of TYR transport by OCT2, we examined whether the introduction of intracellular compartmentalization of TYR could also recapitulate experimental concentration-time relationships. Previous literature has established an intracellular localization of TAAR1 in various cell types and tissues (Bunzow et al., 2001; Lindemann et al., 2005; Barak et al., 2008; Raab et al., 2016). In particular, endoplasmic reticulum, secretory vesicle (Espinoza et al., 2018), nuclear (Pitts et al., 2019; Barnes et al., 2021) and unspecified intracellular membrane (Miller et al., 2005) localizations have been suggested. Accumulation of TYR in one or more of these compartments could therefore be a requirement for TAAR1 binding to occur. Initially we simply introduced a compartmentalization factor, ‘z’, where ‘z’ represents the fraction of intracellular TYR available to cross basolateral and apical membranes. A value of z = 0.36, indicating 64% of TYR was sequestered into one or more subcellular compartment(s), was obtained which partially alleviated the need for asymmetry of OCT2 transport, at least following basolateral loading. With 64% of TYR sequestered into a compartment comprising 10% of the cellular volume, this would suggest the presence of an active transporter in the intracellular compartment. Although modelling closely matched experimental for some compartments (Figures 10, 11) the match to experimental was visibly less close than that obtained with asymmetric transport (Figures 8, 9) and had 2–4 fold higher RMSD values in two of the three compartments. Further, the compartmentalization appeared to provide a better fit for basolateral, compared to apical loading, suggesting that a compartment transporter would primarily only be active at the higher intracellular concentrations seen following basolateral loading. We next sought to determine the kinetic parameters that would be required for transport into such an intracellular compartment(s) under the assumption that the volume of the inner compartment was 10% (or less) of the total volume of the cell. Although a physiologically relevant Kt value (154.5 nM) was predicted which would be consistent with activity primarily at the higher concentrations seen following basolateral transport, the Vmax (5.2 × 10⁻²¹ nM/s) is equivalent to a mere 86 molecules per second per cell transported, indicating an unrealistically low density of transporter to be of physiological relevance.
With our previous observation that there is active accumulation of TYR within the cells following basolateral addition (Sarkar and Berry, 2020), and the observed high Kt of the basolateral membrane facilitated diffusion transporter (Table 1), we propose that this is not a selective TYR transporter but rather non-selectively includes TYR in its substrate spectrum at the high intracellular concentrations seen due to the active transporter. While the current modelling suggests the need for additional low affinity transporters to be present, it provides limited details on the potential identity of such transporters. TYR is a substrate for both Organic Cation Transporter 3 (OCT3; Slc22A3) and Plasma Membrane Monoamine Transporter (PMAT; Slc29A4) with a reported Kt at each of approximately 280 nM (Engel and Wang, 2005; Chen et al., 2010), not too dissimilar from our modelled Kt of approximately 600 nM. Further, both have been reported to be expressed in the small intestine (Shirasaka et al., 2016; Dawed et al., 2019), making these potential candidates for the additional basolateral TYR facilitated diffusion transporter required in our modelling. The high variability of measured intracellular TYR concentrations as a result of the very small volume of the cellular compartment, introduces considerable uncertainty in the estimation of rates of change of intracellular TYR and consequently deduced kinetics. Identification of candidate transporters will therefore require further studies to identify the TYR binding proteins present in Caco-2 cell preparations. This transporter could become important pathologically during compromised TYR metabolism, such as following treatment with MAO inhibitors where it would provide a conduit for dietary TYR to enter the bloodstream when present at high levels. Such excess levels of TYR are known to cause indirect sympathomimetic effects leading to severe hypertensive crisis and in extreme situations, death (Finberg and Gillman, 2011).
The studies reported here are likely to be generally relevant to other cell types beyond Caco-2 cells. Broad substrate facilitated diffusion transporters such as OCT3 (Wu et al., 2000; Lips et al., 2005) and PMAT (Wang, 2016) are known to be present in the lung epithelia, brain, hepatocytes, kidney, and heart, and at least some of these are also known to express TAAR1 (Borowsky et al., 2001; Lindemann et al., 2005; Revel et al., 2012; Cisneros and Ghorpade, 2014; Fleischer et al., 2018). In particular, cells associated with barrier functions such as the blood-brain-barrier and fetal-placental barrier express a broad range of broad-spectrum transporters. Interestingly, TAAR1 has been implicated in recurrent miscarriages (Stavrou et al., 2018), and as such identifying the transporters that regulate endogenous agonist passage across the placental barrier may be an avenue to therapeutic options in susceptible individuals.
5 Conclusion
This study provides the first evidence for an additional basolateral membrane facilitated diffusion transporter present in Caco-2 cells that includes TYR in its substrate spectrum. This additional transporter does not have kinetic characteristics consistent with those of OCT2, and may represent either OCT3 or PMAT. Rather than selectively targeting TYR for transport we propose that TYR is transported non-selectively when present at high concentrations (>250 nM). In addition, our modelling predicts that the apical membrane OCT2 shows an unequal bidirectional transport of TYR which we hypothesize is reflective of the pH differences between the intestinal lumen and epithelial cell cytosol.
Statements
Data availability statement
The original contributions presented in the study are included in the article/Supplementary Material, further inquiries can be directed to the corresponding author.
Author contributions
MB and IS-V provided the grant funding for this work, supervised the work, and contributed to model development, data analysis and interpretation, and manuscript preparation and editing. SS performed simulations, contributed to model development, data analysis and interpretation, prepared initial manuscript drafts, and prepared and edited the final version of the manuscript.
Funding
Provided by Natural Sciences and Engineering Research Council of Canada (MB, IS-V) and Memorial University of Newfoundland (MB).
Acknowledgments
The authors gratefully acknowledge the Natural Sciences and Engineering Research Council of Canada and Memorial University of Newfoundland for their financial support for this work.
Conflict of interest
The authors declare that the research was conducted in the absence of any commercial or financial relationships that could be construed as a potential conflict of interest.
Publisher’s note
All claims expressed in this article are solely those of the authors and do not necessarily represent those of their affiliated organizations, or those of the publisher, the editors and the reviewers. Any product that may be evaluated in this article, or claim that may be made by its manufacturer, is not guaranteed or endorsed by the publisher.
Supplementary material
The Supplementary Material for this article can be found online at: https://www.frontiersin.org/articles/10.3389/fphys.2022.1009320/full#supplementary-material
References
1
AdriaenssensA.LamB. Y. H.BillingL.SkeffingtonK.SewingS.ReimannF.et al (2015). A transcriptome-led exploration of molecular mechanisms regulating somatostatin-producing D-cells in the gastric epithelium. Endocrinology156, 3924–3936. 10.1210/EN.2015-1301
2
AnD.ChenZ.ZhengJ.ChenS.WangL.HuangZ.et al (2015). Determination of biogenic amines in oysters by capillary electrophoresis coupled with electrochemiluminescence. Food Chem.168, 1–6. 10.1016/J.FOODCHEM.2014.07.019
3
BabusyteA.KotthoffM.FiedlerJ.KrautwurstD. (2013). Biogenic amines activate blood leukocytes via trace amine-associated receptors TAAR1 and TAAR2. J. Leukoc. Biol.93, 387–394. 10.1189/JLB.0912433
4
BarakL. S.SalahpourA.ZhangX.MasriB.SotnikovaT. D.RamseyA. J.et al (2008). Pharmacological characterization of membrane-expressed human Trace Amine-Associated Receptor 1 (TAAR1) by a bioluminescence resonance energy transfer cAMP biosensor. Mol. Pharmacol.74, 585–594. 10.1124/MOL.108.048884
5
BarnesD. A.GallowayD. A.HoenerM. C.BerryM. D.MooreC. S. (2021). TAAR1 expression in human macrophages and brain tissue: A potential novel facet of ms neuroinflammation. Int. J. Mol. Sci.22, 11576. 10.3390/IJMS222111576
6
BerryM. D.GainetdinovR. R.HoenerM. C.ShahidM. (2017). Pharmacology of human trace amine-associated receptors: Therapeutic opportunities and challenges. Pharmacol. Ther.180, 161–180. 10.1016/J.PHARMTHERA.2017.07.002
7
BerryM. D.HartS.PryorA. R.HunterS.GardinerD. (2016). Pharmacological characterization of a high-affinity p-tyramine transporter in rat brain synaptosomes. Sci. Rep.6, 38006. 10.1038/srep38006
8
BerryM. D. (2004). Mammalian central nervous system trace amines. Pharmacologic amphetamines, physiologic neuromodulators. J. Neurochem.90, 257–271. 10.1111/J.1471-4159.2004.02501.X
9
BerryM. D.ShitutM. R.AlmousaA.AlcornJ.TomberliB. (2013). Membrane permeability of trace amines: Evidence for a regulated, activity-dependent, nonexocytotic, synaptic release. Synapse67, 656–667. 10.1002/SYN.21670
10
BijiK. B.RavishankarC. N.VenkateswarluR.MohanC. O.GopalT. K. S. (2016). Biogenic amines in seafood: A review. J. Food Sci. Technol.53, 2210–2218. 10.1007/S13197-016-2224-X
11
BonnerT. I.DavenportA. P.FoordS. M.MaguireJ. J.ParkerW. A. (2019). Trace amine receptor (version 2019.4) in the IUPHAR/BPS guide to Pharmacology database. IUPHAR/BPS guide to Pharmacology CITE2019 (4). 10.2218/gtopdb/f64/2019.4
12
Bonnin-JusserandM.GrandvaletC.RieuA.WeidmannS.AlexandreH. (2012). Tyrosine-containing peptides are precursors of tyramine produced by Lactobacillus plantarum strain IR BL0076 isolated from wine. BMC Microbiol.12, 199. 10.1186/1471-2180-12-199
13
BorowskyB.AdhamN.JonesK. A.RaddatzR.ArtymyshynR.OgozalekK. L.et al (2001). Trace amines: Identification of a family of mammalian G protein-coupled receptors. Proc. Natl. Acad. Sci. U. S. A.98, 8966–8971. 10.1073/PNAS.151105198
14
BunzowJ. R.SondersM. S.ArttamangkulS.HarrisonL. M.ZhangG.QuigleyD. I.et al (2001). Amphetamine, 3, 4-methylenedioxymethamphetamine, lysergic acid diethylamide, and metabolites of the catecholamine neurotransmitters are agonists of a rat trace amine receptor. Mol. Pharmacol.60, 1181–1188. 10.1124/MOL.60.6.1181
15
ChenL.PawlikowskiB.SchlessingerA.MoreS. S.StrykeD.JohnsS. J.et al (2010). Role of Organic Cation Transporter 3 (SLC22A3) and its missense variants in the pharmacologic action of metformin. Pharmacogenet. Genomics20, 687–699. 10.1097/FPC.0B013E32833FE789
16
ChielliniG.ErbaP.CarnicelliV.ManfrediC.FrascarelliS.GhelardoniS.et al (2012). Distribution of exogenous [125I]-3-iodothyronamine in mouse in vivo: Relationship with trace amine-associated receptors. J. Endocrinol.213, 223–230. 10.1530/JOE-12-0055
17
ChristianS. L.BerryM. D. (2018). Trace amine-associated receptors as novel therapeutic targets for immunomodulatory disorders. Front. Pharmacol.9, 680. 10.3389/fphar.2018.00680
18
CisnerosI. E.GhorpadeA. (2014). Methamphetamine and HIV-1-induced neurotoxicity: Role of trace amine associated receptor 1 cAMP signaling in astrocytes. Neuropharmacology85, 499–507. 10.1016/J.NEUROPHARM.2014.06.011
19
CrippsM. J.BagnatiM.JonesT. A.OgunkoladeB. W.SayersS. R.CatonP. W.et al (2020). Identification of a subset of trace amine-associated receptors and ligands as potential modulators of insulin secretion. Biochem. Pharmacol.171, 113685. 10.1016/J.BCP.2019.113685
20
D’AndreaG.TerrazzinoS.FortinD.FarruggioA.RinaldiL.LeonA. (2003). HPLC electrochemical detection of trace amines in human plasma and platelets and expression of mRNA transcripts of trace amine receptors in circulating leukocytes. Neurosci. Lett.346, 89–92. 10.1016/S0304-3940(03)00573-1
21
DawedA. Y.ZhouK.van LeeuwenN.MahajanA.RobertsonN.KoivulaR.et al (2019). Variation in the plasma membrane monoamine transporter (PMAT) (encoded by SLC29A4) and organic cation transporter 1 (OCT1) (encoded by SLC22A1) and gastrointestinal intolerance to metformin in type 2 diabetes: An IMI DIRECT study. Diabetes Care42, 1027–1033. 10.2337/DC18-2182
22
EngelK.WangJ. (2005). Interaction of Organic Cations with a newly identified plasma membrane monoamine transporter. Mol. Pharmacol.68, 1397–1407. 10.1124/MOL.105.016832
23
EspinozaS.PittalugaA. M.Di GenovaU.SalahpourA.ZucchiR.RutiglianoG.et al (2018). The Case for TAAR1 as a modulator of central nervous system function. Front. Pharmacol.8, 987. 10.3389/fphar.2017.00987
24
FerragudA.HowellA. D.MooreC. F.TaT. L.HoenerM. C.SabinoV.et al (2016). The Trace Amine-Associated Receptor 1 agonist RO5256390 blocks compulsive, binge-like eating in rats. Neuropsychopharmacology42, 1458–1470. 10.1038/npp.2016.233
25
FinbergJ. P. M.GillmanK. (2011). Selective inhibitors of monoamine oxidase type B and the “cheese effect. Int. Rev. Neurobiol.100, 169–190. 10.1016/B978-0-12-386467-3.00009-1
26
FleischerL. M.SomaiyaR. D.MillerG. M. (2018). Review and Meta-Analyses of TAAR1 expression in the immune system and cancers. Front. Pharmacol.9, 683. 10.3389/fphar.2018.00683
27
FriedmanM. H. (2008). “Models of Transport Across Cell Membranes,” in Principles and Models of Biological TransportNew York, NY.: Springer. 10.1007/978-0-387-79240-8_7
28
FujisakaS.Avila-PachecoJ.SotoM.KosticA.DreyfussJ. M.PanH.et al (2018). Diet, genetics, and the gut microbiome drive dynamic changes in plasma metabolites. Cell. Rep.22, 3072–3086. 10.1016/J.CELREP.2018.02.060
29
GainetdinovR. R.HoenerM. C.BerryM. D. (2018). Trace amines and their receptors. Pharmacol. Rev.70, 549–620. 10.1124/PR.117.015305
30
GozalE. A.O’NeillB. E.SawchukM. A.ZhuH.HalderM.ChouC. C.et al (2014). Anatomical and functional evidence for trace amines as unique modulators of locomotor function in the mammalian spinal cord. Front. Neural Circuits8, 134. 10.3389/FNCIR.2014.00134
31
ItoJ.ItoM.NambuH.FujikawaT.TanakaK.IwaasaH.et al (2009). Anatomical and histological profiling of orphan G-protein-coupled receptor expression in gastrointestinal tract of C57BL/6J mice. Cell. Tissue Res.338, 257–269. 10.1007/S00441-009-0859-X
32
KiddM.ModlinI. M.GustafssonB. I.DrozdovI.HausoO.PfragnerR. (2008). Luminal regulation of normal and neoplastic human EC cell serotonin release is mediated by bile salts, amines, tastants, and olfactants. Am. J. Physiology - Gastrointest. Liver Physiology295, 260–272. 10.1152/AJPGI.00056.2008/ASSET/IMAGES/LARGE/ZH30080851560010.JPEG
33
KoblanK. S.KentJ.HopkinsS. C.KrystalJ. H.ChengH.GoldmanR.et al (2020). A Non–D2-receptor-binding drug for the treatment of schizophrenia. N. Engl. J. Med.382, 1497–1506. 10.1056/NEJMOA1911772/SUPPL_FILE/NEJMOA1911772_DATA-SHARING.PDF
34
LandeteJ. M.PardoI.FerrerS. (2007). Tyramine and phenylethylamine production among lactic acid bacteria isolated from wine. Int. J. Food Microbiol.115, 364–368. 10.1016/J.IJFOODMICRO.2006.10.051
35
LindemannL.EbelingM.KratochwilN. A.BunzowJ. R.GrandyD. K.HoenerM. C. (2005). Trace amine-associated receptors form structurally and functionally distinct subfamilies of novel G protein-coupled receptors. Genomics85, 372–385. 10.1016/j.ygeno.2004.11.010
36
LindemannL.MeyerC. A.JeanneauK.BradaiaA.OzmenL.BluethmannH.et al (2008). Trace Amine-Associated Receptor 1 modulates dopaminergic activity. J. Pharmacol. Exp. Ther.324, 948–956. 10.1124/JPET.107.132647
37
LipsK. S.VolkC.SchmittB. M.PfeilU.ArndtP.MiskaD.et al (2005). Polyspecific cation transporters mediate luminal release of acetylcholine from bronchial epithelium. Am. J. Respir. Cell. Mol. Biol.33, 79–88. 10.1165/rcmb.2004-0363OC
38
LiuS. J.XuJ. J.MaC. L.GuoC. F. (2018). A comparative analysis of derivatization strategies for the determination of biogenic amines in sausage and cheese by HPLC. Food Chem.266, 275–283. 10.1016/J.FOODCHEM.2018.06.001
39
MartinV. T.VijB. (2016). Diet and headache: Part 1. Headache56, 1543–1552. 10.1111/HEAD.12953
40
MazzoliR.PessioneE. (2016). The neuro-endocrinological role of microbial glutamate and GABA signaling. Front. Microbiol.7, 1934. 10.3389/FMICB.2016.01934
41
MichaelE. S.CovicL.KuliopulosA. (2019). Trace amine–associated receptor 1 (TAAR1) promotes anti-diabetic signaling in insulin-secreting cells. J. Biol. Chem.294, 4401–4411. 10.1074/JBC.RA118.005464
42
MillerG. M.VerricoC. D.JassenA.KonarM.YangH.PanasH.et al (2005). Primate trace amine receptor 1 modulation by the dopamine transporter. J. Pharmacol. Exp. Ther.313, 983–994. 10.1124/JPET.105.084459
43
NairP. C.ChalkerJ. M.MckinnonR. A.LangmeadC. J.GregoryK. J.BastiampillaiT. (2022). Trace Amine-Associated Receptor 1 (TAAR1): Molecular and clinical insights for the treatment of schizophrenia and related comorbidities. ACS Pharmacol. Transl. Sci.5, 183–188. 10.1021/ACSPTSCI.2C00016/ASSET/IMAGES/LARGE/PT2C00016_0002.JPEG
44
Nalazek-RudnickaK.WasikA. (2017). Development and validation of an LC–MS/MS method for the determination of biogenic amines in wines and beers. Monatsh. Chem.148, 1685–1696. 10.1007/s00706-017-1992-y
45
NazimekJ.PeriniF.McKieS.DawsonG.BrowningM.KoblanK.et al (2017). A phase 1 functional neuroimaging study of a new compound in healthy volunteers with high or low schizotypy. Brain Neurosci. Adv.1, 222–223. 10.1177/2398212817705279
46
NelsonD. A.TolbertM. D.SinghS. J.BostK. L. (2007). Expression of neuronal trace amine-associated receptor (taar) mRNAs in leukocytes. J. Neuroimmunol.192, 21–30. 10.1016/J.JNEUROIM.2007.08.006
47
NeuhoffS.UngellA. L.ZamoraI.ArturssonP. (2005). pH-Dependent passive and active transport of acidic drugs across Caco-2 cell monolayers. Eur. J. Pharm. Sci.25, 211–220. 10.1016/J.EJPS.2005.02.009
48
PeiY.Asif-MalikA.CanalesJ. J. (2016). Trace amines and the trace amine-associated receptor 1: Pharmacology, neurochemistry, and clinical implications. Front. Neurosci.10, 148. 10.3389/FNINS.2016.00148
49
PittsM. S.McShaneJ. N.HoenerM. C.ChristianS. L.BerryM. D. (2019). TAAR1 levels and sub-cellular distribution are cell line but not breast cancer subtype specific. Histochem. Cell. Biol.152, 155–166. 10.1007/S00418-019-01791-7
50
RaabS.WangH.UhlesS.ColeN.Alvarez-SanchezR.KünneckeB.et al (2016). Incretin-like effects of small molecule trace amine-associated receptor 1 agonists. Mol. Metab.5, 47–56. 10.1016/J.MOLMET.2015.09.015
51
RevelF. G.MoreauJ. L.PouzetB.MoryR.BradaiaA.BuchyD.et al (2012). A new perspective for schizophrenia: TAAR1 agonists reveal antipsychotic- and antidepressant-like activity, improve cognition and control body weight. Mol. Psychiatry18, 543–556. 10.1038/mp.2012.57
52
SarkarS.BerryM. D. (2020). Involvement of Organic Cation Transporter 2 and a Na +-dependent active transporter in p-tyramine transport across Caco-2 intestinal cells. Life Sci.253, 117696. 10.1016/J.LFS.2020.117696
53
ShirasakaY.LeeN.ZhaW.WagnerD.WangJ. (2016). Involvement of organic cation transporter 3 (Oct3/Slc22a3) in the bioavailability and pharmacokinetics of antidiabetic metformin in mice. Drug Metab. Pharmacokinet.31, 385–388. 10.1016/J.DMPK.2016.04.005
54
StavrouS.GratzM.TremmelE.KuhnC.HofmannS.HeideggerH.et al (2018). TAAR1 induces a disturbed GSK3β phosphorylation in recurrent miscarriages through the ODC. Endocr. Connect.7, 372–384. 10.1530/EC-17-0272
55
WangJ. (2016). The Plasma Membrane Monoamine Transporter (PMAT): Structure, function, and role in organic cation disposition. Clin. Pharmacol. Ther.100, 489–499. 10.1002/cpt.442
56
WolkenW. A. M.LucasP. M.Lonvaud-FunelA.LolkemaJ. S. (2006). The mechanism of the Tyrosine transporter TyrP supports a proton motive tyrosine decarboxylation pathway in Lactobacillus brevis. J. Bacteriol.188, 2198–2206. 10.1128/JB.188.6.2198-2206.2006
57
WuX.HuangW.GanapathyM. E.WangH.KekudaR.ConwayS. J.et al (2000). Structure, function, and regional distribution of the organic cation transporter OCT3 in the kidney. Am. J. Physiol. Ren. Physiol.279, 449–458. 10.1152/ajprenal.2000.279.3.F449
58
YangY.-X.MuC.-L.LuoZ.ZhuW.-Y. (2016). Bromochloromethane, a Methane Analogue, affects the microbiota and metabolic profiles of the rat gastrointestinal tract. Appl. Environ. Microbiol.82, 778–787. 10.1128/AEM.03174-15
59
ZaragozáR. (2020). Transport of amino acids across the blood-brain barrier. Front. Physiol.11, 973. 10.3389/FPHYS.2020.00973
60
ZhangY. J.ZhangY.ZhouY.LiG. H.YangW. Z.FengX. S. (2019). A review of pretreatment and analytical methods of biogenic amines in food and biological samples since 2010. J. Chromatogr. A1605, 360361. 10.1016/J.CHROMA.2019.07.015
Summary
Keywords
p-tyramine, trace amines, transporters, intestinal epithelium, simulations, kinetics, Caco-2 cells
Citation
Sarkar S, Saika-Voivod I and Berry MD (2022) Modelling of p-tyramine transport across human intestinal epithelial cells predicts the presence of additional transporters. Front. Physiol. 13:1009320. doi: 10.3389/fphys.2022.1009320
Received
01 August 2022
Accepted
22 September 2022
Published
10 November 2022
Volume
13 - 2022
Edited by
Tiziano Verri, University of Salento, Italy
Reviewed by
Seungwoo Kang, Medical College of Georgia at Augusta University, United States
Juan Aparicio Blanco, Complutense University of Madrid, Spain
Updates
Copyright
© 2022 Sarkar, Saika-Voivod and Berry.
This is an open-access article distributed under the terms of the Creative Commons Attribution License (CC BY). The use, distribution or reproduction in other forums is permitted, provided the original author(s) and the copyright owner(s) are credited and that the original publication in this journal is cited, in accordance with accepted academic practice. No use, distribution or reproduction is permitted which does not comply with these terms.
*Correspondence: Shreyasi Sarkar, ssarkar@mun.ca
†These authors have contributed equally to this work
This article was submitted to Membrane Physiology and Membrane Biophysics, a section of the journal Frontiers in Physiology
Disclaimer
All claims expressed in this article are solely those of the authors and do not necessarily represent those of their affiliated organizations, or those of the publisher, the editors and the reviewers. Any product that may be evaluated in this article or claim that may be made by its manufacturer is not guaranteed or endorsed by the publisher.