 Martin Krbec1,2
 Petr Waldauf1
 Francesco Zadek3
 Serena Brusatori2
 Alberto Zanella2,4
 František Duška1*
 Thomas Langer3,5
- 1Department of Anaesthesia and Intensive Care Medicine, The Third Faculty of Medicine, Charles University and FNKV University Hospital, Prague, Czechia
- 2Department of Pathophysiology and Transplantation, University of Milan, Milan, Italy
- 3Department of Medicine and Surgery, University of Milan-Bicocca, Monza, Italy
- 4Department of Anesthesia, Critical Care and Emergency, Fondazione IRCCS Ca’ Granda Ospedale Maggiore Policlinico, Milan, Italy
- 5Department of Anesthesia and Intensive Care Medicine, Niguarda Ca’ Granda, Milan, Italy
Non-carbonic buffer power (βNC) of blood is a pivotal concept in acid-base physiology as it is employed in several acid-base evaluation techniques, including the Davenport nomogram and the Van Slyke equation used for Base excess estimation in blood. So far, βNC has been assumed to be independent of metabolic acid-base status of blood, despite theoretical rationale for the contrary. In the current study, we used CO2 tonometry to assess βNC in blood samples from 10 healthy volunteers, simultaneously analyzing the electrolyte shifts across the red blood cell membrane as these shifts translate the action of intracellular non-carbonic buffers to plasma. The βNC of the blood was re-evaluated after experimental induction of metabolic acidosis obtained by adding a moderate or high amount of either hydrochloric or lactic acid to the samples. Moreover, the impact of βNC and pCO2 on the Base excess of blood was examined. In the control samples, βNC was 28.0 ± 2.5 mmol/L. In contrast to the traditional assumptions, our data showed that βNC rose by 0.36 mmol/L for each 1 mEq/l reduction in plasma strong ion difference (p < 0.0001) and was independent of the acid used. This could serve as a protective mechanism that increases the resilience of blood to the combination of metabolic and respiratory acidosis. Sodium and chloride were the only electrolytes whose plasma concentration changed relevantly during CO2 titration. Although no significant difference was found between the electrolyte shifts in the two types of acidosis, we observed a slightly higher rate of chloride change in hyperchloremic acidosis, while the variation of sodium was more pronounced in lactic acidosis. Lastly, we found that the rise of βNC in metabolic acidosis did not induce a clinically relevant bias in the calculation of Base excess of blood and confirmed that the Base excess of blood was little affected by a wide range of pCO2.
Introduction
In human blood, two classes of buffers limit pH fluctuations in response to an acid load: the bicarbonate buffer system and the non-carbonic buffers. The latter consist of plasma proteins, phosphate, and, most importantly, hemoglobin inside the red blood cells—RBC (Van Slyke, 1922). While both classes of buffers act in metabolic acid-base disorders, only the non-carbonic buffers limit pH changes in respiratory derangements (Giebisch et al., 1955). To illustrate this fact, consider a case of respiratory acidosis, where the accumulation of CO2 shifts the H2CO3/HCO3− equilibrium towards HCO3− production and H+ release. It is evident that HCO3− cannot buffer H+ released in this context. Consequently, as bicarbonate does not play a role in buffering of respiratory disorders, the ability of blood to resist respiratory derangements should not be altered in metabolic acidosis, a condition that is characterized by a reduced concentration of bicarbonate but preserved concentration of non-carbonic buffers.
The principle of independence between [HCO3−] and non-carbonic buffering is used in the traditional Davenport [HCO3−]/pH diagram (Davenport, 1958). In this diagram, two classes of isopleths can be observed: ascending convex curves representing titration by a strong acid or base at fixed pCO2, and descending lines representing titration by CO2 at a fixed metabolic acid-base status. Notable characteristics of the latter are that for a given composition of non-carbonic buffers, that determines their slope, they are all linear and parallel; and that their displacement along the [HCO3−] axis corresponds to the metabolic acid-base status of the sample. However, Siggaard-Andersen has shown experimentally that these lines are, in fact, convex curves, and theoretically, they converge towards the acid side. Despite that, he concluded that “as an approximation, we can assume the pH, [HCO3−] equilibration curves to be linear and parallel and the slope to vary linearly with hemoglobin concentration” (Siggaard-Andersen, 1974).
Nowadays, the Base excess of whole blood [BE(B)], calculated with the Van Slyke equation, is used to assess the metabolic acid-base status of blood (Siggaard-Andersen, 1977; CLSI, 2009). This equation includes the non-carbonic buffer power of blood (βNC), which represents the slope of the [HCO3−]/pH curve during CO2 equilibration (Van Slyke, 1922; Brown and Clancy, 1965; Michel et al., 1966). The assumption of no interaction between metabolic acid-base disorders, that alter [HCO3−], and βNC is reflected in the Van Slyke equation by the fact that βNC depends only on hemoglobin concentration (Hb, expressed in g/dl):
βNC is used together with the actual bicarbonate of the sample ([HCO3−]act, expressed in mmol/L) to calculate plasma [HCO3−] that would be present if pH of 7.4 were achieved by altering pCO2. This value is known as Van Slyke standard bicarbonate—VSSB (Siggaard-Andersen, 1974; Wooten, 2003):
At the pH of 7.4, the proportion of dissociated non-carbonic buffers is constant as determined by the difference between pKa of each buffer and pH. Therefore, any difference between VSSB and the normal [HCO3−] of 24.4 mmol/L can only be explained by the presence of a nonvolatile acid or base. Finally, this difference is multiplied by a factor that compensates for the fact that at the pH of 7.4 [HCO3−] inside RBC changes slightly less than in plasma:
Manipulation of pCO2 in blood is accompanied by electrolyte shifts across the RBC membrane, a phenomenon known as the chloride shift or Hamburger effect (Warburg, 1922; Van Slyke et al., 1923; Giebisch et al., 1955; Langer et al., 2015). It can be shown (see Supplementary Text Part I) that these shifts are an essential condition that allows the intracellular buffers to act upon plasma, and can, therefore, be regarded as a proxy for the action of the intracellular buffers.
The experiments investigating the effect of metabolic acid-base status on βNC (Siggaard-Andersen, 1974) were carried out before the development of direct pCO2 electrodes (Astrup and Severinghaus, 1986). The technique of indirect pCO2 determination is lengthy and inevitably leads to some degree of error due to ongoing cell metabolism. Moreover, it allowed βNC calculation from only few points of pH/[HCO3−] curve. Nowadays, the acid-base analyzers allow determining βNC with higher precision and consistency. In light of this, we decided to perform this in-vitro study to 1) quantify βNC under normal conditions and during experimental metabolic acidosis—hyperchloremic and lactic, 2) describe the associated electrolyte shifts, and 3) evaluate possible implications for the calculation of Base excess.
Materials and methods
This in-vitro experimental study was carried out at the Department of Intensive Care of Policlinico di Milano, Italy. Ten volunteers with no record of hematologic or metabolic diseases were recruited from the Intensive Care Unit staff after administration of written informed consent. The number of enrolled subjects was chosen arbitrarily because no estimate of the expected change of βNC was available to perform an a-priori power analysis.
Blood collection and sample handling
Venous blood was sampled for laboratory analysis of complete blood count, albumin, and phosphate. Further 24 ml were collected in lithium-heparin tubes for βNC analysis. This blood was transferred into a single syringe to ensure homogeneity, and a baseline blood-gas analysis was performed. Then, the blood was split into five 4-ml aliquots and cooled down to 4°C to halt cell metabolism and lactate production.
Stock solutions
Five stock solutions were prepared to experimentally induce metabolic acidosis by increasing the strong ion difference (SID) of the blood aliquots and reducing their [HCO3−]. These solutions were prepared by combining normal saline, hydrochloric acid (HCl), L-(+)-lactic acid (HLac), sodium hydroxide, and distilled water. Their composition is reported in Supplementary Table S1. To minimize potential transmembrane shifts of water caused by perturbation of osmolarity, the solutions were tailored to have [Na+] similar to plasma. The stock solutions were designed in such a way that adding approximately 200 µl into 4 ml of blood should either:
1. Have a minimum impact on SID and [HCO3−]—control (Ctr)
2. Increase [Cl−], and decrease SID and [HCO3−] by 7.5 mEq/L—moderate hyperchloremia (Cl 7.5)
3. Increase [Lac−], and decrease SID and [HCO3−] by 7.5 mEq/L—moderate lactatemia (Lac 7.5)
4. Increase [Cl−], and decrease SID and [HCO3−] by 15 mEq/L—severe hyperchloremia (Cl 15)
5. Increase [Lac−], and decrease SID and [HCO3−] by 15 mEq/L—severe lactatemia (Lac 15)
As blood can be viewed as a two-compartment system, the expected plasma SID change is dependent on three factors: the volume and concentration of the acid added, the volume of the plasma phase, and the proportion of the acid that is transferred into RBC. In order to achieve the desired shift in plasma SID, we calculated the required volume of the stock solutions for each volunteer individually using the hemoglobin concentration from the initial blood gas analysis and the standard mean cell hemoglobin concentration of 33 g/dl. We assumed that 70% of the acid added remains in plasma as determined by a series of preliminary experiments (data not shown). All aliquots of each volunteer were diluted by the same volume, ensuring that all blood components that may possibly affect acid-base, such as hemoglobin and plasma proteins, were diluted equally.
βNC assessment
To measure βNC, we used the method of CO2 tonometry coupled with repetitive blood-gas analyses, as previously described elsewhere (Langer et al., 2021). Each aliquot was diluted with one of the stock solutions, drawn into a pretreated anti-foam syringe (T310, RNA Medical, United States), and placed into a CO2 tonometer (EQUILibrator, RNA Medical, United States) for 12 min, where they were heated to 37°C and oxygenated to >92% using custom-made gas mixtures containing 21% O2 and either 2% or 20% CO2. The same gas mixtures were then used to manipulate pCO2 of each aliquot in the range of 20–120 mmHg. Throughout the experiment, pH, pCO2, and concentration of main electrolytes were analyzed repeatedly using a point-of-care blood-gas analyzer (ABL90, Radiometer, Denmark), obtaining at least 10 data points for each aliquot.
The possible confounding effect of hemolysis, resulting from mechanical and thermal stress during the CO2 tonometry, was found to be negligible in preliminary experiments as the median percentage of hemolyzed RBC was less than 1% (for further details, see Supplementary Text Part II). Other confounders that commonly affect acid-base physiology (e.g., renal failure, administration of i.v. fluids, hypoalbuminemia, ketoacidosis, etc.) were excluded in our experimental setting.
Definitions and calculations
The buffer power of a simple buffered solution is pH-dependent. Although this dependency is attenuated in the case of the complex buffer mixture present in human blood (Van Slyke, 1922), a representative pH value for performing the calculations had to be chosen. We decided to use the value of 7.2, rather than the more common 7.4, to guarantee that the analyses would be performed in a pH range explored during the experiments.
We used the following formula for estimation of SID (in mEq/l):
where the terms in square brackets denote the concentration (in mmol/L) of the appropriate ion or molecule. [Mg2+] was not included in the SID calculation as the blood gas analyzer did not directly measure it. The concentration of bicarbonate was calculated as:
where the pCO2 stands for partial pressure of CO2 expressed in mmHg, S = 0.0307 mmol/L/mmHg represents CO2 solubility in plasma, and pK1′ = 6.095 represents the negative logarithm of the apparent first dissociation constant of carbonic acid in blood (CLSI, 2009).
To quantify the metabolic acid-base status of the blood aliquots, we defined SID7.2 as SID present when the pH of 7.2 is achieved by pCO2 manipulation. To cope with the fact that achieving a prespecified pH value is not possible during CO2 tonometry and to minimize the accumulation of measurement errors, SID7.2 was obtained by interpolation from all SID and pH pairs of the given aliquot. Accuracy of the collected data was assessed by correlating SID and [HCO3−] at the pH of 7.2 in the aliquots of each volunteer - see Supplementary Text Part III.
βNC and the electrolyte transfers
A second-order polynomial (to account for both the convexity and convergence of the curves) was fitted through the pH and [HCO3−] data points of each aliquot. The goodness of fit was assessed using the Root mean square error (RMSE). Curves with high RMSE defined using Tukey’s outlier detection method were excluded. βNC was then calculated as the negative of the first derivative of the fitted polynomial at the pH of 7.2:
The change of [HCO3−], and hence also βNC, is determined by the buffer action of plasma weak acids and the electrolyte shifts that transfer the action of intracellular buffers to plasma. To quantify these shifts, the process of curve fitting and goodness-of-fit assessment was repeated for pH vs. [Na+], [K+], [Cl−], and [Lac−]. For each electrolyte, the rate of change of its concentration in relation to pH was calculated by substituting d[Na+], d[K+], -d[Cl−], and -d[Lac−] for d[HCO3−] in Eq. 6. A representative value of βNa, βK, βCl, and βLac was calculated for pH of 7.2.
The effect on BE(B)
Our experiments allowed us to test three attributes crucial for BE(B) calculation and applicability: 1) the accuracy of βNC derived from hemoglobin concentration, 2) the proportionality between the amount of acid added through the stock solutions and the fall of BE(B), and 3) the pCO2 invariance of BE(B).
First, the measured βNC at the pH of 7.2 was compared with βNC calculated using Eq. 1 in each group of aliquots. Second, BE(B) was calculated in all blood-gas analyses according to Eqs. 1–3. For each aliquot, a representative value at pCO2 of 40 mmHg [BE(B)VanSlyke] was obtained by interpolation from all BE(B) and pCO2 pairs due to the same reasons that were mentioned for SID7.2. This value was compared with the true change of Base excess [ΔBE(B)true] determined from the amount of acid added experimentally through the stock solutions:
where Vdil, expressed in liters, refers to the volume of the added stock solution, 0.004 L is the volume of blood aliquots, and ΔSID is the difference between SID of the stock solution used and the control stock solution (see Supplementary Table S1). Finally, the pCO2-induced variation of BE(B) was evaluated by plotting BE(B) of every single blood-gas analysis against pCO2. To account for substantial baseline differences, we used a normalized value [BE(B)norm] obtained by subtracting BE(B)VanSlyke of the corresponding aliquot from individual BE(B) values.
Statistical analysis
The data collected by the blood gas analyzer were exported into a spreadsheet that was handled in Microsoft Excel 365. Descriptive statistics, curve interpolation, and β calculation were done using GraphPad Prism 8.0.1. Analysis of the relationship between metabolic acid-base status of the aliquots and βNC as well as β of individual electrolytes was performed using R software, version 4.2.0 (R Core Team, 2022; RStudio Team, 2022). We used a linear mixed effect model (LMEM) with random intercept (individual ID). SID7.2, acid type, and their interaction were considered fixed effects. The superiority of the model with or without the interaction between SID7.2 and acid type was evaluated by the likelihood-ratio test. The results are reported as mean ± SD or median [1Q—3Q], as appropriate. p value < 0.05 was considered statistically significant.
Results
Ten volunteers (aged 30 ± 5 years, 5 females) were enrolled. Prior to any manipulation, blood hemoglobin was 14.6 ± 1.4 g/dl, serum albumin was 5.0 ± 0.3 g/dl, serum phosphate was 3.5 ± 0.2 g/dl, and plasma SID was 43.0 ± 2.4 mEq/L. Five aliquots were created for each subject by adding between 171 and 191 µl of the stock solutions. The resulting composition is reported in in Table 1 and Supplementary Figure S1, where it is evident that the shift in SID was achieved almost exclusively by manipulating [Cl−] or [Lac−], as desired.
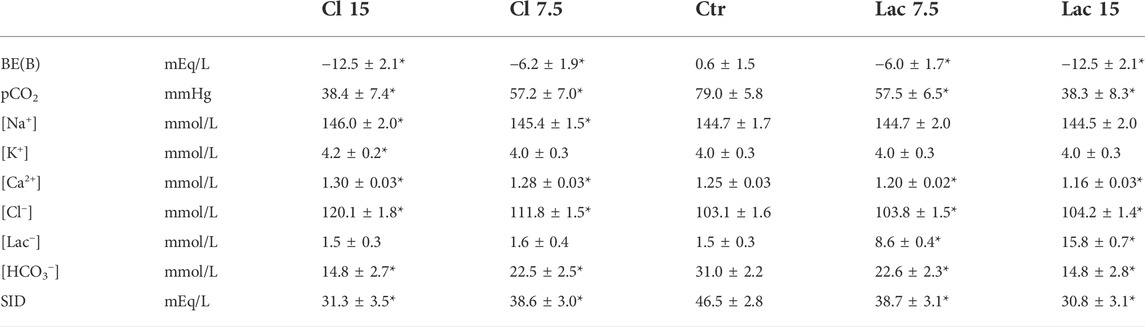
TABLE 1. Characteristics of blood aliquots treated with the stock solutions. As most of the parameters change during the CO2 tonometry, values obtained by interpolation for pH = 7.2 are reported. Statistically significant difference from Ctr is marked by an asterisk (*).
CO2 tonometry of all aliquots was performed as described. The time elapsed between the first and last blood gas analysis of each aliquot was 14 [13–16] min, during which [Lac−] increased by 0.3 [0.1–0.5] mmol/L, and [K+] rose by 0.3 [0.3–0.4] mmol/L.
βNC
Five aliquots (10%) were excluded from the analysis due to bad fit of the interpolated polynomial. All [HCO3−]/pH data points of the remaining aliquots are shown in Figure 1. Graphs that display data points of each volunteer separately and contain all the interpolated curves, including the eliminated ones, are presented in Supplementary Figure S2.
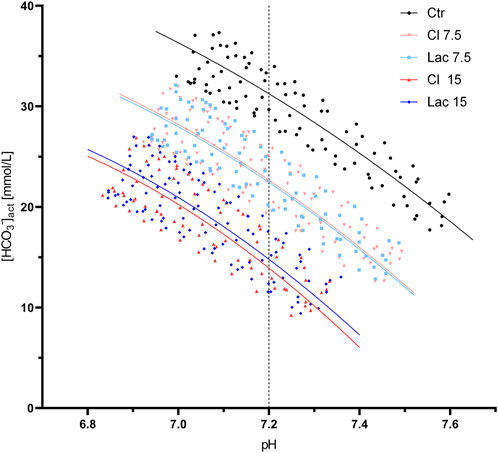
FIGURE 1. All valid pH/[HCO3−] data points obtained during the CO2 tonometry of the aliquots treated with the different stock solutions. Best-fit quadratic regression curve is shown for each group of aliquots. The pH of 7.2, at which βNC was calculated, is marked by a dashed line.
βNC, calculated at the pH of 7.2, was 28.0 ± 2.5 mmol/L in the control aliquots and increased to 30.6 ± 2.6 mmol/L and 33.8 ± 3.3 mmol/L in Cl 7.5 and Cl 15, respectively. Similarly, βNC increased after the induction of experimental lactic acidosis to 30.4 ± 2.6 mmol/L and 33.5 ± 2.8 mmol/L for Lac 7.5 and Lac 15, respectively.
Statistical significance of the observed change of βNC was assessed using the described LMEM, for which the degree of metabolic acidosis was expressed quantitatively by means of SID7.2 (Figure 2A). The interaction between acid type and SID7.2 was not significant (p = 0.79). This means that the type of acid did not affect the slope of βNC vs. SID7.2 and this interaction was removed from the model. The simplified model showed that the increase of βNC in metabolic acidosis was significant (p < 0.001) with a rate of 0.36 mmol/L per 1 mEq/L decrease of SID7.2 and that the type of acid had no effect on βNC (p = 0.37), regardless of SID7.2 (Figure 2B).
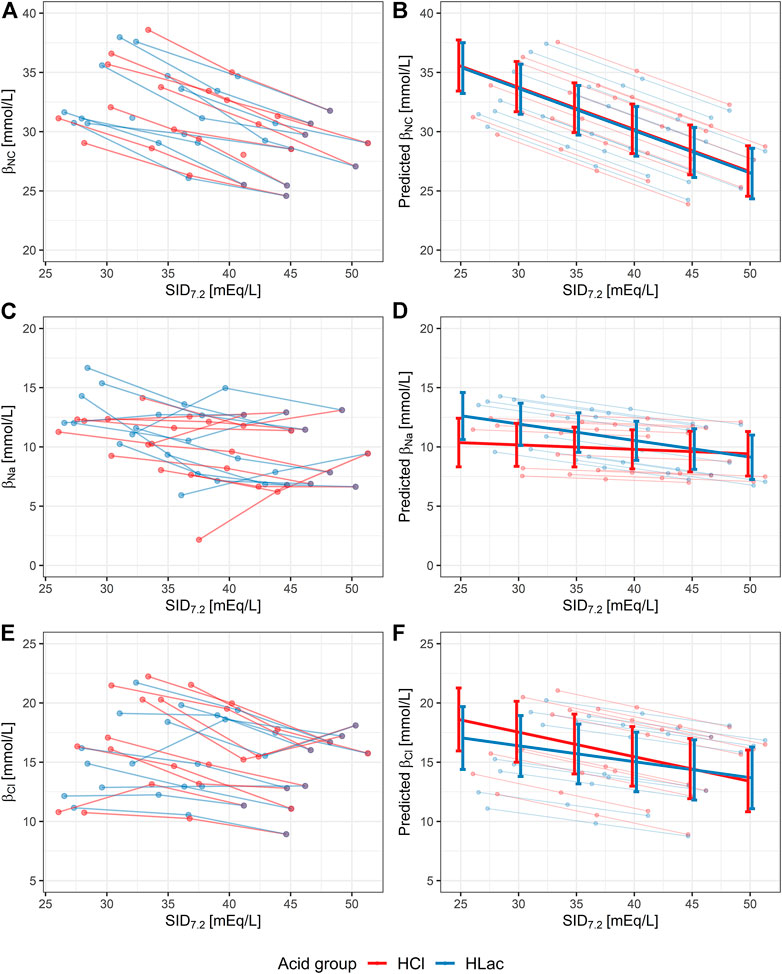
FIGURE 2. Noncarbonic buffer power (βNC) and non-carbonic buffer power due to change of [Na+] and [Cl−] (i.e., βNa and βCl) in aliquots with varying degrees of hyperchloremic (red) or lactic (blue) metabolic acidosis, characterized quantitatively by a reduction in SID7.2. The lines connect the aliquots treated with one type of acid and the control aliquot of each volunteer. Aliquots that were excluded due to bad fit of the interpolated curve are not shown. (A,C and E) Original data. (B,D and F) Results of linear mixed-effect model with random intercept (individual ID) showing 95% confidence intervals. SID7.2, acid type, and their interaction were considered fixed effects. In the case of βNC, the model was simplified by removing the fixed effect of interaction between the acid type and SID7.2.
The contribution of individual ions
The number of aliquots excluded from analysis due to bad fit was 1 for βNa, 1 for βK, 0 for βCl, and 7 for βLac. Over the studied pCO2 range (i.e., during the transition from 20 to 120 mmHg), [Na+] increased by 4.7 ± 1.3 mmol/L, [K+] increased by 0.1 ± 0.3 mmol/L, [Cl−] fell by 7.1 ± 1.7 mmol/L, and [Lac−] fell by 0.3 ± 0.3 mmol/L on average in all aliquots. In the control aliquots at the pH of 7.2, βNa was 9.9 ± 2.7 mmol/L, βK was 0.15 ± 0.57 mmol/L, βCl was 14.1 ± 3.1 mmol/L, and βLac was 0.24 ± 0.75 mmol/L.
The effect of metabolic acidosis, quantified using SID7.2, on βNa and βCl is shown in Figures 2C,E. In both cases, the LMEM showed that the interaction between the acid type and SID7.2 was not significant (p = 0.09 and p = 0.07 for βNa and βCl, respectively). In other words, the slope of βNa vs. SID7.2 and βCl vs. SID7.2 did not differ in the two types of acidosis. Nevertheless, we decided to keep this interaction in the model because of physiological plausibility of such observation and proximity of the p values to the threshold of significance.
According to LMEM, βNa increased in lactic acidosis (p = 0.002, rate: 0.14 mmol/L per 1 mEq/L decrease of SID7.2) but did not change in hyperchloremic acidosis (p = 0.40), as shown in Figure 2D. βCl increased significantly both in hyperchloremic acidosis (p < 0.001, rate: 0.21 mmol/L per 1 mEq/L decrease of SID7.2) and lactic acidosis (p < 0.001, rate: 0.14 mmol/L per 1 mEq/L decrease of SID7.2), as shown in Figure 2F.
The changes in [K+] and [Lac−], that determine βK and βLac, are negligible and are not affected by either SID7.2, the type of acid, or their interaction (Supplementary Figure S3).
The effect on BE(B)
Having demonstrated a significant increase of βNC in metabolic acidosis, we proceeded to analyze its relevance for bedside acid-base diagnostics, i.e., the degree of bias it introduces into the calculation of BE(B). No aliquots were excluded from the following analyses.
In control aliquots, βNC calculated according to the formula used in Van Slyke equation (Eq. 1) had a good agreement with the measured value at the pH of 7.2, while it systematically underestimated the measured βNC in all samples with induced metabollic acidosis (Figure 3). The slope of the regression line, constrained as shared between volunteers, of BE(B)VanSlyke vs. ΔBE(B)true was 1.03 (95%CI: 1.01–1.05), i.e., slightly but significantly different from one (Figure 4A). The variation of BE(B) in response to pCO2 manipulation was small. The standard deviation of BE(B)norm was only 0.64 mmol/L, and 93.8% of all blood-gas analyses were within the range of ±1 mmol/L from the BE(B) obtained at pCO2 of 40 mmHg (Figure 4B).
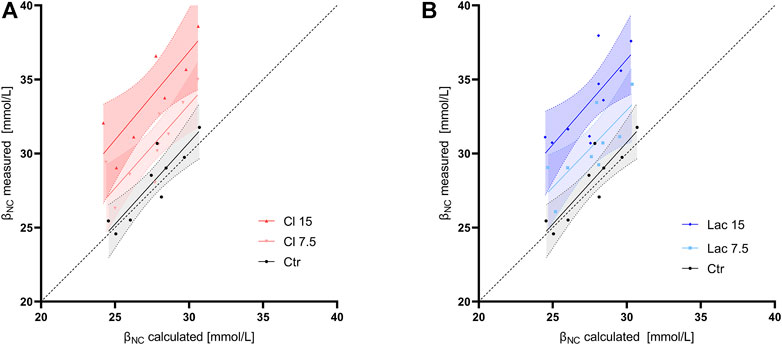
FIGURE 3. Noncarbonic buffer power calculated according to formula used in the Van Slyke equation (βNC calculated) vs. the value measured using CO2 tonometry at a pH of 7.2 (βNC measured). Linear regression line and its 95% confidence interval are shown for each group of aliquots. The dashed line is the line of identity. (A) The control aliquot and aliquots with induced hyperchloremic acidosis. (B) The control aliquot and aliquots with induced lactic acidosis.
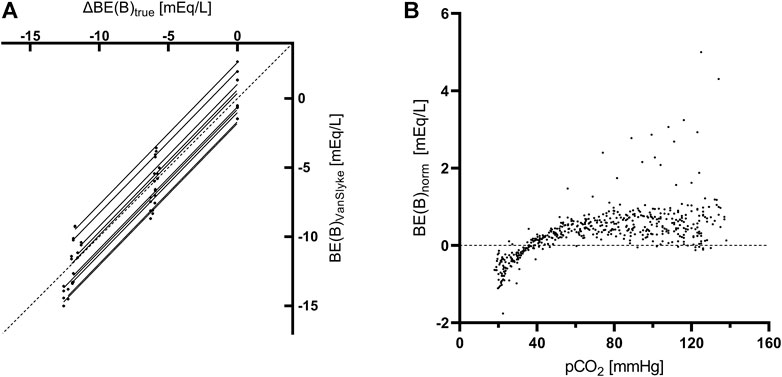
FIGURE 4. Analyses concerning the Base excess. (A) Linear regression of the true change of BE(B) determined from the amount and composition of the added stock solutions [ΔBE(B)true] vs. the value calculated using the Van Slyke equation [BE(B)VanSlyke] at pCO2 of 40 mmHg. Each aliquot is represented by 1 data point. The slope of the regression line was constrained as shared between volunteers and an individual regression line for aliquots of each volunteer is plotted. The dashed line is the line of identity. (B) Variance of normalized Base excess [BE(B)norm] due to pCO2 manipulations in whole blood. Each data point represents a single blood gas analysis.
Discussion
In this in-vitro study, we used CO2 tonometry to measure the non-carbonic buffer power of blood in healthy volunteers under normal conditions and after inducing experimental metabolic acidosis. Low [HCO3−], which accompanies metabolic acidosis, did not reduce the ability of blood to resist superimposed respiratory derangements. In fact, the exact opposite was true—βNC was increased in the state of metabolic acidosis proportionally to its severity and irrespective of its type. The observed change of βNC is in accordance with the theoretical prediction about the convergence of [HCO3−]/pH curves towards the acid side of the Davenport diagram (Siggaard-Andersen, 1974). This is because such convergence can only be observed if the curves representing pCO2 manipulation in metabolic acidosis, and thus positioned lower in the Davenport diagram, have a steeper slope and, therefore, higher βNC.
The action of intracellular non-carbonic buffers on plasma is possible due to transmembrane ion shifts: in response to the acidifying CO2 load, plasma SID increases mostly due to a reduction of [Cl−] in combination with a less prominent increase of [Na+]. In line, the Anion Exchanger 1, also known as Band 3 protein, responsible for Cl−/HCO3− antiport, is the most abundant transport protein in the RBC membrane (Mohandas and Gallagher, 2008; Romero et al., 2013; Jennings, 2021). It has been shown that the RBC membrane is almost impermeable to cations and that RBC take up plasma water and swell in response to increasing CO2 tensions (Warburg, 1922; Van Slyke et al., 1923; Jackson and Nutt, 1954; Siggaard-Andersen, 1974). These observations imply, that transfer of solute-free water, rather than Na+, explain the observed change of [Na+]. Therefore, βNa can be interpreted as a measure of free water transfer. We performed a post-hoc analysis using mean βNa, [Na+], and the estimated hematocrit of our samples to quantify the pCO2-induced change of hematocrit. Provided that βNa was explained solely by free water transfer, the mean RBC volume decreased by 10% when pH rose by 1 unit due to pCO2 manipulation. This result agrees reasonably well with a theoretical prediction (Van Slyke et al., 1923)—see Figure 2 of the referenced article.
Our data show that the rise in βNC is caused by an increased rate of ion and water transfer across the RBC membrane but do not provide a deeper insight into the underlying mechanism. We can hypothesize the following mechanisms or their combination:
• The allosteric effect of CO2, Cl− or Lac−. The hemoglobin molecule is well known to interact with CO2, but binding of Cl− and Lac− has also been described (Guesnon et al., 1979). This mechanism could also explain the observed trend towards higher βCl in hyperchloremic acidosis and more pronounced βNa, i.e., water transfer, in lactic acidosis. Note that the allosteric effect of O2 was excluded by achieving high oxygen saturation at the beginning of CO2 tonometry.
• The active role of the RBC membrane. The permeability of the membrane to various charged species may limit the degree to which the intracellular buffers affect plasma. In other words, the properties of the RBC membrane may adjust the way the buffer action of hemoglobin is partitioned between the intracellular and extracellular fluid.
• The effect of intracellular pH. Different combinations of pCO2 and SID that we applied to achieve the pH of 7.2 in plasma, may have induced a different pH inside RBC, which is known to affect the intracellular non-carbonic buffer power (Goldsmith and Hilton, 1992).
The changes of plasma [K+] in response to acute disturbances of the acid-base equilibrium have been studied thoroughly, yet are far from being fully understood. Historically, blood pH was believed to be the sole determinant of the magnitude of transmembrane K+ shift. Later, it was found that these shifts are small or even non-existent in acute respiratory disorders. Moreover, it has become accepted that the [K+] change may differ markedly depending on the type of metabolic acidosis (Adrogué and Madias, 1981). Our results can contribute to this topic by showing that acute respiratory derangements did not induce any measurable transfer of K+ across the RBC membrane as βK, defined as -d[K+]/dpH during CO2 tonometry, was negligible (Supplementary Figure S3A,B). When it is clear that [K+] in our aliquots remained stable during pCO2 manipulation, it can be inferred from Table 1 that neither type of metabolic acidosis induced a clinically relevant change of [K+] despite the considerable rise of plasma [Cl−] or [Lac−] of up to 15 mmol/L. This is particularly remarkable for hyperchloremic acidosis, which is often used as an example of acidosis that triggers K+ release from the cells (Mount, 2022). This discrepancy may be due to the fact that the movement of K+ during acute acid-base disorders is not uniform among various tissues (Adrogué and Madias, 1981).
Clinical implications
The observed changes in βNC potentially have relevant clinical implications. First, the presence of metabolic acidosis improves the ability of non-carbonic buffers to mitigate the decrease of pH in response to a superimposed respiratory acidosis. This may represent a protective mechanism against encountering a fatally low pH value should a metabolic and respiratory acidosis occur simultaneously. It should be noted, however, that increased βNC limits pH excursions in both directions equally. Therefore, the alkalizing effect of low pCO2, which defines the respiratory compensation, is attenuated as well.
Blood-gas analysis is a routine investigation in the acute care setting. In this context, βNC is used by the blood-gas analyzers to calculate the Base excess, a key marker of the metabolic component of acid-base disorders. The automated calculation of BE(B), that derives βNC value from hemoglobin concentration only, underestimated the actual βNC value in both types of metabolic acidosis we studied. Despite that, BE(B) accurately reflected the amount of nonvolatile acid added. Although the slope of BE(B)VanSlyke vs. ΔBE(B)true did differ significantly from one, the observed difference is clinically irrelevant and, in fact, confirms the reliability of BE(B) calculation. The impact of βNC on BE(B) calculation is, therefore, only minor, as suggested before (Langer et al., 2022). Importantly, BE(B) was independent of pCO2 to a great degree which is in line with similar tonometry experiments (Morgan et al., 2000).
We used BE(B) throughout this article as its definition matches our experimental setting of blood that is not equilibrated with the rest of the extracellular fluid. In clinical practice, however, the Base excess of extracellular fluid [BE(Ecf)], also known as Standard base excess (SBE), is a more precise parameter (Morgan, 2003; Langer et al., 2022). BE(Ecf) is computed similarly to BE(B) but uses a βNC value that is determined from the estimated average hemoglobin concentration in the extracellular fluid. In healthy volunteers, βNC for calculation of BE(Ecf) is, therefore, approximately one-third of the value used for BE(B). Consequently, the error introduced by variable βNC into the Van Slyke equation, which was already very little during the calculation of BE(B), would be even smaller in the case of BE (Ecf).
Limitations
The in-vitro nature of our study is clearly a limitation. While it allowed us to focus on buffering and exclude the confounding effects of other mechanisms that contribute to acid-base homeostasis (e.g., pulmonary and renal compensation), it prevented us from investigating the interaction between plasma and the rest of extracellular fluid, which is an important process in-vivo.
The action of intracellular buffers was only assessed using a proxy variable, meaning that the effect of pCO2 manipulation on intracellular -d[HCO3−]/dpH was not studied. Moreover, we neglected the possible binding of plasma ions to albumin (Halle and Lindman, 1978; Fogh-Andersen et al., 1993; Staempfli and Constable, 2003), assuming that the electrolyte and water shifts are the sole mechanism responsible for the observed changes of plasma electrolytes. Finally, we did not measure the hematocrit in relation to pH or pCO2 to confirm that βNa represents electrolyte-free water shifts rather than transfers of Na+.
The sample size was rather small. Nevertheless, clear results were obtained for the main quantity of our interest, βNC, thanks to the repeated-measures design of our study and high precision of pH and pCO2 measurement.
Excluding aliquots from analysis due to bad fit of the interpolated curves could have limited the observed physiological variability. We believe, however, that the process was justified. In the case of βNC, three of the five eliminated aliquots represent a series of 31 consecutive blood-gas measurements during which the built-in quality control mechanisms of the analyzer detected abnormal results as well. All seven curves not included in βLac analysis belonged to the Lac 15 group. The usual precision of [Lac−] measurement was up to one decimal, but values higher than 15 mmol/L were rounded to the nearest integer. In some aliquots, this led to random oscillations between two values that did not represent the possible transfer of lactate across the RBC membrane.
Conclusion
Blood aliquots with metabolic acidosis have an increased βNC, that, if confirmed in-vivo, may be an important mechanism that limits pH excursions caused by superimposed respiratory derangements. Although the formula employed in BE(B) calculation systematically underestimates βNC in metabolic acidosis, this effect does not translate into BE(B) calculation in a way, that could be clinically relevant.
Data availability statement
The original contributions presented in the study are included in the article/Supplementary Material, further inquiries can be directed to the corresponding author.
Ethics statement
Ethical review and approval was not required for the study on human participants in accordance with the local legislation and institutional requirements. The patients/participants provided their written informed consent to participate in this study.
Author contributions
TL posed the research question. MK, FZ, SB, FD, and TL designed the study. MK, FZ, SB, and AZ organized the study, recruited the volunteers and performed the experiments. MK and PW performed the statistical analysis. MK wrote the manuscript. PW, SB, FZ, AZ, FD, and TL assisted with the manuscript preparation and reviewed it.
Funding
This study was supported by institutional funds (Italian Ministry of Health, Current Research IRCCS) of the Fondazione IRCCS Ca’ Granda Ospedale Maggiore Policlinico Milan, Italy; and by Charles University, Czech Republic, project GA UK No. 1004120.
Conflict of interest
The authors declare that the research was conducted in the absence of any commercial or financial relationships that could be construed as a potential conflict of interest.
Publisher’s note
All claims expressed in this article are solely those of the authors and do not necessarily represent those of their affiliated organizations, or those of the publisher, the editors and the reviewers. Any product that may be evaluated in this article, or claim that may be made by its manufacturer, is not guaranteed or endorsed by the publisher.
Supplementary material
The Supplementary Material for this article can be found online at: https://www.frontiersin.org/articles/10.3389/fphys.2022.1009378/full#supplementary-material
References
Adrogué H. J., Madias N. E. (1981). Changes in plasma potassium concentration during acute acid-base disturbances. Am. J. Med. 71, 456–467. doi:10.1016/0002-9343(81)90182-0
Astrup P., Severinghaus J. W. (1986). The history of blood gases, acids and bases. JAMA 257, 389. doi:10.1001/jama.1987.03390030119036
Brown E. B., Clancy R. L. (1965). In vivo and in vitro CO2 blood buffer curves. J. Appl. Physiol. 20, 885–889. doi:10.1152/jappl.1965.20.5.885
CLSI (2009). Blood gas and pH analysis and related measurements (CLSI document C46-A2). 2nd Edn. Wayne, PA: Clinical and Laboratory Standards Institute.
Davenport H. W. (1958). The ABC of acid-base chemistry: The elements of physiological blood-gas chemistry for medical students and physicians. 4th Edn. Chicago: University of Chicago Press.
Fogh-Andersen N., Bjerrum P. J., Siggaard-Andersen O. (1993). Ionic binding, net charge, and Donnan effect of human serum albumin as a function of pH. Clin. Chem. 39, 48–52. doi:10.1093/clinchem/39.1.48
Giebisch G., Berger L., Pitts R. F., Parks M. E., MacLeod M. B. (1955). The extrarenal response to acute acid-base disturbances of respiratory origin. J. Clin. Invest. 34, 231–245. doi:10.1172/JCI103076
Goldsmith D. J. A., Hilton P. J. (1992). Relationship between intracellular proton buffering capacity and intracellular pH. Kidney Int. 41, 43–49. doi:10.1038/ki.1992.6
Guesnon P., Poyart C., Bursaux E., Bohn B. (1979). The binding of lactate and chloride ions to human adult hemoglobin. Respir. Physiol. 38, 115–129. doi:10.1016/0034-5687(79)90031-8
Halle B., Lindman B. (1978). Chloride ion binding to human plasma albumin from chlorine-35 quadrupole relaxation. Biochemistry 17, 3774–3781. doi:10.1021/bi00611a016
Jackson D. M., Nutt M. E. (1954). The effect of carbon dioxide on relative red cell volume. J. Physiol. 123, 367–376. doi:10.1113/jphysiol.1954.sp005057
Jennings M. L. (2021). Cell physiology and molecular mechanism of anion transport by erythrocyte band 3/AE1. Am. J. Physiol. Cell. Physiol. 321, C1028–C1059. doi:10.1152/ajpcell.00275.2021
Langer T., Brusatori S., Carlesso E., Zadek F., Brambilla P., Ferraris Fusarini C., et al. (2021). Low noncarbonic buffer power amplifies acute respiratory acid-base disorders in patients with sepsis: An in vitro study. J. Appl. Physiol. 131, 464–473. doi:10.1152/japplphysiol.00787.2020
Langer T., Brusatori S., Gattinoni L. (2022). Understanding base excess (BE): Merits and pitfalls. Intensive Care Med. 48, 1080–1083. doi:10.1007/s00134-022-06748-4
Langer T., Scotti E., Carlesso E., Protti A., Zani L., Chierichetti M., et al. (2015). Electrolyte shifts across the artificial lung in patients on extracorporeal membrane oxygenation: Interdependence between partial pressure of carbon dioxide and strong ion difference. J. Crit. Care 30, 2–6. doi:10.1016/j.jcrc.2014.09.013
Michel C. C., Lloyd B. B., Cunningham D. J. C. (1966). The in vivo carbon dioxide dissociation curve of true plasma. Respir. Physiol. 1, 121–137. doi:10.1016/0034-5687(66)90011-9
Mohandas N., Gallagher P. G. (2008). Red cell membrane: Past, present, and future. Blood 112, 3939–3948. doi:10.1182/blood-2008-07-161166
Morgan T. J., Clark C., Endre Z. H. (2000). Accuracy of base excess—an in vitro evaluation of the van Slyke equation. Crit. Care Med. 28, 2932–2936. doi:10.1097/00003246-200008000-00041
Morgan T. (2003). “Standard base excess,” in Australasian anaesthesia 2003: invited papers and selected continuing education lectures. Editor J. Keneally, and M. Jones (Melbourne: Australian and New Zealand College of Anaesthetists), 95–104.
Mount D. B. (2022). “Causes and evaluation of hyperkalemia in adults,” in UpToDate, Editor T. W. Post (Waltham, MA: UpToDate). Available at: https://www.uptodate.com/contents/causes-and-evaluation-of-hyperkalemia-in-adults (Accessed July 15, 2022).
R Core Team (2022). R: A language and environment for statistical computing. Available at: https://www.r-project.org/.
Romero M. F., Chen A.-P., Parker M. D., Boron W. F. (2013). The SLC4 family of bicarbonate (HCO₃⁻) transporters. Mol. Asp. Med. 34, 159–182. doi:10.1016/j.mam.2012.10.008
RStudio Team (2022). RStudio: Integrated development environment for R. Available at: http://www.rstudio.com/.
Siggaard-Andersen O. (1977). The van Slyke equation. Scand. J. Clin. Lab. Invest. Suppl. 37, 15–20. doi:10.3109/00365517709098927
Staempfli H. R., Constable P. D. (2003). Experimental determination of net protein charge and Atot and Ka of nonvolatile buffers in human plasma. J. Appl. Physiol. 95, 620–630. doi:10.1152/japplphysiol.00100.2003
Van Slyke D. D. (1922). On the measurement of buffer values and on the relationship of buffer value to the dissociation constant of the buffer and the concentration and reaction of the buffer solution. J. Biol. Chem. 52, 525–570. doi:10.1016/s0021-9258(18)85845-8
Van Slyke D. D., Wu H., McLean F. C. (1923). Studies of gas and electrolyte equilibria in the blood. V. Factors controlling the electrolyte and water distribution in the blood. J. Biol. Chem. 56, 765–849. doi:10.1016/S0021-9258(18)85558-2
Warburg E. J. (1922). Studies on carbonic acid compounds and hydrogen ion activities in blood and salt solutions. A contribution to the theory of the equation of lawrence J. Henderson and K. A. Hasselbach: Chap. Xii. Biochem. J. 16, 307–340. doi:10.1042/bj0160307
Keywords: acid-base equilibrium, buffers, blood, metabolic acidosis, blood-gas analysis, base excess
Citation: Krbec M, Waldauf P, Zadek F, Brusatori S, Zanella A, Duška F and Langer T (2022) Non-carbonic buffer power of whole blood is increased in experimental metabolic acidosis: An in-vitro study. Front. Physiol. 13:1009378. doi: 10.3389/fphys.2022.1009378
Received: 01 August 2022; Accepted: 06 October 2022;
Published: 21 October 2022.
Edited by:
Chun Yang, Nanjing Medical University, ChinaReviewed by:
Prasanna Kumar Reddy Allu, United StatesIra Kurtz, University of California, Los Angeles, United States
Lingsha Ju, University of Florida, United States
Copyright © 2022 Krbec, Waldauf, Zadek, Brusatori, Zanella, Duška and Langer. This is an open-access article distributed under the terms of the Creative Commons Attribution License (CC BY). The use, distribution or reproduction in other forums is permitted, provided the original author(s) and the copyright owner(s) are credited and that the original publication in this journal is cited, in accordance with accepted academic practice. No use, distribution or reproduction is permitted which does not comply with these terms.
*Correspondence: František Duška, ZnJhbnRpc2VrLmR1c2thQGxmMy5jdW5pLmN6