 Mario Fleischer1*
 Stefanie Rummel2
 Fiona Stritt3,4
 Johannes Fischer4,5
 Michael Bock4,5
 Matthias Echternach6
 Bernhard Richter3,4
 Louisa Traser3,4
- 1Department of Audiology and Phoniatrics, Charité—Universitätsmedizin Berlin, Corporate Member of Freie Universität Berlin and Humboldt-Universität zu Berlin, Berlin, Germany
- 2Institut Rummel, Frankfurt, Germany
- 3Medical Center, Institute of Musicians’ Medicine, University of Freiburg, Freiburg, Germany
- 4Faculty of Medicine, University of Freiburg, Freiburg, Germany
- 5Medical Center, Department of Radiology, Medical Physics, University of Freiburg, Freiburg, Germany
- 6Department of Otorhinolaryngology, Ludwig-Maximilians-Universität München, Division of Phoniatrics and Pediatric Audiology, LMU Klinikum, Munich, Germany
Purpose: Concerning voice efficiency considerations of different singing styles, from western classical singing to contemporary commercial music, only limited data is available to date. This single-subject study attempts to quantify the acoustic sound intensity within the human glottis depending on different vocal tract configurations and vocal fold vibration.
Methods: Combining Finite-Element-Models derived from 3D-MRI data, audio recordings, and electroglottography (EGG) we analyzed vocal tract transfer functions, particle velocity and acoustic pressure at the glottis, and EGG-related quantities to evaluate voice efficiency at the glottal level and resonance characteristics of different voice qualities according to Estill Voice Training®.
Results: Voice qualities Opera and Belting represent highly efficient strategies but apply different vowel strategies and should thus be capable of predominate orchestral sounds. Twang and Belting use similar vowels, but the twang vocal tract configuration enabled the occurrence of anti-resonances and was associated with reduced vocal fold contact but still partially comparable energy transfer from the glottis to the vocal tract. Speech was associated with highly efficient glottal to vocal tract energy transfer, but with the absence of psychoactive strategies makes it more susceptible to noise interference. Falsetto and Sobbing apply less efficiently. Falsetto mainly due to its voice source characteristics, Sobbing due to energy loss in the vocal tract. Thus technical amplification might be appropriate here.
Conclusion: Differences exist between voice qualities regarding the sound intensity, caused by different vocal tract morphologies and oscillation characteristics of the vocal folds. The combination of numerical analysis of geometries inside the human body and experimentally determined data outside sheds light on acoustical quantities at the glottal level.
1 Introduction
Voice production is regulated by the vibrations of the vocal folds which are driven by the pressure generated by the respiratory system. The generated sound is modified by the resonance properties of the vocal tract (VT) (Titze, 1994). All three components can be controlled independently of each other to a certain extent, but at the same time are also subjected to interactions (Titze, 2008).
Humans can produce a wide variety of sounds characterized by objective acoustic measures such as the fundamental frequency (fo), the sound pressure level and the frequency content but also psychoacoustic properties such as pitch, loudness, vowel, projection, and timbre. In the western classical style of singing, aesthetic aspects are very closely linked to economic aspects of voice production, since it is necessary for the singer to be audible through an orchestra without technical amplification. In contrast, in contemporary commercial music (CCM), a considerably wide range of singing styles is used in an electronic orchestrated surrounding. Here, the comprehensibility of the lyrics and the emotional content of each voice quality plays an important role. In this context, a high degree of voice efficiency might be defined as a voice production mechanism that achieves a high vocal sound pressure level in relation to the energy and bio-mechanical properties that a singer expends. That depends on what the singer wants to achieve. Loud, soft, and neutral sounds, and thus, different degrees of voice efficiency may be produced voluntarily. Still, efficiency plays a crucial role for the singers’ vocal health in addition to the artistically intended sound.
Whether a voice production can be considered “efficient” is determined by the adjustments of the pulmonary, the laryngeal, and the vocal tract system and their interactions. Singers of all genres often sing for several hours, e.g., the CCM industry (Zuim et al., 2021). The vocal effort can lead to increased biomechanical stress and thus to voice disorders when the voice production system is not used efficiently (Czerwonka et al., 2008; Hirosaki et al., 2021).
In western classically trained singing, efficient voice production is associated with the so-called “flow phonation”. Flow phonation shows an increase in the amplitude of vocal fold vibration with a reduction of the glottal resistance and an increase in maximum flow declination rate and thus higher spectral energy (Sundberg, 2015).
In general, efficient voice production amplifies the acoustic power in a region of the sound spectrum sensitively perceived by the auditory system and thus produces a higher vocal sound pressure level. That is known as the singing formant according to Sundberg (1974) (later denoted as singers’ formant cluster (Sundberg, 2015)). An increase in sound pressure level for western classical-style singing is often associated with a low vertical laryngeal position, elongated vocal tract and widening of lip, jaw, and pharynx (Echternach et al., 2014a) as well as narrowing the epilarynx tube (Mainka et al., 2021) especially for male and lower female voices. Yanagisawa et al. (1989) also described an increase in sound pressure level reasoned by an aryepiglottic constriction for different voice production types. A narrow epilarynx tube might also be needed for stable vocal fold vibration when the subglottic pressure increases with sound pressure level (Titze and Story, 1997). This is in contrast to Soprano singing where Mainka et al. (2021) found no correlation between the epilarynx tube volume and the sound pressure level. Generally here, the vocal tract is shorter, the hypopharynx more narrow and the lip opening wider (Köberlein et al., 2021). Sound pressure level can be increased here by aligning the resonance maxima of the vocal tract to partials or the fundamental frequency (known as “tuning”; see Joliveau et al. (2004)). That tuning mechanism was found at frequencies until F6 (1.4 kHz) in classically trained sopranos (Köberlein et al., 2021).
While economic aspects of Western classical voice productions are better understood, the diverse phonation types used in CCM are not investigated in the same way regarding voice efficiency. For such consideration, a definition of sub-classifications is necessary as no widely accepted classification of voice production types exists.
One possible approach is the division according to the adjustment of the vocal tract, which follows one of three fundamentally different strategies according to Titze et al. (2017). A neutral “speech-like” vocal tract configuration (third group) is differentiated from a “megaphone shaped” (second group) vocal tract with a narrowing of the hypopharyngeal part with increased mouth and jaw opening (following the shape of a megaphone or a horn) (Saldias et al., 2019; Echternach et al., 2014a; Saldías et al., 2021). The “megaphone shaped” vocal tract is found in singing qualities called Belting or Twang used on Broadway and in CCM. A similar configuration for very high-pitched female classical singing (e.g., in the third octave
The first group (“inverted-megaphone” shape) is characterized by a widened oropharynx and hypopharynx coinciding with a moderately opened mouth. This configuration is part of the western classical style of singing. Since the oropharyngeal adjustment exerts a crucial influence on the spoken vowel in differentiating between singing styles, vowel selection is important (Titze et al., 2017).
Concerning efficiency considerations, only limited data is available to date. Very few studies allow intra-individual comparison of these subgroups. In contrast to western style classical singing at the same pitch, for Belting, the vocal tract is described to be shorter and more narrow in the hypopharyngeal area, while the opening of the mouth increased in a single subject experiment in 2D MRI data (Echternach et al., 2014a).
In another single-subject study, Belting had the highest proportion of high-frequency energy in the spectrum, followed by the operatic style, and then by the ordinary speech (Stone et al., 2003). However, there are also substantial similarities in vocal tract configuration between the hypopharyngeal narrowing with high larynx position in Belting and patients with hyper-functional muscle tension dysphonia which, however, exhibited a smaller mouth opening (Saldias et al., 2019).
For a direct comparison of different voice qualities, it would be advantageous to see if a singer could reproducibly retrieve these voice qualities across a large tonal range. While it is uncommon in classical voice training to practice completely different vocal styles equally, this is typical in modern vocal schools like Estill Voice Training®. Here singers strive to precisely control individual regulatory parameters of voice production, developing highly differentiated vocal skills. Singers aim to adjust 13 different anatomical parameters individually in different positions, e.g., the tongue position, lateralization of the ventricular folds, narrowing of the epilarynx tube, vertical larynx position, but also the vibrating forms of the vocal folds, and the different possibilities of the glottal closure and opening (Steinhauer et al., 2017). These parameters can be combined to different voice qualities in manifold ways. Seven voice qualities Speech, Falsetto, Sobbing, Nasal, and Oral Twang, Opera, Belting (and their variations) are then explicitly trained during the education program in various pitches according to the specifications originally introduced by Jo Estill as specified in the method section below. The program includes a standardized procedure: passing a standardized vocal exam, including spectral analysis, presentation of the course content, and a written exam on the theoretical background. Based on this concept, it is defensible to study these highly reproducible and different sound production strategies in one professional singer who has reached the highest qualification level in Estill Voice Training®. That has the advantage that morphometric differences between subjects cannot falsify the data.
The analysis of vocal tract acoustics is based on different technical methods. Whereas the emitted spectrum of a singer always carries mixed information about the voice source and the resonance properties, it is difficult to analyze the acoustic transfer characteristics of the isolated vocal tract. To overcome this limitation, analyses of vocal tract acoustics are based on the two- or three-dimensional segmentation of the cavities representing the vocal tract. These surface representations are derived from imaging methods such as magnetic resonance imaging (MRI) or computed tomography (CT), which then allows the derivation of the transfer function via simulation (Birkholz et al., 2020; Köberlein et al., 2021) or direct acoustic excitation after 3D printing (Fujita and Honda, 2005; Delvaux and Howard, 2014; Echternach et al., 2015; Traser et al., 2017; Fleischer et al., 2018). These techniques allow computation of the location and the level of the vocal tract resonances independently of the voice source. Yet, no measure is available that quantifies the efficiency of the vocal tract configuration in different types of voice production in this respect.
Another approach is the calculation of the impedance of the airways over a frequency range of vocalization. This measure quantifies the degree to which the airway assists or impedes the source in vibration (Titze, 2001) but requires the analysis of its complex frequency response.
The present work aims to compare the acoustic efficiency of the vocal tracts of different voice productions or singing styles defined according to Estill Voice Training® (Steinhauer et al., 2017) in one professionally trained singer for different pitch and vowel conditions.
For this purpose, we used volumetric vocal tract MRI data and audio signals to propose sound intensity at the glottis as a new measure. This is based on the numerically determined acoustic properties and the application of derived filters on a matching voice signal to assess voice efficiency. Based on these calculations, this study aims to quantify differences in the voice efficiency for different voice qualities and investigate correlations between volumetric data of the vocal tract, acoustic data, and electro-glottographic quantities.
Further, we will discuss our findings regarding voice pedagogic implications to raise awareness that specific voice qualities should be used with care. Not only in regards to artistic aspects but also to their efficiency, helping to avoid vocal overload.
2 Materials and methods
2.1 Data aquisition
The participant in this investigation was a professionally trained female singer and singing teacher, who reached the highest level of Estill Voice Training® certification (Estill Mentor Course Instructor).
This study was approved by the Medical Ethics Committee of the University of Freiburg (206/09). The participant gave informed consent prior to the investigation. This study was performed in accordance with all relevant guidelines and regulations.
Measurements were performed in a 3 T MRI system (PrismaFit, SiemensAG, Munich, Germany). To image the vocal tract a static MRI sequence was applied as described more in detail in Traser et al. (2017). We used a 3D gradient echo with a spatial resolution 1.6 mm×1.6 mm×1.3 mm, echo time 1.6 ms, repetition time 4.76 ms, flip angle 12°, bandwidth 300 Hz/Px, a matrix of 160×119, and a field-of-view of 260 mm×193 mm×62.4 mm. A whole 3D vocal tract scan took 9 s.
The singer was asked to sustain phonation in six different voice qualities (Speech, Falsetto, Sobbing, Oral Twang, Opera, Belting) as defined by Estill Voice Training®, for details see Steinhauer et al. (2017):
• Speech: voice quality as used during speaking or in Folk, Jazz or Pop with mid larynx position, wide aryepiglottic sphincter (AES), “thick” vocal folds (similar to modal register in other definitions) and mid position of ventricular folds
• Falsetto: breathy voice quality as used in soft/high harmonies of A cappella groups, early music, Folk, Jazz with mid larynx position, wide AES, “stiff” (abducted) vocal folds and mid position of ventricular folds. As defined for this study, Falsetto is not identical to the category used for register.
• Sobbing: dark voice quality similar to mourning as used in operatic pianissimo and Blues with low larynx position, wide AES, “thin” vocal folds (similar to head register in other definitions) and retracted ventricular folds
• Oral Twang: bright voice quality as used in country music with high larynx position, narrow AES, “thin” vocal folds and retracted ventricular folds
• Opera: voice quality as heard in Opera/Oratorio with low larynx position, narrow AES, “thin” and sometimes “thick” vocal folds and retracted ventricular folds.
• Belting: voice quality typically used in American musical theatre and Gospel music whenever it is loud or dramatic with a high larynx position, narrow AES and “thick” vocal folds and retracted ventricular folds
Voice qualities that require a pronounced opening of the velum, were not included (e.g., nasalized twang). Here according to Havel et al. (2021) a segmentation of the whole nasal system would be necessary.The participant was asked to sing in a supine body position and advised to choose the loudness according to the typical medium loudness for the respective voice quality. The tasks were first performed in A♭3 (G♯3, 208 Hz) on vowel /aː/ followed by A♭4 (G♯4, 415 Hz) vowel /aː/ and vowel /iː/. To support the singer in the performance as intended after Estill Voice Training®, we simultaneously recorded the voice using an MRI-compatible microphone (FOMRI I; MR Confon Magdeburg, Germany) which was displayed live as a spectrogram of the voice for real-time feedback on a monitor. The intense sound produced by the MRI and the acoustic environment preclude high-quality recordings during scanning. However, between and during the tasks, viewing the spectrogram was very helpful for the singer to maintain singing quality. Repetition of the tasks was possible.
In a second measurement, we asked the participant to perform the same tasks in a sound-treated room for high-quality audio and electroglottographic recordings (EGG, Glottal enterprises, Syracuse NY, United States, EG2-PCX2). In order to ensure the highest possible comparability with the MRI images, these recordings were also performed in the supine position. Before recording, the sound pressure level (Leq) calibration was performed by carefully matching a calibrated front microphone (calibrated by an 94 dB SPL calibrator device) to the used headset microphone (DPA 4066-OC-A-F00-LH beige, 4066 CORE Omni Headset, DPA Microphones, Inc., Longmont, CO, United States), for recording (see Ternström et al. (2018)). We placed the headset microphone 7 cm lateral of the center of the lips. For the implemented filtering technique (as described below), we extracted a part of stable phonation of the audio recording using Adobe Audition (CS6, Version 5.0, www.adobe.com). For plausibility purposes, we used manual inverse-filtering techniques to determine vocal tract resonance frequencies in the audio signal using the DeCap software (DeCap, v3.0.0.1, Granqvist et al. (2003)).
2.2 3D vocal tract model creation
The segmentation of MRI data, implementation of teeth models and preparation of the model for simulation was performed as described more in detail in Birkholz et al. (2020). Firstly, we interpolated the MRI data to a uniform voxel length of 0.35 mm. We further merged the boundary models of the maxilla and mandible (scanned via iTero scanning device (Aligne Technology, San Jose, CA), see Traser et al. (2017)) with the MRI data of the vocal tract shape. We positioned the meshes of the mandible and maxilla according to anatomic landmarks (e.g., tooth roots, palate shape, respecting the MRI data). Finally, we set the resulting voxels of the tooth models to a constant mid-level gray value. For all pre-processing steps we used the Software 3D Slicer (Fedorov et al. (2012), www.slicer.org).
High-resolution data from these pre-processing steps were the base for semi-automatical segmentations via ITKSNAP 3.8.0 (Yushkevich et al. (2006), http://www.itksnap.org). Here, we used the implemented active contour method to derive surface models for all MRI-data. Three physicians independently checked all surface models (co-authors SR, SF and LT), including manual fine control in unison (Figure 2).
The result of the segmentation process were surface representations of the air-filled, laryngo-, hypo-, and oro-pharyngeal cavities with an extension into the free space in front of the open mouth (see Figure 1). The bubble in front of the mouth opening was manually adapted using Meshmixer 3.5.474 (Autodesk® Inc. 2017; https://www.meshmixer.com) to a uniform bubble.
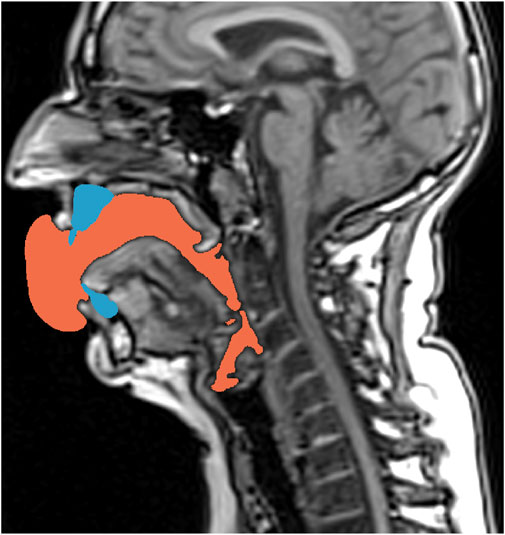
FIGURE 1. Exemplarily shown for Belting /aː/ (A♭3), the mid-sagittal slice of the MRI stack shows the air-filled cavities in black color. Additionally, the post-processed teeth models (blue) and the finally derived segmentation of the vocal tract cavity used in the FE calculation (orange)—considering the teeth not shown in the primary MRI data–are overlayed.
2.3 Derivation of volumetric data
To derive geometrical data from each vocal tract, we seperated each model into seven sub-volumes. The dissection procedure follows anatomical landmarks according to the following definition (see Figure 2).
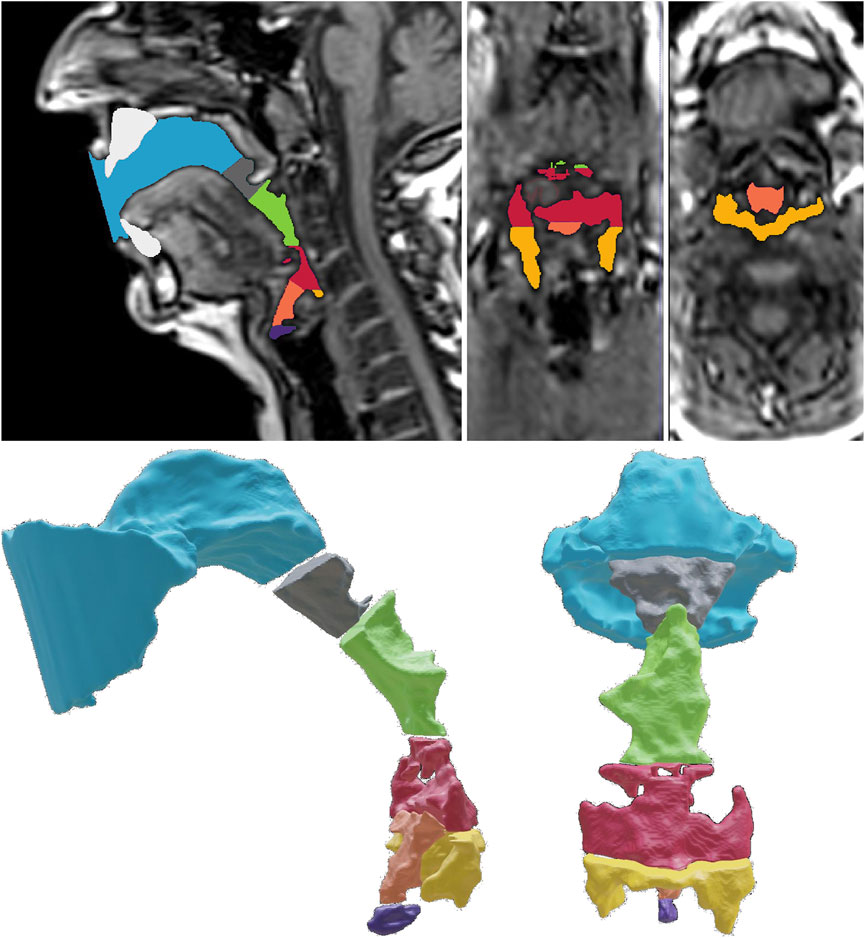
FIGURE 2. Definition of seven sub-volumes needed for the volumetric analysis of the sub-volumes (exemplarily shown for Belting /aː/ (A♭3). The upper row shows the mid-sagittal, coronal, and the transversal plane of the MRI data and the segmented cavities. The lower row shows the exploded view of the sub-volumes in the sagittal and coronal view. The blue color is used to highlight the oropharynx front (OPf), and the oropharynx rear (OPR) is shown in gray. The upper hypopharynx (HPu) is highlighted in green, whereas the lower hypopharynx (HPl) is highlighted in red. Finally, the epilarynx tube (ET), Sinus piriformis (SP), and ventricular volume (VV) are shown in orange, yellow, and purple, respectively.
We defined the frontal part of the oropharynx as the volume restricted by the tangential plane of the lips and the back of the nasal septum (Oropharynx front, OPf). Connected to OPf, we defined the rear part of the oropharynx (Oropharynx rear, OPr) following downstream up to the lowest point of the uvula. The hypopharynx is connected to OPr and limited by the lowest edge of the aryepiglottic fold. However, we split the hypopharynx into an upper (HPu) and a lower section (HPl) at the highest point of the epiglottis. Further, we defined the epilarynx tube (ET) as a sub-volume restricted by the aryepiglottic fold and the upper edge of the plicae vestibulares. The ventricular volume (VV) was defined as the space between the upper edge of the plicae vestibulares up to the vocal fold level (thus representing the sinus morgagni). The sinus piriformis (SP) are the air-filled spaces caudal to the lowest edge of the aryepiglottic fold. Further, we defined the sum of oropharynx front and rear as the whole oropharyngeal volume OP, whereas we defined the sum of all other volumes as the hypopharyngeal (and laryngeal) volume (HP). The sum of OP and HP represents the bulk volume V of the vocal tract.
The length L, starting at the upper limit of the vocal folds up to the lateral opening of the lips, of the vocal tracts was derived as described in Echternach et al. (2015).
2.4 Vocal tract transfer function
The surface representations of the vocal tract for each vowel and voice quality were post-processed using the method presented in Birkholz et al. (2020). In brief, we smoothed each stl-mesh and reduced the number of facets in Meshlab (www.meshlab.net). Further, we split all stl-files into parts for the glottal entry, the lip opening, and the vocal tract wall using Blender (www.blender.org) (see Figure 3). Finally, we created volume meshes (msh-files) using GMSH (www.gmsh.info) to be converted into xdmf-files.
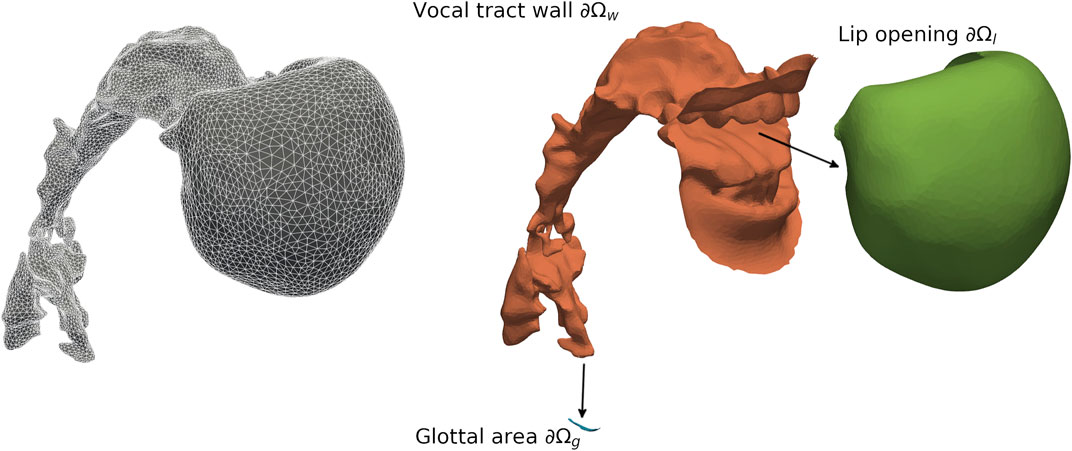
FIGURE 3. Mesh of the Finite-Element-Model (domain Ω, left in gray) and exploded view (right) to depict the patches for the lip opening (∂Ωl, green), the vocal tract wall (∂Ωw, orange), and the glottal area (∂Ωg, blue) for Belting /aː/ (A♭3).
We analyzed the xdmf-files within the open-source Finite-Element-Software dolfinx (https://jorgensd.github.io/dolfinx-tutorial/). The mean element size for all models was between 1.43 and 2.6 mm. That results in a spatial resolution of about 13 to about 24 elements with linear shape functions per wavelength at 10 kHz. Therefore, for all models, the spatial resolution ensures high precision of the numerical analysis within the chosen frequency range of up to 10 kHz.
We analyzed the acoustic transfer characteristics for all models by solving the Helmholtz equation
for the unknown complex-valued scalar pressure p at all positions
with a constant particle velocity V0 and a constant density ϱ0 = 1.13 kg/m3.
with a real-valued impedance Zw = 200 ⋅ ϱ0c which is equivalent to a boundary admittance coefficient μ = 0.005 (Arnela et al., 2013; Arnela and Guasch, 2014; Zappi et al., 2016). To incorporate the spherical shape of the lip facets ∂Ωl and to guarantee absorption of outgoing spherical waves, we applied Robin-boundary conditions
with a mathematical expression for the radiation impedance Zl according to Birkholz et al. (2020). In contrast to Birkholz et al. (2020), we considered a lip opening mimicking a bubble to avoid any overlap with internal structures such as the teeth. For each model, we calculated first the complex-valued transfer function
for pl(ω) central at ∂Ωl. We derived
for pg(ω), central at ∂Ωg.
Using the glottal area Ag and the lip opening area Al, we computed the volume velocity transfer function (VVTF)
All stl-models, the subsequently derived files, the result files, and analysis scripts are available at Fleischer et al. (2022).
2.5 Filter approximation
To calculate acoustic quantities (particle velocity
We computed the particle velocity
Further, we derived the acoustic pressure
2.6 Electroglottographic spectrum and slope
We followed the guidelines given by Libeaux (2010) to estimate the spectral tilt or spectral slope of the experimentally determined EGG spectra. In short, we computed the short-time averaged wideband spectrum (STAWS) of the downsampled EGG-signal (sampling rate of 20 kHz) for each sample (bandwidth of 2 ⋅ fo, Hann-window with a sample size of 256, hop size of 128). According to Libeaux (2010), we fitted STAWS within the range between 2 ⋅ fo and 10 ⋅ fo with a linear polynomial regression in the log-log-scaled spectrum to compute the spectral slope. Finally, we derived the index of contacting Ic using FonaDyn (see Ternström (2019) for details).
2.7 Sound intensity
Finally, we evaluated the sound intensity
We filtered
3 Results
3.1 Volumetric data of voice qualities and partial voluminas
For comparison purposes and to evaluate their sizes, we determined the volumes of the vocal tract sub-structures as introduced in Figure 2. They depend on voice quality, vowel, and pitch (see Figure 4 and Table 1).
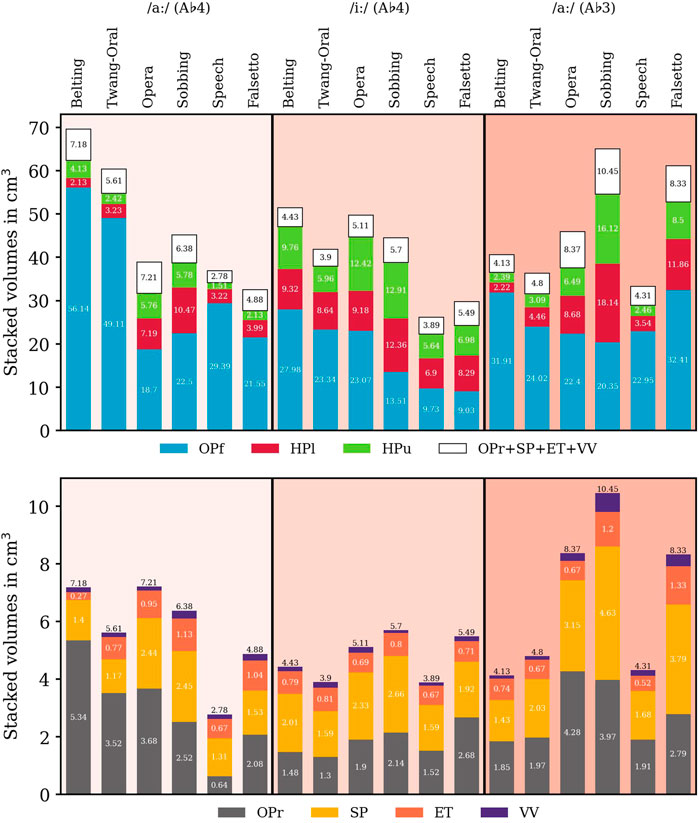
FIGURE 4. Volumes of sub-volumes for all voice qualities, vowels, and pitch values in cm3. Consistently to Figure 2, the oropharynx front (OPf) and the oropharynx rear (OPR) are symbolized by blue and gray color, and the upper hypopharynx (HPu) and the lower hypopharynx (HPl) are highlighted green and red, respectively. The epilarynx tube (ET), Sinus piriformis (SP), and ventricular volume (VV) are highlighted in orange, yellow, and purple, respectively. For clarity reasons, the anatomical order is not considered.
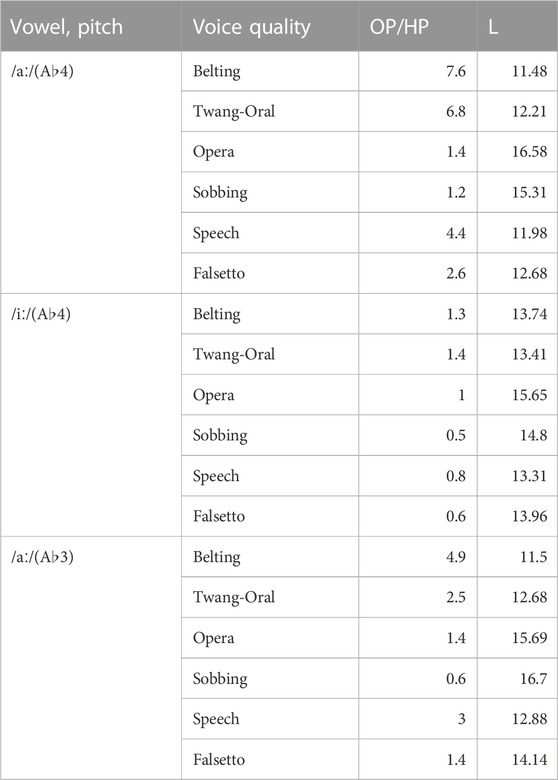
TABLE 1. Dimensionless OP/HP-ratio (Oropharynx/Hypopharynx) and vocal tract length L in cm, for all investigated voice qualities, vowels, and pitch values.
While the length of the vocal tract differs by over 5.2 cm (Belting A♭4 /aː/: 11.48 cm; Sobbing A♭3 /aː/: 16.70 mm), the overall volume was more than doubled in the pool of voice qualities (Speech A♭3 /iː/: 26.33 cm3; Belting A♭4 /aː/: 69.73 cm3). We further found indications for a connection between vocal tract lengths and voice quality subgroups in the data. Opera and Sobbing models had the longest vocal tracts, Belting and Twang had the shortest, while Speech and Falsetto had a medium vocal-tract length. The length differences are equally pronounced for A♭4 /iː/ and /aː/ while they are less pronounced for A♭3 /aː/.
The differentiation of the subgroups was well represented in the analysis of sub-volumes, e.g., in the OP/HP ratio: megaphone configuration was characterized by OP/HP
In intra-group comparison, the megaphone shape was more pronounced in Belting than in Twang. Here, for Belting, we observed larger oropharyngeal cavities, smaller hypopharynx, and smaller volumes of the epilarynx tube.
The inverted-megaphone shape was more emphasized in Sobbing compared to Opera. Here, the oropharyngeal volume was smaller, but hypopharyngeal subvolumes were larger. Falsetto models include a larger hypopharynx, whereas the oropharyngeal measures show no clear trend.
In all Belting vs. Twang, Opera vs. Sobbing, and Speech vs. Falsetto models, the lower hypopharyngeal volume is smaller in the first mentioned qualities. (the only exception is: Belting /iː/ compared to Twang /iː/ – here Belting was slightly larger than Twang).
3.2 Volume velocity transfer functions
Volume velocity transfer functions
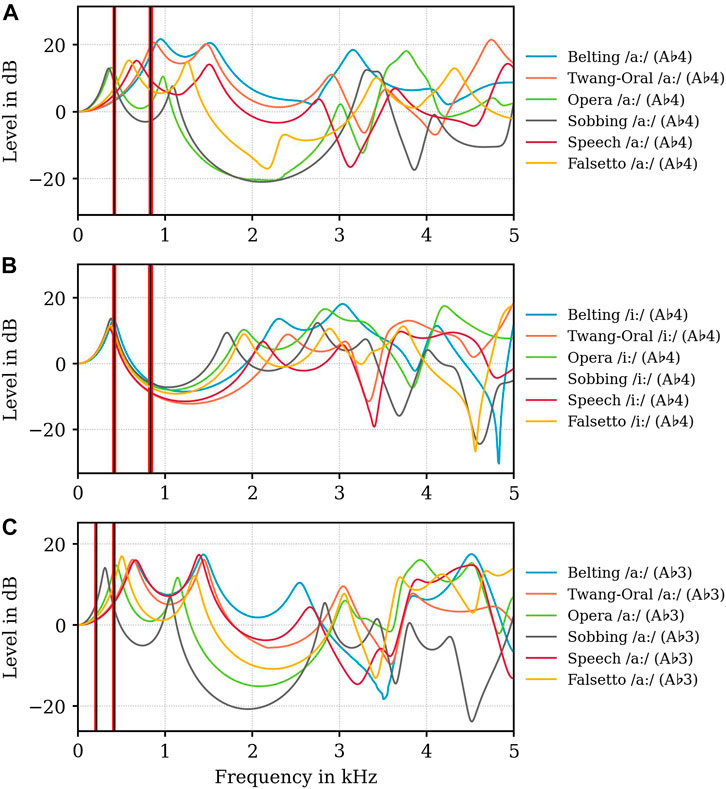
FIGURE 5. Level in dB of Volume velocity transfer functions
The level of
In Opera and Sobbing models fR1 is located in a close relation to fo (fo = 0.415 kHz, Opera: fR1 = 0.390 kHz, Sobbing: fR1 = 0.350 kHz) while in Belting and Twang models fR1 is located in close relation to 2fo (2fo = 0.830 kHz; Belting: fR1 = 0.950 kHz, Twang: fR1 = 0.870 kHz), while there is no relation between fR1 and/or fR2 and displayed harmonics for Speech and Falsetto (see Supplementary Data Sheet S1). Similar relation can be found in A♭3 /aː/ models, however less pronounced (Figure 5C). For A♭4 /iː/ models, (Figure 5B), different behavior can be noticed: fR1 is located here in close proximity (0.360–0.410 kHz) and close relation to fo = 0.415 kHz, while for fR2 we found a similar distribution as for /aː/ (see Figure 5A).
Concerning economic considerations, resonance maxima in the area of 2–4 kHz are of specific interest as our auditory system is most sensitive here. For A♭4 (0.415 kHz), the highest resonance amplitude levels in this area occur in Belting and Opera vocal tracts: In Belting fR3 is located around 3 kHz for both /iː/ (3.040 kHz) and /aː/ (3.150 kHz). In Opera /aː/, a resonance maximum, which could be interpreted as fR4, is located at 3.770 kHz, while for /iː/, the highest level is found for fR3 at 2.840 kHz. For A♭3-models (0.208 kHz), only Opera has an eminent maximum in this frequency region at around 3.930 kHz. All other models show no specific resonance strategy or pronunciation for fR3 to fR5.
Worth mentioning are also pronounced resonance minima as these absorb energy and act as formant repellents (Dang and Honda, 1997; Delvaux and Howard, 2014). Distinct minima occur for all Sobbing models, one in the range between 3 and 4 kHz another in the range between 4 and 5 kHz. In Opera models the minima show relatively similar positioning in A♭4 /iː/ and A♭3 /aː/, but significantly less pronounced. For Speech and Twang very similar minima are found in all models between 3 and 3.5 kHz, while Falsetto models show very inconsistent behaviour here. Belting A♭4 /aː/ vocal tracts exhibit no pronounced minima, Belting A♭4 /iː/ has one briefly under 5 kHz and Belting A♭3 /aː/ has a minima at around 3.5 kHz.
The deviation between the first formant F1 derived from inverse filtering and fR1 calculated from
3.3 Filter approximation
The numerically determined resonance frequencies of the ratio
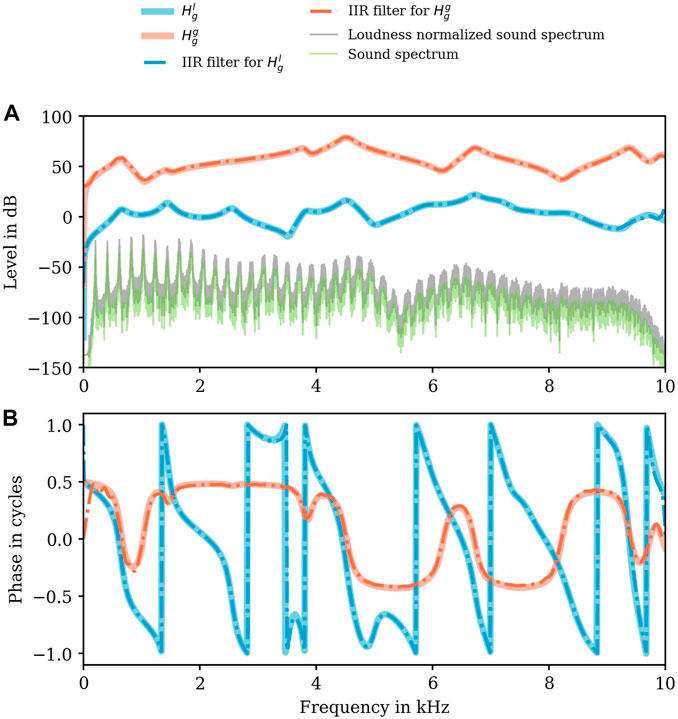
FIGURE 6. Level in dB (A) and phase responses (B) of the numerically determined transfer characteristics
The RMS error from
Comparing the envelopes of the sound spectra (raw data and loudness normalized sound spectrum) with
3.4 Acoustic and electroglottography related measures
EGG spectral tilt and calculated particle velocity at the glottis
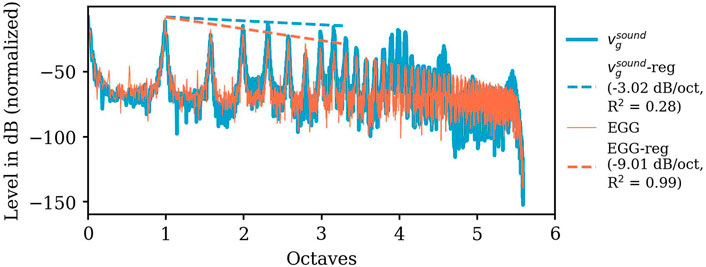
FIGURE 7. Amplitude spectra (in dB, normalized to its maximum) of the particle velocity (computed by a post-processing step combining experimentally and numerically derived data) at the glottis
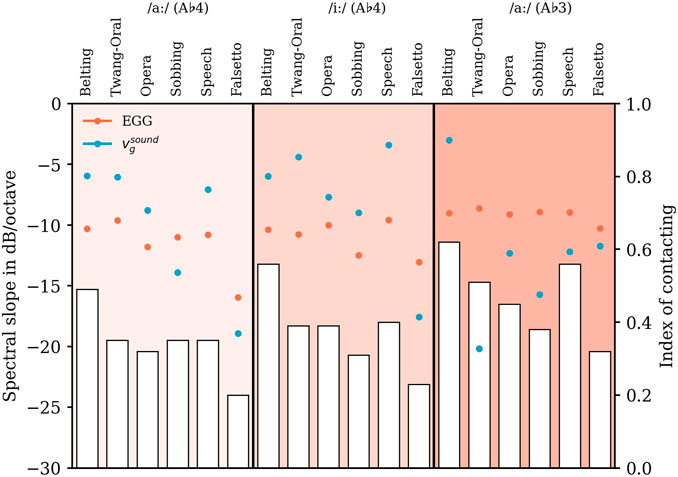
FIGURE 8. Slopes in dB/octave (left ordinate) of the experimentally derived EGG-spectra (circles, filled in orange) and the computed particle velocity
Overall, the range of variation of the EGG slope is much smaller compared to the
3.5 Calculated sound intensity
Calculated sound intensity for original
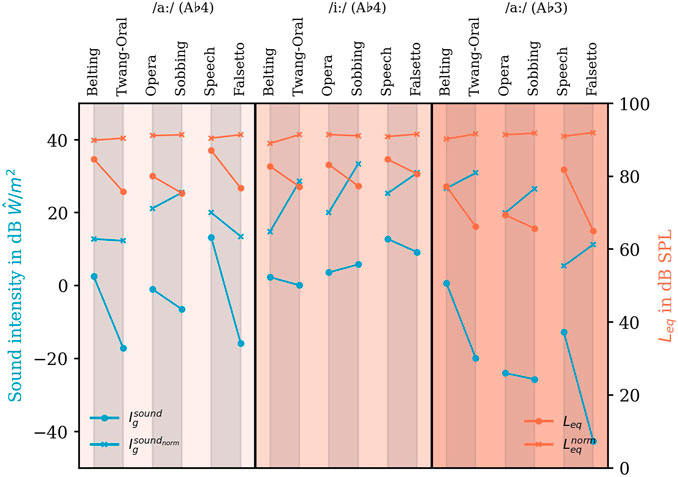
FIGURE 9. Sound intensity
To highlight the differences in the previously defined resonance subgroups, we connected these subgroups by lines. Additionally calculated values for sound power (
The values calculated from original sound data display the sound intensity used to reach the respective loudness (see round marks in Figure 9). Additionally, the equivalent sound pressure level Leq (calculated for the whole analyzed sound sample) according to ISO 3740:2019 is displayed as a plausibility check since the audio data and the calculated intensity data originate from two different measurement times. Here, except for the pair Opera -Sobbing A♭4 /iː/, all models show a higher intensity for higher Leq which also seems to correlate in magnitude.
As expected, the loudness normalized data show a very homogeneous level (orange crosses in Figure 9). The non-normalized data from each examined group show a louder (Opera/Belting/Speech) and a softer (Sobbing/Twang/Falsetto) voice quality.
Generally, Leq was lower for A♭3 compared to the respective voice quality for A♭4. To reach the higher Leq for vowel /aː/ phonation highest sound intensity was necessary for Belting, lower for Opera, and low for Speech, while for /iː/, this difference was minor.
3.6 Sound intensity in relation to geometric data
In a final step, the calculated intensity values were considered in relation to the vocal tract configuration. Subvolumina and intensity are summarized in the Supplementary Data Sheet S1 but due to the very small data pool, statistical correlations were not conducted. Nevertheless, a simple visual inspection reveals that there is no clear relationship between the magnitude of the intensity values and the volumes of most of the different parts of the vocal tract. One exception here is the lower hypopharyngeal volume: Here, the arrangement of the values in the plot might suggest a correlation: The smaller the (lower) hypopharyngeal volume, the higher the calculated intensity value of the voice quality. Additionally, this is reflected by a higher OP/HP-ratio associated with higher sound intensity.
4 Discussion
4.1 Preliminary remarks about the definition of voice efficiency
The presented study aims to increase the knowledge of resonance strategy and related voice efficiency for various voice qualities.
“Voice efficiency” can be viewed and analyzed from various points of view. In our context, we define the phrase “efficient voice production” as a low sound intensity at the glottal level required to acoustically excite the respective air column in the space between vocal folds and lips. Here, the lower the sound intensity needed for a defined sound pressure level, the higher the degree of efficiency. Additionally, we will discuss some further aspects of the perceived loudness.
In addition to these economic considerations, the examined types of voice production also have a purely artistic justification since they are linked, for example, with certain emotions regarding the performer in the listener’s perception. Thus, our study does not aim to suggest one or another voice quality but to increase awareness of the underlying principles, especially when the vocal demand is high.
4.2 Volume velocity transfer functions and vocal tract configuration
The investigated six voice qualities can be assigned to three different subgroups according to their vocal tract configuration (Titze and Worley, 2009; Titze et al., 2011, 2017). Titze et al. (2011) based their assumptions on predicted or assumed vocal tract area functions for famous singers of different genres based on their mouth configurations, corresponding frequency spectra, and calculated inertagrams. To the best of our knowledge, this is the first study to imagine these configurations with different voice qualities in one professionally trained singer.
The results of our study support Titze’s assumptions concerning the configuration of the vocal tract (see partial volume distribution) and related position of the lowest two resonances. But, the differences are generally more pronounced for /aː/ compared to /iː/ and for A♭4 compared to A♭3 models, which could be related to the substantial difference in tongue position. Volumetric and calculated acoustic data is thus generally discussed in the context of these three subgroups.
4.2.1 Group 1: “Inverted-megaphone” configuration’ models Opera and Sobbing
The inverted-megaphone configuration of the vowel tract is found typically in western-style classically trained singers (Titze and Worley, 2009; Titze et al., 2011) (except for high soprano singing (Köberlein et al., 2021; Mainka et al., 2021)), and corresponds to Sobbing and Opera in the qualities we have studied. In our data, these models show the lowest resonance frequencies fR1 and fR2.
The lowering of fR1 and fR2 might be beneficial to avoid instabilities that might occur when crossing resonances with 2 ⋅ fo or fo when fo rises (Titze and Worley, 2009). In both A♭4-models, fR1 is positioned close below fo. Whether this association occurs by chance or represents the onset of tuning for higher phonation cannot be conclusively answered from our data. A consistently lower formant F1 for classical singing compared to Belting was also reported by Sundberg et al. (2012) in different vowels in acoustic analysis of a single subject.
Regarding economic considerations of higher vocal tract resonances, Opera and Sobbing showed very different strategies. For Sobbing, we found distinctive antiresonances, but for Opera, we found more pronounced resonance maxima. Enhancement of spectral energy in the area of 2–4 kHz is a well-known phenomenon of the western classical singing strategy called singers’ format and was assigned to a direct supraglottic constriction in relation to the widening of the hypopharynx further cranially (Sundberg, 1974).
In previous studies, an increased constriction of the epilarynx tube was associated with an increase in radiated sound pressure level in classically trained male singers (Mainka et al., 2021). However, the reduction of the lower hypopharyngeal volume from Sobbing to Opera seems to be even more pronounced than the difference in the Epilarynx tube volume. A simple magnitude relationship between these two regions as the cause of the distinctive resonance change seems unlikely.
Two side cavities, the vallecula and the piriform sinus connect to the lower hypopharynx.
The piriform sinus introduces an anti-resonance around 4–5 kHz (Dang and Honda, 1997; Honda et al., 2010; Delvaux and Howard, 2014). Delvaux and Howard (2014) postulated that these side cavities act as “formant repellent” pushing fR1 to fR4 lower (Delvaux and Howard, 2014). Dang and Honda (1997) postulated that these antiresonances tune the vocal tract transfer function to make the singers’ formant more prominent. Additionally, Dang and Honda (1997) found only minor differences in the frequencies of the antiresonances for different vowels in speech and singing. Reasons are small changes in the geometry of the piriform fossae from speech to singing.
Indeed, that is consistent with our data, where the size differences of the piriform sinus between Opera and Sobbing were minor (e.g., A♭4 /aː/), while the expression of antiresonances shows major differences in the same models.
The vallecula, in turn, was discussed to have a similar influence on the transfer function (but at lower frequencies around 4 kHz) (Vampola et al., 2015; Feng and Howard, 2021). In our data, we included the volume of the vallecula in the hypopharyngeal region which was larger in Sobbing compared to Opera independent of vowel and pitch. The assumption of Feng and Howard (2021), that a large vallecula is detrimental to the singing formant, is supported by our data.
In contrast to previous assumptions that a wide sinus morgagni is beneficial for the singers’ formant cluster Sundberg (1974), our data show a heterogeneous behavior of the ventricular volume for Opera compared to Sobbing, which, e.g., for A♭4 /aː/ is twice as large in Sobbing and in A♭4 /iː/ the other way around. The influence on the singing formant thus seems minor.
In summary, we found the large side cavities in Sobbing tend to have a suppressing effect because these cavities reduce the amplification and, thus, the power transfer at frequencies important for the perceived loudness. From a pedagogic perspective, this result is interesting as in western classical voice pedagogy, the widening of the pharynx is often thought to be associated with an increase in voice intensity (Faulstich (2020), p. 50). However, our data indicate a decrease in voice efficiency when the widening of the pharynx is associated with increasing volumes of side cavities.
4.2.2 Group 2: “Megaphone” models Belting and Twang
Megaphone-shaped vocal tract models are reported to be typical in musical theatre (Echternach et al. (2014a)) and “twang-like singing” (Saldias et al. (2019)) as well as very high-pitched Soprano singing (Köberlein et al., 2021). In our dataset, they are found for Belting and Twang as defined by Estill Voice Training®. We found high resonance frequencies fR1/2 for both models. That is in conjunction with a light vowel color and an open vowel configuration mentioned by Titze et al. (2017).
According to the literature for /aː/, a close relation is found of the first resonance frequency fR1 that is placed slightly above 2fo for A♭4 (Titze and Worley, 2009; Bourne and Garnier, 2012; Sundberg et al., 2012). That is certainly efficient for voice production since the level of 2fo (which is supposed to be strong in the spectrum of Belting (Stone et al. (2003)) is amplified even further.
Bourne and Garnier (2012) described a 2fo−fR1 tuning up to 700 Hz (pitch F5) for Belting, whereas Köberlein et al. (2021) detected a value of about 1.4 kHz (pitch F6) for fo−fR1 in very high western classically trained soprano singing, respectively, for the same rationale. These findings indicate a possible natural upper end of the further elevation of fR1. That supports the idea that Belting performs stable in a limited pitch ranges or that a change of strategy is required for higher belting. It is supposed that avoiding the crossing of 2fo and fR1 is beneficial to prevent instabilities due to source-filter interactions (Maxfield et al., 2017). For A♭3, we observed fR1 to be significantly higher than 2fo, which is in unison with Titzes suggestion that belting is associated with fR1 > 2fo and not the definition of Bourne and Garnier (2012) who suggested a fR1 = 2fo tuning.
Interestingly, we did not observe this typical 2fo−fR1 tuning behavior for the vowel /iː/. Here, only fR2 was higher than in the other groups, while fR1 amplified the level at the fo. That might also be an advantage from an economic point of view.
In summary, our data confirm the relationship of 2fo−fR1 only for A♭4, however, fR1 (respective fR2 for /iː/) is always most elevated compared to the other model groups and positioned higher then 2fo.
Concerning the behavior of higher resonances, it is interesting to note that the relationship between Belting and Twang is similar to that between Opera and Sobbing. Here, Twang exhibits significantly stronger antiresonances in the transfer function in this region than Belting. That finding is more pronounced for A♭4. High levels at the resonance maxima in Belting, which certainly have a positive effect on sound pressure level and thus the efficiency, are weakened in amplitude and shifted by antiresonances for Twang. This links to anatomical measures, namely the hypopharyngeal volumes. Twang shows a larger HPl than Belting for vowel /aː/. More precisely, reducing the volume of the vallecula might be a crucial factor for increased economic usage of the vocal tract. It may further result in an increased sound pressure level caused by the weakened effect of levels at antiresonance frequencies.
Notably, this outcome may be vowel-dependent. For /iː/, the vallecula is not shaping a lateral cavity but is part of the hypopharynx. For /aː/, the retraction of the tongue and thus the epiglottis truncates this space to a greater extent.
4.2.3 Group 3: “Neutral” models Speech and Falsetto
Neutral models show a middle position of the lowest two resonance frequencies with no direct association with any partials of the spectrum.
In our data, fR1/2 for Speech was slightly higher than for Falsetto, which could also be associated with a slight reduction of the vowel tract length. We found a shift to higher values for most of the higher resonance frequencies, but both models do not show pronounced resonance frequencies. Further, fR3−5 are spanning a large range in the frequency spectrum.
4.3 EGG related data on vocal fold vibration and spectral slope
We analyzed EGG data to detect the relationship between spectral properties of the acoustic outcome and vocal fold vibration characteristics. More precisely, we analyzed the index of contacting Ic as proposed by Ternström (2019). As a heuristic metric, Ic for strong phonation is in the order of one and tends to zero for soft phonation or no collision.
Considering Figure 8, our data show a tendency of Ic to be decreased going from A♭3 to A♭4. That finding is supported by the literature on female voices, where a decrease in vocal fold contact quotient–not identical to Ic–with increasing fo was already described (Traser et al., 2021a) as well as an increase of the open quotient with fo based on high speed imaging data Echternach et al. (2017). On the other hand, the fo dependency of Ic could also be a result of more harmonics dropping out of the 10 kHz analysis band that became more prominent at higher fo (L˜a and Ternström, 2020). The latter seems more plausible because the volume did not substantially change between voice qualities and pitches (see Figure 9).
To further distinguish vibratory states of the vocal folds, we analyzed the EGG-spectrum and its spectral slope or decay, respectively (Selamtzis and Ternström, 2014). The EGG waveform may be a good approximation to the change in medial contact area between the vocal folds during phonation with limitation in the contacting phase according to Hampala et al. (2016). The greater the vocal fold contact area, the lower the spectral slope (Enflo et al., 2016) and the higher the vocal intensity (Sapienza et al., 1998). To relate the EGG data directly to the glottal flow data, we computed the particle velocity
For Falsetto, we found the largest decay of spectral slope in EGG-data and the lowest Ic in the dataset (especially for A♭4), indicating a vibration pattern with marginal vocal fold closure and a voice source with a low energy level of all harmonics. The latter is reflected evidently by a great decay in the spectral slopes of
For Belting, we found the lowest decay of the spectral slope and the highest Ic, indicating a vibration pattern with high vocal fold contact and a voice source with high energy in higher harmonics. This is in accordance with Stone et al. (2003) who also describe a higher EGG closed quotients for Broadway compared to operatic singing.
Compared to Belting, Twang significantly drops in Ic, but the spectral slope of the EGG-data is very similar for all pitches and vowels. Here, the spectral energy of
Speech was characterized by a low decrease in spectral energy, comparable to Belting for A♭4 but lower for A♭3 with Ic nevertheless more in line with that of Twang and Opera even if “thick” vocal fold is intended.
Comparing Opera and Sobbing, we found only a slight decrease in Ic for Sobbing (similar values for A♭4 /aː/). Also, the slope of
Considering that Opera, Belting, and Speech each achieved comparably high Leq, and Sobbing, Twang, and Falsetto similarly low Leq, one could speculate a difference in the dependence of the Leq on the voice source (and the vocal fold vibration) and the resonance properties. The Ic decreases strongly from Speech to Falsetto with large difference in the slope of
In contrast, Opera and Sobbing differ rather less in their vocal fold vibration and voice source but are more pronounced in the resonance properties for higher frequencies.
Moreover, Belting shows a higher vocal fold contact and distinctive resonance maxima for higher frequencies than Twang. However, the decay of the spectral energy of the calculated voice source
However, dependent on the chosen fo and its relation to the resonance frequencies, the EGG-signal is slightly affected by the vocal tract geometry and its reactance by Level 2 interaction (pitch shifts or instabilities in fo) (Maxfield et al., 2017) and does not involve glottal flow directly (Palaparthi et al., 2017). However, caused by Level 1 interaction, the spectral properties of glottal flow are affected by the individual shape of the vocal tract to a greater extent (Maxfield et al., 2017). More precisely, Level 2 interaction seems not to re-shape the spectral tilt of the EGG-signal, whereas Level 1 does.
4.4 Calculated sound intensity as a measure for vocal strength in relation to volumetric data
In the previous sections, we discussed the voice efficiency based on sound pressure level (expression of resonance maxima in the range of 2–4 kHz of volume velocity transfer function). In addition, we used acoustic recordings, filtered with the known acoustic properties, to analyze the voice source information contained therein and considered together with the EGG-based information on vocal fold vibration.
In a linear system, the separate investigation of voice source and acoustic properties would be sufficient for discussing voice efficiency. However, evidence for non-linear source-filter relationships as a relevant factor for human voice production is strong (but still not sufficiently understood). For general description of non-linear interaction see e.g. Titze (2008), for more recent in vivo analysis of professional voices see Echternach et al. (2021). However, there is consent that vocal tract configuration impacts voice source energy transfer. Thereby the acoustic pressure in the vocal tract can strengthen or disturb vocal fold vibration itself (Level 2 interaction (Maxfield et al., 2017)) or only influence the harmonic content (Level 1 interactions).
The presented investigation aims to propose a new measure to quantify the effort necessary for a voice source to excite a specific vocal tract.
In the chosen approach, we calculated the averaged particle velocity and the acoustic pressure at the glottis (see method section). One should note that the derived quantity “sound intensity”
In the intra-group comparison of different voice qualities investigated in this study, we observed less glottal intensity for Belting vs. Twang, Speech vs. Falsetto, and Opera vs. Sobbing to reach the same Leq (except for Belting-Twang A♭4, which had almost identical values). Belting, Speech, and Opera seem more efficient than Twang, Falsetto, and Sobbing. This result is also widely consistent with data by Estill et al. (1990), who discussed voice efficiency of the same voice qualities but defined it as the ratio of sound pressure level and airflow at the lips in a single-subject experiment. The authors included Twang generally among the efficient qualities but showing also a reduction of efficiency for lower and medium pitches, respectively, comparable to our data. In that study, the efficiency of Twang was similar to that of Belting for fo around 600 Hz in terms of efficiency, a value for fo that we did not investigate in our study. Of course, the economy measure used by Estill et al. (1990) considers a different aspect of voice efficiency as measured in our study.
For the vowel /iː/,
Because of the novelty of this measure in the context of voice production, we found, to our best knowledge, no comparative values in the literature. But, our proposed tendencies of
Considering our data, in Belting and Twang A♭4 /aː/, we found 2fo located just below the peak of fR1. That means the second harmonic would most likely match the maximum of the inertance, further strengthening the voice source and thus facilitating energy transfer. Congruently, both vocal tracts have lower sound intensity values compared to, e.g., A♭3 /aː/, where 2fo is far lower than the peak of fR1.
An important factor for sound power transfer and source filter interactions might also be an epilaryngeal narrowing. Titze et al. (2021) found that this narrowing raises the inertance of the whole vocal tract air column.
Also, the glottal resistance (and thus vocal fold vibration) plays an important role. According to the maximum power transfer theorem, a wide ET would require a low glottal resistance for maximum power transfer. Conversely, a narrow ET requires a high glottal resistance (more adduction) for maximum power transfer (Titze, 2002). This was confirmed experimentally by Döllinger et al. (2006), who found a decrease in phonation threshold pressure through impedance matching of the glottal source and the vocal tract. That would suggest the optimal efficiency relates to the configuration of the lower vocal tract and hence the individual voice quality.
In our data, we found the smallest ET volume of 265.24 mm3 for Belting (A♭4), while we found a significant increase to 740.47 mm3 of this sub-volume for Belting A♭3 /aː/. Both show a high Ic of 0.49 and 0.62, respectively, which presumably would be associated with an increased glottal resistance. Interestingly,
Due to the single-subject design, we did not perform correlation analyses on the vocal tract configuration as represented by the partial volumes with the calculated sound intensities. For those interested in details, we attached plots of sub-volume data and sound intensity values for visual inspection analysis in the Supplementary Data Sheet S1.
Despite these examples, we found that cross-subgroups, the sole volume of the ET seems to have no relation to the sound intensity needed to excite the vocal tract. That would be congruent with the maximum power transfer theorem that implies that the ET narrowing should be chosen according to the respective voice source and should not be a general recommendation. Additionally, we observed no clear cross-subgroup relationship between sound intensity and any other sub-volume parameter. That underlines that the reduction for single morphometric parameters seems not to be valid within the data of this study for evaluating voice efficiency. More precisely, one should incorporate the morphometric complexity of the whole vocal tract and the interaction between sub-volumes (see Arnela and Ure˜na (2022)) when the power transfer from the glottis to and through the vocal tract is analyzed.
A decrease of HPl (in percent of the whole vocal tract volume) might relate to an increase in sound intensity (see Supplementary Data Sheet S1). However, all Belting and Twang /aː/ phonations were outliers suggesting different dimension-relation for megaphone models. Additionally all /iː/-models showed higher sound intensity values compared to respective /aː/ models suggesting, more effective power transfer for vowel /aː/ (with general decrease in hypopharyngeal volume).
To what extent the suggested value of the sound intensity correlates with muscular tension or the necessary phonation threshold pressure remains unclear. Also, it is not yet possible to assess the extent to which sound intensity is related to mechanical stress on the vocal folds. Moreover, regarding “sound intensity”, it is interesting to note that the acoustic power emitted and radiated by a sound source contains only a tiny portion of the energy conversion of almost any source (Jacobsen, 2014).
4.5 General discussion of data plausibility and limitations
The Finite-Element-Method for solving the scalar Helmholtz-equation for the acoustic pressure as the unknown quantity is an appropriate procedure proven by direct comparison with experiments for three-dimensional vocal tract replicas (Birkholz et al., 2020). Nevertheless, specification of adequate boundary conditions at the vocal tract wall might be a crucial factor for correct mimicking of different vowels and voice qualities (Fleischer et al., 2015). However, the application of a constant, frequency and spatially independent wall impedance, as we did for the present study, cannot capture the spectral properties of the realistic transfer function in detail. To minimize the unknowns in the whole dataset, we believe that this limitation does not bias our results too much (see Švancara and Horáček (2006); Arnela et al. (2013); Zappi et al. (2016); Arnela and Ure˜na (2022) for further insights).
Based on the numerically determined transfer functions, we calculated IIR-filter approximations for all models. As demonstrated, the frequency characteristic of these filters does not only capture the FE results in amplitude but also in phase. Therefore, no significant time delay is caused just by the filter. Unfortunately, finding an appropriate set of parameters for the poles and zeros was done by hand. However, careful visual checking of all IIR approximations confident us that the presented method is valid for subsequent deconvolution of the audio signals of each task.
It is known that the vocal tract morphology depends on fo (Köberlein et al., 2021; Echternach et al., 2014b). One should note that this adaption process should not confound with the non-linear interaction of the filter (vocal tract) and the source. More precisely, two interaction levels are known. Either it reflects changes in the spectral distribution of the glottal flow (Level 1 interaction) or changes in fo caused by the specific reactance of the vocal tract (Level 2 interaction) (Maxfield et al., 2017). To our best knowledge, a reverse interaction, meaning changes in the vocal tract morphometry caused by the source signal, is not to be expected. That led us to assume that the deconvolved audio signals, based on our presented transfer function and derived IIR approximations, inherently contain the non-linear interaction of the source and the filter.
Due to the noise as well as the incompatibility of the sound pressure level meter with the magnetic field of the MRI system, it was not possible to perform a qualitatively sufficient and calibrated audio recording during the MRI examination. Audio and EGG recording were thus performed in a second measurement with careful microphone calibration. Slight changes in the morphometry of the vocal tract for these serial measurements could therefore lead to changes in the vocal tract transfer characteristics. That would further lead to changes in the reactance of this cavity, the resonance frequencies, the coupling to the glottis, and–most importantly–the sound intensities. In order to reduce these factors as much as possible, the measurements were performed on a professional singer, who has practiced the uniform execution of the sound qualities according to Estill Voice Training® for years and has reached the highest training level. In addition, the recording conditions regarding the position (supine), task (same order) and spectrography as online feedback were made as uniform as possible. However, the high accordance of F1 derived with inverse filtering of the audio data and fR1 derived from MRI data supports the assumption that the sound production was very uniform. However, a direct comparison of the inverse filtered formant frequency and the numerically determined resonance frequency is not thoroughly possible (Whalen et al., 2022). Additionally auditory masking due to the Lombard effect including respective effects on voice production must be taken into account (for an actual literature review see Nusseck et al. (2022)). Therefore, the singer had time to practice the voice quality without MRI noise. When she was content with the quality, the recording was started approximately one second after the onset of phonation to reduce the Lombard effect as much as possible. Nevertheless, it cannot be completely excluded that the voice production mechanisms were influenced by the measurement conditions. Our working group revealed that also professionally trained singers show systematical effects of body positions leading to changes in respiratory kinematics (Traser et al., 2021b), vertical laryngeal position and vocal tract configuration (Traser et al., 2013). Thus, even if singers have been trained to accurately position the vocal tract and larynx during their Estill Voice Training® education, there may be gravity-related differences between upright and supine phonation. However, since these were systematic differences in singers, and since we performed all the recordings compared here in the supine position, the validity of the data should not be limited.
This study presents data of one professional singer, trained according to one specific vocal school–Estill Voice Training®. Extrapolation of the data to other individuals, singers of different sex, or singing techniques is limited. Still, our results show a high agreement with former studies (e.g., the original considerations of Jo Estill and other work on Belting or Western-style classical singing, respectively) regarding resonance properties of the vocal tract or laryngeal function. The analyzed voice qualities offer one variant according to the definition of Estill Voice Training®. But, our modeling approach, combined with the signal processing strategy, can be adopted for various variations of voice production. Future work with a larger cohort should clarify whether our results are transferrable to other similarly trained singers or whether our findings regarding voice efficiency are a participant-related phenomenon.
4.6 Outlook for future research
The presented data underline the remarkable malleability and variability of the human resonance cavity and the vocal fold vibrations during voice production. It further underlines that these voice features can be trained independently and achieved by one singer. But they also indicate how differently the “instrument voice” operates in various aspects of voice efficiency. It is planned to analyse these aspects in a lager cohort comparing male and female singers. Here acoustically differentiation of the voice qualities by trained listeners would be of interest. Additionally, the influence of acoustic efficiency on the mechanical stress in the vocal folds must further be investigated. In future studies, one should also focus on how a high sound intensity may be responsible for secondary organic voice disorders (Dejonckere and Kob, 2009; Horáček et al., 2009).This study shows the applicability of 3D MRI to obtain individual volumes of the vocal tract, which could be beneficial in teaching and training of voice. Especially singers who choose Estill Voice Training® as a training method are used to work with feedback from a spectrogram. This procedure might benefit from simultaneous acquisition and analysis of EGG-data until sufficient proprioceptive or auditory feedback has been developed by the singer.
4.7 Conclusion
This study investigated resonance strategies of different voice qualities and their optimal utilization of the voice source energy. For resonance properties, the data suggests for the assignment in three sub-groups:
For the classical “inverted-megaphone shaped” configuration (first sub-group), an increase in sound pressure level by managing the volume of the hypopharynx and epilarynx tube seems reasonable. We further postulate that narrowing the side cavities decreases the unfavorable antiresonances and increases the bundling of fR3 to fR5 in the frequency range around 3 kHz.
An adjustment of fR1 to fo seems reasonable for higher fundamental frequencies. In this context, a more constricted hypopharyngeal adjustment improves the acoustic power transfer from the glottis into the vocal tract reflected in the computed lower sound intensity. The vocal fold oscillation was characterized by a medium-strong contact, with the voice source for Opera exhibiting a lower spectral slope (possibly reflecting Level 1 source-filter interactions), which can also be considered more efficient.
For CCM style “megaphone” shaped configuration (second sub-group), amplifying 2fo by placing fR1 in its high inertance region, in conjunction with a little spectral slope in the particle velocity at the glottis, seems to be an effective strategy in this genre. Impedance matching of the glottal source and the vocal tract, represented by an increased constriction of the epilarynx tube for Belting with an–compared to twang–increased index of contacting, is well reflected in our data.
“Neutral” vocal tract shaping (third sub-group) was not associated with any tuning or high pitch resonance increase. Thus, we cannot expect a significant increase in sound pressure level. Still, power transfer of the source was effective for Speech too. That seems reasonable since it represents the most common voice quality in everyday life without expecting a particular high sound pressure level.
Our findings suggest that Twang, Falsetto, or Sobbing are less efficient concerning energy transfer from the glottis to the vocal tract, their voice source, and their acoustic properties. Energy transfer in Speech was beneficial, but no pronunciation of higher frequencies by specific resonance strategies would reduce the assertiveness with background noise. Thus, these voice qualities are not very loud or predominant to instrumental sounds in their physiology. However, since their timbres are artistically in great demand, they are often used with a microphone or a soft acoustic setting. That might be detrimental to drowning out an orchestra without technical amplification. Belting and Opera are the most efficient qualities and might be better suitable, e.g., for unamplified singing or noisy environments.
From a pedagogic point of view it is important to point out these aspects out for inexperienced singers and explain that each voice quality has a specific dynamic range based on it’s physiology. Advanced technical equipment, knowledge of voice physiology, and auditory feedback (e.g., in-ear monitoring) can be essential for singers to avoid vocal overload or even the development of vocal problems if they aim for too much volume with less efficient voice qualities.
To the best of our knowledge, this is the first study to assess the voice efficiency of different voice qualities in a single subject. Still, future studies should consider the mechanical impact of the vocal folds and check for the transferability of our single-subject findings to other individuals. The newly introduced measure of sound intensity seems to reflect the effectiveness of voice production in a physically motivated and comprehensive way.
Data availability statement
The datasets presented in this study can be found in online repositories. The names of the repository/repositories and accession number(s) can be found below: https://doi.org/10.5281/zenodo.7228354.
Ethics statement
The studies involving human participants were reviewed and approved by the Medical Ethics Committee of the University of Freiburg (206/09). The patients/participants provided their written informed consent to participate in this study.
Author contributions
MF analyzed data, computed models, and wrote the paper. SR conducted research, made measurements, and analyzed data. FS and ME analyzed data. JF made measurements. MB and BR conducted and supervised research. LT conducted research, made measurements, analyzed data, and wrote the paper.
Funding
The Estill Education Fund covered the travel expenses and attendance of the participant in this study. The funder had no role in the design and conduct of the study; collection, management, analysis, and interpretation of the data; preparation, review, or approval of the manuscript; and decision to submit the manuscript for publication. The work of Matthias Echternach is funded by the DFG (Deutsche Forschungsgemeinschaft - German Research Council, EC409/1–4). This work was also supported by the North-German Supercomputing Alliance (HLRN). The work of Louisa Traser and Johannes Fischer was supported by the Forschungskommission of the Faculty of Medicine, University of Freiburg, Germany (TRA2196/21).
Acknowledgments
The authors would like to thank Peter Birkholz for discussions on filtering techniques, Pascal Hahn for sharing ideas on sound intensity, and Sten Ternström for general comments on the manuscript. The authors also want to thank Thomas Wesarg and Bettina Voß for the organization and provision of the sound-treated room for acoustic measurements as well as Severin Rothlauf and Kerstin Rabel for performing the 3D dental scans.
Conflict of interest
The authors declare that the research was conducted in the absence of any commercial or financial relationships that could be construed as a potential conflict of interest.
Publisher’s note
All claims expressed in this article are solely those of the authors and do not necessarily represent those of their affiliated organizations, or those of the publisher, the editors and the reviewers. Any product that may be evaluated in this article, or claim that may be made by its manufacturer, is not guaranteed or endorsed by the publisher.
Supplementary material
The Supplementary Material for this article can be found online at: https://www.frontiersin.org/articles/10.3389/fphys.2022.1081622/full#supplementary-material
References
Arnela M., Guasch O. (2014). Two-dimensional vocal tracts with three-dimensional behavior in the numerical generation of vowels. J. Acoust. Soc. Am. 135, 369–379. doi:10.1121/1.4837221
Arnela M., Ure˜na D. (2022). Tuned two-dimensional vocal tracts with piriform fossae for the finite element simulation of vowels. J. Sound Vib. 537, 117168. doi:10.1016/j.jsv.2022.117168
Arnela M., Guasch O., Alías F. (2013). Effects of head geometry simplifications on acoustic radiation of vowel sounds based on time-domain finite-element simulations. J. Acoust. Soc. Am. 134, 2946–2954. doi:10.1121/1.4818756
Birkholz P., Kürbis S., Stone S., Häsner P., Blandin R., Fleischer M. (2020). Printable 3d vocal tract shapes from MRI data and their acoustic and aerodynamic properties. Sci. Data 7, 255. doi:10.1038/s41597-020-00597-w
Bourne T., Garnier M. (2012). Physiological and acoustic characteristics of the female music theater voice. J. Acoust. Soc. Am. 131, 1586–1594. doi:10.1121/1.3675010
Czerwonka L., Jiang J. J., Tao C. (2008). Vocal nodules and edema may be due to vibration-induced rises in capillary pressure. Laryngoscope 118, 748–752. doi:10.1097/MLG.0b013e31815fdeee
Döllinger M., Berry D. A., Montequin D. W. (2006). The influence of epilarynx area on vocal fold dynamics. Otolaryngol. Head. Neck Surg. 135, 724–729. doi:10.1016/j.otohns.2006.04.007
Dang J., Honda K. (1997). Acoustic characteristics of the piriform fossa in models and humans. J. Acoust. Soc. Am. 101, 456–465. doi:10.1121/1.417990
Dejonckere P. H., Kob M. (2009). Pathogenesis of vocal fold nodules: New insights from a modelling approach. Folia Phoniatr. Logop. 61, 171–179. doi:10.1159/000219952
Delvaux B., Howard D. (2014). A new method to explore the spectral impact of the piriform fossae on the singing voice: Benchmarking using mri-based 3d-printed vocal tracts. PLoS ONE 9, e102680. doi:10.1371/journal.pone.0102680
Echternach M., Popeil L., Traser L., Wienhausen S., Richter B. (2014a). Vocal tract shapes in different singing functions used in musical theater singing – A pilot study. J. Voice 28, 653.e1–653. doi:10.1016/j.jvoice.2014.01.011
Echternach M., Traser L., Richter B. (2014b). Vocal tract configurations in tenors’ passaggio in different vowel conditions – A real-time magnetic resonance imaging study. J. Voice 28, 262.e1–262. doi:10.1016/j.jvoice.2013.10.009
Echternach M., Birkholz P., Traser L., Flügge T. V., Kamberger R., Burk F., et al. (2015). Articulation and vocal tract acoustics at soprano subject’s high fundamental frequencies. J. Acoust. Soc. Am. 137, 2586–2595. doi:10.1121/1.4919356
Echternach M., Burk F., Köberlein M., Selamtzis A., Döllinger M., Burdumy M., et al. (2017). Laryngeal evidence for the first and second passaggio in professionally trained sopranos. PLoS ONE 12, 01758655–e175918. doi:10.1371/journal.pone.0175865
Echternach M., Herbst C. T., Köberlein M., Story B., Döllinger M., Gellrich D. (2021). Are source-filter interactions detectable in classical singing during vowel glides? J. Acoust. Soc. Am. 149, 4565–4578. doi:10.1121/10.0005432
Eichstädt S., Elster C., Smith I. M., Esward T. J. (2017). Evaluation of dynamic measurement uncertainty – An open-source software package to bridge theory and practice. J. Sens. Sens. Syst. 6, 97–105. doi:10.5194/jsss-6-97-2017
Enflo L., Herbst C. T., Sundberg J., McAllister A. (2016). Comparing vocal fold contact criteria derived from audio and electroglottographic signals. J. Voice 30, 381–388. doi:10.1016/j.jvoice.2015.05.015
Estill J., Kobayashi N., Honda K., Kakita Y. (1990). “A study on respiratory and glottal controls in six Western singing qualities: Airflow and intensity measurement of professional singing,” in Proc. First International Conference on Spoken Language Processing (ICSLP 1990), 169–172. doi:10.21437/ICSLP.1990-43
Faulstich G. (2020). Singen lehren – singen lernen Grundlagen für die Praxis des Gesangunterrichts. Augsburg, Germany: Wißner-Verlag.
Fedorov A., Beichel R., Kalpathy-Cramer J., Finet J., Fillion-Robin J.-C., Pujol S., et al. (2012). 3d slicer as an image computing platform for the quantitative imaging network. Magn. Reson. Imaging 30, 1323–1341. doi:10.1016/j.mri.2012.05.001
Feng M., Howard D. M. (2021). The dynamic effect of the valleculae on singing voice – An exploratory study using 3d printed vocal tracts. J. Voice 20, 30459–8. doi:10.1016/j.jvoice.2020.12.012
Fleischer M., Pinkert S., Mattheus W., Mainka A., Mürbe D. (2015). Formant frequencies and bandwidths of the vocal tract transfer function are affected by the mechanical impedance of the vocal tract wall. Biomech. Model. Mechanobiol. 14, 719–733. doi:10.1007/s10237-014-0632-2
Fleischer M., Mainka A., Kürbis S., Birkholz P. (2018). How to precisely measure the volume velocity transfer function of physical vocal tract models by external excitation. PLoS ONE 13, e0193708. doi:10.1371/journal.pone.0193708
Fleischer M., Rummel S., Stritt F., Fischer J., Bock M., Echternach M., et al. (2022). Data from: Voice efficiency for different voice qualities combining experimentally derived sound signals and numerical modeling of the vocal tract. [Dataset]. doi:10.5281/zenodo.7228354
Fujita S., Honda K. (2005). An experimental study of acoustic characteristics of hypopharyngeal cavities using vocal tract solid models. Acoust. Sci. Technol. 26, 353–357. doi:10.1250/ast.26.353
Granqvist S., Hertegard S., Larsson H., Sundberg J. (2003). Simultaneous analysis of vocal fold vibration and transglottal airflow: exploring a new experimental setup. J. Voice 17, 319–330. doi:10.1067/s0892-1997(03)00070-5
Hampala V., Garcia M., Švec J. G., Scherer R. C., Herbst C. T. (2016). Relationship between the electroglottographic signal and vocal fold contact area. J. Voice 30, 161–171. doi:10.1016/j.jvoice.2015.03.018
Havel M., Sundberg J., Traser L., Burdumy M., Echternach M. (2021). Effects of nasalization on vocal tract response curve. J. Voice. doi:10.1016/j.jvoice.2021.02.013
Hirosaki M., Kanazawa T., Komazawa D., Konomi U., Sakaguchi Y., Katori Y., et al. (2021). Predominant vertical location of benign vocal fold lesions by sex and music genre: Implication for pathogenesis. Laryngoscope 131, E2284–E2291. doi:10.1002/lary.29378
Honda K., Kitamura T., Takemoto H., Adachi S., Mokhtari P., Takano S., et al. (2010). Visualisation of hypopharyngeal cavities and vocal-tract acoustic modelling. Comput. Methods Biomech. Biomed. Engin. 13, 443–453. doi:10.1080/10255842.2010.490528
Horáček J., Laukkanen A.-M., Šidlof P., Murphy P., Švec J. G. (2009). Comparison of acceleration and impact stress as possible loading factors in phonation: A computer modeling study. Folia Phoniatr. Logop. 61, 137–145. doi:10.1159/000219949
Joliveau E., Smith J., Wolfe J. (2004). Acoustics: tuning of vocal tract resonance by sopranos. Nature 427, 116. doi:10.1038/427116a
Köberlein M., Birkholz P., Burdumy M., Richter B., Burk F., Traser L., et al. (2021). Investigation of resonance strategies of high pitch singing sopranos using dynamic three-dimensional magnetic resonance imaging. J. Acoust. Soc. Am. 150, 4191–4202. doi:10.1121/10.0008903
Lã F. M. B., Ternström S. (2020). Flow ball-assisted voice training: Immediate effects on vocal fold contacting. Biomed. Signal Process. Control 62, 102064. doi:10.1016/j.bspc.2020.102064
Libeaux A. (2010). The EGG spectrum slope in speakers and singers: Variations related to voice sound pressure level, subglotttal pressure and vowel. Master’s thesis. Aachen, Germany: University Hospital Aachen and Aachen University. Department of Phoniatrics, Pedaudiology, and Communication Disorders.
Mainka A., Platzek I., Klimova A., Mattheus W., Fleischer M., Mürbe D. (2021). Relationship between epilarynx tube shape and the radiated sound pressure level during phonation is gender specific. Logop. Phoniatr. Vocol., 1–13. doi:10.1080/14015439.2021.1988143
Maxfield L., Palaparthi A., Titze I. (2017). New evidence that nonlinear source-filter coupling affects harmonic intensity and fo stability during instances of harmonics crossing formants. J. Voice 31, 149–156. doi:10.1016/j.jvoice.2016.04.010
Nusseck M., Immerz A., Richter B., Traser L. (2022). Vocal behavior of teachers reading with raised voice in a noisy environment. Int. J. Environ. Res. Public Health 19, 8929. doi:10.3390/ijerph19158929
Palaparthi A., Maxfield L., Titze I. R. (2017). Estimation of source-filter interaction regions based on electroglottography. J. Voice 33, 269–276. doi:10.1016/j.jvoice.2017.11.012
Saldías M., Laukkanen A.-M., Guzmán M., Miranda G., Stoney J., Alku P., et al. (2021). The vocal tract in loud twang-like singing while producing high and low pitches. J. Voice 35, 807.e1–807.e23. doi:10.1016/j.jvoice.2020.02.005
Saldias M., Guzman M., Miranda G., Laukkanen A.-M. (2019). A computerized tomography study of vocal tract setting in hyperfunctional dysphonia and in belting. J. Voice 33, 412–419. doi:10.1016/j.jvoice.2018.02.001
Sapienza C. M., Stathopoulos E. T., Dromey C. (1998). Approximations of open quotient and speed quotient from glottal airflow and egg waveforms: effects of measurement criteria and sound pressure level. J. Voice 12, 31–43. doi:10.1016/s0892-1997(98)80073-8
Schutte H. K., Miller D. G. (1993). Belting and pop, nonclassical approaches to the female middle voice: Some preliminary considerations. J. Voice 7, 142–150. doi:10.1016/S0892-1997(05)80344-3
Selamtzis A., Ternström S. (2014). Analysis of vibratory states in phonation using spectral features of the electroglottographic signal. J. Acoust. Soc. Am. 136, 2773–2783. doi:10.1121/1.4896466
Steinhauer K., Klimek M. M., Estill J. (2017). The Estill voice model: Theory and translation. 1. edn. Pittsburgh, Pennsylvania: Estill Voice International.
Stone J., R. E., Cleveland T. F., Sundberg P. J., Prokop J. (2003). Aerodynamic and acoustical measures of speech, operatic, and broadway vocal styles in a professional female singer. J. Voice 17, 283–297. doi:10.1067/S0892-1997(03)00074-2
Sundberg J., Thalén M., Popeil L. (2012). Substyles of belting: Phonatory and resonatory characteristics. J. Voice 26, 44–50. doi:10.1016/j.jvoice.2010.10.007
Sundberg J. (1974). Articulatory interpretation of the "singing formant". J. Acoust. Soc. Am. 55, 838–844. doi:10.1121/1.1914609
Švancara P., Horáček J. (2006). Numerical modelling of effect of tonsillectomy on production of czech vowels. Acta Acust. united Ac 92, 681–688.
Ternström S., Johansson D., Selamtzis A. (2018). Fonadyn–a system for real-time analysis of the electroglottogram, over the voice range. SoftwareX 7, 74–80. doi:10.1016/j.softx.2018.03.002
Ternström S. (2019). Normalized time-domain parameters for electroglottographic waveforms. J. Acoust. Soc. Am. 146, EL65–EL70. doi:10.1121/1.5117174
Titze I. R., Story B. H. (1997). Acoustic interactions of the voice source with the lower vocal tract. J. Acoust. Soc. Am. 101, 2234–2243. doi:10.1121/1.418246
Titze I. R., Worley A. S. (2009). Modeling source-filter interaction in belting and high-pitched operatic male singing. J. Acoust. Soc. Am. 126, 1530–1540. doi:10.1121/1.3160296
Titze I. R., Worley A. S., Story B. H. (2011). Source-vocal tract interaction in female operatic singing and theater belting. J. Sing. 67, 561–572.
Titze I. R., Maxfield L. M., Walker M. C. (2017). A formant range profile for singers. J. Voice 31, e9–e382. doi:10.1016/j.jvoice.2016.08.014
Titze I. R., Palaparthi A., Cox K., Stark A., Maxfield L., Manternach B. (2021). Vocalization with semi-occluded airways is favorable for optimizing sound production. PLoS Comput. Biol. 17, 10087444–e1008821. doi:10.1371/journal.pcbi.1008744
Titze I. R. (2001). Acoustic interpretation of resonant voice. J. Voice 15, 519–528. doi:10.1016/S0892-1997(01)00052-2
Titze I. R. (2002). Regulating glottal airflow in phonation: Application of the maximum power transfer theorem to a low dimensional phonation model. J. Acoust. Soc. Am. 111, 367–376. doi:10.1121/1.1417526
Titze I. R. (2006). Voice training and therapy with a semi-occluded vocal tract: Rationale and scientific underpinnings. J. Speech Lang. Hear. Res. 49, 448–459. doi:10.1044/1092-4388(2006/035)
Titze I. R. (2008). Nonlinear source–filter coupling in phonation: Theory. J. Acoust. Soc. Am. 123, 2733–2749. doi:10.1121/1.2832337
Titze I. R. (2020). Inertagrams for a variety of semi-occluded vocal tracts. J. Speech Lang. Hear. Res. 63, 2589–2596. doi:10.1044/2020_JSLHR-20-00060
Traser L., Burdumy M., Richter B., Vicari M., Echternach M. (2013). The effect of supine and upright position on vocal tract configurations during singing–a comparative study in professional tenors. J. Voice 27, 141–148. doi:10.1016/j.jvoice.2012.11.002
Traser L., Birkholz P., Flügge T., Kamberger R., Burdumy M., Richter B., et al. (2017). Relevance of the implementation of teeth in three-dimensional vocal tract models. J. Speech Lang. Hear. Res. 60, 2379–2393. doi:10.1044/2017_JSLHR-S-16-0395
Traser L., Burk F., Özen A. C., Burdumy M., Bock M., Blaser D., et al. (2021a). Respiratory kinematics and the regulation of subglottic pressure for phonation of pitch jumps – A dynamic mri study. PLOS ONE 15, 02445399–e244623. doi:10.1371/journal.pone.0244539
Traser L., Schwab C., Burk F., Özen A. C., Burdumy M., Bock M., et al. (2021b). The influence of gravity on respiratory kinematics during phonation measured by dynamic magnetic resonance imaging. Sci. Rep. 11, 22965. doi:10.1038/s41598-021-02152-y
Vampola T., Horáček J., Švec J. G. (2015). Modeling the influence of piriform sinuses and valleculae on the vocal tract resonances and antiresonances. Acta Acust. United Acust. 101, 594–602. doi:10.3813/aaa.918855
Whalen D. H., Chen W.-R., Shadle C. H., Fulop S. A. (2022). Formants are easy to measure; resonances, not so much: Lessons from klatt (1986). J. Acoust. Soc. Am. 152, 933–941. doi:10.1121/10.0013410
Yanagisawa E., Estill J., Kmucha S. T., Leder S. B. (1989). The contribution of aryepiglottic constriction to “ringing” voice quality – A videolaryngoscopic study with acoustic analysis. J. Voice 3, 342–350. doi:10.1016/s0892-1997(89)80057-8
Yushkevich P. A., Piven J., Hazlett H. C., Smith R. G., Ho S., Gee J. C., et al. (2006). User-guided 3d active contour segmentation of anatomical structures: Significantly improved efficiency and reliability. Neuroimage 31, 1116–1128. doi:10.1016/j.neuroimage.2006.01.015
Zappi V., Vasuvedan A., Allen A., Raghuvanshi N., Fels S. (2016). “Towards real-time two-dimensional wave propagation for articulatory speech synthesis,” in Proceedings of Meetings on Acoustics, 171st Meeting of the Acoustical Society of America (Acoustical Society of America), 045005.
Keywords: MRI-data, phonation, finite-element-modeling, sound intensity, voice efficiency, vocal tract resonance, Estill voice training®
Citation: Fleischer M, Rummel S, Stritt F, Fischer J, Bock M, Echternach M, Richter B and Traser L (2022) Voice efficiency for different voice qualities combining experimentally derived sound signals and numerical modeling of the vocal tract. Front. Physiol. 13:1081622. doi: 10.3389/fphys.2022.1081622
Received: 27 October 2022; Accepted: 01 December 2022;
Published: 23 December 2022.
Edited by:
Dominik Obrist, University of Bern, SwitzerlandReviewed by:
Byron Erath, Clarkson University, United StatesPetr Svacek, Czech Technical University in Prague, Czechia
Copyright © 2022 Fleischer, Rummel, Stritt, Fischer, Bock, Echternach, Richter and Traser. This is an open-access article distributed under the terms of the Creative Commons Attribution License (CC BY). The use, distribution or reproduction in other forums is permitted, provided the original author(s) and the copyright owner(s) are credited and that the original publication in this journal is cited, in accordance with accepted academic practice. No use, distribution or reproduction is permitted which does not comply with these terms.
*Correspondence: Mario Fleischer, bWFyaW8uZmxlaXNjaGVyQGNoYXJpdGUuZGU=