- 1Department of Physics, UC Irvine, Irvine, CA, United States
- 2Department of Physics, UC San Diego, La Jolla, CA, United States
- 3CoMMLab, Electronic Engineering Department, Universitat de Valencia, Valencia, Spain
- 4Stanford Cardiovascular Institute, Stanford University School of Medicine, Stanford, CA, United States
Background: Termination of atrial fibrillation (AF), the most common arrhythmia in the United States, during catheter ablation is an attractive procedural endpoint, which has been associated with improved long-term outcome in some studies. It is not clear, however, whether it is possible to predict termination using clinical data. We developed and applied three quantitative indices in global multielectrode recordings of AF prior to ablation: average dominant frequency (ADF), spectral power index (SPI), and electrogram quality index (EQI).
Methods: In N = 42 persistent AF patients (65 ± 9 years, 14% female) we collected unipolar electrograms from 64-pole baskets (Abbott, CA). We studied N = 17 patients in whom AF terminated during ablation (“Term”) and N = 25 in whom it did not (“Non-term”). For each index, we determined its ability to predict ablation by computing receiver operating characteristic (ROC) and calculated the area under the curve (AUC).
Results: The ADF did not differ for Term and Non-term patients at 5.28 ± 0.82 Hz and 5.51 ± 0.81 Hz, respectively (p = 0.34). Conversely, the SPI for these two groups was. 0.85 (0.80–0.92) and 0.97 (0.93–0.98) and the EQI was 0.61 (0.58–0.64) and 0.56 (0.55–0.59) (p < 0.0001). The AUC for predicting AF termination for the SPI was 0.85 ([0.68, 0.95] 95% CI), and for the EQI, 0.86 ([0.72, 0.95] 95% CI).
Conclusion: Both the EQI and the SPI may provide a useful clinical tool to predict procedural ablation outcome in persistent AF patients. Future studies are required to identify which physiological features of AF are revealed by these indices and hence linked to AF termination or non-termination.
Introduction
Atrial fibrillation (AF) is the most common cardiac arrhythmia in the world and currently affects more than five million people in the United States alone (Chugh et al., 2014; Calkins et al., 2018). AF is associated with increased risk for stroke and morbidity. There is increasing evidence that early intervention for AF, either by drug therapy or ablation, can reduce long-term adverse outcomes (Kirchhof et al., 2020), yet both forms of therapy are suboptimal. Pulmonary vein isolation (PVI) to electrically isolate the pulmonary veins is the cornerstone of ablation treatment (Haissaguerre et al., 1998), but is only modestly effective with a 1-year success rate in persistent AF patients of 50–60% (Calkins et al., 2017). Several additional ablation procedures have been proposed yet with varying outcomes, such as targeting complex fractionated electrograms (Nademanee et al., 2004; Knecht et al., 2008), rotational and focal sources (Narayan et al., 2012; Ramirez et al., 2017; Baykaner et al., 2018), posterior wall isolation (Lee et al., 2019; Pothineni et al., 2021; Chieng et al., 2022) and others. It would be useful to track AF ablation intraprocedurally, to determine if the current strategy is effective in this patient or whether additional lesions are warranted.
Currently, there is no quantitative metric that can reliably predict whether ablation will result in AF termination or not. Such a metric may be procedurally useful. In addition, some studies have shown that acute termination during ablation is associated with improved long-term outcome (O'Neill et al., 2009; Scherr et al., 2015; Heist et al., 2012; Zhou et al., 2013; Park et al., 2012; Schreiber et al., 2015; Rostock et al., 2011). Furthermore, a reliable metric may provide insights into the spatio-temporal activation patterns that underlie AF.
In this study, we developed and compared the ability of three different quantitative indices to predict whether a uniform ablation strategy resulted in AF termination to either sinus rhythm (SR) or atrial tachycardia (AT), or failed to terminate AF. Our indices were computed using unipolar electrograms from 64-pole baskets, measured over a prolonged time (60 s). The indices consisted of the average dominant frequency (ADF), the DF averaged over all electrograms, the spectral power index (SPI), a measure of the power contained in the power spectrum close to the dominant frequency relative to the total power in the spectrum, and a novel electrogram quality index (EQI), a measure of the relative amplitude of the most prominent peak of the time derivative of electrograms in repeated intervals. These indices were tested in N = 42 patients, divided into N = 17 patients that did (“Term”) and N = 25 patients that did not (“Non-term”) terminate during the procedure.
Methods
We studied 42 patients with persistent AF (defined as patients in whom AF lasted longer than 7 days) referred for ablation at Stanford University Hospital, Palo Alto, CA for standard indications. Of these patients, N = 17 terminated acutely during the ablation procedure, while N = 25 did not. All patients had failed at least one anti-arrhythmic medication, were >18 years and none had contra-indications to ablation. All patients provided written informed consent and this study was approved by our Institutional IRB.
Data acquisition
No electrical cardioversion was applied at the beginning of the procedure and patients who presented in sinus rhythm were paced into AF. AF was mapped using 64 pole contact baskets (FIRMap, Abbott) for 60 s. The baskets were positioned in LA for AF mapping, based upon 3-dimensional electroanatomic imaging (NavX, St Jude Medical, Sylmar, CA; or Carto, Biosense-Webster, Diamond Bar, CA). This catheter consists of eight splines, each with eight electrodes, totaling 64 electrodes, which improves over older designs and covers >70% of the LA (Honarbakhsh et al., 2017). Within a spline, electrodes are separated by 4–6 mm, and spacing between splines is mostly within 20% of that range (Honarbakhsh et al., 2017). Ablation was guided prospectively at regions of interest identified by a commercial system (RhythmView™, Abbott, Inc.).
Endocardial ablation was used using 3.5 mm irrigated-tip catheters (SmartTouch®, Biosense Webster; FlexAbilityTM, Abbott) targeting 30–35 W at 10–20 g force. The primary goal was to perform pulmonary vein isolation assessed by the endpoint of entrance block. Additional lesions were patient-tailored. Selected sites were ablated to cover 2–3 cm regions, to an endpoint of voltage < 0.5 mV. Ablation at any site was abandoned if the esophagus was heated by > 1.5 C despite reduced power or high power short-duration lesions (50W, 6 s), or that overlay regions of phrenic nerve capture. Electrical cardioversion was applied if AF had not terminated (non-termination group).
Data export
Unipolar electrograms were recorded at 1 kHz sampling and the QRS complex was removed by computing an average QRS complex and subtracting it from electrograms as detailed before (Alhusseini et al., 2017).
Data analysis
The Dominant Frequency (DF) was computed for each electrode from the Power Spectral Density (PSD) of the unipolar electrogram using a Welch Periodogram (50% overlapping, 4 s length Hamming window) and a frequency interval between 0 and 20 Hz. The ADF for each patient was then computed as the mean of the DF of all 64 electrodes.
To compute the Spectral Power Index (SPI) of an electrogram (Figure 1), we first determined the spectral power of the DF (PDF) and defined a threshold αPDF, where α is a value between 0 and 1. This threshold was introduced to remove the noise floor in the signal. Second, we determined all frequencies with a power larger than αPDF and within an interval of width 2Δf symmetrically located around the DF: DF±Δf. The sum of the power for these frequencies was computed as Pint. The SPI was then defined as the ratio of Pint and the sum of the power for all frequencies between 0 and 20 Hz that were above αPDF, Pall: SPI = Pint/Pall. This procedure is shown in Figure 1, where we have plotted a sample power spectrum of one of the electrograms. The threshold, here taken to be α = 0.1, is shown as a green line while the interval around the DF is indicated as dashed red lines and shown using Δf = 4 Hz. Note that the SPI can take on values between 0 and 1. Specifically, for noisy signals, with a broad peak, we expect that most power is concentrated around the DF. This signal will have a high SPI value. For more regular signals, we expect a narrow peak and more power in harmonics (corresponding to whole number multiples the peak frequency), resulting in a low SPI value. Figure 2A shows a power spectrum of an electrogram with a high SPI (SPI = 0.95). In this case, all power above the threshold, here chosen to be α = 0.2, resided within the interval DF±Δf, with Δf = 3 Hz. As a comparison, Figure 2B shows a power spectrum of an electrogram with the low SPI value (SPI = 0.65). In this case, for the same values of the parameters α and Δf, significant amount power is distributed at frequencies outside the interval around DF.
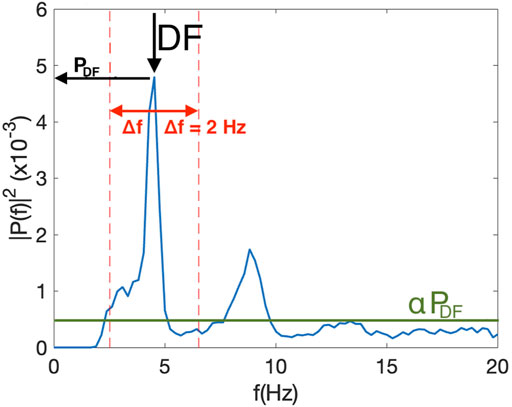
FIGURE 1. Example of the single sided power spectrum of one of the electrograms used to calculate the DF and the SPI. The threshold, a fraction α of the peak at the DF, αPDF, is plotted as a green line using α = 0.1 while the interval around the DF, indicated by the arrow, is plotted as dashed red lines, and shown using Δf = 2 Hz. In this example, SPI = 0.67 and DF = 4.53 Hz.
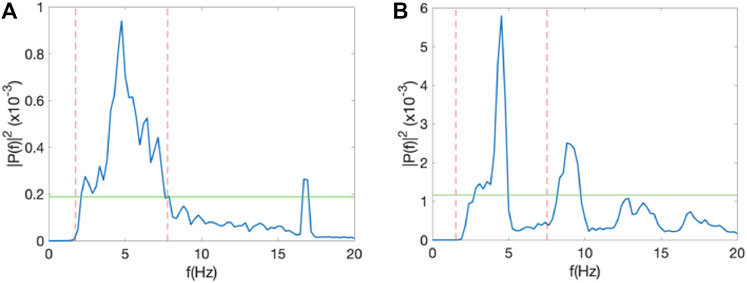
FIGURE 2. SPI analysis. (A) Power spectrum of one of the electrodes of a 55 year-old female in which AF did not terminate during the procedure, corresponding to an SPI value of 0.95, computed using α = 0.2 and Δf = 3 Hz. (B) As in A, but for a 51 year-old male in which AF terminated during the procedure with an SPI value of 0.65.
For the Electrogram Quality Index (EQI), we processed each electrogram v(t) with a bandpass filter from 2.5 Hz to 30 Hz as a combination of a low-pass and a high-pass Butterworth filter of fourth order, respectively. Additionally, we applied a fourth order Butterworth notch filter between 55 and 65 Hz to eliminate 60 Hz noise. To calculate the period T of the signal, we used the first peak in the autocorrelation at non-zero time of v(t), smoothed using a zero-phase digital filter. We computed the first derivate with respect to time,
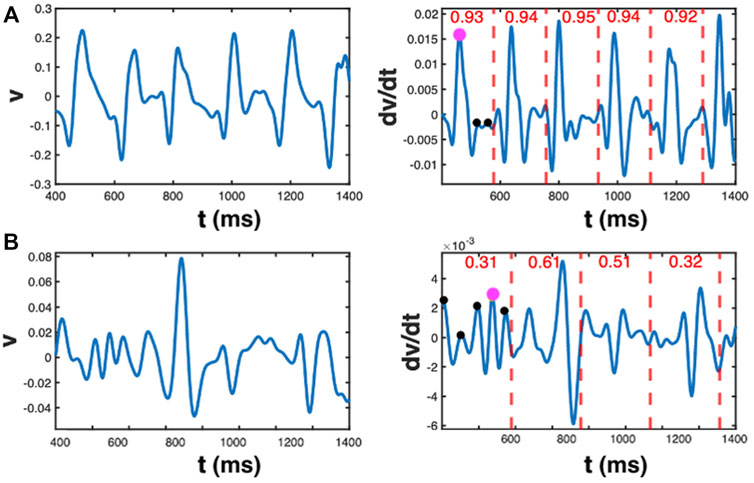
FIGURE 3. EQI analysis. (A) Unipolar trace (left panel) and its time derivative (right panel) for an electrogram with large values of Qi. The value of Qi is reported in the right panel for each time interval, indicated by the red dashed lines. It quantifies the normalized difference between the maximum value of dv/dt and the sum of all other positive maxima within the interval. These dots are marked for the first interval in magenta and black, respectively. The EQI is computed as the average value of Qi for each time interval. (B) As in A, but now for an electrogram with small values of Qi (reported in the right panel).
The electrogram quality index was then calculated as the average of
Statistics
Data are reported as mean ± standard deviation for normally distributed data and statistical significance was calculated using a two tailed t-test. For data that were not normally distributed, data are reported as median (interquartile 1 - inter quartile 3) and the significance was evaluated with the Wilcoxon rank sum test using the “ranksum” function in MATLAB. A p-value < 0.05 was considered statistically significant. Receiver Operating Characteristic Curves (ROC curves) were computed using the built in MATLAB “perfcurve” function and confidence intervals (CIs) of the area under curve (AUC) values were estimated using a non-parametric bootstrap algorithm, using 10,000 iterations.
As a sensitivity analysis, the AUC values were also computed by performing 5,000 iterations in which 5 randomly selected patients were removed from the total cohort. Results form this analysis are reported as median (interquartile 1 - inter quartile 3). Finally, the ROC analysis was repeated by removing outliers in the data set, defined as values that were either 3 standard deviations from the mean (for normal distributions) or 1.5 times the interquartile range (IQR) above the third quartile or below the first quartile (for non-normal distributions).
Results
Patient demographics
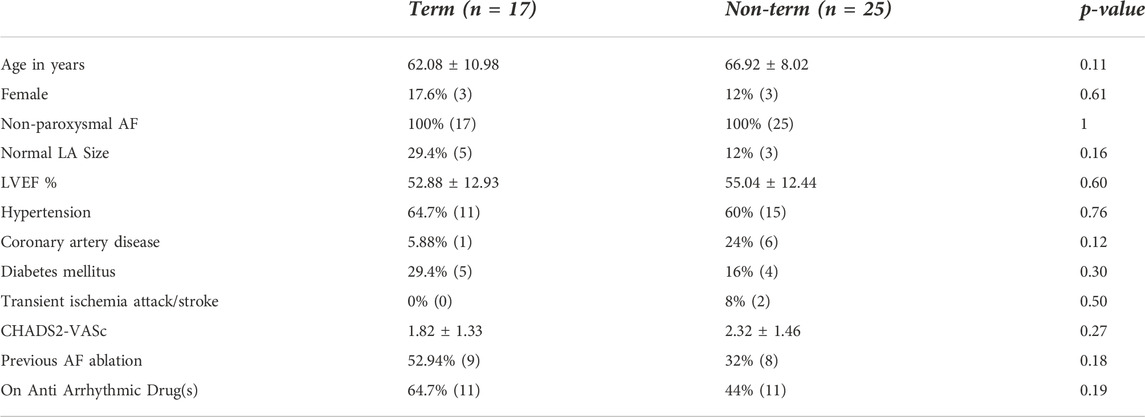
Table 1 provides the clinical details for the patients in the termination and non-termination cohort. The two groups did not differ significantly in any characteristic.
Average dominant frequency (ADF)
We first determined the ADF using the PSD of the electrograms. The histograms of the ADF values, averaged over all electrograms for each patient, are shown in Figure 4A for both the Term (blue) and Non-term groups (red). For the termination patients, we found that the ADF was 5.28 ± 0.82 Hz while for the non-termination patients this value was 5.51 ± 0.81 Hz (p = 0.34). These histograms did not contain any outliers (Methods).
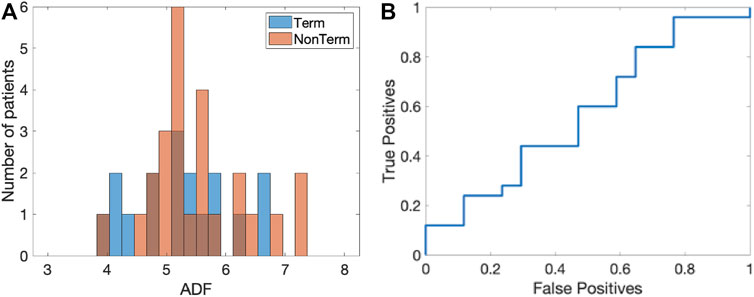
FIGURE 4. ADF analysis. (A) Histogram of the ADF value for the Term (blue) and Non-term groups (red). (B) Corresponding ROC curve with an AUC = 0.57 ([0.38, 0.75] 95% CI).
To determine whether this quantity was able to distinguish between termination and non-termination patients, we computed the corresponding receiver operating characteristic (ROC) (Figure 4B). We calculated the area under the curve (AUC) and found that it was 0.57 ([0.38, 0.75] 95% CI). The sensitivity analysis (Methods) resulted in a median AUC that was unaltered, with a small IQR: 0.57 (0.55–0.60).
Spectral power index (SPI)
We next determined whether the shape of the peak in the power spectrum was significantly different between the termination and non-termination patients. For this, we computed the SPI, which ranges between 0 and one and which represents a measure of the power around the DF relative to the total power (Methods).
We computed the SPI for each patient as the mean value over all electrograms as a function of the two parameters α and Δf in the analysis (Methods). After having obtained the SPI values for both patient groups, we determined the ROC and corresponding AUC. The result of this grid search is presented in Figure 5A, where we plot the AUC using a color scheme with low/high values shown in blue/yellow. The maximum AUC value was found to be 0.85 ([0.68, 0.95] 95% CI) corresponding to a threshold of α = 0.18 and a frequency interval around the DF of Δf = 3.6 Hz. For these parameter values, the mean SPI for the termination patients was 0.85 (0.80–0.92) while for the non-termination patients it was 0.97 (0.93–0.98) (p < 0.001). This significance was retained when adding any of the patient characteristics to the SPI in a logistic regression model. After removing one outlier in each data set, the AUC only changed to 0.86 while the sensitivity analysis resulted in an identical AUC with a small IQR: AUC = 0.85 (0.83–0.87). We also performed this grid search using the median value of the SPI of all electrograms, with the results illustrated in Figure 5B. Using this median value, we found a maximum AUC of 0.82 ([0.65, 0.93] 95% CI) using a threshold α = 0.14 and a frequency interval of Δf = 4.0 Hz.
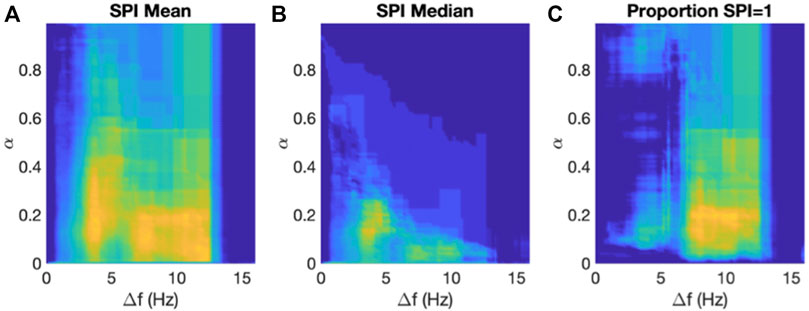
FIGURE 5. Results of the SPI analysis. (A) The AUC of the ROCs computed using the mean SPI as a function of the two parameters in the algorithm, α and Δf, plotted using a color scale with AUC = 0.5 corresponding to blue and AUC = 0.9 corresponding to yellow. (B) As in A but now using the median value of the SPI. (C) As in A but now using the proportion of channels with SPI = 1.
Finally, we asked whether the termination patients had more electrograms with SPI = 1 than non-termination patients. To address this question, we calculated for each patient the proportion of electrograms with an SPI value equal to 1, again using a grid search in threshold and frequency interval. For this comparison, we found a maximum AUC of 0.86 (([0.71, 0.95] 95% CI) using a threshold of α = 0.2 and a frequency interval of Δf = 10.4 Hz (Figure 5C). For these parameters, the average proportion of electrograms with SOI = 1 in termination patients was 0.91 (0.65–0.96) while this value was 1.00 (0.96–1.00) for non-termination patients (p < 0.001).
Electrogram quality index (EQI)
As a final quantity, we computed the EQI for each patient, averaged over all electrograms. The histograms of the EQI for the termination (blue) and non-termination patients (red) are shown in Figure 6A. The median EQI for the termination group was 0.61 (0.58–0.64) while that for the non-termination group was 0.56 (0.55–0.59) (p < 0.0001). As was the case for the SPI, this significance was retained when combining the EQI and any single patient characteristic in a logistic regression model. The ROC curve for this analysis is plotted in Figure 6B and has an AUC of 0.86 ([0.72, 0.95] 95% CI). Finally, one outlier was identified in the Term patients and removing this outlier did not change the AUC while the sensitive analysis resulted in an AUC value of 0.86 (0.85–0.88).
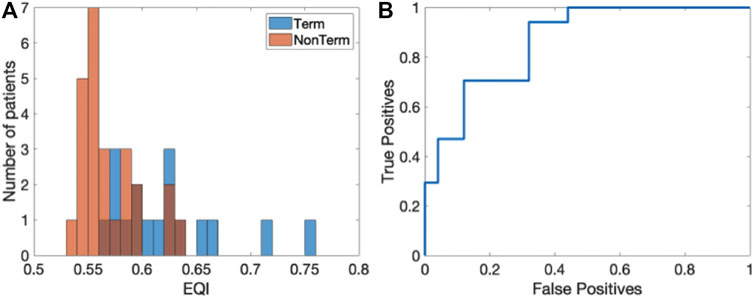
FIGURE 6. Results of the EQI analysis. (A) Histograms of EQI for the termination (blue) and non-termination patients (red). (B) ROC curve for the EQI analysis (AUC = 0.86 ([0.72,0.95] 95% CI)).
Discussion
In this study we show that novel indices of electrograms in patients with persistent AF can identify those in whom AF did or did not terminate by ablation.
Usefulness of AF termination
While the utility of AF termination during ablation is debated, there are few other procedural endpoints beyond isolation of the pulmonary veins. AF termination has been shown in several studies to be associated with improved long-term outcome (O'Neill et al., 2009; Scherr et al., 2015; Heist et al., 2012; Zhou et al., 2013; Park et al., 2012; Schreiber et al., 2015; Rostock et al., 2011). For example, using a stepwise ablation procedure that involved pulmonary vein isolation, electrogram-guided, and linear ablation, it was shown that inability to terminate AF during ablation was the strongest predictor of arrhythmia recurrence (Scherr et al., 2015). Other studies have failed to show this association and that further studies are required to reconcile the divergent clinical outcomes (Estner et al., 2008; Elayi et al., 2010; Wang et al., 2018). Nevertheless, termination remains the only acute endpoint that correlates with long-term outcome and knowing whether termination is achievable could enable an electrophysiologist to add or constrain lesion sets accordingly.
Previous studies predicting AF termination
A number of previous studies have investigated whether patient characteristics can predict acute AF termination in catheter ablation. In one study, a cohort of persistent AF patients with a similar size to the current study (N = 38, with 18 termination patients) was examined (Combes et al., 2013). Several patient characteristics were found to be significantly associated with AF termination during ablation, including left ventricular ejection fraction and left atrial area. However, in a multivariable analysis, only the left atrial appendage peak flow velocity remained significant, with the termination group having a larger velocity (p = 0.04). The corresponding AUC was found to be 0.81. In another study, N = 70 persistent AF patients, of whom 14 terminated, were investigated (Kumagai et al., 2013). Again, it was found that the left atrial appendage contraction velocity was significantly decreased in the non-termination group and was an independent predictor of termination. No AUC value was reported but this study also showed that patients that terminated during ablation had a higher AF-free survival after 1 year than patients that needed cardioversion. In future studies, it would be interesting to combine this patient characteristic with our newly developed indices.
Indices in our study
The ADF metric, which quantifies the frequency of the peak in the power spectrum, averaged over all electrograms, was not able to distinguish between the two patient groups. This suggests that the overall average ‘rate’ of AF within the atrium may not separate patient groups. The average DF value between the two groups (5.28 Hz vs 5.51 Hz) was not significantly different and the AUC value of the ROC was close to 0.5 (0.57). These ADF values were consistent with those reported in a recent previous study (Rodrigo et al., 2021). Note that we did not use the location of DF sites to guide ablation (Atienza et al., 2009).
Contrary to the ADF index, both the SPI and EQI had average values that differed significantly between patients with and without AF termination. These indices provided promising AUCs (0.85 and 0.86, respectively), indicating that they may be clinically useful. The SPI quantifies the amount of power contained within a certain frequency band around the DF relative to the power contained in the entire 0–20Hz interval. This SPI is a function of two parameters: the width of this frequency band and the threshold value above which the power is considered.
SPI is distinct from previous spectral organizational indices, such as those which computed a regularity index that involved the power within a fixed interval around the DF (Skanes et al., 1998; Sanders et al., 2005; Rodrigo et al., 2021). Using a systematic search, in which we varied the values of these two parameters, we found a set of parameters that optimized the AUC of the ROC. Our results indicated that, on average, the Term patients had more power in their PSD outside the interval around the DF than Non-term patients. In other words, the Non-term patients had more noisy signals, resulting in a broad peak within the interval around the DF while the Term patients had narrower peaks, with more power in harmonics that were outside this interval.
The newly introduced EQI is computed using the time derivative of the electrogram and quantifies the amplitude of the peak, relative to all other peaks in intervals of length T, the correlation time. This is equivalent to the magnitude of the slope of the electrogram, which has long been used to identify tissue activation (Colli-Franzone et al., 1982; Steinhaus, 1989; Kuklik et al., 2015). EQI is determined by first computing T in the electrogram and then, using contiguous windows of size T, determining the value of the maximum amplitude of the derivative relative to all other maxima of the derivative. Thus, an electrogram with either several near-equal valued maxima or with poorly identifiable peak values of the derivative in most intervals will have a small EQI. In contrast, very regular electrograms with a clearly identifiable and large derivative peak will result in a large EQI. We have verified that this computation is insensitive to the start time of the first time window (Supplementary Figure S1). In contrast to the SPI, the EQI does not depend on adjustable parameters and did not require fine tuning to achieve an optimal AUC. The EQI was significantly higher in the Term compared to the Non-term patients, indicating that the electrogram shapes of the Term group exhibited peaks in their time derivative that were more clearly identifiable. Activation patterns in this group determined using algorithms based on electrogram shapes may therefore be less prone to noise. This could result in better identification of rotational sources, better guidance for targeted ablation, and could result in acute termination.
Our results were computed using the simultaneous recordings from 64 electrograms, obtained from a basket catheter inserted into the left atrium. Thus, and distinct from other studies that used single recording electrodes, we were able to obtain spatially averaged quantities since this basket covers >70% of the atrium. It would be interesting, however, to apply our indices to electrograms that are collected in a pointwise fashion. Furthermore, we used recordings with a prolonged duration (60s), which reduces the likelihood of spurious results.
Our results indicate that both the SPI and the EQI may be a useful tool to predict whether ablation results in acute termination or not. Furthermore, our finding that the SPI and EQI are significantly different in Term than in Non-term patients may indicate a difference in atrial organization in these patient groups.
Limitations
Our cohort size was moderate (N = 42) and replication in larger samples with external validation is needed. We are currently planning to expand the analysis to larger patient groups. Furthermore, we did not use the indices to prospectively predict outcome, or to guide ablation strategy. In addition, although studies have shown that acute termination during ablation correlates with long-term outcome, this study did not report any follow-up results. We are currently planning to determine whether the metrics are able to predict long-term outcome in AF patients.
Data availability statement
The raw data supporting the conclusion of this article will be made available by the authors, without undue reservation.
Ethics statement
The studies involving human participants were reviewed and approved by Institutional IRB Board, Stanford University. The patients/participants provided their written informed consent to participate in this study.
Author contributions
CK and MR performed the computational analysis. SN provided the clinical data. PG and MR organized the data base. W-JR designed the study and wrote the first draft. All authors contributed to manuscript revision, read, and approved the submitted version.
Funding
This work was supported in part by grants from the National Institutes of Health to W-JR (HL122384) and SN (HL149134 and HL83359).
Acknowledgments
We thank Paul Clopton for many valuable discussions.
Conflict of interest
The authors declare that the research was conducted in the absence of any commercial or financial relationships that could be construed as a potential conflict of interest.
Publisher’s note
All claims expressed in this article are solely those of the authors and do not necessarily represent those of their affiliated organizations, or those of the publisher, the editors and the reviewers. Any product that may be evaluated in this article, or claim that may be made by its manufacturer, is not guaranteed or endorsed by the publisher.
Supplementary material
The Supplementary Material for this article can be found online at: https://www.frontiersin.org/articles/10.3389/fphys.2022.939350/full#supplementary-material
References
Alhusseini M., Vidmar D., Meckler G. L., Kowalewski C., Shenasa F., Wang P. J., et al. (2017). Two independent mapping techniques identify rotational activity patterns at sites of local termination during persistent atrial fibrillation. J. Cardiovasc. Electrophysiol. 28, 615–622. doi:10.1111/jce.13177
Atienza F., Almendral J., Jalife J., Zlochiver S., Ploutz-Snyder R., Torrecilla E. G., et al. (2009). Real-time dominant frequency mapping and ablation of dominant frequency sites in atrial fibrillation with left-to-right frequency gradients predicts long-term maintenance of sinus rhythm. Heart rhythm. 6, 33–40. doi:10.1016/j.hrthm.2008.10.024
Baykaner T., Rogers A. J., Meckler G. L., Zaman J., Navara R., Rodrigo M., et al. (2018). Clinical implications of ablation of drivers for atrial fibrillation: A systematic review and meta-analysis. Circ. Arrhythm. Electrophysiol. 11, e006119. doi:10.1161/CIRCEP.117.006119
Calkins H., Hindricks G., Cappato R., Kim Y-H., Saad E. B., Aguinaga L., et al. (2018). 2017 HRS/EHRA/ECAS/APHRS/SOLAECE expert consensus statement on catheter and surgical ablation of atrial fibrillation: Executive summary. Europace 20, 157–208. doi:10.1093/europace/eux275
Calkins H., Hindricks G., Cappato R., Kim Y. H., Saad E. B., Aguinaga L., et al. (2017). 2017 HRS/EHRA/ECAS/APHRS/SOLAECE expert consensus statement on catheter and surgical ablation of atrial fibrillation: Executive summary. Heart rhythm. 14, e445–e494. doi:10.1016/j.hrthm.2017.07.009
Chieng D., Sugumar H., Ling L-H., Segan L., Azzopardi S., Prabhu S., et al. (2022). Catheter ablation for persistent atrial fibrillation: A multicenter randomized trial of pulmonary vein isolation (PVI) versus PVI with posterior left atrial wall isolation (PWI)-The capla study. Am. Heart J. 243, 210–220. doi:10.1016/j.ahj.2021.09.015
Chugh S. S., Havmoeller R., Narayanan K., Singh D., Rienstra M., Benjamin E. J., et al. (2014). Worldwide epidemiology of atrial fibrillation: A global burden of disease 2010 study. Circulation 129, 837–847. doi:10.1161/CIRCULATIONAHA.113.005119
Colli-Franzone P., Guerri L., Viganotti C., Macchi E., Baruffi S., Spaggiari S., et al. (1982). Potential fields generated by oblique dipole layers modeling excitation wavefronts in the anisotropic myocardium. Comparison with potential fields elicited by paced dog hearts in a volume conductor. Circ. Res. 51, 330–346. doi:10.1161/01.res.51.3.330
Combes S., Jacob S., Combes N., Karam N., Chaumeil A., Guy-Moyat B., et al. (2013). Predicting favourable outcomes in the setting of radiofrequency catheter ablation of long-standing persistent atrial fibrillation: A pilot study assessing the value of left atrial appendage peak flow velocity. Arch. Cardiovasc. Dis. 106, 36–43. doi:10.1016/j.acvd.2012.09.002
Elayi C. S., Di Biase L., Barrett C., Ching C. K., Al Aly M., Lucciola M., et al. (2010). Atrial fibrillation termination as a procedural endpoint during ablation in long-standing persistent atrial fibrillation. Heart rhythm. 7, 1216–1223. doi:10.1016/j.hrthm.2010.01.038
Estner H. L., Hessling G., Ndrepepa G., Luik A., Schmitt C., Konietzko A., et al. (2008). Acute effects and long-term outcome of pulmonary vein isolation in combination with electrogram-guided substrate ablation for persistent atrial fibrillation. Am. J. Cardiol. 101, 332–337. doi:10.1016/j.amjcard.2007.08.053
Haissaguerre M., Jais P., Shah D. C., Takahashi A., Hocini M., Quiniou G., et al. (1998). Spontaneous initiation of atrial fibrillation by ectopic beats originating in the pulmonary veins. N. Engl. J. Med. 339, 659–666. doi:10.1056/NEJM199809033391003
Heist E. K., Chalhoub F., Barrett C., Danik S., Ruskin J. N., Mansour M. (2012). Predictors of atrial fibrillation termination and clinical success of catheter ablation of persistent atrial fibrillation. Am. J. Cardiol. 110, 545–551. doi:10.1016/j.amjcard.2012.04.028
Honarbakhsh S., Schilling R. J., Providência R., Dhillon G., Sawhney V., Martin C. A., et al. (2017). Panoramic atrial mapping with basket catheters: A quantitative analysis to optimize practice, patient selection, and catheter choice. J. Cardiovasc. Electrophysiol. 28, 1423–1432. doi:10.1111/jce.13331
Kirchhof P., Camm A. J., Goette A., Brandes A., Eckardt L., Elvan A., et al. (2020). Early rhythm-control therapy in patients with atrial fibrillation. N. Engl. J. Med. 383, 1305–1316. doi:10.1056/NEJMoa2019422
Knecht S., Hocini M., Wright M., Lellouche N., O'Neill M. D., Matsuo S., et al. (2008). Left atrial linear lesions are required for successful treatment of persistent atrial fibrillation. Eur. Heart J. 29, 2359–2366. doi:10.1093/eurheartj/ehn302
Kuklik P., Zeemering S., Maesen B., Maessen J., Crijns H. J., Verheule S., et al. (2015). Reconstruction of instantaneous phase of unipolar atrial contact electrogram using a concept of sinusoidal recomposition and Hilbert transform. IEEE Trans. Biomed. Eng. 62, 296–302. doi:10.1109/TBME.2014.2350029
Kumagai K., Sakamoto T., Nakamura K., Hayano M., Yamashita E., Oshima S. (2013). Pre-procedural prediction of termination of persistent atrial fibrillation by catheter ablation as an indicator of reverse remodeling of the left atrium. Circ. J. 77, 1416–1423. CJ-12-0934. doi:10.1253/circj.cj-12-0934
Lee J. M., Shim J., Park J., Yu H. T., Kim T-H., Park J-K., et al. (2019). The electrical isolation of the left atrial posterior wall in catheter ablation of persistent atrial fibrillation. JACC. Clin. Electrophysiol. 5, 1253–1261. doi:10.1016/j.jacep.2019.08.021
Nademanee K., McKenzie J., Kosar E., Schwab M., Sunsaneewitayakul B., Vasavakul T., et al. (2004). A new approach for catheter ablation of atrial fibrillation: Mapping of the electrophysiologic substrate. J. Am. Coll. Cardiol. 43, 2044–2053. doi:10.1016/j.jacc.2003.12.054
Narayan S. M., Krummen D. E., Shivkumar K., Clopton P., Rappel W-J., Miller J. (2012). Treatment of atrial fibrillation by the ablation of localized sources: CONFIRM (conventional ablation for atrial fibrillation with or without focal impulse and rotor modulation) trial. J. Am. Coll. Cardiol. 60, 628–636. doi:10.1016/j.jacc.2012.05.022
O'Neill M. D., Wright M., Knecht S., Jaïs P., Hocini M., Takahashi Y., et al. (2009). Long-term follow-up of persistent atrial fibrillation ablation using termination as a procedural endpoint. Eur. Heart J. 30, 1105–1112. doi:10.1093/eurheartj/ehp063
Park Y. M., Choi J. I., Lim H. E., Park S. W., Kim Y. H. (2012). Is pursuit of termination of atrial fibrillation during catheter ablation of great value in patients with longstanding persistent atrial fibrillation? J. Cardiovasc. Electrophysiol. 23, 1051–1058. doi:10.1111/j.1540-8167.2012.02370.x
Pothineni N. V. K., Lin A., Frankel D. S., Supple G. E., Garcia F. C., Lin D., et al. (2021). Impact of left atrial posterior wall isolation on arrhythmia outcomes in patients with atrial fibrillation undergoing repeat ablation. Heart Rhythm O2 2, 489–497. doi:10.1016/j.hroo.2021.07.004
Ramirez F. D., Birnie D. H., Nair G. M., Szczotka A., Redpath C. J., Sadek M. M., et al. (2017). Efficacy and safety of driver-guided catheter ablation for atrial fibrillation: A systematic review and meta-analysis. J. Cardiovasc. Electrophysiol. 28, 1371–1378. doi:10.1111/jce.13313
Rodrigo M., Waddell K., Magee S., Rogers A. J., Alhusseini M., Hernandez-Romero I., et al. (2021). Non-invasive spatial mapping of frequencies in atrial fibrillation: Correlation with contact mapping. Front. Physiol. 11, 611266. doi:10.3389/fphys.2020.611266
Rostock T., Salukhe T. V., Steven D., Drewitz I., Hoffmann B. A., Bock K., et al. (2011). Long-term single-and multiple-procedure outcome and predictors of success after catheter ablation for persistent atrial fibrillation. Heart rhythm. 8, 1391–1397. doi:10.1016/j.hrthm.2011.04.012
Sanders P., Berenfeld O., Hocini M., Jais P., Vaidyanathan R., Hsu L. F., et al. (2005). Spectral analysis identifies sites of high-frequency activity maintaining atrial fibrillation in humans. Circulation 112, 789–797. doi:10.1161/CIRCULATIONAHA.104.517011
Scherr D., Khairy P., Miyazaki S., Aurillac-Lavignolle V., Pascale P., Wilton S. B., et al. (2015). Five-year outcome of catheter ablation of persistent atrial fibrillation using termination of atrial fibrillation as a procedural endpoint. Circ. Arrhythm. Electrophysiol. 8, 18–24. doi:10.1161/CIRCEP.114.001943
Schreiber D., Rostock T., Fröhlich M., Sultan A., Servatius H., Hoffmann B. A., et al. (2015). Five-year follow-up after catheter ablation of persistent atrial fibrillation using the stepwise approach and prognostic factors for success. Circ. Arrhythm. Electrophysiol. 8, 308–317. doi:10.1161/CIRCEP.114.001672
Skanes A. C., Mandapati R., Berenfeld O., Davidenko J. M., Jalife J. (1998). Spatiotemporal periodicity during atrial fibrillation in the isolated sheep heart. Circulation 98, 1236–1248. doi:10.1161/01.cir.98.12.1236
Steinhaus B. M. (1989). Estimating cardiac transmembrane activation and recovery times from unipolar and bipolar extracellular electrograms: A simulation study. Circ. Res. 64, 449–462. doi:10.1161/01.res.64.3.449
Wang Yl, Liu X., Zhang Y., Jiang Wf, Zhou L., Qin M., et al. (2018). Optimal endpoint for catheter ablation of longstanding persistent atrial fibrillation: A randomized clinical trial. Pacing Clin. Electrophysiol. 41, 172–178. doi:10.1111/pace.13221
Keywords: atrial fibrillation, ablation, termination, computational analysis, electrograms
Citation: Kappel C, Reiss M, Rodrigo M, Ganesan P, Narayan SM and Rappel W-J (2022) Predicting acute termination and non-termination during ablation of human atrial fibrillation using quantitative indices. Front. Physiol. 13:939350. doi: 10.3389/fphys.2022.939350
Received: 09 May 2022; Accepted: 10 November 2022;
Published: 22 November 2022.
Edited by:
Gernot Plank, Medical University of Graz, AustriaReviewed by:
Oleg Aslanidi, King’s College London, United KingdomRaúl Alcaraz, University of Castilla-La Mancha, Spain
Copyright © 2022 Kappel, Reiss, Rodrigo, Ganesan, Narayan and Rappel. This is an open-access article distributed under the terms of the Creative Commons Attribution License (CC BY). The use, distribution or reproduction in other forums is permitted, provided the original author(s) and the copyright owner(s) are credited and that the original publication in this journal is cited, in accordance with accepted academic practice. No use, distribution or reproduction is permitted which does not comply with these terms.
*Correspondence: Wouter-Jan Rappel, cmFwcGVsQHBoeXNpY3MudWNzZC5lZHU=
†These authors have contributed equally to this work
 Cole Kappel
 Michael Reiss
 Miguel Rodrigo3
 Prasanth Ganesan
 Sanjiv M. Narayan
 Wouter-Jan Rappel