 Lilian Bai1†
 Yuchen Li
 Hefeng Huang
 Xinmei Liu
- 1Shanghai Key Laboratory of Embryo Original Diseases, The International Peace Maternity and Child Health Hospital, School of Medicine, Shanghai Jiao Tong University, Shanghai, China
- 2Obstetrics and Gynecology Hospital, Institute of Reproduction and Development, Fudan University, Shanghai, China
- 3Research Units of Embryo Original Diseases, Chinese Academy of Medical Sciences, Shanghai, China
- 4Key Laboratory of Reproductive Genetics, Ministry of Education, Department of Reproductive Endocrinology, Women’s Hospital, Zhejiang University School of Medicine, Hangzhou, China
Introduction: Preeclampsia is a disease that affects both the mother and child, with serious consequences. Screening the characteristic genes of preeclampsia and studying the placental immune microenvironment are expected to explore specific methods for the treatment of preeclampsia and gain an in-depth understanding of the pathological mechanism of preeclampsia.
Methods: We screened for differential genes in preeclampsia by using limma package. Gene Ontology, Kyoto Encyclopedia of Genes and Genomes, disease ontology enrichment, and gene set enrichment analyses were performed. Analysis and identification of preeclampsia biomarkers were performed by using the least absolute shrinkage and selection operator regression model, support vector machine recursive feature elimination, and random forest algorithm. The CIBERSORT algorithm was used to analyze immune cell infiltration. The characteristic genes were verified by RT-qPCR.
Results: We identified 73 differential genes, which mainly involved in reproductive structure and system development, hormone transport, etc. KEGG analysis revealed emphasis on cytokine–cytokine receptor interactions and interleukin-17 signaling pathways. Differentially expressed genes were dominantly concentrated in endocrine system diseases and reproductive system diseases. Our findings suggest that LEP, SASH1, RAB6C, and FLT1 can be used as placental markers for preeclampsia and they are associated with various immune cells.
Conclusion: The differentially expressed genes in preeclampsia are related to inflammatory response and other pathways. Characteristic genes, LEP, SASH1, RAB6C, and FLT1 can be used as diagnostic and therapeutic targets for preeclampsia, and they are associated with immune cell infiltration. Our findings contribute to the pathophysiological mechanism exploration of preeclampsia. In the future, the sample size needs to be expanded for data analysis and validation, and the immune cells need to be further validated.
1 Introduction
Preeclampsia, which is defined as new-onset hypertension and proteinuria after 20 weeks of pregnancy, impaired organ function, or subjective symptoms of preeclampsia in the absence of proteinuria, affects 2%–8% of all pregnancies in developed countries (The American College of Obstetricians and Gynecologists, 2020). Three-fifths of maternal deaths in the United States can be prevented and are often linked to missing diagnoses or delayed diagnostics (Petersen et al., 2019). Preeclampsia is a systemic hypertensive disorder that complicates pregnancy and is caused by placental abnormalities and systemic inflammation. Preeclampsia can lead to maternal, fetal, and infant mortality (Hutcheon et al., 2011; Lisonkova and Joseph, 2013). Studies have shown that there is a genetic predisposition for preeclampsia and that it is significantly associated with genetic variants associated with thrombosis, infection, oxidative stress, and the renin-angiotensin system (Williams and Broughton Pipkin, 2011; Jebbink et al., 2012; Rana et al., 2014). Therefore, screening genes characteristic of preeclampsia is expected to help explore specific treatment methods, gain insight into the pathological mechanisms of preeclampsia, and contribute to the use of tools to help determine pregnant women who are at high risk of preeclampsia before clinical manifestations (McCarthy et al., 2018; Henderson et al., 2021).
Recently, bioinformatics analysis has been used to identify new genes as biomarkers for disease diagnosis and prognosis (Cao et al., 2019). “Machine learning” generally refers to the process of fitting prediction models to data or identifying information grouping in data. Machine learning is essentially an attempt to mimic the ability of humans to recognize patterns through computation but in a more objective way (Greener et al., 2022). For preeclampsia, early detection improves prognosis, but there are currently no reliable screening tests to predict its development, especially in term pregnancy when the disease burden is greatest. Many potential biomarkers have been identified through exploratory studies using established disease samples. Combining biomarkers from multiple organ and cellular sources may yield the best predictive results (MacDonald et al., 2022). To this end, researchers have been exploring first-trimester biochemical markers that may help identify women at risk of developing hypertensive disorders of pregnancy. One study found that the placental immune function of patients with preeclampsia was altered. Proteasomes, spliceosomes, ribosomes, and mitochondria were abnormally active in the new villi cytotrophoblast cell types (Zhang et al., 2021). In addition, a protein encoded by a differentially expressed mRNA in maternal serum, Follistatinlike 3 (FSTL3), has been reported to be able to predict preeclampsia and FGR (Gong et al., 2021). Notably, studies have been conducted to measure circulating cell-free RNA (cfRNA) by liquid biopsy to study the development of pregnancy-related complications in a non-invasive manner, and they have demonstrated that cfRNA measurement can predict preeclampsia in early pregnancy (Moufarrej et al., 2022). Similarly, another study showed that cfRNA signatures from a single blood draw can track pregnancy progression at the placental, maternal, and fetal levels and robustly predict preeclampsia (Rasmussen et al., 2022). Despite significant progress in early prediction of preeclampsia risk, elucidation of the pathogenesis of preeclampsia remains a critical and ongoing area of research. The uncovering of pathogenesis will help to better understand the development of preeclampsia and allow for better diagnosis and treatment of the disease.
Recent research has suggested that immune cell infiltration plays an important role in the development of preeclampsia (Aneman et al., 2020). The maternal–fetal interface is composed of decidual stromal, decidual immune, and trophoblast cells (Yang et al., 2019). In early pregnancy, precise regulation of the maternal immune system aids in the successful implantation of the placenta (LaMarca et al., 2013). Maintenance of a normal pregnancy requires a balanced state of immune cells and cytokines from the maternal-fetal interface, and an unbalanced immune response can result in abnormal placental structure or angiogenesis (Sahay et al., 2014; LaMarca et al., 2016). Fortunately, emerging technologies have the potential to indicate imbalances that may lead to conditions such as preeclampsia. CIBERSORT is a method that quantifies the proportion of immune cells in preeclamptic and normal tissue samples based on gene expression profiles (Newman et al., 2015).
In the present study, we explored the relationship between immune cell infiltration and preeclampsia using CIBERSORT and the differences in immune cell infiltration between preeclamptic and normal pregnant women. We utilized two preeclampsia microarray datasets from the Gene Expression Omnibus (GEO) database and analyzed the differentially expressed genes (DEGs). We used a machine learning algorithm to screen and determine placentabiomarkers, and then validated these immune infiltration-related candidate genes in other cohorts. Then, we used placental samples from pregnant women to verify the predictions. Our analysis approach is shown in Figure 1. Herein, we discuss the association between the identified biomarkers and infiltrating immune cells. Our findings provide new insights for the exploration of the mechanisms underlying the development of preeclampsia and new insights for its diagnosis and treatment.
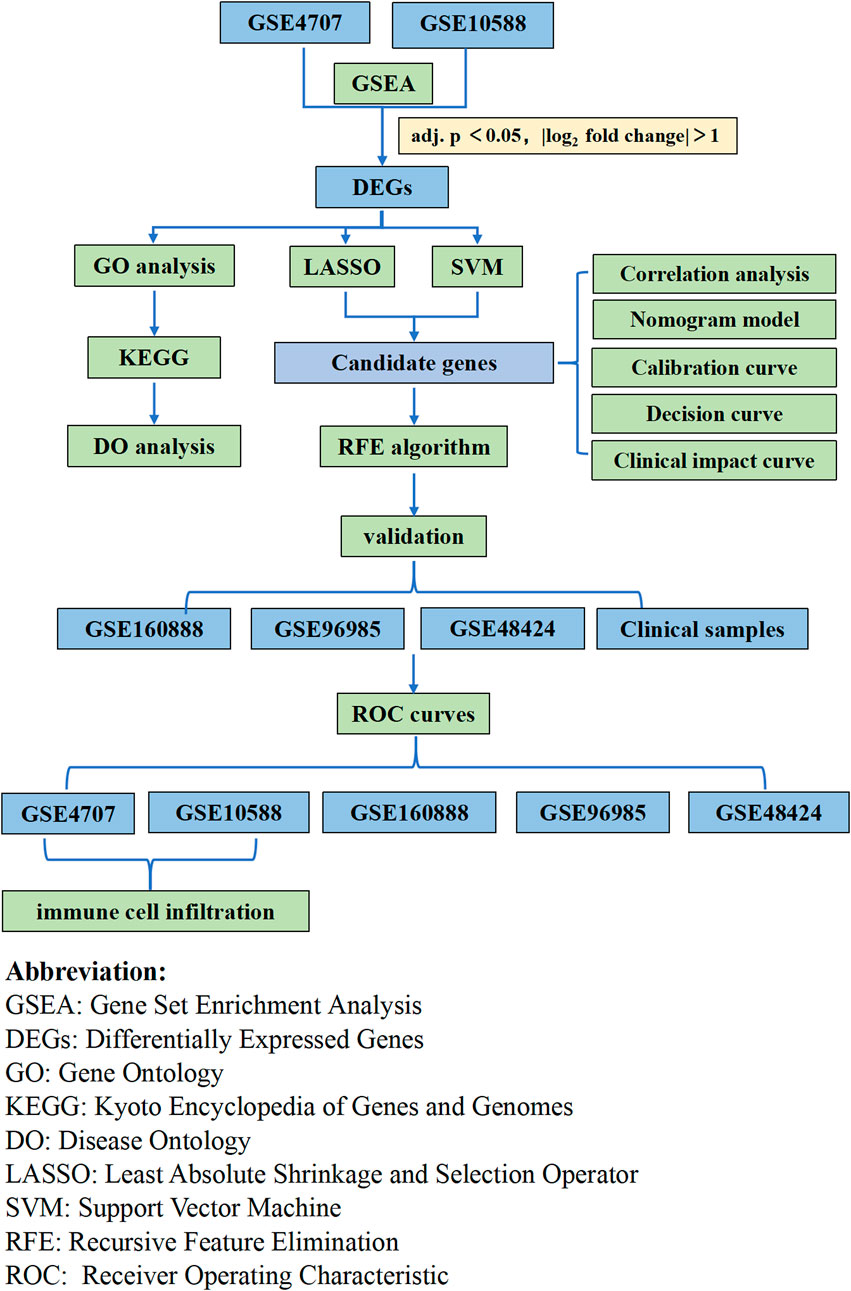
FIGURE 1. Flow chart of the whole analysis.
2 Materials and methods
2.1 Microarray data
The GSE4707 and GSE10588 datasets were downloaded from the GEO database (http://www.ncbi.nlm.nih.gov/geo/). GSE4707 was based on GPL1708, with an Agilent-012391 Whole Human Genome Oligo Microarray G4112A (Feature Number version), and placental biopsies were obtained from ten patients with preeclampsia and four women with normal pregnancies during Caesarean section. Chorionic tissue was dissected from a standardized location approximately 2 cm beside the umbilical cord insertion, from the middle layer of the placenta midway between maternal and fetal surfaces. In the GSE4707 dataset, there was no statistical difference in gestational age and weight in patients with preeclampsia compared with normal mothers, but neonatal weight in the preeclampsia group was significantly lower than neonatal weight in the normal group. GSE10588 was based on GPL2986 using ABI Human Genome Survey Microarray Version 2, and placental biopsies were obtained from 17 patients with preeclampsia and 26 women with normal pregnancies. A central area of chorionic tissue was dissected, and the maternal deciduas and amnionic membranes were removed. Scientists then dissected 1-cm-thick sections of placental villi from the central area between basal and chorionic plates. In the GSE10588 dataset, there were no statistical differences in maternal age, BMI, but patients with preeclampsia had lower gestational age and higher cesarean delivery rates compared to normal mothers. The probe in each data file was modified to a gene symbol according to its annotations in the probe file. If the same gene symbol corresponded to various probes, the diameter of the probe was assessed as the final expression value. Then, the results were merged for further analysis. Simultaneously, the function of the “SVA” package of R version 4.2.0 was used to eliminate the batch effect (Leek et al., 2012). We used the GSE160888 dataset according to Agilent-045997 Arraystar human lncRNA microarray V3, which included placental samples from four preeclampsia and four control cases. The placenta specimen was resected from the middle of the villous lobule. We also used GSE96985 based on Agilent-078298 human ceRNA array V1.0 4 × 180K, which included placental samples from four preeclampsia and three control cases. Using the method mentioned above, both datasets were combined as a validation cohort. The GSE48424 dataset, which was based on Agilent-014850 Whole Human Genome Microarray 4 × 44K G4112F and includes whole blood samples from 18 preeclampsia and 18 control cases, was also downloaded.
2.2 Data processing and DEG filtering
The two datasets were combined into a metadata queue, and the SVA package was used to eliminate the batch effect of the two datasets. The R limma package (http://www.bioconductor.org/) was used for background correction, normalization, and differential expression between array analyses. We used a false discovery rate-adjusted sample (false discovery rate adjusted; p < 0.05) and | log2 Fold Change | > 1 as the threshold point for DEGs.
2.3 Functional enrichment analysis
To determine the main biological properties of DEGs, Gene Ontology (GO) and Kyoto Encyclopedia of Genes and Genomes (KEGG) enrichment analyses were performed. The R packages “ggplot2” (Wickham, 2011), “enrich Plot”, and “clusterProfiler” (Yu et al., 2012) were used to create GO and KEGG enrichment plots. Disease ontology (DO) enrichment analysis was also conducted on DEGs using “clusterProfiler” and the “DOSE” software package in R (Yu et al., 2012; Yu et al., 2015). Through Gene Set Enrichment Analysis (GSEA), the most notable functional differences between the preeclampsia and control groups were verified (Subramanian et al., 2005). The study set c2.cp.go.v7.0. symbols, and the GMT from the Molecular Marker Database (MSigDB) were used as reference gene sets (Liberzon et al., 2015).
2.4 Diagnostic screening and correlation analysis of candidate biomarkers
We used three machine-learning algorithms to screen for important biomarkers of preeclampsia. The least absolute shrinkage and selection operator (LASSO) is a regression analysis algorithm that uses regularization to increase prediction accuracy. In the “glmnet” software package in R, the LASSO regression algorithm was used to select preeclampsia genes that were notably related to normal samples (Engebretsen and Bohlin, 2019). Support vector machine (SVM) is a popular machine-learning technique for classification and regression (Nedaie and Najafi, 2018). We used “E1071,” “Kernlab,” and “caret” to build the SVM model. To avoid overfitting, we determined the optimal genes from the metadata queue using the Recursive feature elimination (RFE) algorithm. The LASSO and SVM were used to select overlapping genes, and the level of candidate genes was verified on the GSE160888 and GSE96985 datasets. In addition, we established a random forest (RF) model in the “RandomForest” package in R as a training model to forecast the occurrence of preeclampsia. Moreover, ntrees and mtry were set at 100 and 3, respectively. Next, a rosette model was built with the “RMS” package in R to forecast the prevalence of patients with preeclampsia. Calibration curves were used to determine the agreement between predicted and actual values. A clinical influence curve was drawn using decision curve analysis (DCA) to evaluate whether model-based decision-making is beneficial to patients (Iasonos et al., 2008). We used the “limma”, “ggplot2”, “ggpubr”, and “ggExtra” packages in R to calculate and plot the correlations between the four characteristic genes.
2.5 Diagnostic value of characteristic biomarkers in preeclampsia
To validate the predictive value of previously screened biomarkers, receiver operating characteristic (ROC) curves were built via the “pROC” package based on mRNA expression data using 30 preeclampsia and 27 control samples. The area under the ROC curve (AUC) was used to judge the diagnostic efficiency of preeclampsia and control samples, which was further verified using the GSE160888, GSE96985, and GSE48424 data files.
2.6 Discovery of immune cell subtypes
The CIBERSORT bioinformatics (https://cibersortx.stanford.edu/) algorithm was used to analyze immune cell infiltration from the preeclampsia gene expression profiles. Putative immune cell abundance was predicted using a reference set of 22 immune cell subtypes with 1000 permutations (LM22; Newman et al., 2015). Correlation analysis and visualization of 21 infiltrating immune cells were performed using the R package “Corrplot.” The Vioplot software package was used to draw a violin diagram to observe the difference in immune cell infiltration between patients with preeclampsia and normal pregnant women.
2.7 Analysis of correlation between identified genes and infiltrating immune cells
Pearson’s correlation analysis was performed using R to determine the correlation between the identified gene biomarkers and the level of infiltrating immune cells. The resulting associations were visualized using the graphical techniques of the “ggplot2” package.
2.8 Patient enrollment and data collection
Twenty-one pregnant women were selected from the International Peace Maternal and Child Health Hospital affiliated to Shanghai Jiao Tong University School of Medicine. Nine cases were diagnosed as preeclampsia and twelve cases were normal pregnant women. Preeclampsia was diagnosed according to the ACOG Practice Bulletin (The American College of Obstetricians and Gynecologists, 2020). All participants were singleton pregnant women without other diseases affecting blood pressure, such as hyperthyroidism, Cushing’s syndrome, and pancreatitis; serious dysfunction of the heart, liver, and kidney; and acute complications, such as diabetic ketoacidosis. All pregnant women provided signed informed consent, and this study was approved by the Ethics Committee of International Peace Maternal and Child Health Hospital Affiliated to Shanghai Jiao Tong University School of Medicine [Approval No.: GKLW-2017-81].
General information on the pregnant women, including age at delivery and family history of hypertension, was collected through face-to-face interviews. The pre-pregnancy body-mass index was calculated from the height measured by nurses and the pre-pregnancy weight reported by the pregnant women. Blood pressure was measured during the second trimester.
The amniotic membrane was removed within 5 min after delivery of the placenta. We dissected the middle layer of the placenta from the middle of the maternal and fetal surfaces, followed by washing with enzyme-free water to remove blood. Then, the water was removed using filter paper, and the placenta was quickly placed in an external rotating freezing tube, flash-frozen in liquid nitrogen, and stored at −80°C for later use.
2.9 Expression of four characteristic genes in placenta of control and preeclampsia groups
The total RNA of the placenta was extracted using RNAiso Plus reagent (9109, Takara, Shiga, Japan) according to the manufacturer’s instructions. cDNA was synthesized from RNA using the RT Reagent Kit and gDNA Eraser (RR047A, Takara, Shiga, Japan). qPCR was performed on the QuantStudio 7 Flex system (Life Technologies, Carlsbad, CA, United States). Three replicates of each sample were analyzed. To quantify the relative mRNA expression, data were normalized to the expression level of β-actin. Primer sequences are shown in Table 1.
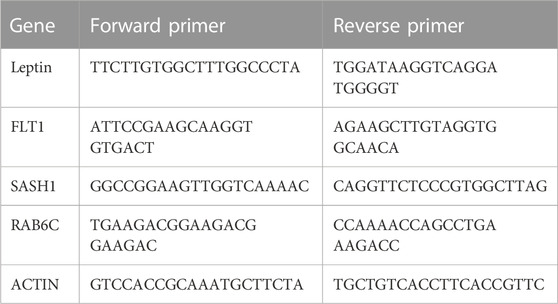
TABLE 1. Sequences of primer sets for qRT-PCR.
2.10 Statistical analysis
R and SPSS26.0 were used for statistical analyses. Student’s t-test and Mann-Whitney test were used for continuous, normally and non-normally distributed data, respectively. The “glmnet” and E1071 packages in R and ROC curve analysis were used for the LASSO regression algorithm and the diagnostic efficacy of the selected biomarker analysis, respectively. Pearson’s correlation coefficient was used to study the relationship between gene biomarker expression and immune cell infiltration. For quantitative data, distribution was described in terms of mean ± standard deviation, and an independent sample t-test was used for comparison between groups. The median M [P25, P75] was used to describe data that did not conform to normal distribution, and the rank sum test of independent samples was used for comparison between groups. Enumeration data were described in terms of the number of cases (%), and the Fisher’s exact probability method was used for comparison of differences between groups. All statistical analyses were bilateral, and p < 0.05 was considered to indicate significance.
3 Results
3.1 Identification of DEGs in preeclampsia
Two GEO datasets (GSE4707 and GSE10588) were downloaded, which together included 27 patients with preeclampsia and 30 normal pregnant women. After eliminating batch sub-effects, the “limma” package was used to determine the DEGs. We created heat maps with the screened differential genes, with red representing upregulated genes in PE patients and blue representing downregulated genes (Figure 2A). We also plotted volcano plots, with red representing upregulated genes in PCOS patients and green representing downregulated genes (Figure 2B). Seventy-three DEGs were identified, of which 56 were significantly upregulated and 17 significantly downregulated.
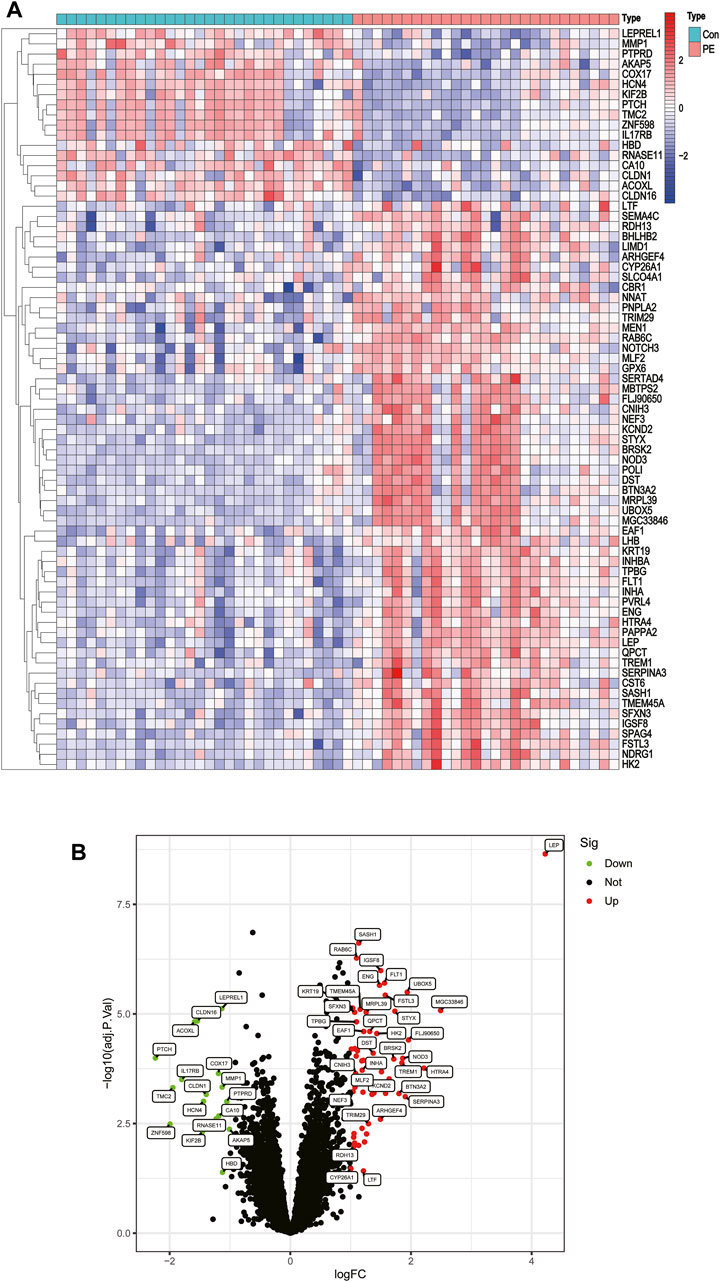
FIGURE 2. Differentially expressed genes between placentas of patients with preeclampsia and controls. (A) Heatmap. (B) Volcano plot.
3.2 Functional correlation analysis
GO analyses showed that DEGs were predominantly enriched in reproductive structure development, reproductive system development, and hormone metabolic processes (Figure 3A). KEGG analyses indicated that DEGs were predominantly enriched in cytokine-cytokine receptor interaction, cell adhesion molecules, and the interleukin (IL)-17 signaling pathway (Figure 3B). DO pathway enrichment analyses suggested that diseases enriched by DEGs were largely associated with endocrine system diseases, preeclampsia, and reproductive system diseases (Figure 3C). GSEA results of preeclampsia showed that the enriched pathways dominated myeloid cell homeostasis and cadherin binding (Figure 3D).
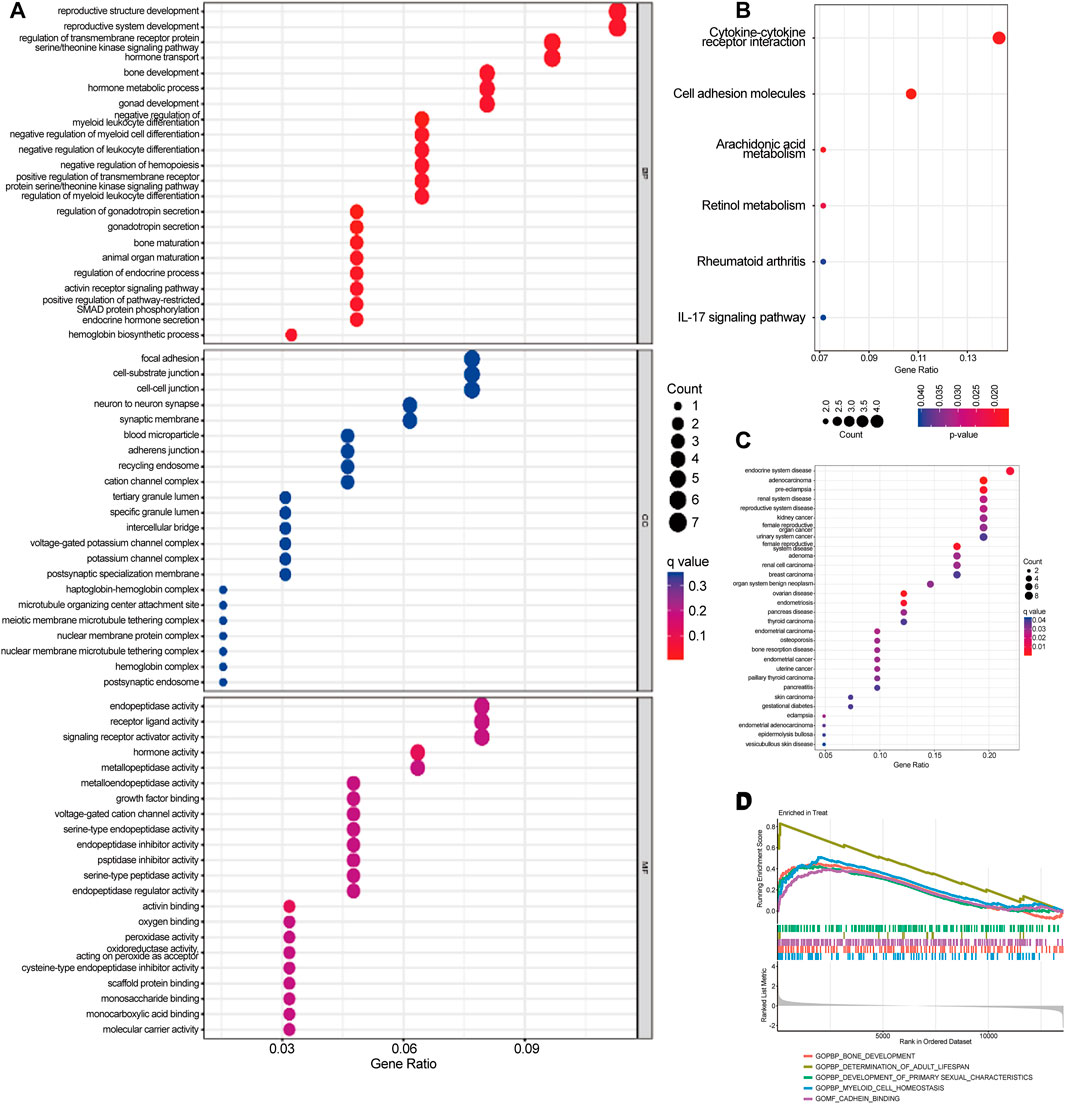
FIGURE 3. Gene Ontology (GO), Kyoto Encyclopedia of Genes and Genomes (KEGG), Disease Ontology (DO), and Gene Set Enrichment Analysis (GSEA) were used to identify the underlying biological processes of differential genes. (A) GO analysis of differential genes between preeclampsia and control samples. (B) KEGG analysis of differential genes between preeclampsia and control samples. (C) DO enrichment analysis of differentially expressed genes between preeclampsia and control samples. (D) Enrichment analysis by GSEA.
3.3 Identification and validation of biomarkers of diagnostic properties
Two different algorithms were used to identify promising biomarkers of preeclampsia. First, 12 genes were identified as diagnostic biomarkers of preeclampsia using the LASSO algorithm based on the DEGs (Figure 4A). Then, the SVM-recursive feature elimination algorithm was used to screen ten characteristic genes from the DEGs (Figure 4B). Four overlapping features (leptin [LEP], SAM and SH3 domain containing 1 [SASH1], RAB6C, and fms-like tyrosine kinase receptor-1 [FLT1]) were selected using the two algorithms (Figure 4C). We also constructed an RF tree and screened out two genes with a score greater than two according to their importance score, namely LEP and SASH1 (Figures 4D, E). We then used the GSE160888 and GSE96985 datasets to analyze their levels. FLT1 levels in the placenta of patients with preeclampsia were significantly upregulated (p = 0.014; Figure 5A). Furthermore, the expression of LEP in the tissues of patients with preeclampsia was higher than that in the control group and that of RAB6C was lower, but no significant differences were observed (Figures 5B, C). Furthermore, the SASH1 levels in the placenta of patients with preeclampsia were significantly upregulated (p = 0.028; Figure 5D). We then used the GSE48424 dataset, which contained 18 blood samples from patients with preeclampsia and 18 blood samples from control patients, to analyze the expression of these four genes. FLT1 expression in the blood samples of patients with preeclampsia was higher than that in control patients, but the difference was not significant (Figure 5E). The expression of LEP in the blood samples of patients with preeclampsia was significantly higher than that in control patients (p = 0.047; Figure 5F); the expression of RAB6C was lower in the blood of patients with preeclampsia (Figure 5G). This was consistent with the results validated in the placenta. However, SASH1 showed the opposite results in the placenta and blood. The expression of SASH1 was significantly increased in the placenta of patients with preeclampsia but decreased in the blood (Figures 5D, H).
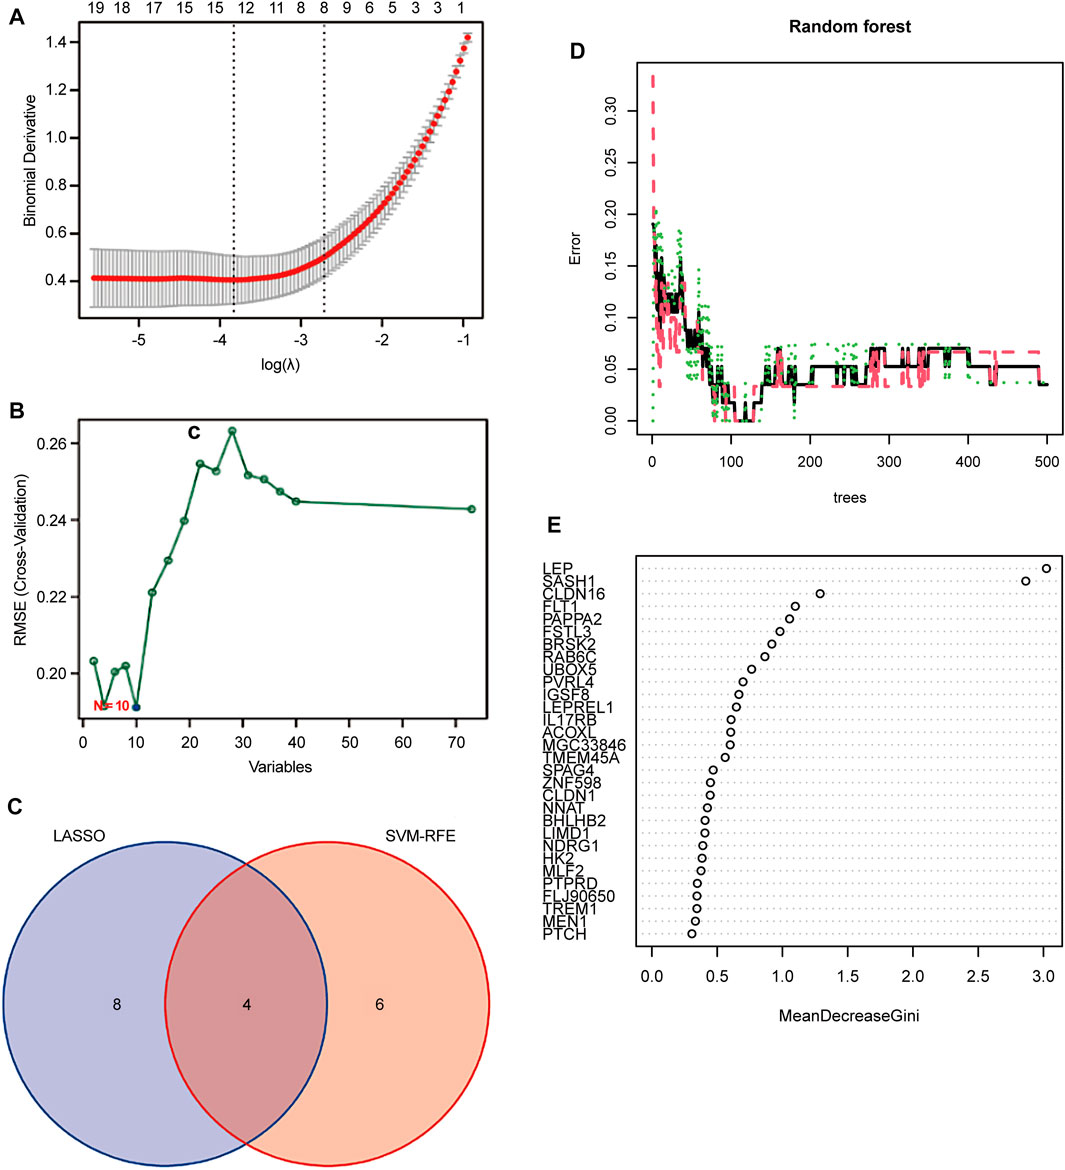
FIGURE 4. Screening candidate biomarkers for the diagnosis of preeclampsia. (A) Adjustment of feature selection in the least absolute shrinkage and selection operator model (LASSO). (B) Plot of biomarker selection by support vector machine-recursive feature elimination (SVM-RFE) algorithm. (C) Venn diagram screening LASSO for four diagnostic genes common to the SVM-RFE algorithm. Random Forest (RF) model construction. (D) Inverse cumulative distribution of residuals is plotted to show the residual distribution of RF. (E) Importance scores of variables based on the RF model.
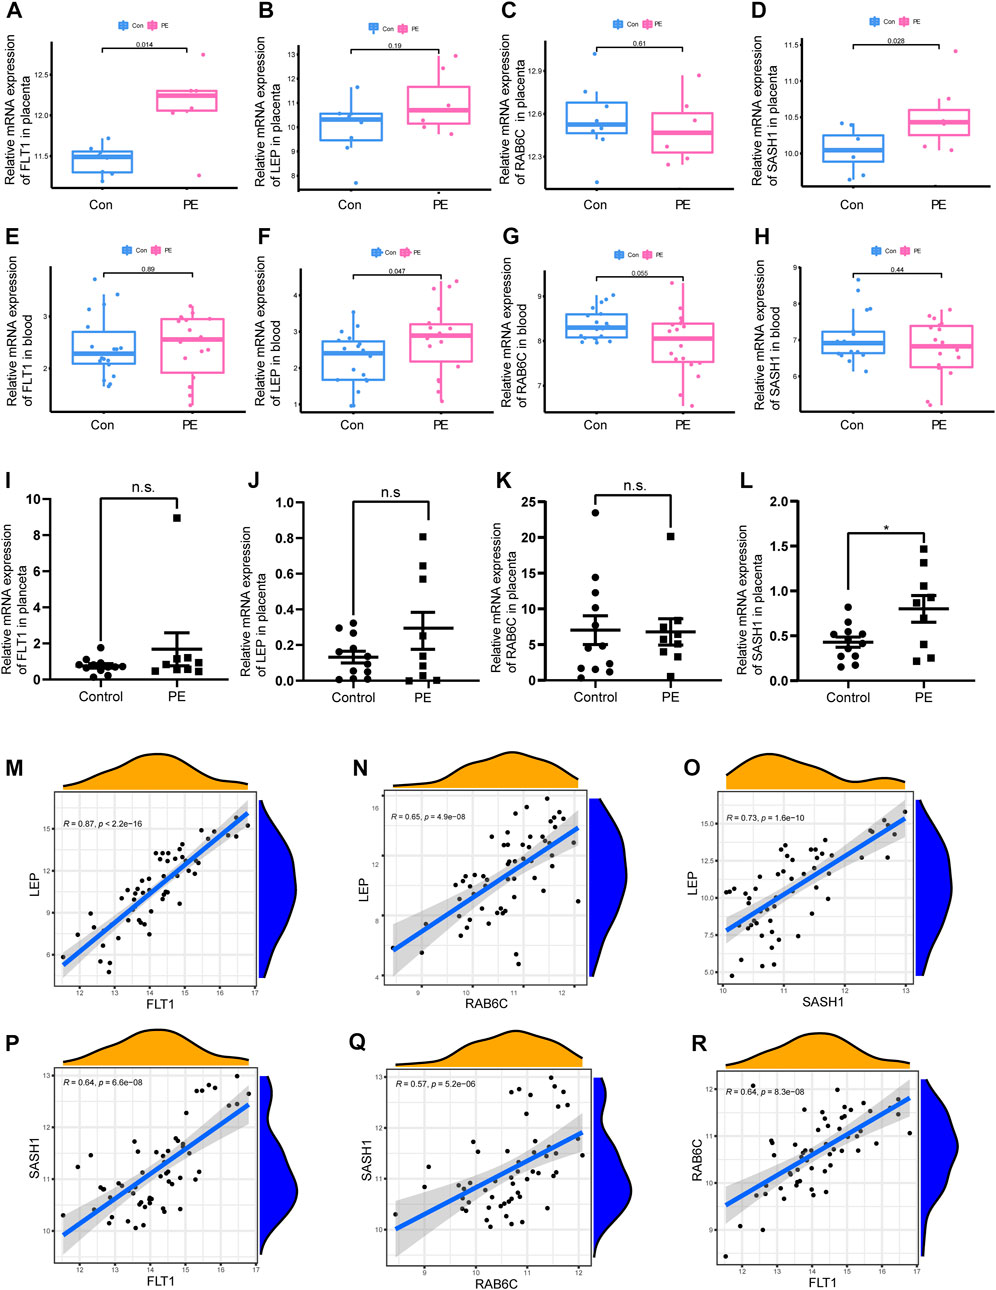
FIGURE 5. Box plot validation of four candidate diagnostic genes and correlation analysis of four characteristic genes. (A–D) Validation of four candidate genes for preeclampsia in human placenta using GSE160888 and GSE96985 datasets. (E–H) Validation of four candidate genes in peripheral blood using GSE48424. (I–L) RT-qPCR was used to verify the expression of four characteristic genes in the placenta of the patients. (M–R) Correlation analysis of the four characteristic genes in GSE4707 and GSE10588.
3.4 qPCR to verify the expression of four characteristic genes in the placenta of patients
We examined the expression of four genes in nine patients with preeclampsia and 12 normal pregnant women. Basic information on the patients is shown in Table 2. The expression of SASH1 was significantly increased in patients with preeclampsia both in the predicted and qPCR experiment results (Figures 5D, L). However, we predicted that FLT1 expression would be significantly increased in preeclampsia (Figure 5A), but there was no significant difference in the qPCR results (Figure 5I). Both the predicted results and the experimental verification showed that the expression of LEP in patients with preeclampsia was higher and that of RAB6C was lower than those in normal pregnant women, but there was no significant difference (Figures 5B, J).
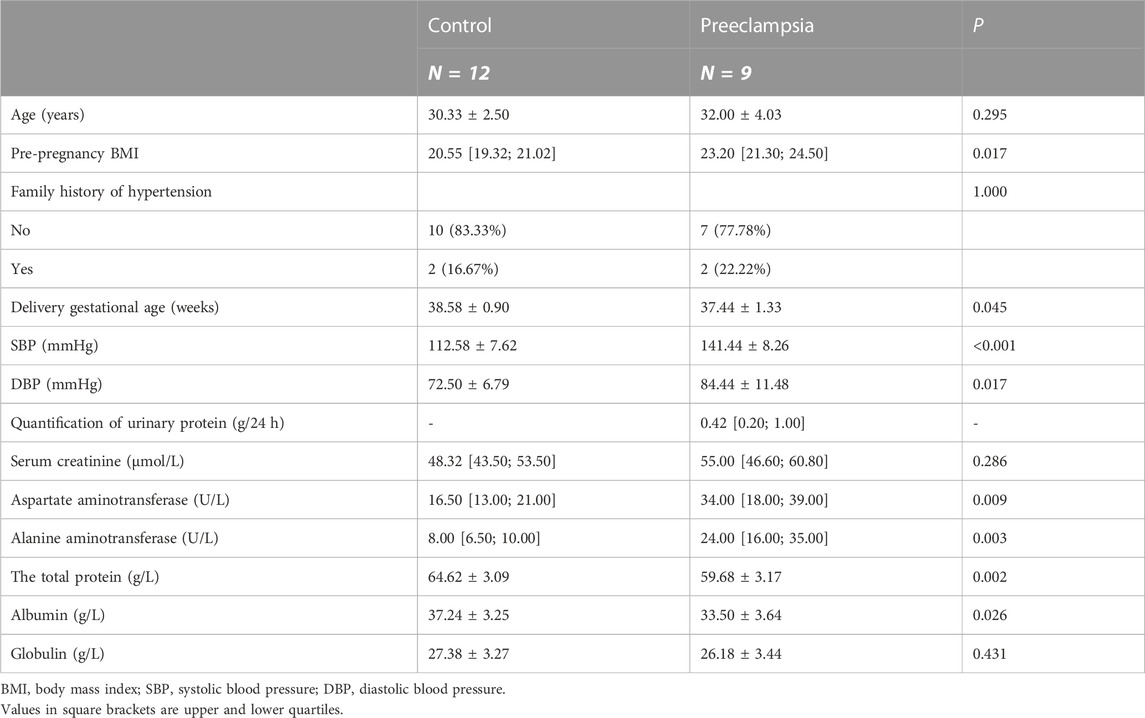
TABLE 2. Demographic data of the study population.
3.5 Correlation analysis between four characteristic genes
We analyzed the correlations among the expression of FLT1, LEP, SASH1, and RAB6C in GSE4707 and GSE10588. LEP was positively correlated with FLT1 (R = 0.87, p < 2.2E-16; Figure 5M), RAB6C (R = 0.65, p = 4.9E-08; Figure 5N), and SASH1 (R = 0.73, p = 1.6E-10; Figure 5O). Furthermore, SASH1 was positively correlated with FLT1 (R = 0.64, p = 6.6E-08; Figure 5P) and RAB6C (R = 0.57, p = 5.2E-06; Figure 5Q). Finally, RAB6C was positively correlated with FLT1 (R = 0.64, p = 8.3e-08; Figure 5R).
3.6Construction of nomogram model
A nomogram model for predicting the prevalence of preeclampsia based on the two candidate genes was constructed using the ‘RMS’ package (Figure 6A). The calibration curve showed that the prediction ability of the nomogram model was optimized (Figure 6B). The red line in the DCA curve remained above the gray and black lines between 0 and 1, indicating that decisions based on the nomogram model may be beneficial to patients with preeclampsia (Figure 6C). The clinical influence curve showed that the nomogram model had a good predictive ability (Figure 6D).
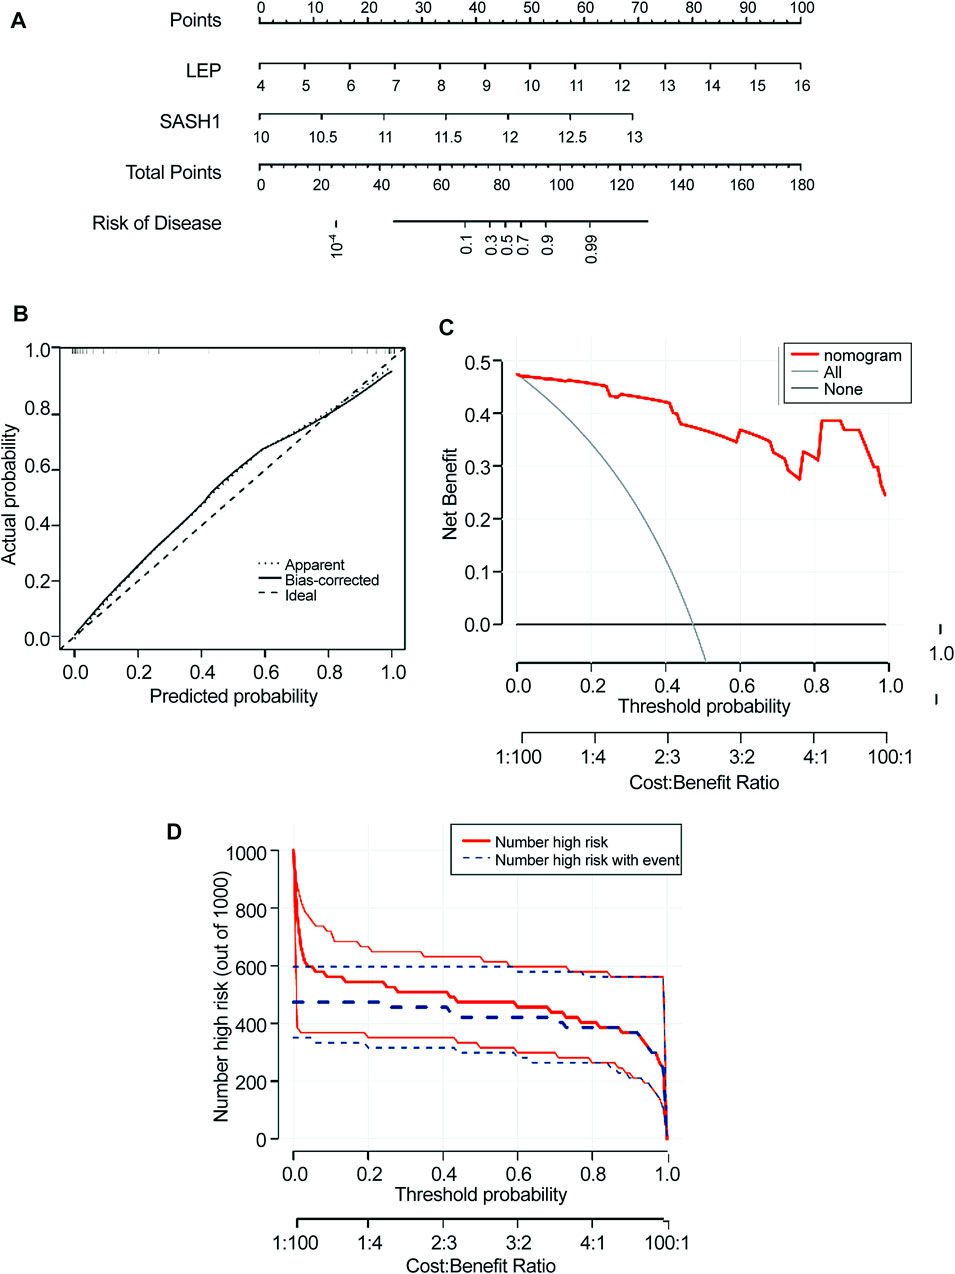
FIGURE 6. Construction of the nomogram model. (A) Construction of a nomogram model based on four candidate genes. (B) Calibration curve showing the predictive power of the nomogram model. (C) Decision curve. (D) Clinical impact of the nomogram model was assessed using the clinical impact curve.
3.7 Diagnostic efficacy of functional biomarkers in preeclampsia
The four biomarkers showed good diagnostic value for preeclampsia and control samples in the GSE4707 and GSE10588 datasets (Figure 7A). The AUC of FLT1 was 0.922 (95% confidence interval [CI] 0.839–0.986) and that of LEP was 0.967 (95% CI 0.915–0.999). The AUC of SASH1 was 0.954 (95% CI 0.890–1.000) and that of RAB6C was 0.937 (95% CI 0.870–0.984). The GSE160888 and GSE96985 datasets verified its recognition ability, with an AUC of 0.875 (95% CI 0.571–1.000) for FLT1 and 0.714 (95% CI 0.411–0.946) for LEP. The AUC of RAB6C was 0.589 (95% CI 0.286–0.875) and that of SASH1 was 0.848 (95% CI 0.607–1.000), indicating that the characteristic biomarkers had diagnostic ability (Figure 7B). The GSE48424 dataset showed verified recognition ability, with an AUC of 0.515 (95% CI 0.327–0.728) for FLT1 and 0.694 (95% CI 0.494–0.858) for LEP. The AUC of RAB6C was 0.688 (95% CI 0.497–0.855), and that of SASH1 was 0.577 (95% CI 0.370–0.759), indicating that the characteristic biomarkers had diagnostic ability (Figure 7C).
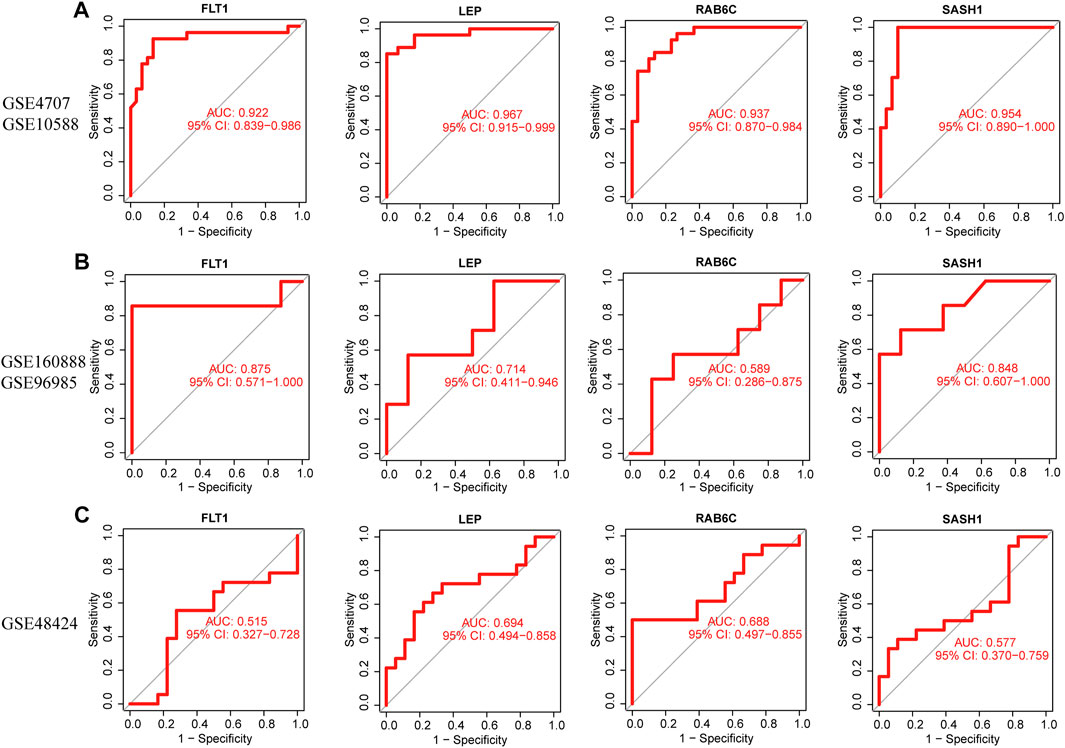
FIGURE 7. Receiver operating characteristic (ROC) curves of the diagnostic effectiveness of four diagnostic markers. (A) FLT1, LEP, RAB6C, and SASH1 fitting metadata cohort of GSE4707 and GSE10588. (B) Fitting ROC curves of FLT1, LEP, RAB6C, and SASH1 in the combined dataset of GSE160888 and GSE96985. (C) Fitting the ROC curves of FLT1, LEP, RAB6C, and SASH1 in the GSE48424 dataset.
3.8 Immune cell infiltration
Only activated NK cells and resting dendritic cells were statistically significant (p < 0.05; Figure 8A), whereas the other cell types did not differ significantly between the placenta of normal pregnant women and patients with preeclampsia. The correlation between infiltrated immune cells is displayed in Figure 8B; Table 3.
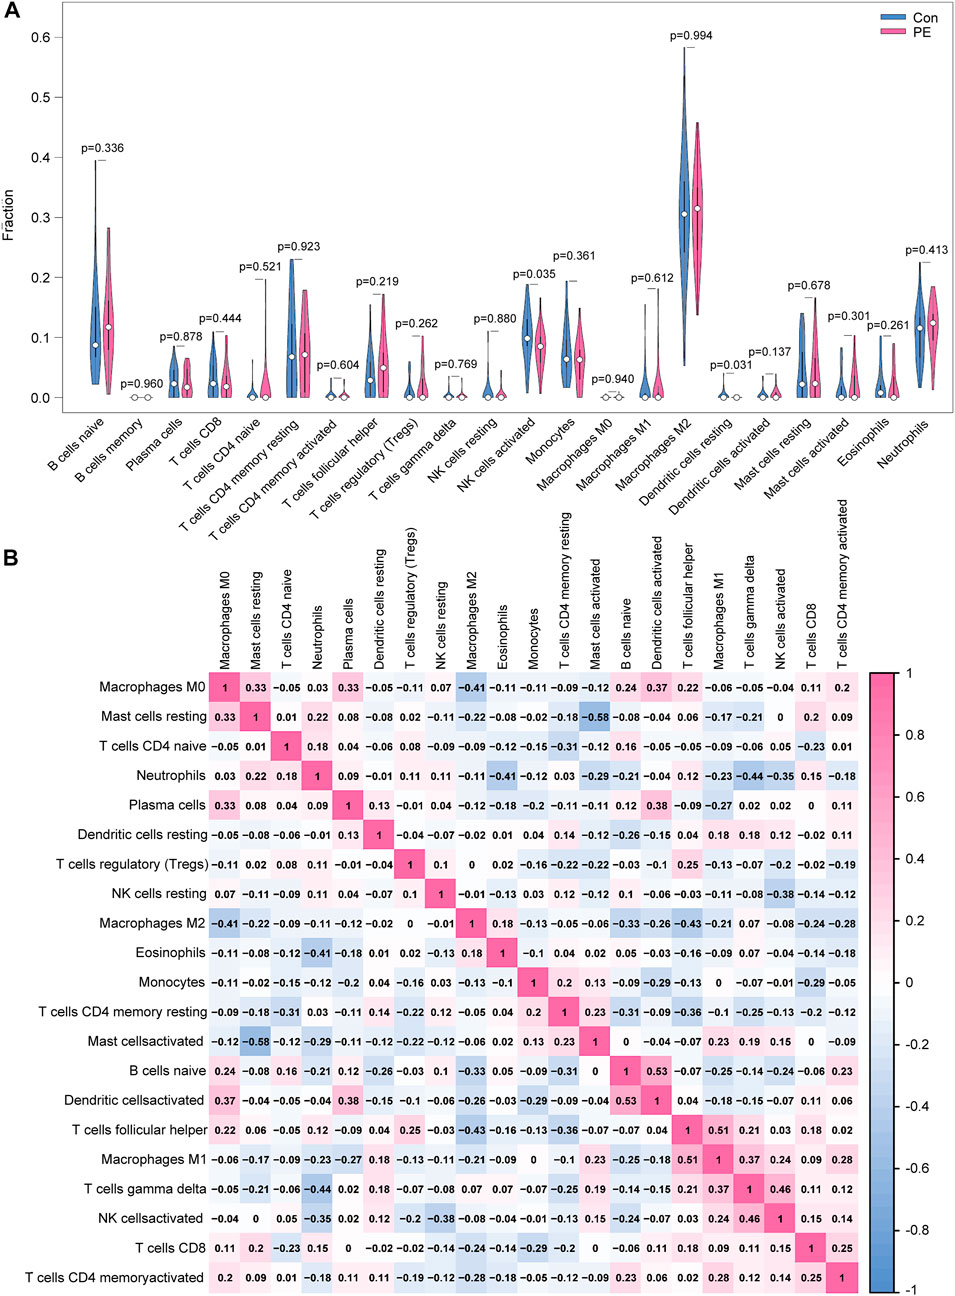
FIGURE 8. Distribution and visualization of immune cell infiltration. (A) Comparison of 22 immune cell subtypes in patients with preeclampsia and controls. Blue and red represent normal and preeclampsia samples, respectively. (B) Correlation matrix of 21 immune cell subtypes, with immune cell subtypes shown on the horizontal and vertical axes. Immune cell subtype composition (higher, lower, and same relative levels are shown in red, blue, and white, respectively).
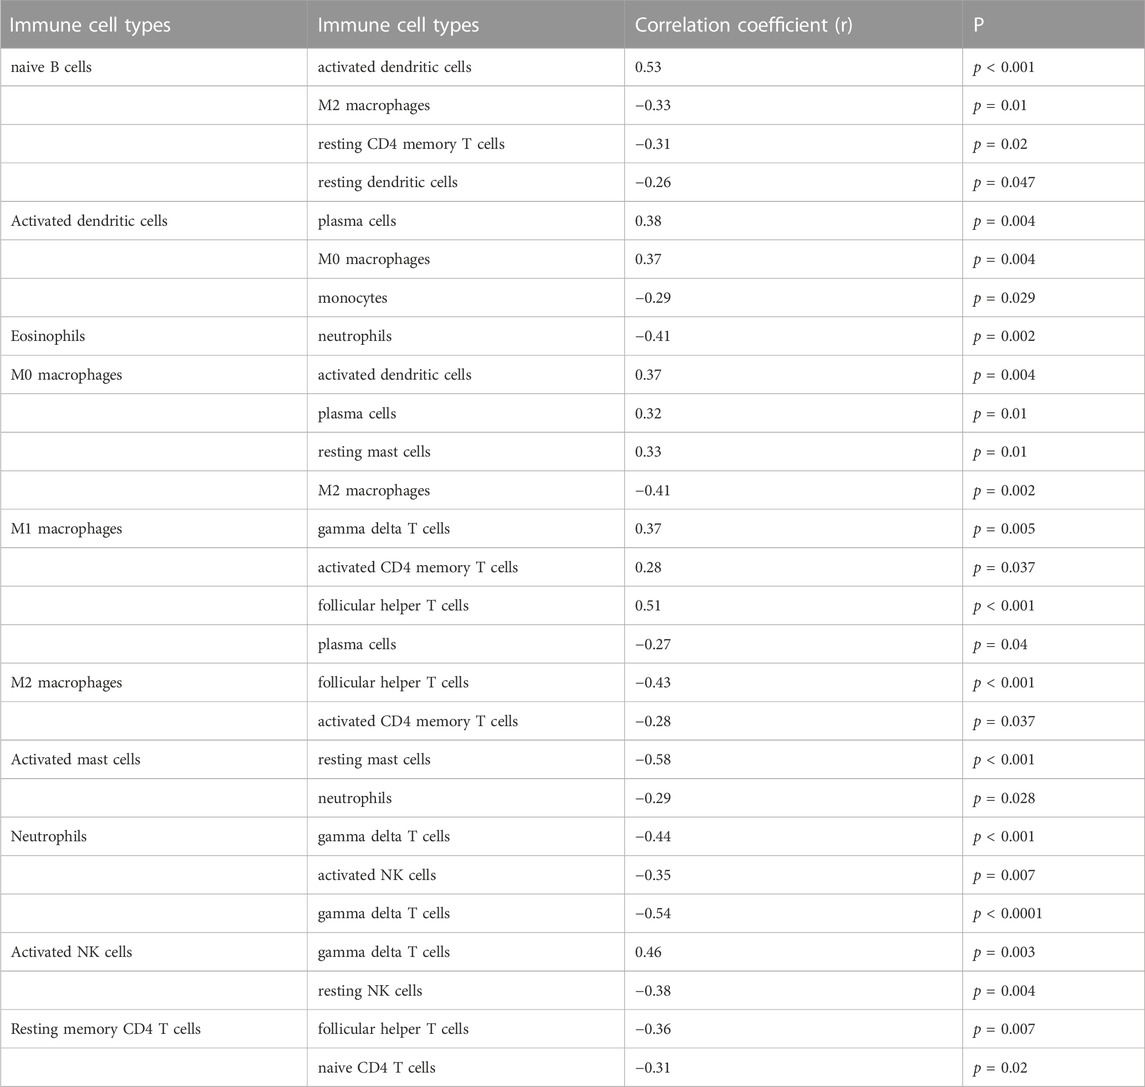
TABLE 3. Correlation between immune cells.
3.9 Correlation analysis of expression of four biomarkers with abundance of infiltrating immune cells
FLT1 was positively correlated with the abundance of Tregs (r = 0.28, p = 0.034) but negatively correlated with that of activated NK cells (r = −0.41, p = 0.001; Figure 9A). RAB6C was negatively correlated with the abundance of M1 macrophages (r = −0.30, p = 0.025), resting dendritic cells (r = −0.32, p = 0.014), and activated NK cells (r = −0.43, p < 0.001; Figure 9B). LEP was negatively correlated with the abundance of activated NK cells (r = −0.32, p = 0.016; Figure 9C). SASH1 was negatively correlated with the abundance of activated NK cells (r = −0.28, p = 0.034) and resting dendritic cells (r = −0.31, p = 0.018; Figure 9D).
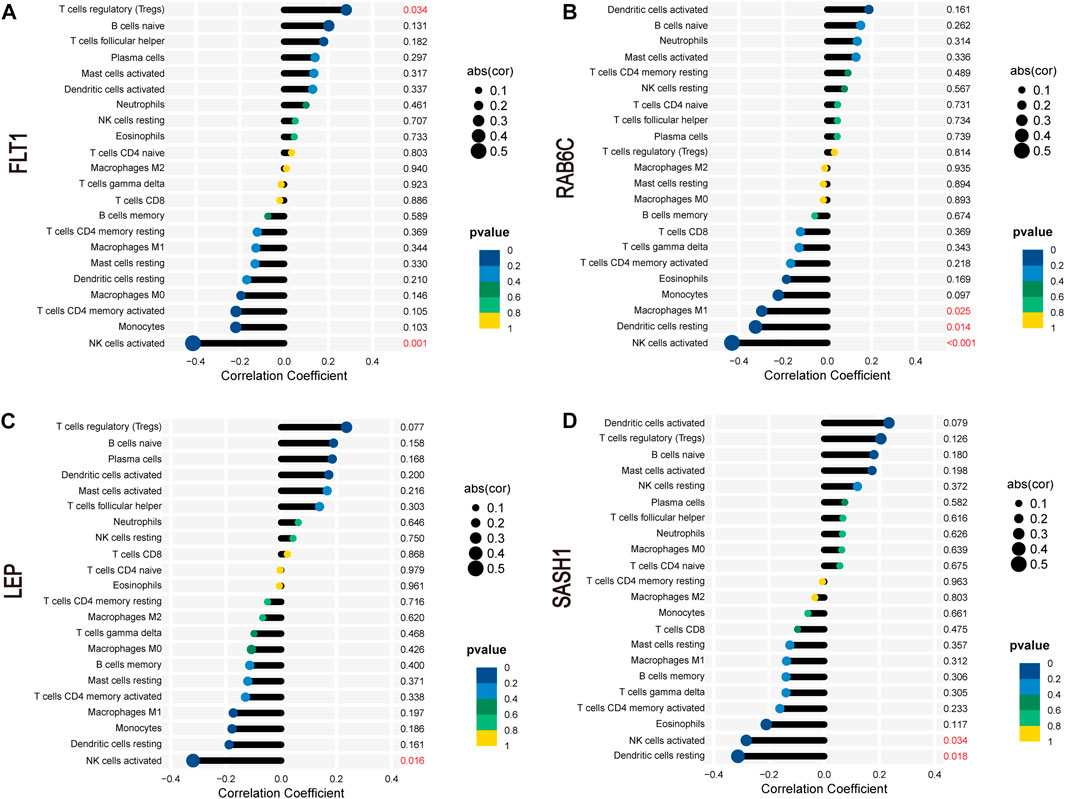
FIGURE 9. Correlation between FLT1 (A), RAB6C (B), LEP (C), and SASH1 (D) and infiltrating immune cells in preeclampsia.
4 Discussion
Early diagnosis of preeclampsia can improve treatment options and reduce associated morbidity and mortality (El-Dorf and Hagras, 2019). Many studies have used various biological samples, such as maternal blood, urine, or placental tissue, collected during pregnancy to determine the expression or concentration of certain diagnostic biomarkers (e.g., He et al., 2020). Further research is urgently needed to elucidate the pathophysiology of preeclampsia and determine useful diagnostic and therapeutic targets to improve diagnosis and treatment options. In the present study, we screened LEP, FLT1, RAB6C, and SASH1 as potential biomarkers for preeclampsia. In addition, our results suggest that Tregs, monocytes, and activated NK cells may be involved in the development of preeclampsia. These findings can provide new insights into the pathogenesis of preeclampsia and provide new clues for obstetricians to early identify high-risk groups of preeclampsia.
In our study, placental gene enrichment in women with preeclampsia was primarily associated with the following pathways: reproductive structure development, reproduction system development, hormone transport, hormone metabolic process, and IL-17 signaling. DO analysis showed that the associated diseases were mainly those involved in the endocrine and reproductive systems and preeclampsia. Most of these outcomes are related to diseases of the reproductive system. Inflammation is the main characteristic and risk factor of preeclampsia and other hypertensive disorders complicating pregnancy. Elevated inflammatory mediators and leukocytes in peripheral blood and placental tissue can lead to abnormal uterine blood vessels and impaired placental function, especially in severe early-onset disease (Robertson et al., 2019). Consistent with our KEGG results, previous studies have reported that IL-17 is overexpressed in preeclampsia. In addition, the overexpression of IL-17 has been reported to promote the proliferation, migration, and invasion of trophoblast cells by regulating the PPAR-α/RXR-α/Wnt signaling pathway; therefore, IL-17 may be a potential therapeutic target for preeclampsia (Zhang et al., 2022). This is consistent with our KEGG results.
We identified characteristic genes of preeclampsia as LEP, FLT1, RAB6C, and SASH1 using the GEO database and verified them using the GSE160888 and GSE96985 datasets. We also validated the four genes in blood samples from the GSE48424 dataset. Consistent with our findings, other studies have identified FLT1 as a diagnostic biomarker gene (Yang et al., 2022). In the present study, FLT1 expression was significantly increased in the placentas of patients with preeclampsia. FMS-associated tyrosine kinase 1 pseudogene 1 (FLT1P1) and FLT1 have been shown to regulate trophoblast proliferation and angiogenesis in preeclampsia. Hence, the occurrence and development of preeclampsia may be owing to the abnormal regulation of FLT1P1 and FLT1 expression; this indicates that FLT1P1 and FLT1 are promising biomarkers for the diagnosis of preeclampsia (Chi et al., 2021). Leptin is involved in cell differentiation, proliferation, and immunity in various physiological states, and is mainly derived from placental and adipose tissues (Inagaki-Ohara, 2019). The upregulation of miR-18b-3p inhibits the expression of LEP and reduces the occurrence of preeclampsia (Huang et al., 2021). In the present study, the expression of LEP in the blood increased significantly in patients with preeclampsia and tended to increase in the placentas of patients with preeclampsia. Therefore, our study identified LEP as an important gene for preeclampsia. SASH1 is a member of the SLY family of signal adapter proteins (He et al., 2016). Previous studies using RNA sequencing have found that SASH1 is upregulated in the placenta of patients with preeclampsia, indicating that SASH1 plays a vital role in this organ during preeclampsia (He et al., 2016). Another study showed that SASH1 was significantly upregulated in placentas with preeclampsia. The overexpression of SASH1 inhibited trophoblast proliferation, migration, and invasion, but induced trophoblast apoptosis (Liu et al., 2020). In our study, SASH1 was screened as a characteristic gene of preeclampsia, and its expression in the placenta of patients with preeclampsia was higher. However, SASH1 showed a downward trend in the blood samples of patients with preeclampsia. Finally, RAB6C expression in patients with preeclampsia showed a downward trend in both placental and blood samples. However, there are no reports on the relationship between preeclampsia and RAB6C, which may hence be a novel molecule worthy of further study. Moreover, our results show that LEP, FLT1, RAB6C, and SASH1 were significantly positively correlated, indicating a potential co-activation relationship among them or the existence of similar biological roles. The role of this correlation in preeclampsia requires further investigation.
Activated NK and resting dendritic cells showed significantly less infiltration in preeclamptic tissues than in normal tissues. FLT1 was negatively correlated with activated NK cells. LEP was negatively correlated with activated NK cells. RAB6C was negatively correlated with resting dendritic cells, and activated NK cells. SASH1 was negatively correlated with activated NK cells and resting dendritic cells. Decidual NK (dNK) cells are the most abundant immune cell type at the maternal-fetal interface during early pregnancy and placental formation (Cornelius and Wallace, 2019). dNK cells play a key role in spiral artery remodeling by secreting IL-8, interferon-gamma-inducible protein-10, vascular endothelial growth factor, and placental growth factor (Hanna et al., 2006). Another study found that decidual arteries have a smaller lumen diameter and damaged endothelium in NK cell-deficient mice (Greenwood et al., 2000). The most important steps in the process of placenta formation are trophoblast invasion and vascular remodeling. Decreased trophoblast cell invasion and vascular conversion resulting in poor placental perfusion may lead to the development of preeclampsia (Brosens et al., 2011). It has been demonstrated that uterine NK cell supernatant stimulates extravillous trophoblast invasion at 12–14 weeks of gestation. Increased invasiveness correlates with increased metalloproteinase-9 (MMP—9) secretion and decreased extravillous trophoblast apoptosis. MMPs are proteolytic zinc-requiring enzymes that include collagenases (Lash et al., 2010). Therefore, if the number of NK cells decreases during this period, it may lead to impaired trophoblast invasion and thus promote the development and progression of PE. dNK cells may be a useful target for the treatment of preeclampsia to ensure appropriate placental formation, vascular remodeling, and pregnancy progression (Cornelius and Wallace, 2019). These results are consistent with our findings; NK cell infiltration in the placenta of patients with preeclampsia was reduced. As for the relationship between the four genes FLT1, LEP, SASH1, and RAB6C and NK cells, no studies have been reported so far, which can be further explored in the future. Currently, there is some researches on the condition of dendritic cells in the placenta of preeclampsia. It has been suggested that the total number of dendritic cells in the placental bed of women with preeclampsia may be similar or higher (Huang et al., 2008; Hsu et al., 2012). The proportion of mature dendritic cells in the decidua of patients with preeclampsia was significantly higher than that of healthy pregnant women (Zhang et al., 2017). This is not consistent with our research. More studies are needed to explore the role of immune cell infiltration in the pathophysiological mechanism of preeclampsia.
This study has some limitations. First, some GEO datasets were not very large, and future studies should be based on larger sample sizes. Second, although four key genes have been identified as being characteristic of preeclampsia, a larger sample size is needed to validate this finding. Third, we did not identify subtypes of preeclampsia. In the future, we will further differentiate between the types of preeclampsia and perform flow sorting of the placenta to verify the type of immune cells in it so that patients can be diagnosed and managed appropriately.
In summary, LEP, FLT1, RAB6C, and SASH1 were identified as potential biomarkers of preeclampsia. In addition, our findings suggest that Tregs, monocytes, and activated NK cells may participate in preeclampsia development. Thus, these immune cells are promising targets for immunotherapy in patients with preeclampsia.
Data availability statement
The original contributions presented in the study are included in the article/Supplementary Material, further inquiries can be directed to the corresponding author.
Ethics statement
The studies involving human participants were reviewed and approved by the Medical Research Ethics Committee, International Peace Maternal and Child Health Hospital. The patients/participants provided their written informed consent to participate in this study.
Author contributions
LB, YG, and YM were the principal investigators, conducted the statistical analysis, and drafted the article. LB, JG, and YL performed data management and bioinformatics analysis. XL, YM, and HH edited and revised the manuscript. All authors contributed to the article and approved the submitted version.
Funding
This research was supported by the National Natural Science Foundation of China (82088102, 82171687), the CAMS Innovation Fund for Medical Sciences (2019-I2M-5-064), National Natural Science Funds (82192873), the Collaborative Innovation Program of Shanghai Municipal Health Commission (2020CXJQ01), the Clinical Research Plan of SHDC (SHDC2020CR1008A), and the Shanghai Frontiers Science Research Base of Reproduction and Development, the National Key Research and Development Program of China (2022YFC2702502).
Acknowledgments
The authors acknowledge the Gene Expression Omnibus (GEO) database for providing data on preeclampsia.
Conflict of interest
The authors declare that the research was conducted in the absence of any commercial or financial relationships that could be construed as a potential conflict of interest.
Publisher’s note
All claims expressed in this article are solely those of the authors and do not necessarily represent those of their affiliated organizations, or those of the publisher, the editors and the reviewers. Any product that may be evaluated in this article, or claim that may be made by its manufacturer, is not guaranteed or endorsed by the publisher.
References
Aneman, I., Pienaar, D., Suvakov, S., Simic, T. P., Garovic, V. D., and McClements, L. (2020). Mechanisms of key innate immune cells in early- and late-onset preeclampsia. Front. Immunol. 11, 1864. doi:10.3389/fimmu.2020.01864
Brosens, I., Pijnenborg, R., Vercruysse, L., and Romero, R. (2011). The “Great Obstetrical Syndromes” are associated with disorders of deep placentation. Am. J. Obstet. Gynecol. 204, 193–201. doi:10.1016/j.ajog.2010.08.009
Cao, Y., Tang, W., and Tang, W. (2019). Immune cell infiltration characteristics and related core genes in lupus nephritis: Results from bioinformatic analysis. BMC Immunol. 20, 37. doi:10.1186/s12865-019-0316-x
Chi, Z., Sun, Y., Yu, Z., Zhou, F., Wang, H., and Zhang, M. (2021). Pseudogene fms-related tyrosine kinase 1 pseudogene 1 (FLT1P1) cooperates with RNA binding protein dyskeratosis congenita 1 (DKC1) to restrain trophoblast cell proliferation and angiogenesis by targeting fms-related tyrosine kinase 1 (FLT1) in preeclampsia. Bioengineered 12, 8885–8897. doi:10.1080/21655979.2021.1988366
Cornelius, D. C., and Wallace, K. (2019). Decidual natural killer cells: A critical pregnancy mediator altered in preeclampsia. EBiomedicine 39, 31–32. doi:10.1016/j.ebiom.2018.12.053
El-Dorf, A., and Hagras, M. (2019). Preeclampsia predictability tools using trace metal screening and angiogenic markers is clinically valuable. Int. Gyn. Women’s Health 3, 331–336. doi:10.32474/IGWHC201903000175
Engebretsen, S., and Bohlin, J. (2019). Statistical predictions with glmnet. Clin. Epigenet. 11, 123. doi:10.1186/s13148-019-0730-1
Gong, S., Gaccioli, F., Dopierala, J., Sovio, U., Cook, E., Volders, P. J., et al. (2021). The RNA landscape of the human placenta in health and disease. Nat. Commun. 12, 2639. doi:10.1038/s41467-021-22695-y
Greener, J. G., Kandathil, S. M., Moffat, L., and Jones, D. T. (2022). A guide to machine learning for biologists. Nat. Rev. Mol. Cell. Biol. 23, 40–55. doi:10.1038/s41580-021-00407-0
Greenwood, J. D., Minhas, K., di Santo, J. P., Makita, M., Kiso, Y., and Croy, B. A. (2000). Ultrastructural studies of implantation sites from mice deficient in uterine natural killer cells. Placenta 21, 693–702. doi:10.1053/plac20000556
Hanna, J., Goldman-Wohl, D., Hamani, Y., Avraham, I., Greenfield, C., Natanson-Yaron, S., et al. (2006). Decidual NK cells regulate key developmental processes at the human fetal-maternal interface. Nat. Med. 12, 1065–1074. doi:10.1038/nm1452
He, P., Zhang, H. X., Sun, C. Y., Chen, C. Y., and Jiang, H. Q. (2016). Overexpression of SASH1 inhibits the proliferation invasion and EMT in hepatocarcinoma cells. Oncol. Res. 24, 25–32. doi:10.3727/096504016X14575597858609
He, A., Zhou, Y., Wei, Y., and Li, R. (2020). Potential protein biomarkers for preeclampsia. Cureus 12, e8925. doi:10.7759/cureus.8925
Henderson, J. T., Vesco, K. K., Senger, C. A., Thomas, R. G., and Redmond, N. (2021). Aspirin use to prevent preeclampsia and related morbidity and mortality: Updated evidence report and systematic review for the US Preventive Services Task Force. JAMA 326, 1192–1206. doi:10.1001/jama.2021.8551
Hsu, P., Santner-Nanan, B., Dahlstrom, J. E., Fadia, M., Chandra, A., Peek, M., et al. (2012). Altered decidual DC-SIGN+ antigen-presenting cells and impaired regulatory T-cell induction in preeclampsia. Am. J. Pathol. 181, 2149–2160. doi:10.1016/j.ajpath.2012.08.032
Huang, S. J., Chen, C. P., Schatz, F., Rahman, M., Abrahams, V. M., and Lockwood, C. J. (2008). Pre-eclampsia is associated with dendritic cell recruitment into the uterine decidua. J. Pathol. 214, 328–336. doi:10.1002/path.2257
Huang, Q., Gong, M., Tan, T., Lin, Y., Bao, Y., and Fan, C. (2021). Human umbilical cord mesenchymal stem cells-derived exosomal microRNA-18b-3p inhibits the occurrence of preeclampsia by targeting LEP. Nanoscale Res. Lett. 16, 27. doi:10.1186/s11671-021-03475-5
Hutcheon, J. A., Lisonkova, S., and Joseph, K. S. (2011). Epidemiology of pre-eclampsia and the other hypertensive disorders of pregnancy. Best. Pract. Res. Clin. Obstet. Gynaecol. 25, 391–403. doi:10.1016/j.bpobgyn.2011.01.006
Iasonos, A., Schrag, D., Raj, G. V., and Panageas, K. S. (2008). How to build and interpret a nomogram for cancer prognosis. J. Clin. Oncol. 26, 1364–1370. doi:10.1200/JCO.2007.12.9791
Inagaki-Ohara, K. (2019). Gastric leptin and tumorigenesis: Beyond obesity. Int. J. Mol. Sci. 20, 2622. doi:10.3390/ijms20112622
Jebbink, J., Wolters, A., Fernando, F., Afink, G., van der Post, J., and Ris-Stalpers, C. (2012). Molecular genetics of preeclampsia and HELLP syndrome – a review. Biochim. Biophys. Acta 1822, 1960–1969. doi:10.1016/j.bbadis.2012.08.004
LaMarca, B., Cornelius, D., and Wallace, K. (2013). Elucidating immune mechanisms causing hypertension during pregnancy. Physiol. (Bethesda) 28, 225–233. doi:10.1152/physiol.00006.2013
LaMarca, B., Cornelius, D. C., Harmon, A. C., Amaral, L. M., Cunningham, M. W., Faulkner, J. L., et al. (2016). Identifying immune mechanisms mediating the hypertension during preeclampsia. Am. J. Physiol. Regul. Integr. Comp. Physiol. 311, R1–R9. doi:10.1152/ajpregu.00052.2016
Lash, G. E., Otun, H. A., Innes, B. A., Percival, K., Searle, R. F., Robson, S. C., et al. (2010). Regulation of extravillous trophoblast invasion by uterine natural killer cells is dependent on gestational age. Hum. Reprod. 25, 1137–1145. doi:10.1093/humrep/deq050
Leek, J. T., Johnson, W. E., Parker, H. S., Jaffe, A. E., and Storey, J. D. (2012). The sva package for removing batch effects and other unwanted variation in high-throughput experiments. Bioinformatics 28, 882–883. doi:10.1093/bioinformatics/bts034
Liberzon, A., Birger, C., Thorvaldsdóttir, H., Ghandi, M., Mesirov, J. P., and Tamayo, P. (2015). The Molecular Signatures Database (MSigDB) hallmark gene set collection. Cell Syst. 1, 417–425. doi:10.1016/j.cels.2015.12.004
Lisonkova, S., and Joseph, K. S. (2013). Incidence of preeclampsia: Risk factors and outcomes associated with early-versus late-onset disease. Am. J. Obstet. Gynecol. 209, 544.e1–544. doi:10.1016/jajog201308019
Liu, S., Jiang, S., Huang, L., and Yu, Y. (2020). Expression of SASH1 in preeclampsia and its effects on human trophoblast. Biomed. Res. Int. 2020, 5058260. doi:10.1155/2020/5058260
MacDonald, T. M., Walker, S. P., Hannan, N. J., Tong, S., and Kaitu’u-Lino, T. J. (2022). Clinical tools and biomarkers to predict preeclampsia. EBiomedicine 75, 103780. doi:10.1016/j.ebiom.2021.103780
McCarthy, F. P., Ryan, R. M., and Chappell, L. C. (2018). Prospective biomarkers in preterm preeclampsia: A review. Pregnancy Hypertens. 14, 72–78. doi:10.1016/j.preghy.2018.03.010
Moufarrej, M. N., Vorperian, S. K., Wong, R. J., Campos, A. A., Quaintance, C. C., Sit, R. V., et al. (2022). Early prediction of preeclampsia in pregnancy with cell-free RNA. Nature 602, 689–694. doi:10.1038/s41586-022-04410-z
Nedaie, A., and Najafi, A. A. (2018). Support vector machine with Dirichlet feature mapping. Neural Netw. 98, 87–101. doi:10.1016/j.neunet.2017.11.006
Newman, A. M., Liu, C. L., Green, M. R., Gentles, A. J., Feng, W., Xu, Y., et al. (2015). Robust enumeration of cell subsets from tissue expression profiles. Nat. Methods 12, 453–457. doi:10.1038/nmeth.3337
Petersen, E. E., Davis, N. L., Goodman, D., Cox, S., Mayes, N., Johnston, E., et al. (2019). Vital signs: Pregnancy-related deaths, United States, 2011–2015, and strategies for prevention, 13 states, 2013–2017. Morb. Mortal. Wkly. Rep. 68, 423–429. doi:10.15585/mmwr.mm6818e1
Rana, S., Karumanchi, S. A., and Lindheimer, M. D. (2014). Angiogenic factors in diagnosis management and research in preeclampsia. Hypertension 63, 198–202. doi:10.1161/HYPERTENSIONAHA.113.02293
Rasmussen, M., Reddy, M., Nolan, R., Camunas-Soler, J., Khodursky, A., Scheller, N. M., et al. (2022). RNA profiles reveal signatures of future health and disease in pregnancy. Nature 601, 422–427. doi:10.1038/s41586-021-04249-w
Robertson, S. A., Green, E. S., Care, A. S., Moldenhauer, L. M., Prins, J. R., Hull, M. L., et al. (2019). Therapeutic potential of regulatory T cells in preeclampsia-opportunities and challenges. Front. Immunol. 10, 478. doi:10.3389/fimmu.2019.00478
Sahay, A. S., Patil, V. V., Sundrani, D. P., Joshi, A. A., Wagh, G. N., Gupte, S. A., et al. (2014). A longitudinal study of circulating angiogenic and antiangiogenic factors and AT1-AA levels in preeclampsia. Hypertens. Res. 37, 753–758. doi:10.1038/hr.2014.71
Subramanian, A., Tamayo, P., Mootha, V. K., Mukherjee, S., Ebert, B. L., Gillette, M. A., et al. (2005). Gene set enrichment analysis: A knowledge-based approach for interpreting genome-wide expression profiles. Proc. Natl. Acad. Sci. U. S. A. 102, 15545–15550. doi:10.1073/pnas.0506580102
The American College of Obstetricians and Gynecologists (2020). Gestational hypertension and preeclampsia: ACOG Practice Bulletin, number 222. Obstetrics Gynecol. 135, e237–e260. doi:10.1097/AOG.0000000000003891
Williams, P. J., and Broughton Pipkin, F. B. (2011). The genetics of pre-eclampsia and other hypertensive disorders of pregnancy. Best. Pract. Res. Clin. Obstet. Gynaecol. 25, 405–417. doi:10.1016/j.bpobgyn.2011.02.007
Yang, F., Zheng, Q., and Jin, L. (2019). Dynamic function and composition changes of immune cells during normal and pathological pregnancy at the maternal-fetal interface. Front. Immunol. 10, 2317. doi:10.3389/fimmu.2019.02317
Yang, M. Y., Ji, M. H., Shen, T., and Lei, L. (2022). Integrated analysis identifies four genes as novel diagnostic biomarkers which correlate with immune infiltration in preeclampsia. J. Immunol. Res. 2022, 2373694. doi:10.1155/2022/2373694
Yu, G., Wang, L. G., Han, Y., and He, Q. Y. (2012). clusterProfiler: An R package for comparing biological themes among gene clusters. Omics 16, 284–287. doi:10.1089/omi.2011.0118
Yu, G., Wang, L. G., Yan, G. R., and He, Q. Y. (2015). DOSE: An R/Bioconductor package for disease ontology semantic and enrichment analysis. Bioinformatics 31, 608–609. doi:10.1093/bioinformatics/btu684
Zhang, W., Zhou, Y., and Ding, Y. (2017). Lnc-DC mediates the over-maturation of decidual dendritic cells and induces the increase in Th1 cells in preeclampsia. Am. J. Reprod. Immunol. 77, e12647. doi:10.1111/aji12647
Zhang, T., Bian, Q., Chen, Y., Wang, X., Yu, S., Liu, S., et al. (2021). Dissecting human trophoblast cell transcriptional heterogeneity in preeclampsia using single-cell RNA sequencing. Mol. Genet. Genomic Med. 9, e1730. doi:10.1002/mgg3.1730
Keywords: preeclampsia, machine learning, characteristic genes, immune cell infiltration, placental biomarkers
Citation: Bai L, Guo Y, Gong J, Li Y, Huang H, Meng Y and Liu X (2023) Machine learning and bioinformatics framework integration reveal potential characteristic genes related to immune cell infiltration in preeclampsia. Front. Physiol. 14:1078166. doi: 10.3389/fphys.2023.1078166
Received: 24 October 2022; Accepted: 30 May 2023;
Published: 13 June 2023.
Edited by:
Elisabeth Pinart, University of Girona, SpainReviewed by:
Erin Taylor, University of Mississippi Medical Center, United StatesAsral Wirda Ahmad Asnawi, Universiti Sains Islam Malaysia, Malaysia
Copyright © 2023 Bai, Guo, Gong, Li, Huang, Meng and Liu. This is an open-access article distributed under the terms of the Creative Commons Attribution License (CC BY). The use, distribution or reproduction in other forums is permitted, provided the original author(s) and the copyright owner(s) are credited and that the original publication in this journal is cited, in accordance with accepted academic practice. No use, distribution or reproduction is permitted which does not comply with these terms.
*Correspondence: Xinmei Liu, bGl1eGlubWVpQGZ1ZGFuLmVkdS5jbg==; Yicong Meng, MDEwNDE1OTAwN0BzanR1LmVkdS5jbg==
†These authors have contributed equally to this work and share first authorship