 Joachim Van Lommel1†
 Michiel Holtof1†
 Laurentijn Tilleman2
 Dorien Cools1Seppe Vansteenkiste1Daria Polgun1Rik Verdonck1,3
 Filip Van Nieuwerburgh2
 Jozef Vanden Broeck1*
- 1Molecular Developmental Physiology and Signal Transduction Lab, Department of Biology, University of Leuven, Leuven, Belgium
- 2NXTGNT, Department of Pharmaceutics, Ghent University, Ghent, Belgium
- 3Environmental Biology, Centre for Environmental Sciences, Hasselt University, Hasselt, Belgium
The digestive tract constitutes an important interface between an animal’s internal and external environment. In insects, available gut transcriptome studies are mostly exploratory or look at changes upon infection or upon exposure to xenobiotics, mainly performed in species belonging to holometabolan orders, such as Diptera, Lepidoptera or Coleoptera. By contrast, studies focusing on gene expression changes after food uptake and during digestion are underrepresented. We have therefore compared the gene expression profiles in the midgut of the desert locust, Schistocerca gregaria, between three different time points after feeding, i.e., 24 h (no active digestion), 10 min (the initial stage of feeding), and 2 h (active food digestion). The observed gene expression profiles were consistent with the polyphagous herbivorous lifestyle of this hemimetabolan (orthopteran) species. Our study reveals the upregulation of 576 genes 2 h post-feeding. These are mostly predicted to be associated with digestive physiology, such as genes encoding putative digestive enzymes or nutrient transporters, as well as genes putatively involved in immunity or in xenobiotic metabolism. The 10 min time point represented an intermediate condition, suggesting that the S. gregaria midgut can react rapidly at the transcriptional level to the presence of food. Additionally, our study demonstrated the critical importance of two transcripts that exhibited a significant upregulation 2 h post-feeding: the vacuolar-type H(+)-ATPase and the sterol transporter Niemann-Pick 1b protein, which upon RNAi-induced knockdown resulted in a marked increase in mortality. Their vital role and accessibility via the midgut lumen may make the encoded proteins promising insecticidal target candidates, considering that the desert locust is infamous for its huge migrating swarms that can devastate the agricultural production in large areas of Northern Africa, the Middle East, and South Asia. In conclusion, the transcriptome datasets presented here will provide a useful and promising resource for studying the midgut physiology of S. gregaria, a socio-economically important pest species.
1 Introduction
The digestive tract represents an important interface between an animal’s external and internal environment. To ensure survival, changes in the digestive tract, such as food intake, infection, and ingestion of plant toxins and other xenobiotics, require a swift reaction. The aim of this study is to improve our understanding of insect digestive physiology by analyzing the midgut transcriptome of the socio-economically important pest species, the desert locust (Schistocerca gregaria) (Cullen et al., 2017), as well as to compare gene expression profiles in the midgut at different post-feeding time points.
Annotated midgut transcriptomes have become abundantly available, though mostly in holometabolan insect orders, such as Diptera, Lepidoptera and Coleoptera, presumably due to their large species diversity and prevalence of insect pests in these orders (Sanders et al., 2003; Campbell et al., 2005; Pauchet et al., 2009; Ma et al., 2012; Xu et al., 2012; Noland et al., 2013; Herde and Howe, 2014; Spit et al., 2016a; Zhang et al., 2016; Gazara et al., 2017; Huang et al., 2017; Nadeau et al., 2017; Lu et al., 2018; Dhania et al., 2019; Bonelli et al., 2020; Coutinho-Abreu et al., 2020; Cui and Franz, 2020; Hung et al., 2020; Kuang et al., 2021; Shu et al., 2021; Zou et al., 2021; Hixson et al., 2022; Jin et al., 2022). As expected in the insect midgut, transcripts encoding digestive enzymes, nutrient transporters, and proteins involved in detoxification and peritrophic membrane formation are abundantly present (Pauchet et al., 2009; Ma et al., 2012; Gazara et al., 2017). The composition of midgut digestive enzymes is often complex, species-dependent and is largely determined by feeding habits, food quality, and specific midgut luminal environments, and presence of symbiotic microbiota (Holtof et al., 2019; Hung et al., 2020).
In addition to descriptive transcriptomic studies, many comparative studies are available, primarily focusing on changes in midgut gene expression upon infection or exposure to xenobiotics. Changes in immunity- and detoxification-related genes upon infection tend to be complex as well as species- and pathogen- or toxin-dependent. Upon infection, a shift in gene expression generally occurs, inhibiting digestive processes in favor of the immune system (Noland et al., 2013; Coutinho-Abreu et al., 2020; Kuang et al., 2021). Transcriptomic studies investigating the xenobiotic metabolism in the digestive tract clearly revealed a strong ability of insects to metabolize foodborne toxins, i.e., plant-derived xenobiotics, bacterial entomotoxins, or synthetic insecticides (Herde and Howe, 2014; Dhania et al., 2019; Shu et al., 2021; Jin et al., 2022). This is reflected by high numbers of detoxification enzymes, namely, cytochrome P450s (CYPs), carboxylesterases (CEs), glutathione S-transferases (GSTs), and uridine diphosphate glucuronosyl-transferases (UGTs), being observed in the insect midgut (Pauchet et al., 2009; Spit et al., 2016a; Zhang et al., 2016; Rane et al., 2019).
Despite the abundance of midgut transcriptomes, very few studies have focused on post-feeding midgut gene expression changes. Often these studies have focused on gene expression changes upon a bloodmeal in dipterans, where generally an upregulation of digestion-related genes is reported, especially of serine proteases, which is to be expected for a protein-rich food source such as blood (Sanders et al., 2003; Campbell et al., 2005; Cui and Franz, 2020). There is a limited number of reports comparing high-quality to low-quality diets in herbivorous insects (Huang et al., 2017; Lu et al., 2018; Bonelli et al., 2020; Zou et al., 2021). In Chilo suppressalis larvae fed on a toxin-rich plant diet, the majority of studied digestion-, detoxification-, and immune-related genes were downregulated (Lu et al., 2018). By contrast, when Spodoptera litura larvae were fed with a toxin-rich food source, upregulated genes were enriched in detoxification-related genes as soon as 6 h after feeding, while downregulated genes were enriched in digestion- and immune-related genes as soon as 48 h after feeding (Zou et al., 2021). Various digestive enzymes were upregulated when the grasshopper, Oedaleus asiaticus, was fed on a high-quality food source (Huang et al., 2017). Black soldier fly (Hermetia illucens) larvae showed the ability to optimally exploit various food sources by tweaking the expression of digestive enzymes (Bonelli et al., 2020). Nevertheless, research investigating post-feeding temporal changes in midgut gene expression, besides post-bloodmeal ingestion, are surprisingly scarce. In Nilaparvata lugens, two midgut sugar transporters were found to be upregulated 2 h after feeding, although other genes were not analyzed (Kikuta et al., 2015). One study investigated differences between unfed and fed males and females in the beetle Dendroctonus ponderosae. Although primarily focusing on pheromone biosynthesis (Nadeau et al., 2017), large differences were observed in gene expression profiles, including an upregulation of digestion related genes upon feeding. In Bombyx mori, many digestion-related genes were reported to be downregulated, while immunity-related genes were upregulated in the wandering stage, during which larvae stop feeding (Xu et al., 2012).
Here, we intend to address this knowledge gap by investigating the gene expression changes upon feeding in the midgut of the desert locust, S. gregaria (Orthoptera). The desert locust is a polyphagous herbivorous species, known as one of the most destructive migratory pests in the world due to its swarming behavior and voracious appetite (Cullen et al., 2017). Gut transit time can vary greatly amongst insects, depending on feeding habitats and diet (Chapman, 2013). Locusts will ingest food until their crop is maximally expanded, resulting in the activation of stretch receptors present on the foregut (Chapman, 2013). Active stretch receptors will lead to the cessation of feeding. Water and solutes are absorbed in the midgut of Locusta migratoria as soon as 5 min after feeding, while solid particles enter the midgut as soon as 15 min after feeding (Baines et al., 1973). In L. migratoria with continuous access to food a meal had left the crop and had entered the midgut after 1.5 h and the midgut was empty after 2 h, which is consistent with observations in the grasshopper Abracris flavolineata (Baines et al., 1973; Simpson, 1983; Marana et al., 1997). By contrast, in the absence of additional food, it can take 8 h for food to leave the locust midgut (Chapman, 2013).
The main objective of this study is to analyze the general midgut transcript profile of S. gregaria as well as changes in midgut gene expression during different stages of feeding. By doing so we aim to address the underrepresentation of midgut gene expression studies outside of the Diptera, Lepidoptera and Coleoptera orders as well as the lack of studies focusing on post-feeding temporal changes. To illustrate this, there are currently only two Orthoptera species with a publicly available annotated midgut transcriptome: L. migratoria and O. asiaticus (Spit et al., 2016a; Huang et al., 2017). This is remarkable as some orthopteran species, including S. gregaria, are notorious pests. In this study, we compared the midgut gene expression profile between three different time points of the digestive process, which were chosen based on reports in literature (Baines et al., 1973; Marana et al., 1997) as well as our own observations: 24 h after feeding (no active digestion), 10 min after feeding (the initial stages of feeding) and 2 h after feeding (active digestion in the midgut). In addition, we functionally characterized two transcripts that were upregulated upon feeding, using RNA interference, namely, a vacuolar-type H(+)-ATPase (H+ V-ATPase) subunit (SgVAHa1) and a sterol transporter orthologue (SgNPC1b).
2 Materials and methods
2.1 Animal rearing
Desert locusts (S. gregaria gregaria) were kept under crowded conditions at a controlled temperature (30°C ± 1°C), relative humidity (50% ± 10%), and photoperiod (a daily 14 h:10 h light:dark cycle). In addition, during this photoperiod, incandescent light bulbs (40 W) generated a temperature gradient within the cages. Locusts were allowed daily to feed ad libitum on fresh cabbage leaves (Brassica oleracea), supplemented with rolled oats. Adult females deposited their eggs in pots filled with a slightly moistened turf/sand mixture (1:3 ratio). Pots were collected weekly and then transferred to empty cages. Measures were taken to avoid contamination of midgut samples intended for sequencing by gregarines (2.3). Gregarines are parasitic microorganisms that infect the midgut of S. gregaria and other Orthoptera. Six to seven-day-old eggs were carefully removed from the egg pods and rinsed with distilled water to remove soil particles. Next, eggs were disinfected by washing them in ethanol (70%) for 30 s, then rinsed with distilled water and finally transferred to clean egg pots (pretreated with 10% bleach) containing an autoclaved turf/sand mixture. The egg pots were placed in a disinfected cage (pretreated with 10% bleach) located inside a closed incubator (J.P. Selecta®, 30°C ± 1°C, relative humidity 50% ± 10%).
2.2 Tissue collection and RNA extraction
2.2.1 Dissections and tissue collection
All dissections were performed under an SZ2-ST binocular microscope (Olympus), and images were taken using a mounted HD-Pro VC.3038 camera (Euromex). Animals were weighed using a Genius ME215p analytical balance (Sartorius). Tissues were immediately transferred to screwcapped 2 mL Eppendorf vials containing 0.5 mL RNAlater (Thermo Scientific™) to avoid RNA degradation. Subsequently, tissues were removed from RNAlater, rinsed in S. gregaria Ringer (1 L: 8.766 g NaCl; 0.188 g CaCl2; 0.746 g KCl; 0.407 g MgCl2; 0.336 g NaHCO3; 30.807 g sucrose; 1.892 g trehalose; pH 7.2), and transferred to MagNA Lyser Green Beads vials (Roche), with the exception of suboesophageal ganglia (SOG) and prothoracic glands (PG) which were transferred to screwcapped 1.5 mL Eppendorf vials. All tissues were stored at −80°C until RNA extraction (2.2.2). For ecdysteroid measurements, 10 µL of hemolymph was collected using a glass capillary prior to sacrificing the animals and immediately transferred to 300 µL of phosphate-buffered saline (PBS) (13.7 mM NaCl, 0.27 mM KCl, 1 mM NH2HPO4, 0.18 mM KH2PO4, pH 7.4) and 300 µL of 1-butanol (Merck). After vortexing and centrifugation at 20,000 × g for 10 min, the upper organic phase was collected, lyophilized using a SpeedVac vacuum concentrator, and stored at −20°C until ecdysteroid extraction (2.6).
2.2.2 Total RNA extraction
Two different RNA extraction methods were used based on tissue type. Total RNA was extracted using the RNeasy Lipid Tissue extraction kit (Qiagen) according to the manufacturer’s protocols. To each MagNA Lyser Green Beads vial (Roche), 1 mL QIAzol lysis reagent buffer (Thermo Scientific™) was added. Next, the tissues were homogenized for 30 s at 6,000 × g using a MagNA Lyser instrument (Roche). Finally, total RNA was eluted in 80 μL of nuclease-free water. By contrast, total RNA was extracted from the SOG and PG using the RNAqueous®-Micro Kit (Ambion) according to the manufacturer’s protocols. First, 100 µL of lysis solution was added to the tissues. Next, tissues were disrupted and homogenized using a Teflon micro pestle attached to a drill. Using either extraction method, a DNase treatment was performed upon elution of the extracted RNA. In both cases, the concentration of the resulting RNA extracts was determined by means of a Nanodrop spectrophotometer (Nanodrop ND-1000, Thermo Fisher Scientific, Inc.). RNA extracts were stored at −80°C.
2.3 mRNA sequencing of the midgut
The S. gregaria midgut transcriptome was studied at three distinct time points. The following steps were therefore followed. First, the whole-body transcriptome of Ragionieri et al. (Ragionieri et al., 2022) (GenBank accession number GJPN000000000.1) was cleaned and annotated (2.3.1). Next, total RNA extracts from the midgut (2.3.2) were sequenced and mapped (2.3.3) to this reference transcriptome. Finally, a differential gene expression analysis was performed to characterize gene expression changes across three different timepoints of the digestive process (2.3.4).
2.3.1 Processing and annotating of the reference transcriptome
The S. gregaria whole-body transcriptome of Ragionieri et al. (Ragionieri et al., 2022) (GenBank accession number GJPN000000000.1) contains different gene isoforms and was therefore first processed to reduce the redundancy of transcript sequences. The tool Supertranscripts combines all isoforms of a transcript into one assembled contiguous sequence referred to as a SuperTranscript (Davidson et al., 2017). A SuperTranscript is a single linear sequence constructed from collapsing unique and common sequence regions of all available splicing isoforms of a transcript. This way, all isoforms of a transcript are combined into one assembled contiguous sequence without losing transcript data (Davidson et al., 2017). Furthermore, the original transcripts that make up the SuperTranscripts can be retraced in the original transcriptome (GJPN000000000.1). Therefore, the SuperTranscripts transcriptome version provides a very potent alternative reference for mapping RNA-Seq reads. The SuperTranscripts transcriptome retained 140,093 distinct transcripts. Next, the CD-HIT-EST tool clusters highly similar sequences (>95%) and thereby filters remaining redundant sequences, resulting in the removal of 16,379 redundant contigs (Li and Godzik, 2006; Fu et al., 2012). The resulting processed transcriptome containing 123,714 contigs was submitted to Gene Expression Omnibus (GEO) (accession number GSE226871). Next, the processed transcriptome was annotated in different steps. First, these nucleotide sequences were translated to their predicted best coding sequence using Transdecoder1 and annotated using Trinotate according to the procedure described by Bryant et al. (Bryant et al., 2017). Next, all transcript sequences and their predicted coding sequences were used as queries for Basic Local Alignment Search Tool searches (BLASTx and BLASTp, E ≤ 1e−5) (Boratyn et al., 2013) in the annotated UniProtKB/Swiss-Prot databases (Boeckmann et al., 2005; Bateman et al., 2015). The hits from these homology searches were used to provide the functional annotations of Gene Ontology (GO) and Clusters of Orthologous Groups (COG) terms (Figures 1, 2). The predicted coding regions were further used to annotate domain content in the Pfam database currently hosted by InterPro2 (Mistry et al., 2021) using the HMMER software3 (version 3.1.2), signal peptides4 (SignalP, version 4.1), and transmembrane domains5 (TMHMM, version 2.0). This processed and annotated transcriptome served as a reference for mapping the sequenced reads and is referred to as the reference transcriptome from this point forward. Finally, the annotated mapped midgut transcripts were organized in an SQLite database using Trinotate (Supplementary Table S1).
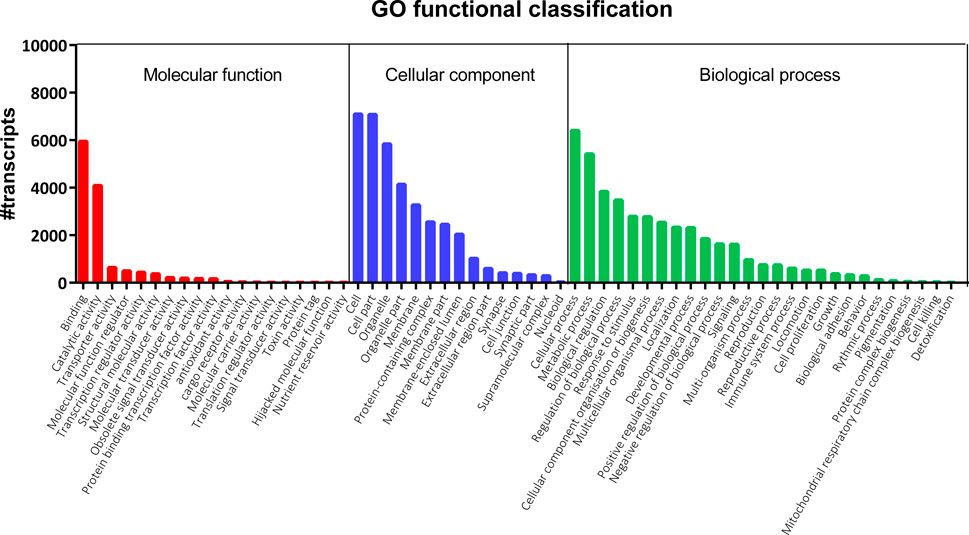
FIGURE 1. Gene Ontology (GO) classification of nucleotide sequences in the S. gregaria midgut transcriptome. GO terms belonging to three categories are indicated on the x-axis: “Molecular function” (red), “Cellular component” (blue), and “Biological process” (green). The number of annotated transcripts is indicated on the y-axis. A total of 22,961 GO terms were assigned to 8,645 distinct transcripts (44.6%) of the midgut transcriptome. These GO terms were further subdivided into 7,443; 7,837 and 7,681 terms representing “Biological process”, “Cellular component”, and “Molecular function”, respectively.
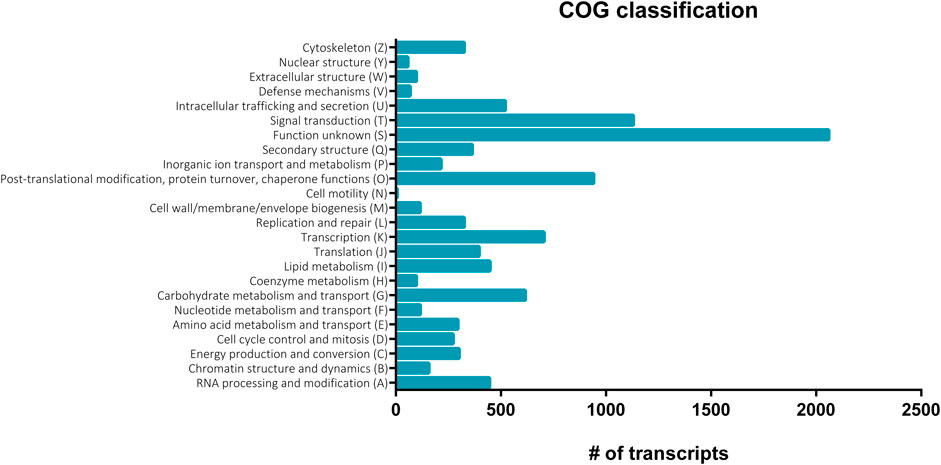
FIGURE 2. Clusters of orthologous groups (COG) functional classification of nucleotide sequences in the S. gregaria midgut transcriptome. COG assignments were based on the COG alphabet, retrieved from the Swiss-Prot database and used to cluster transcripts according to predicted orthology. A total of 7,142 transcripts (36.9%) of the midgut transcriptome could be attributed to at least one COG category. The number of transcripts is plotted on the x-axis. The different COG categories are shown on the y-axis.
2.3.2 Sample preparation
Three different post-feeding timepoints were selected based on the progression of the digestive process in S. gregaria. Based on descriptions in literature (Baines et al., 1973; Marana et al., 1997) and our own observations, we decided to analyze the transcript profile of the midgut in S. gregaria during the initial phase of digestion (10 min after food uptake) when the ingested food was present in the foregut, and the core phase of digestion when the majority of the food bolus was observed in the midgut lumen (2 h after food uptake). We compared both these timepoints to a reference condition with locusts that had not been fed for 24 h (24 h after food uptake). This condition can therefore also be considered as a group of animals that were food-deprived (or starved) for 24 h. To obtain samples from these timepoints, animals with a balanced sex ratio were bred under gregarine-free conditions (2.1). From the day they molted to the 5th nymphal stage (N5D0), feeding was synchronized by allowing animals to feed on freshly washed cabbage leaves twice daily, in the morning and the afternoon, for 1 h periods (Figure 3A). After feeding on the morning of the 4th day of the N5 stage (N5D4), three groups were established: one group was deprived of food for the next 24 h and sacrificed the next day (24 h condition). The other animals were allowed to eat for 1 h in the afternoon of N5D4 and received a final meal in the morning of N5D5. They were allowed to eat for 10 min from this meal, which was equal to their typically observed initial feeding stage. A group of animals was sacrificed after an additional 10 min (10 min condition), and a second group of animals was sacrificed after 2 h (2 h condition). In both cases, the time was measured from the end of the initial 10 minutes feeding period. Animals were dissected as described in 2.2.1. Additionally, the dissections of all three groups were executed on the same day around the same time to exclude any potential circadian effects. Midgut tissues of six animals were pooled per sample. For each condition, six biological replicate samples were collected.
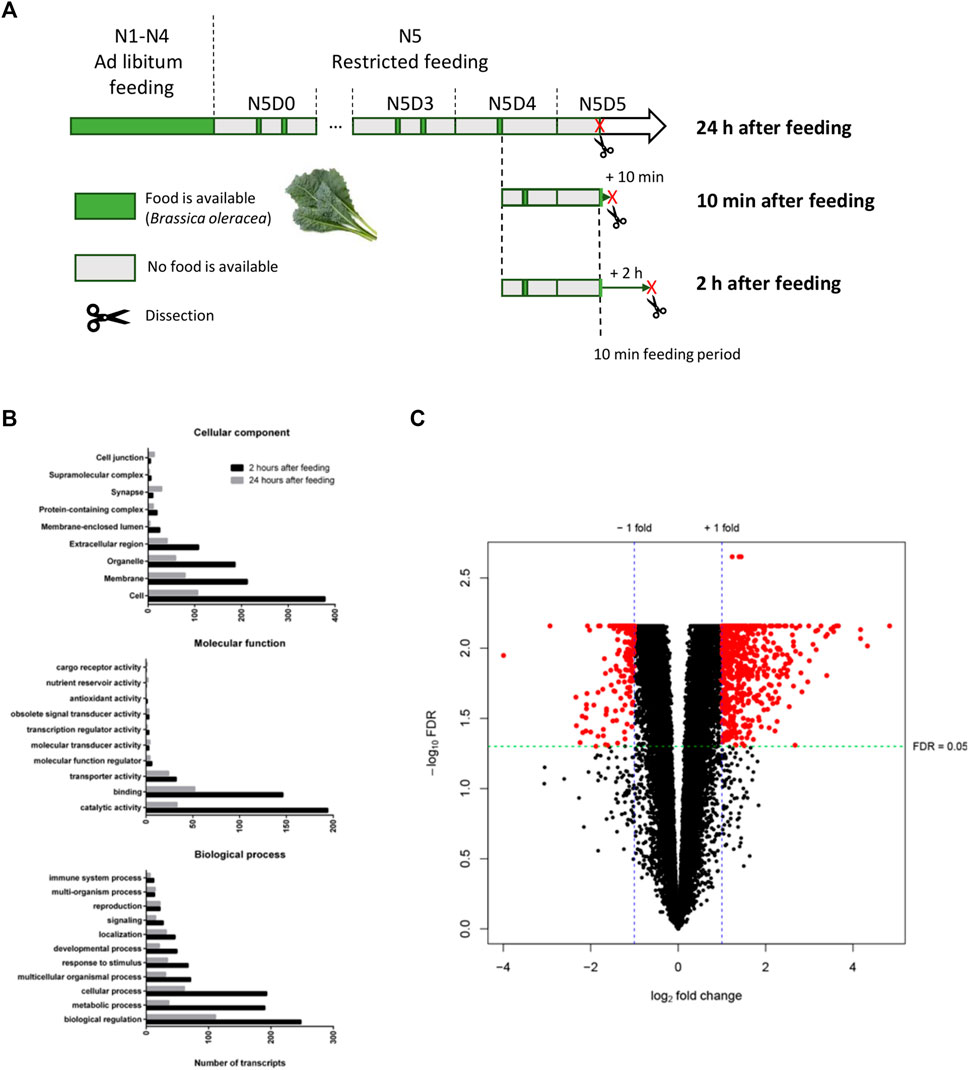
FIGURE 3. Differential gene expression analysis of the midgut transcriptome. (A) Graphical overview of the sampling strategy for the collection of midgut tissues at three post-feeding timepoints for RNA-seq. Desert locusts (Schistocerca gregaria) were fed ad libitum from the first (N1) until the end of the 4th nymphal instar (N4). From the day animals molted to the 5th nymphal instar (N5D0) they were fed twice a day during 1 h feeding periods at 10 a.m. and 5 p.m. (restricted feeding). Feeding periods when animals were provided Brassica oleracea leaves are indicated by green bars. Periods when animals were deprived of food are indicated by grey bars. The length of the bars is time-proportional for the N5 instar. Sacrificing and subsequent dissection of animals are indicated by a red “X” and a scissor pictogram, respectively. Animals were divided into three groups on the morning of N5D4. Animals from the 24 h condition were deprived of food after the feeding session on the morning of N5D4 and dissected 24 h later on N5D5. Animals from the remaining two conditions were allowed to feed for 10 min on the morning of N5D5 and were dissected 10 min or 2 h after this initial feeding period (10 min after feeding and 2 h after feeding condition, respectively). (B) Summary of the gene ontology (GO) term annotations of differentially expressed genes in the S. gregaria midgut 2 hours after feeding (2 h) compared to 24 h after feeding (24 h). Black bars represent transcripts belonging to GO terms that are upregulated 2 h after feeding compared to 24 h, while gray bars represent transcripts belonging to GO terms that are downregulated 2 h after feeding compared to 24 h. GO terms are subdivided into three ontologies: “Cellular component”, “Molecular function”, and “Biological process”. GO terms are indicated on the y-axis. The number of annotated transcripts is indicated on the x-axis. (C) Volcano plot of differentially expressed genes 2 h after feeding (2 h) compared to 24 h after feeding (24 h). For each individual transcript (represented by a single dot) the negative log of the false discovery rate adjusted p-values (-log10FDR) is plotted against the log2 fold change (log2FC). Red dots represent differentially expressed transcripts. A -log10FDR-adjusted p-value of ±1.30 corresponds to an FDR-adjusted p-value (FDR) of 0.05. 569 transcripts with log2FC ≥ 1 and FDR ≤ 0.05 were considered upregulated 2 h after feeding compared to 24 h. 212 transcripts with log2FC ≤ −1 and FDR ≤0.05 were considered downregulated 2 h after feeding compared to 24 h.
2.3.3 Mapping of sequenced reads to the reference transcriptome
From each sample, 1 μg of total RNA was used to perform an Illumina® sequencing library preparation using the TruSeq® Stranded mRNA Library prep kit (Illumina®) according to the manufacturer’s protocol. First, poly-A-containing mRNA molecules are enriched from the total RNA mixture using poly-dT oligonucleotides attached to magnetic beads. Next, these purified mRNA molecules were fragmented into smaller fragments (100–1,000 nt) using divalent metal cations under elevated temperature in a proprietary Illumina® fragmentation buffer. The smaller RNA fragments resulting from the fragmentation step were used for the first-strand cDNA synthesis using reverse transcriptase and random primers. Next, a single adenosine was added to these cDNA fragments, followed by the ligation of the Illumina® adapters. The resulting cDNA products were then purified and enriched with 13 PCR cycles to create the final cDNA library. Libraries were quantified by RT-qPCR, according to Illumina’s “Sequencing Library qPCR Quantification protocol guide,” version February 2011. A High Sensitivity DNA chip (Agilent Technologies®) was used to control the library’s size distribution and quality. A total of six midgut samples per condition (eighteen in total) were sequenced on a high throughput Illumina® NextSeq 500 flow cell generating 75 bp single reads. The samples were multiplexed, allowing for the sequencing of all samples on one Illumina® flow cell. Moreover, sequencing was performed in duplicate on two different flow cells to increase sequencing depth (Supplementary Figure S1).
Prior to mapping, Illumina® adapter sequences were trimmed using Cutadapt (version 1.11) (Martin, 2011). Base calling quality was assessed using FastQC6. Trimmed sequencing reads were mapped to the reference transcriptome using Bowtie2 (version 2.2.5). Transcript abundance was quantified using the RSEM software package (RNA-seq by Expectation Maximization, version 1.2.31) (Li and Dewey, 2011). Transcripts that did not have an abundance of at least 1 count-per-million in at least six out of eighteen samples were considered to be both biologically and statistically irrelevant and were removed from the dataset prior to downstream analyses. The other transcripts were considered quantifiable. Read counts were normalized using Bioconductor software edgeR’s standard TMM normalization method (Robinson, McCarthy, and Smyth, 2009) in R, version 3.4.27. These TMM-normalized transcript counts were used to calculate differential expression among the three conditions (Supplementary Table S2).
2.3.4 Differential expression analysis
A principal component analysis (PCA) was performed on regularized log-transformed counts using the DESeq2 Bioconductor software in R (Supplementary Figure S2) (Love et al., 2014). Differential expression analysis between groups of samples was performed using the Bioconductor package edgeR in R (Robinson et al., 2009). Three separate differential expression analyses were performed: 10 min vs. 24 h, 2 h vs. 24 h, and 10 min vs. 2 h. A generalized linear model was built for each separate analysis, and statistical testing was done using the empirical Bayes quasi-likelihood F-test. Transcripts having a false discovery rate (FDR) adjusted p-value ≤ 0.05 and a log2 fold change (FC) ≥ 1 or ≤ −1 were considered to be significantly differentially expressed.
2.4 RNA interference
Double-stranded (ds)RNA constructs targeting SgNPC1b (dsNPC1b1 and dsNPC1b2), SgVAHa1 (dsVAHa1) and GFP (dsGFP) were produced using the MEGAscript® RNAi kit (Ambion). This procedure of dsRNA production is based on a high-yield in vitro transcription reaction from a DNA template with flanking T7 promoter sequences. Therefore, forward and reverse primers flanked by the T7 promoter sequence were used in a PCR reaction with REDTaq DNA polymerase (Sigma-Aldrich) to amplify a fragment of the target gene (Supplementary Table S3). Primer positions and amplicon sequences can be found in Supplementary Figures S3, S4. The dsRNA constructs are 542 bp (dsVAHa1), 795 bp (dsNPC1b1), 550 bp (dsNPC1b2) and 589 bp (dsGFP) in length. Amplicons were separated by agarose gel electrophoresis (1.2% agarose gel containing GelRedTM (Biotium) and further purified (GenEluteTM Gel Extraction Kit, Sigma-Aldrich). These fragments were cloned (TOPO® TA cloning kit for sequencing, Invitrogen) and the amplicon sequences were confirmed (Sanger sequencing, LGC genomics, Berlin, Germany). The resulting plasmids were subsequently used as templates for in vitro transcription. The dsRNA concentration was determined by means of a Nanodrop spectrophotometer (Nanodrop ND-1000, Thermo Fisher Scientific, Inc.). The dsRNA was further diluted to 50 ng/μL in an isotonic S. gregaria Ringer solution to avoid osmotic effects upon injection and stored at −20°C. Locusts were injected with dsRNA using a Hamilton syringe into the hemocoel by entering the needle between the first and second abdominal segment on the ventrolateral side, pointing towards the thorax. Animals were marked on their prothoracic tergite with nail polish to distinguish the experimental conditions. Animals were injected on N4D6, N5D1, N5D3, and N5D6 with 500 ng of dsRNA in 10 µL of S. gregaria Ringer solution (SgVAHa1 KD, dsGFP: n = 45, dsVAHa1: n = 46; SgNPC1b KD, dsGFP: n = 10, dsNPC1b1: n = 10, dsNPC1b2: n = 10). A subset of fifteen animals per condition were dissected on N5D6 for their midgut to assess knockdown efficiency. The remaining animals were monitored daily to assess mortality and successful molting until they either died or molted into adulthood. In case of a SgNPC1b knockdown, animals were weighed on N5D0 and N5D6.
2.5 RT-qPCR
Prior to RT-qPCR transcript profiling, several previously described housekeeping genes were tested for their stability (Van Hiel et al., 2009). Optimal housekeeping genes were selected using the geNorm software (Vandesompele et al., 2002). RT-qPCR primers for reference genes and target genes were designed using the online tool primer3plus8 (Supplementary Table S4). Primer sets were validated by designing relative standard curves for gene transcripts with a serial ten-fold dilution of a calibrator cDNA sample. The efficiency of RT-qPCR and correlation coefficient were measured for each primer pair. All PCR reactions were performed in duplicate in 96-well plates on a QuantStudio™ 3 Real-Time PCR System (ABI Prism, Applied Biosystems). Each reaction contained 5 µL Fast SYBRTM Green Master Mix (Applied Biosystems), 0.5 µL Forward and Reverse primer (10 μM), 1.5 µL Milli-Q water (Millipore, MQ), and 2.5 µL of diluted cDNA. For all RT-qPCR reactions, the following thermal cycling profile was used: 50°C for 2 min, 95°C for 10 min, followed by 40 cycles of 95°C for 15 s and 60°C for 60 s. Finally, a melt curve analysis was performed to check for primer dimers. Relative transcript levels were calculated using the ΔΔCt method according to Livak and Schmittgen (Livak and Schmittgen, 2001). To correct for variation between samples, expression was normalized against two housekeeping genes, SgRP49 and SgGAPDH.
2.6 Ecdysteroid measurements using EIA
Hemolymph samples were collected, and the organic phase was stored as described in 2.2.1. Dried extracts were dissolved in 200 µL chloroform (Acros Organics, Thermo Fisher Scientific) and 200 µL MQ. The organic phase was re-extracted twice with (1:1) MQ. Next, the aqueous phases were pooled and lyophilized. Ecdysteroid titers were measured using the Enzyme Immunoassay kit (Bertin Bioreagent) according to the manufacturer’s protocol. This protocol includes acetylcholinesterase (AChE®)-labeled 20-hydroxyecdysone (20E) as a tracer together with rabbit polyclonal antiserum. Absorbance was measured at 414 nm using a Mithras LB 940 (Mikrotek) microplate reader. The ecdysteroid levels were normalized to a series of known 20E concentrations ranging from 39.1 pg/mL to 5,000 pg/mL.
2.7 Statistical analysis
Differential expression analysis of the midgut transcriptome is described in 2.3.4. Relative transcript levels, weight gain, and 20E levels were first tested for normality using the Shapiro-Wilk normality test. Next, differences between control and treatment groups were inferred using the Student’s t-test or one-way ANOVA with Holm-Šídák’s post hoc test. Survival and molting rate were analyzed using a log-rank Mantel-Cox test. The threshold for statistical significance was p ≤ 0.05. All of the above-mentioned statistical analyses were performed using GraphPad Prism software (Version 6).
3 Results
3.1 mRNA sequencing of the midgut
A total of eighteen samples, six per timepoint, were sequenced on two Illumina® NextSeq 500 flow cells, generating on average 55 ± 10 million (M) reads per sample. On average, 88%–90% of the reads mapped at least once to the reference transcriptome. RSEM was used to estimate the transcript abundances in all eighteen RNA-Seq samples (Supplementary Table S2). These data were used to infer differential gene expression across the different conditions (3.3). Amongst 19,345 quantifiable transcripts, 5,732 are SuperTranscripts constructed from at least two transcript isoforms, while the remaining 13,613 are unique transcripts. Using Transdecoder, 10,536 transcripts were shown to have at least one open reading frame. Trinotate retrieved GO and COG based functional annotations of the transcripts from the Swiss-Prot database (Table 1). Altogether, a total of 10,939 of the quantifiable transcripts had at least one functional annotation. Additionally, non-coding (nc) RNAs databases were searched, but no significant hits were retrieved. A total of 22,961 GO terms were assigned to 8,645 distinct transcripts (44.6%). These GO terms were further divided into 7,443; 7,837 and 7,681 terms representing biological process (BP), cellular component (CC), and molecular function (MF), respectively (Figure 1). The BP ontology indicated that the annotated transcripts are predicted to mediate a wide range of biological processes, including cellular, metabolic, and regulatory processes. In the CC ontology, the most abundant subcategories were “cell” and “cell part” (7,098 and 7,079 transcripts; respectively). Additionally, a high number of transcripts were assigned to the subcategories “membrane” (3,274 transcripts) and “extracellular region” (1,022 transcripts). Most transcripts in the MF ontology, 5,947 and 4,090; respectively, were assigned to the subcategories “binding” and “catalytic activity.” A total of 7,142 transcripts (36.9%) could be attributed to at least one COG category (Figure 2). “Function unknown” (S) was by far the largest represented COG group (2,060; 20.5%), followed by “signal transduction” (T) (1,130; 11.2%), and “post-translational modification, protein turnover and chaperone functions,” respectively (O) (941, 9.3%).
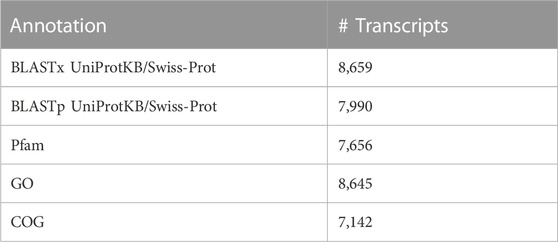
TABLE 1. Functional annotation of the S. gregaria midgut transcriptome by matching to different databases.
3.2 Composition of the midgut transcriptome
3.2.1 Digestive enzymes
Numerous transcripts predicted to encode proteases were identified amongst putative digestive enzymes, of which the majority code for serine proteases, such as trypsin and chymotrypsin (Supplementary Table S5). Large numbers of the most commonly found types of carbohydrases were identified, namely, α-Amylase, α-Glucosidase, and β-Glucosidase, as well as three transcripts encoding putative cellulases belonging to the GH9 family of endoglucanases (Pfam00759). A relatively large variety of lipid-degrading enzymes was identified, namely, lipases, phospholipases, and sterol dehydrogenases/reductases. Finally, putative DNase, RNase, nucleotidase and nucleosidase encoding transcripts were present in the S. gregaria midgut.
3.2.2 Nutrient absorption and other intestinal processes
Multiple transcripts encoding putative amino acid, carbohydrate, and lipid transporters were identified (Supplementary Table S6). Additionally, the midgut transcriptome was scanned for other transcripts known to contribute to the intestinal physiology of herbivorous insects, including those involved in peritrophic membrane formation, transmembrane trafficking, and xenobiotic metabolism (Supplementary Table S7). Transcripts predicted to encode proteins active in all three phases of detoxification of xenobiotics were identified, namely, P450s and CEs (phase I), UGTs and GSTs (phase II) as well as putative transmembrane transporters such as members of the ATP-binding cassette (ABC) family of transporters (phase III).
3.3 Differential expression analysis
A PCA was performed to explore if samples clustered condition-dependently and to detect any outlier samples (Supplementary Figure S2). The majority of the variability, 48% and 17.7% respectively, could be explained by principal components (PC) 1 and 2. Samples of the 2 h and 24 h conditions could be separated on PC1, with the exception of sample sixteen. By contrast, two samples of the 10 min condition grouped with the 24 h condition, while the remaining samples grouped with the 2 h condition. A differential gene expression analysis was performed with pairwise comparisons of all three conditions. No significantly differentially expressed genes (DEGs) were identified when comparing the 10 min condition to the 24 h condition or the 10 min condition to the 2 h condition. Nevertheless, a total of 569 and 212 transcripts were found to be significantly up- and downregulated, respectively, in the 2 h condition compared to the 24 h condition (Figure 3; Supplementary Tables S8, S9). From these transcripts, 283 up- and 84 downregulated transcripts had at least one GO term annotation, meaning that 50.3% and 60.4% of these transcripts, respectively, did not have a functional annotation. Transcripts with a GO term annotation that were upregulated 2 h post-feeding compared to 24 h, belong mostly to the GO terms “catalytic activity” and “binding” from the MF ontology and “Cellular process”, “Metabolic process”, and “Biological regulation” from the BP ontology (Figure 3B).
Differentially expressed transcripts 2 h after feeding were classified according to Pfam protein family, of which 239 up- and 69 downregulated transcripts could be ascribed to at least one Pfam family. Amongst others, various transcripts predicted to encode proteins contributing to the enzymatic digestion, nutrient uptake and detoxification of xenobiotics were upregulated 2 h after feeding (Table 2). In contrast to the high number of induced putative protease and carbohydrase encoding transcripts, significantly fewer putative lipid-degrading enzymes were induced in transcript levels 2 h after feeding. Furthermore, transcripts predicted to encode transporters for all major nutrients, namely, amino acids, carbohydrates, and lipids, were represented amongst upregulated transcripts. We also identified transcripts encoding proteins that are predicted to play a role in all three phases of detoxification of xenobiotics, namely, CEs, GSTs, UGTs, nitrile-specifier proteins (NSP) and members of the ABC family of transporters. In addition to putative ABC transporters, transcripts predicted to encode other transmembrane protein complexes were upregulated, such as a H+ V-ATPase subunit-a transcript. By contrast, according to their Pfam classification, no genes predicted to be involved in enzymatic digestion or nutrient uptake were downregulated 2 h after feeding (Table 3).
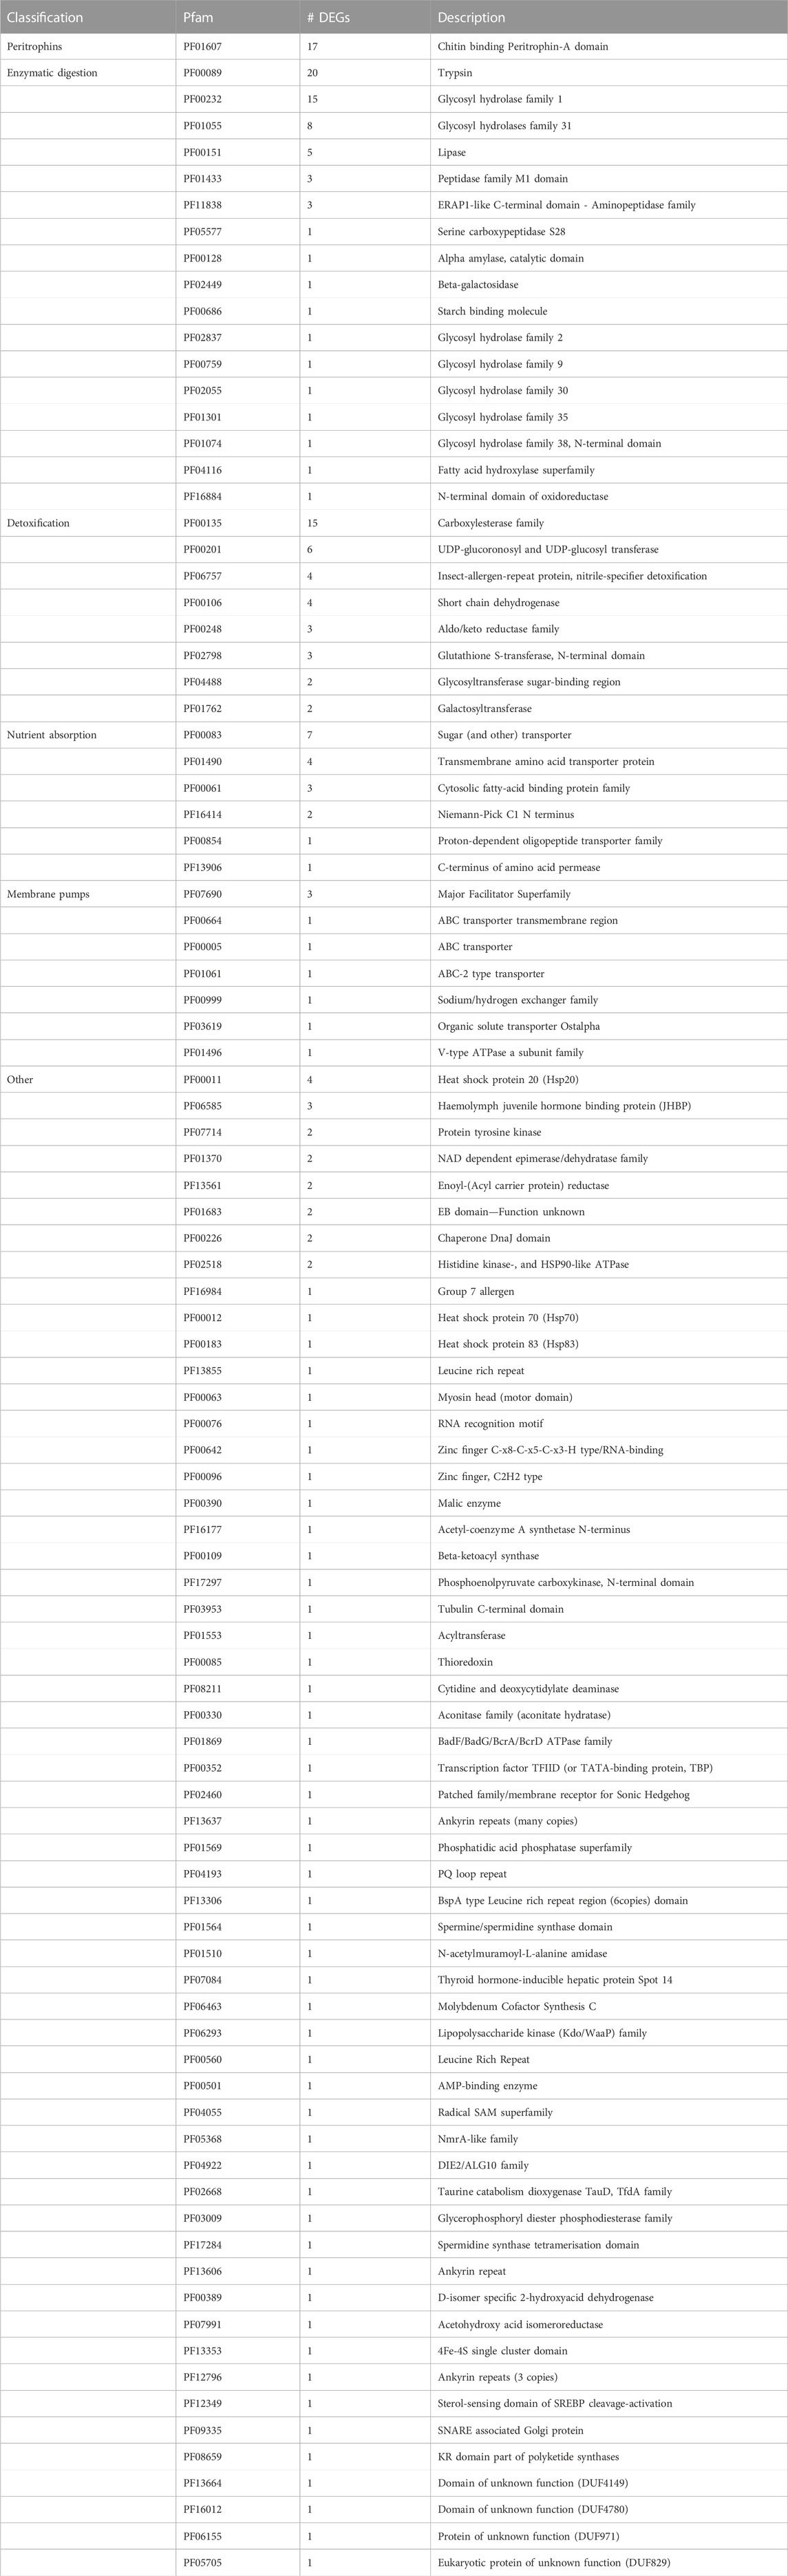
TABLE 2. Summary of Pfam families of upregulated transcripts 2 h after feeding versus 24 h after feeding.
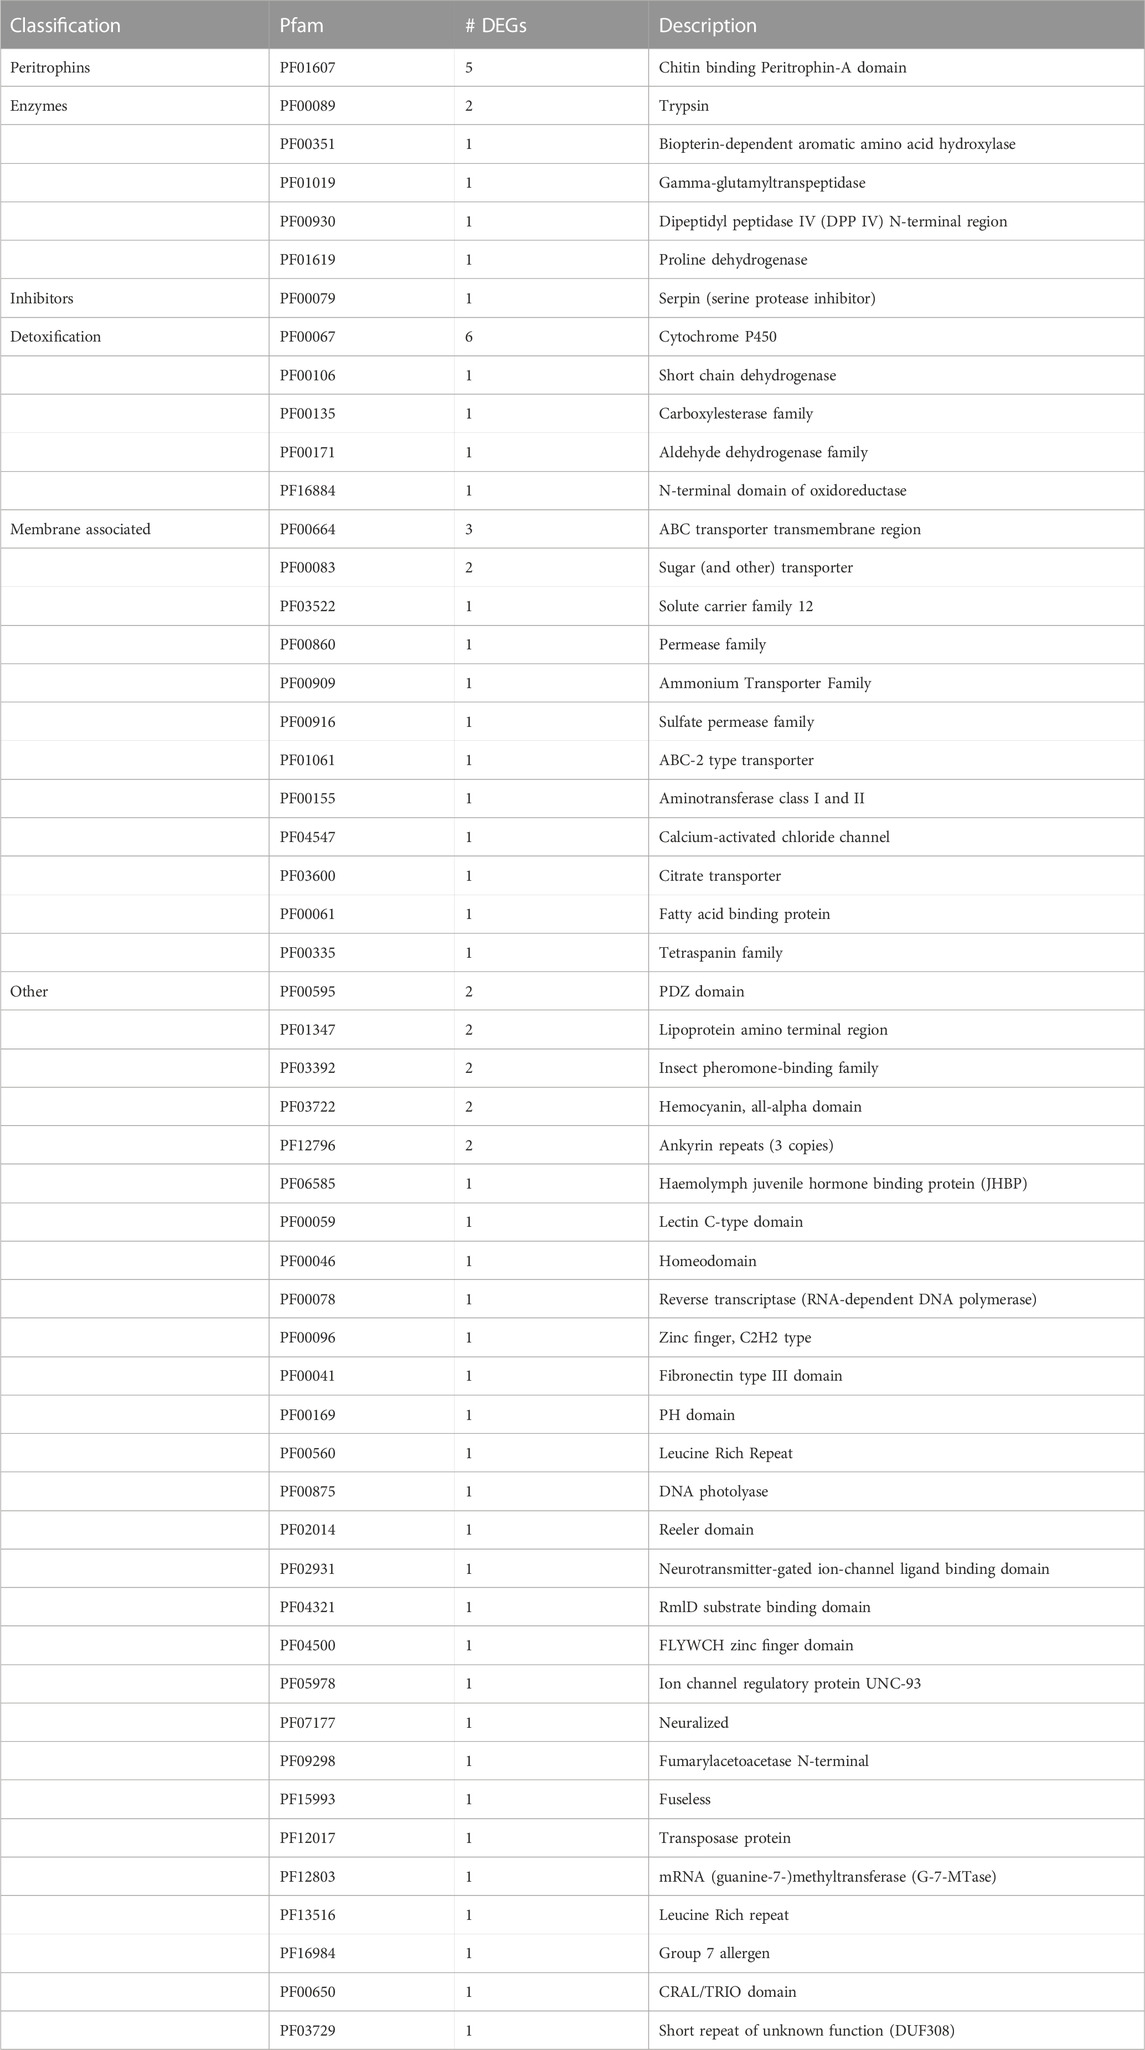
TABLE 3. Summary of Pfam families of downregulated transcripts 2 h after feeding versus 24 h after feeding.
3.4 RNAi-induced gene silencing experiments
Two genes were selected for functional analysis because of their potentially important role in gut physiology and their upregulation 2 h after feeding compared to 24 h (Supplementary Figures S5A, B, one-way ANOVA with Holm-Šídák’s post hoc test, SgVAHa1 RNA-seq: p = 0.00016, SgNPC1b RNA-seq: p = 0.00030). The first transcript ‘TR39983|c0_g2’ encodes a H+ V-ATPase 116 kDa subunit and is referred to as H+ V-ATPase subunit-a isoform 1 (SgVAHa1). The second transcript ‘TR102686|c0_g1’ encodes a Niemann-pick C1 b (NPC1b) protein and is referred to as SgNPC1b. In addition to SgVAHa1, two other transcripts annotated as H+ V-ATPase subunit-a were present in the S. gregaria midgut transcriptome, namely, ‘TR70116|c0_g1_i2’ and ‘TR91547|c0_g1_i1’ showing overall high sequence similarity to SgVAHa1. However, SgVAHa1 was the only SgVAHa transcript that was significantly upregulated in the midgut 2 h after feeding compared to 24 h. Using SgVAHa1 and SgNPC1b sequences as a query, nucleotide sequences encoding full open reading frames were retrieved from the S. gregaria genome (GenBank assembly accession GCA_023897955.2) for both genes (Supplementary Figures S3, S4). For SgVAHa1, the obtained amino acid sequence was identical to a previously annotated S. gregaria H+ V-ATPase 116 kDa subunit (GenBank accession number XP_049832128.1). A multiple sequence alignment, as well as a phylogenetic analysis, was performed for SgVAHa1 (Supplementary Figures S6, S7) and SgNPC1b (Supplementary Figures S8, S9). The amino acid sequence alignments of both genes showed a high sequence similarity to their respective orthologs in other insect species (SgVAHa1: coverage = 97.2–99.6%, identity = 51.2–73.3%; SgNPC1b: coverage = 93.2–95.4%, identity = 30–39.3%). In addition, all of the 14 amino acid residues previously identified to be crucial for H+ V-ATPase subunit assembly and/or function were conserved in the SgVAHa1 sequence (Leng et al., 1998) and SgNPC1b contained the three key motifs that are typical for NPC1 proteins: a patched domain (Pfam annotation PF02460), N-terminal domain (PF16414) and sterol-sensing domain (SSD, PF12349) (Zheng et al., 2018). Additionally, phylogenetic analyses of these genes are generally consistent with insect phylogeny and all species belonging to the same order were clustered together.
The RNA-seq results for SgVAHa1 and SgNPC1b were validated by measuring mRNA levels in the midgut in all three conditions using RT-qPCR, confirming the induced expression of both genes in the midgut samples 2 h after feeding (Supplementary Figures S5C, D, one-way ANOVA with Holm-Šídák’s post hoc test, SgVAHa1: p = 0.0008, SgNPC1b: p = 0.0027). Furthermore, SgVAHa1 transcript levels were already significantly elevated as soon as 10 min after feeding compared to 24 h (one-way ANOVA with Holm-Šídák’s post hoc test, p = 0.0057). Finally, the FCs 2 h after feeding compared to 24 h after feeding observed in this RT-qPCR analysis did not differ drastically from those observed in the RNA-Seq analysis (SgVAHA1: 1.067 vs. 1.225, SgNPC1b: 1.624 vs. 1.713 respectively).
3.4.1 RNAi of SgVAHa1
SgVAHa1 is predominantly expressed in the gastric caeca and in the midgut and only low transcript levels were detected in other parts of the digestive tract, namely, foregut, Malpighian tubules, and hindgut (Figure 4A). Transcript levels of SgVAHa1 were significantly higher in caeca and midgut compared to all other tissues (n = 4; one-way ANOVA with Holm-Šídák’s post hoc test; midgut and caeca compared to all other tissues: p < 0.0001; hindgut, foregut and Malpighian tubules compared to all other tissues: p < 0.005). Upon injection of dsVAHa1, the midgut transcript levels of SgVAHa1 on N5D6 were significantly reduced by 88.5% compared to animals injected with dsGFP (Figure 4B; dsGFP: n = 5, dsVAHa1: n = 5; unpaired Student’s t-test, p = 0.0003).
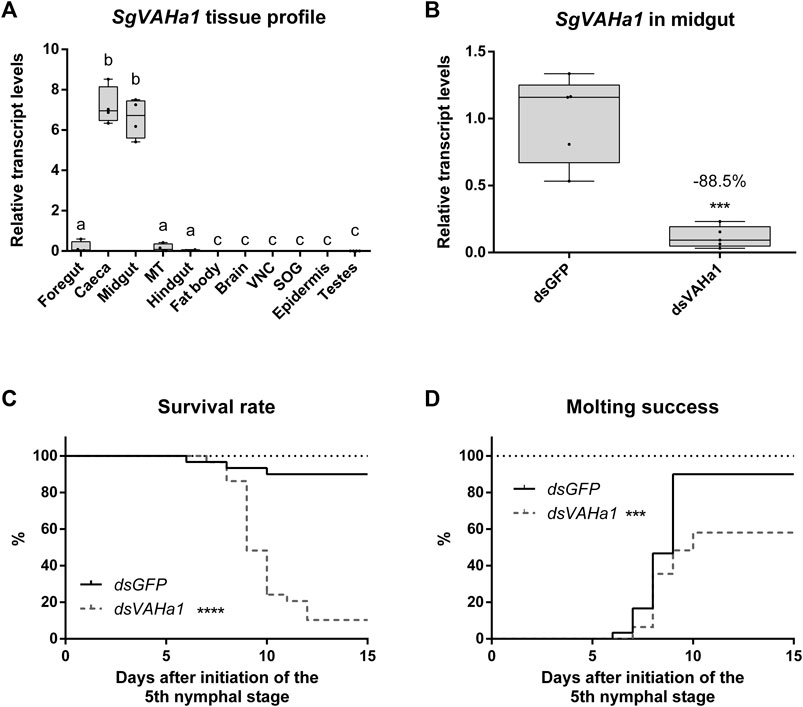
FIGURE 4. RNAi-induced knockdown of SgVAHa1. Animals injected with a dsRNA construct targeting SgVAHa1 (dsVAHa1) were compared to control animals injected with dsGFP. SgVAHa1 transcript levels (A,B) are represented by boxplots containing the upper and lower quartile, while the whiskers indicate the minimum and maximum. The median is indicated by the gray line within each box. Relative transcript levels were normalized using SgGAPDH and SgRP49 as reference genes. Statistical significance (p ≤ 0.05) is either indicated by (a combination of) distinct characters [(A), a, b, and c) or an asterisk (panel B–D, ***: p ≤ 0.001, ****: p ≤ 0.0001]. (A) Relative transcript levels of SgVAHa1 were measured in a range of tissues (MT: Malpighian tubules, VNC: ventral nerve cord, SOG: suboesophageal ganglion) using RT-qPCR (n = 4) (one-way ANOVA with Holm-Šídák’s post hoc test; midgut and caeca compared to all other tissues: p < 0.0001; hindgut, foregut and MT compared to all other tissues: p < 0.005). (B) Relative mRNA levels of SgVAHa1 in the midgut of dsGFP and dsVAHa1 injected animals measured by RT-qPCR (dsGFP: n = 5, dsVAHa1, n = 5). Transcript levels of SgVAHa1 were significantly reduced by 88.5% upon dsVAHa1 injection (unpaired Student’s t-test, p = 0.0003). (C) Survival rate is expressed as the percentage of live animals. Animals injected with dsVAHa1 (dashed gray line) had a significantly lower survival rate compared to control animals (full black line) (dsGFP: n = 30, dsVAHa1, n = 31, logrank Mantel-Cox test, p < 0.0001). (D) Molting success is expressed as the percentage of animals that successfully molted to the adult stage. Animals injected with dsVAHa1 (dashed gray line) had significantly lower molting success compared to control animals (full black line) (dsGFP: n = 30, dsVAHa1, n = 31, logrank Mantel-Cox test, p = 0.0003).
An RNAi-induced knockdown of SgVAHa1 (dsGFP: n = 30, dsVAHa1: n = 31) significantly affected survival throughout the N5 stage (Figure 4C, logrank Mantel-Cox test, p < 0.0001), as well as molting from the nymphal to the adult stage (Figure 4D, logrank Mantel-Cox test, p = 0.0003). The first animals died on N5D6 (dsGFP) and N5D7 (dsVAHa1). The highest mortality occurred in the dsVAHa1 condition on N5D9 (37.93%) and N5D10 (24.14%). On N5D10, only 24.14% of animals were still alive (dsVAHa1) compared to 90% in the control condition (dsGFP). The first animals molted to the adult stage at N5D6 (dsGFP) and N5D7 (dsVAHa1). On N5D9, only 28.85% of animals had molted (dsVAHa1) compared to all of the surviving dsGFP injected animals (90%). At the end of the experiment, a total of eighteen out of thirty-one animals (58.06%) from dsVAHa1 injected animals had reached the adult stage. However, these animals were visibly unhealthy (our observations) and fifteen of these eighteen adults died within the duration of this experiment (15 days after the molt to the N5 stage). By contrast, all of the twenty-seven dsGFP injected animals that successfully molted to the adult stage remained healthy throughout this experiment.
3.4.2 RNAi of SgNPC1b
The majority of SgNPC1b expression was measured in the gastric caeca and the midgut. By contrast, SgNPC1b transcript levels were low in other parts of the digestive tract, namely, foregut, Malpighian tubules, and hindgut (Figure 5A). Transcript levels of SgNPC1b were significantly higher in caeca and midgut compared to all other tissues (n = 4, one-way ANOVA with Holm-Šídák’s post hoc test, midgut vs. foregut: p = 0.0002, all other comparisons: p < 0.0001). Transcript levels of SgNPC1b were measured in the midgut on N5D6, 24 h after a single injection with one of the (non-overlapping) dsRNAs targeting SgNPC1b (dsNPC1b1 or dsNPC1b2) in 24 h starved animals, and were significantly reduced by 69.5% (dsNPC1b1) and 53.1% (dsNPC1b2) compared to dsGFP injected animals (Figure 5B; dsGFP: n = 9, dsNPC1b1: n = 9, dsNPC1b2: n = 9; one-way ANOVA with Holm-Šídák’s post hoc test, dsNPC1b1: p = 0.0004, dsNPC1b2: p = 0.0303).
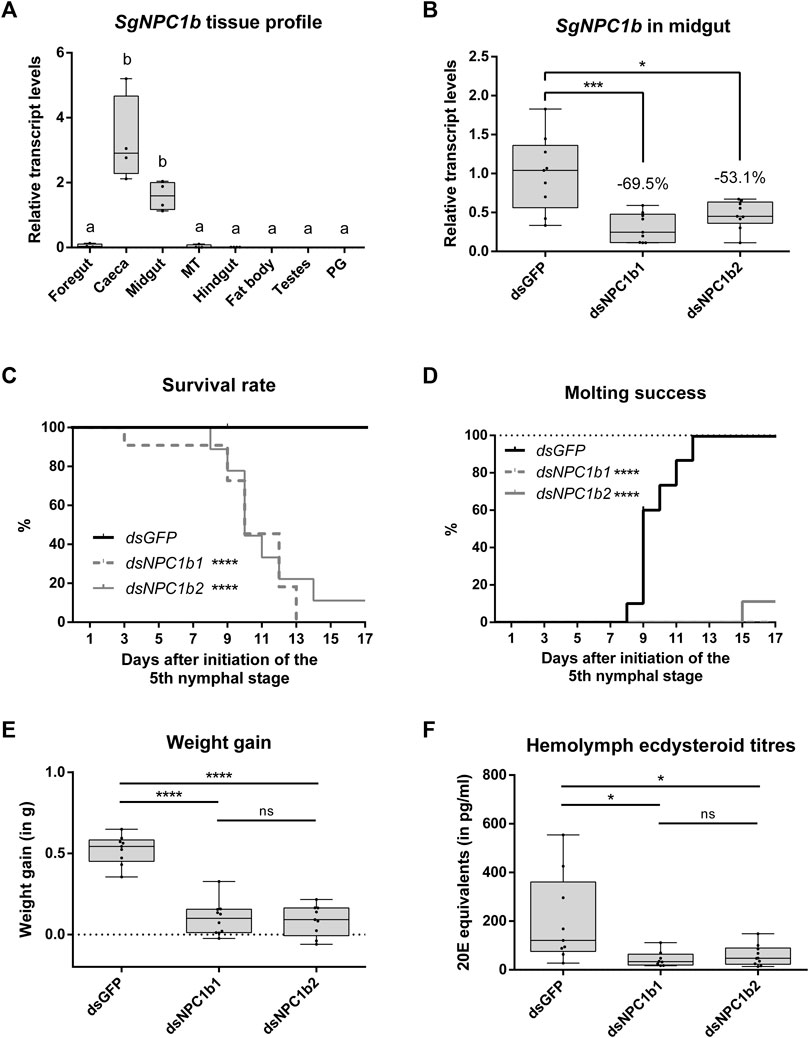
FIGURE 5. RNAi-induced knockdown of SgNPC1b. Animals injected with dsRNA targeting SgNPC1b (dsNPC1b1 or dsNPC1b2) were compared to control animals injected with dsGFP (dsGFP: n = 10, dsNPC1b1: n = 11, dsNPC1b2: n = 9). Transcript levels of SgNPC1b (A,B), weight gain (E) and hemolymph ecdysteroid titers (F) are represented by boxplots containing the upper and lower quartile, while the whiskers indicate the minimum and maximum. The median is indicated by the gray line within each box. Statistical significance (p ≤ 0.05) is either indicated by (a combination of) distinct characters [(A), a and b] or an asterisk [(B–E), *: p ≤ 0.05, ***: p ≤ 0.001, ****: p ≤ 0.0001]. Animals that died or escaped during the experiment were censored from the analysis and are indicated with ticks on the line graph (C,D). (A) Relative transcript levels of SgNPC1b were measured in a range of tissues (MT: Malpighian tubules, PG: prothoracic gland) by RT-qPCR (n = 4). Relative transcript levels were normalized using SgGAPDH and SgRP49 as reference genes. Relative transcript levels of SgNPC1b were significantly higher in caeca and midgut compared to other tissues (one-way ANOVA with Holm-Šídák’s post hoc test, midgut vs. foregut: p = 0.0003, all other pairwise comparisons: p < 0.0001). (B) Relative transcript levels of SgNPC1b in the midgut of dsGFP and dsNPC1b injected animals measured by RT-qPCR (dsGFP: n = 9, dsNPC1b1: n = 9, dsNPC1b2: n = 9). Transcript levels of SgNPC1b were significantly reduced by 69.5% and 53.1% upon dsNPC1b1 and dsNPC1b2 injection, respectively (one-way ANOVA with Holm-Šídák’s post hoc test, dsNPC1b1: p = 0.0004, dsNPC1b2: p = 0.0303). (C) Survival rate is expressed as the percentage of live animals. Animals injected with dsNPC1b1 (dashed gray line) or dsNPC1b2 (full gray line) had a significantly lower survival rate compared to control animals (full black line) (Logrank Mantel-Cox test, dsNPC1b1: p < 0.0001, dsNPC1b2: p < 0.0001). (D) Molting success is expressed as the percentage of animals that successfully molted to the adult stage. Animals injected with dsNPC1b1 (dashed gray line) or dsNPC1b2 (full gray line) had significantly lower molting success compared to control animals (full black line) (logrank Mantel-Cox test, dsNPC1b1: p < 0.0001, dsNPC1b2: p < 0.0001). (E) Weight gain (in g) is calculated as the difference in weight between day 0 of the N5 stage (N5D0) and N5D6. Weight gain was significantly lower upon injection of dsNPC1b (one-way ANOVA with Holm-Šídák’s post hoc test, dsNPC1b1: p < 0.0001, dsNPC1b2: p < 0.0001). (F) hemolymph ecdysteroid titers (expressed as 20E equivalents in pg/mL) as determined by EIA. Ecdysteroid titers were significantly lower in dsNPC1b injected animals compared to control (dsGFP) animals (one-way ANOVA with Holm-Šídák’s post hoc test, dsNPC1b1: p = 0.0164, dsNPC1b2: p = 0.0212).
An RNAi-induced knockdown of SgNPC1b (dsGFP: n = 10, dsNPC1b1: n = 11, dsNPC1b2: n = 9) significantly affected survival throughout the N5 stage (Figure 5C, logrank Mantel-Cox test, dsNPC1b1: p < 0.0001, dsNPC1b2: p = 0.0003), as well as molting from the nymphal to the adult stage (Figure 5D, logrank Mantel-Cox test, dsNPC1b1: p < 0.0001, dsNPC1b2: p = 0.0001). The first animals died at N5D3 (dsNPC1b1) and N5D8 (dsNPC1b2). All but one dsNPC1b injected animal died during the N5 stage. The only surviving knockdown animal, injected with dsNPC1b2, molted to the adult stage at N5D15. By contrast, no control animals (dsGFP) died during the experiment. All control animals molted to the adult stage between N5D8 and N5D12. The total body weight was monitored from N5D0 onwards (Figure 5E). Weight gain was determined as the difference in total body weight between N5D0 and N5D6. Control animals gained significantly more weight, approximately doubling in weight, compared to both knockdown conditions (one-way ANOVA with Holm-Šídák’s post hoc test, dsNPC1b1: p < 0.0001, dsNPC1b2: p < 0.0001). Finally, ecdysteroid levels were measured in the hemolymph at N5D6 and expressed as 20E equivalents (Figure 5F, dsGFP: n = 9, dsNPC1b1: n = 8, dsNPC1b2: n = 10). Upon knockdown of SgNPC1b, ecdysteroids levels in the hemolymph were significantly reduced (one-way ANOVA with Holm-Šídák’s post hoc test, dsNPC1b1: p = 0.0184, dsNPC1b2: p = 0.0184). No significant differences in survival rate, molting success, weight gain or hemolymph ecdysteroid levels were observed between the treatments with non-overlapping dsNPC1b constructs.
4 Discussion
4.1 The S. gregaria midgut transcriptome
In this study, we sequenced transcripts expressed in the midgut at three post-feeding timepoints. At least one functional annotation was retrieved for 56.5% of the total 19,345 transcripts. Consequently, 43.5% of transcripts did not retrieve any functional annotation, which is reflected by “Function unknown” being the largest represented COG group (20.5%, Figure 2). However, the functions attributed to (most of) these transcripts are predicted by bioinformatic analysis and are not conclusively proven. Annotation of the transcripts was primarily based on BLASTs, searching for regions of similarity between sequences of various species. Sequence identification was therefore strongly based on the assumed conservation of functions. Many transcripts in the S. gregaria midgut are possibly too divergent from sequences in other species. Alternatively, a subset of these transcripts possibly consists of either orthologues of conserved insect genes, or Schistocerca-specific genes, whose functions have yet to be discovered. Indeed, the abundance of unannotated transcripts is in line with research on other insects (Pauchet et al., 2009; Ma et al., 2012; Gazara et al., 2017; Huang et al., 2017; Dhania et al., 2019; Coutinho-Abreu et al., 2020). Both GO (Figure 1) and COG (Figure 2) functional classifications were consistent with midgut transcriptomic studies in other insect species (Pauchet et al., 2009; Spit et al., 2016b; Huang et al., 2017). Therefore, the limitations of bioinformatic predictions and functional annotations based on large sequencing datasets clearly demonstrate the need for more functional research on these transcripts. Functional characterization and validation of these transcripts will require time and will depend on the scientific progress in insect (i.c. locust) molecular physiology. Nevertheless, we provided a high-quality comprehensive database of transcript sequences obtained from the midgut of the desert locust, highlighting potential areas of interest for future investigations.
4.2 Differential expression analysis
We clearly illustrated the contrasting gene expression in the S. gregaria midgut at 2 h versus 24 h after feeding (Figure 3). A total of 569 and 212 transcripts were significantly up- and downregulated, respectively, in the 2 h condition compared to the 24 h condition. By contrast, no DEGs were detected for the other pairwise comparisons. At 24 h after feeding, only some highly digested remnants remained present inside the midgut lumen, while the foregut was empty. On the other hand, at 2 h after feeding, ingested plant material was observed inside the midgut. At 10 min after feeding, food was present in the foregut, while the midgut content was similar in appearance to that of the 24 h condition. We hypothesize that the 24 h condition was possibly the least subjected to variation because the digestive activity is drastically reduced in the absence of food. On the other hand, the presence of food in the alimentary tract (10 min and 2 h conditions) induced various biological processes. It is possible that the sensing of food and/or food entering the foregut may already have resulted in a rapid transcriptional response in the midgut. Therefore, the 10 min condition is likely a transitional timepoint between the 24 h and the 2 h conditions. This is supported by the high variation in transcript profiles between samples at 10 min after feeding, as the samples of the 10 min condition do not cluster based on PC1 and PC2 (Supplementary Figure S2). These findings suggest that the S. gregaria midgut can respond very swiftly at the transcriptional level to the uptake of food.
In accordance with the reference transcriptome, we also observed a high number of unannotated DEGs. Of the annotated transcripts, those putatively involved in enzymatic digestion, peritrophic membrane formation, nutrient digestion and xenobiotic metabolism were strongly upregulated in response to food uptake. This indicates that the organism fully invests in digestion and its associated processes. On the other hand, none of the downregulated transcripts were predicted, based on their Pfam annotation to exhibit extracellular digestive or nutrient absorption activity. Nevertheless, it cannot be excluded that the proteins encoded by these downregulated transcripts play important roles during periods of food deprivation, such as mediating stress tolerance, tissue maintenance/protection, or immune defenses. The following paragraphs will discuss the most important findings related to midgut-associated functions.
4.2.1 Digestive enzymes and nutrient transporters
We identified various transcripts predicted to code for putative proteases, carbohydrases, lipases, and nucleases (Supplementary Table S5). Such broad repertoires of digestive enzymes are frequently observed in insects (Campbell et al., 2005; Pauchet et al., 2009; Ma et al., 2012; Spit et al., 2016a; Zhang et al., 2016). Nevertheless, important species-specific differences in digestive enzyme repertoires are observed amongst insects, partially due to different dietary preferences and midgut luminal pH (Holtof et al., 2019). The fact that the majority of putative proteolytic enzyme encoding transcripts identified here code for serine proteases is in line with previous research (Campbell et al., 2005; Spit et al., 2012; Bonelli et al., 2020; Coutinho-Abreu et al., 2020). The proteolytic activity in the midgut of S. gregaria has indeed been mainly attributed to serine proteases, such as trypsins and chymotrypsins, but was also revealed to contain minor cysteine and carboxypeptidase activity (Spit et al., 2012). This high serine protease activity has also been found in other orthopterans (Spit et al., 2014; Huang et al., 2017). However, this is not the case for the more acidic midgut of Coleoptera, and Hemiptera, where the most abundant proteolytic activity is due to cysteine peptidases (Pauchet et al., 2009; Valencia et al., 2016; Oppert et al., 2018; Holtof et al., 2019; Pimentel et al., 2020).
Interestingly, three putative cellulases were identified in the locust midgut transcriptome. This is in accordance with the more recent findings that an endogenous cellulase activity is present in some insect species, such as many cockroaches and termites (Blattaria), the cricket Teleogryllus emma, the beetle Tribolium castaneum and the fly Musca domestica, amongst others (Watanabe and Tokuda, 2010; Holtof et al., 2019). However, genome encoded cellulase enzymes appear to be absent in Anopheles gambiae, Drosophila melanogaster and B. mori (Watanabe and Tokuda, 2010). In conclusion, our data align with the general observation that insects deploy divergent sets of enzymes to mediate the enzymatic digestion of food.
In addition to putative digestive enzymes, we observed the presence and upregulation upon feeding of putative transporters for all of the most abundant nutrient classes, namely, amino acids, carbohydrates, and lipids (Table 2; Supplementary Table S6). We identified several transcripts encoding proteins putatively involved in dietary lipid and sterol uptake. Fatty acid transport proteins, as well as scavenger receptors class B type I, have been suggested to interact in the active transport of dietary fatty acids across the midgut membrane, which is supported by their high abundance in the midgut transcriptome (Holtof et al., 2019). Additionally, various putative sterol transporters were identified, namely, sterol carrier protein x (SCPx), SCP2, and NPC1 proteins.
4.2.2 Xenobiotic metabolism and detoxification processes
Insects often encounter various toxic or xenobiotic compounds that can be harmful if they are not properly dealt with. Herbivorous polyphagous species, like S. gregaria, have to typically rely on a wide range of detoxification mechanisms. This is especially true for insects feeding on complex diets with a high diversity of allelochemicals, such as green leaves, in contrast to diets less diverse in allelochemicals, such as plant sap, nectar and pollen (Rane et al., 2019). Our transcriptome data indeed predicted the presence of various counter-defensive mechanisms in the S. gregaria midgut. This is based on the abundant presence of transcripts predicted to encode NPSs, UGTs, GSTs, CEs, P450s as well as ABC transporters (Supplementary Table S7), all of which have been shown previously to play important roles in xenobiotic metabolism and detoxification in a wide range of species (Rane et al., 2019; Denecke et al., 2021). Furthermore, multiple transcripts for each of these protein classes, with the exception of P450, were upregulated upon feeding (Table 2). Such differential gene expression patterns upon exposure to xenobiotics have been observed in several other species of insects (Herde and Howe, 2014; Spit et al., 2016b; Dhania et al., 2019; Shu et al., 2021; Jin et al., 2022). Our findings suggest that S. gregaria actively detoxifies its ingested food in the midgut by swiftly increasing the transcript levels of several detoxification systems. Additionally, we hypothesize that the broad repertoire of putative detoxification mechanisms encountered here is a consequence of the polyphagous herbivorous lifestyle of this locust species, implying that it can cope with a large diversity of plant toxins in its diet.
One of the plant toxins most often encountered by the locusts in our colony is glucosinolate from cabbage (Barba et al., 2016). We showed the upregulation of several putative NSPs, UGTs and GSTs, which have all been shown to be specifically involved in defense against glucosinolate-derived toxins (Burow et al., 2006; Li et al., 2018), suggesting that these proteins may also have a detoxifying function in the S. gregaria midgut. High levels of NSPs have been identified in the midguts of Lepidoptera as well as the locust L. migratoria (Fischer et al., 2008; Spit et al., 2016a). Interestingly NSPs isolated from other insect species, including A. gambiae and Blattella germanica, showed binding capacity to human immunoglobulin E, provoking an allergic reaction in atopic persons (Wang, Lee, and Wu, 1999). Locust NSPs might therefore provoke allergies in a similar manner. Six upregulated transcripts are predicted to belong to the multidrug resistance protein 1 (MRP1) family, including the ABC transporter subfamilies ABCB, ABCC and ABCG, which are described to have important functions in the xenobiotic metabolism of a wide range of insect species (Labbé et al., 2011; Sodani et al., 2012; Dermauw and Van Leeuwen, 2014; Qi et al., 2016; Denecke et al., 2021). Among these MRPs, one was further categorized as a P-glycoprotein 1 (ABCB1), which has previously been shown to be present in the brain barrier of S. gregaria (Andersson et al., 2014). P-glycoprotein 1, and other MRPs, such as MRP49 (ABCB1) and MRP1 (ABCC1), have been shown to play a role in pesticide resistance (Tian et al., 2013; Denecke et al., 2021). In summary, we showed the presence of various transcripts encoding proteins putatively involved in xenobiotic metabolism, as well as their upregulation upon feeding. Our findings therefore illustrate that polyphagous herbivorous insects are able to rely on various defense mechanisms against a large array of toxins. Interestingly, insects have been shown to rely on similar mechanisms for their protection against natural plant toxins and synthetic pesticides (Hawkins et al., 2019). How they succeed in doing so is still an important subject of study. Identifying and characterizing the underlying patterns orchestrating metabolic resistance against pesticides will be crucial in combatting insect pesticide resistance going forward.
In summary, based on our differential gene expression analysis in S. gregaria as well as those described in literature, it is apparent that gene expression in the insect midgut can respond rapidly to environmental changes, such as the presence of food, infection or exposure to xenobiotics. Based on our data, as well as reports in literature, multiple transcripts encoding putative digestive enzymes, nutrient transporters and other digestion-related genes are abundantly upregulated upon feeding (Sanders et al., 2003; Xu et al., 2012; Cui and Franz, 2020). By contrast, immunity-related genes and detoxification enzymes are strongly upregulated upon infection or exposure to xenobiotics, respectively, while digestion-related genes are downregulated, although these reactions are often complex (Noland et al., 2013; Herde and Howe, 2014; Dhania et al., 2019; Coutinho-Abreu et al., 2020; Kuang et al., 2021; Shu et al., 2021; Jin et al., 2022).
4.3 RNAi of SgVAHa1
4.3.1 Structure and function of H+ V-ATPases
Based on our multiple sequence alignment (Supplementary Figure S6) and phylogenetic analysis (Supplementary Figure S7), we can conclude that SgVAHa1 is a true ortholog of insect H+ V-ATPase subunit-a. We observed a significant upregulation of a H+ V-ATPase subunit-a 2 h after feeding, indicating that this subunit is under transcriptional regulation. The H+ V-ATPases are highly conserved transmembrane proton pumps which in insects occur mostly in various epithelial tissues, such as the salivary glands, the gut, Malpighian tubules, and the nervous system (Toei et al., 2010). These protein complexes use the energy released from hydrolyzing ATP to translocate protons across the apical membrane towards the extracellular fluid or across lysosomal or endosomal membranes towards the lumen of these intracellular compartments. This proton transport generates an electrochemical gradient enabling numerous biological processes, such as regulation of the internal pH of intracellular compartments, lysosomal degradation, loading of cargo into secretory vesicles, and maintaining the polarity of midgut epithelial cells (Banerjee and Kane, 2020). Furthermore, it is well established that in insects this proton motive force drives cation/H+ exchangers (i.e., K+/H+ and Na+/H+ antiporters) and therefore the transepithelial secretion of ions, which in turn stimulates Na+ or K+ coupled nutrient uptake (e.g., Na+ coupled glucose transporters) (Torrie et al., 2004; Wieczorek et al., 2009; Halberg and Møbjerg, 2012). However, the interaction between the electrochemical gradient generated by H+ V-ATPase and the secondary transport of inorganic ions by Na+/K+-ATPase at the basal membrane of epithelial cells is still unclear (Halberg and Møbjerg, 2012). The H+ V-ATPase protein complex consists of various subunits, further subdivided into a peripheral V1 domain consisting of eight different subunits (A-H) and an integral, membrane-bound, V0 domain consisting of six different subunits (a-e) (Toei et al., 2010). The V1 region contains the catalytic site converting ATP into energy, which is used for proton transport, in which subunit-a plays a crucial role. In addition, subunit-a was shown to be important for coupling specific V1 and V0 domains to different cellular sites (Kawasaki-Nishi et al., 2001; Sun-Wada and Wada, 2022) through interaction with specific phospholipids (Banerjee and Kane, 2020). Furthermore, the N-terminal domain of subunit-a has been described as a regulatory hub, incorporating environmental input, such as the glycolytic enzyme aldolase, and thereby regulating both assembly/disassembly and localization of the H+ V-ATPase complex to specific cellular membranes (Banerjee and Kane, 2020).
4.3.2 SgVAHa1 transcript profile
The SgVAHa1 tissue profile highlights large differences in relative transcript levels (Figure 4A) and suggests a specialized function of SgVAHa1 in the midgut and associated caeca. In addition to SgVAHa1, two other unique H+ V-ATPase subunit-a isoform sequences were also identified in our study. However, their tissue-dependent expression profiles were not evaluated since they were not differentially enriched upon feeding. It is currently unclear whether these isoforms perform different (tissue-specific) functions compared to SgVAHa1. More research is therefore needed to functionally characterize the different S. gregaria H+ V-ATPase subunit-a isoforms.
Differential distribution is typical for H+ V-ATPase subunits isoforms, including subunit-a (Kawasaki-Nishi et al., 2001; Toei et al., 2010; Chintapalli et al., 2013; Sun-Wada and Wada, 2022). All four isoforms of subunit-a in mice show different localization in embryos (Wada and Wada, 2022). In yeast two subunit-a isoforms occur, Stv1p which is localized to the vacuole and Vph1p which is localized to the Golgi apparatus (Kawasaki-Nishi et al., 2001). In insects, such tissue-specific expression of H+ V-ATPase subunit-a isoforms has been analyzed in D. Melanogaster, T. castaneum, and L. migratoria (Chintapalli et al., 2013; Mo et al., 2020; Liu et al., 2022; Naseem et al., 2023). In D. melanogaster, a midgut-specific H+ V-ATPase subunit-a isoform, called vha100-4, was identified. Other D. melanogaster H+ V-ATPase subunit-a isoforms are more uniformly expressed across tissues, with the exception of vha100-3 which is almost exclusively expressed in the testes (Chintapalli et al., 2013). Moreover, differential expression of subunit-a isoforms within the midgut has been observed in D. melanogaster (Overend et al., 2016). The midgut-specific vha100-4 is expressed exclusively in the acidic region of the midgut, while other isoforms are expressed over the entire length of the midgut (Overend et al., 2016). Multiple D. melanogaster subunit-a isoforms were shown to perform different functions in wing development within the same tissue (Mo et al., 2020). Similarly to what is observed in D. melanogaster, a H+ V-ATPase subunit-a isoform from T. castaneum shows differential expression across different epithelia with the highest expression being measured in the posterior midgut, while three out of five isoforms are not expressed in the midgut (Naseem et al., 2023). Two isoforms were identified in L. migratoria, showing distinct tissue-dependent and developmental expression profiles, although they were not highly expressed in the midgut or the gastric caeca (Liu et al., 2022). One isoform is most highly expressed in the hindgut and to a lesser extent in the fat body and trachea, while the second isoform is most highly expressed in the fat body. Tissue-specific expression patterns of different subunit isoforms was suggested to be most likely linked to local, tissue-specific V-ATPase functions (Sun-Wada and Wada, 2022). In many cases however, distinct H+ V-ATPase subunit isoforms have not been fully functionally characterized, especially in insect species. Furthermore, it is still unclear whether different subunit isoforms perform different functions within the same tissue, as so far this has only been described in the wing of D. melanogaster (Mo et al., 2020). Therefore, it would be of great interest to study the tissue-dependent expression profiles of three SgVAHa isoforms identified in the midgut in this study as well as possible other isoforms and their subsequent functional characterization. This would add an interesting perspective from a hemimetabolan insect species to the current knowledge available from the holometabolan model organisms, D. melanogaster and T. castaneum (Chintapalli et al., 2013; Naseem et al., 2023).
4.3.3 SgVAHa1 knockdown causes severe mortality and molting defects
RNAi-induced gene silencing of SgVAHa1 resulted in high mortality rates and impaired molting (Figure 4), illustrating the crucial importance of SgVAHa1 in the midgut. The majority of the experimental animals died shortly after molting to the adult stage, while some died during the molting process. However, based on our results, it is currently unclear what exactly is causing lethality. We propose two hypotheses, which may not be mutually exclusive. First, lethality might have resulted from a defective uptake of essential nutrients due to the silencing of the H+ V-ATPase complex, since its formation and the subsequently induced favorable membrane potential, may have been inhibited upon silencing SgVAHa1. Secondly, SgVAHa1 is important for the integrity and function of the midgut epithelium, including the polarity of the epithelial cells and optimal functioning of various cell organelles. The first hypothesis is supported by the upregulation of SgVAHa1 as soon as 10 min after feeding (Supplementary Figure S5C) in conjunction to the upregulation of various transporters for carbohydrates, amino acids, and lipids 2 h after feeding (Table 2). The swift upregulation of a H+ V-ATPase V0 domain subunit in the midgut in response to feeding has only been previously described in the mosquito A. aegypti, namely, the upregulation of subunits a and c (as well as various subunits of the V1 domain) 12 h after a bloodmeal (Sanders et al., 2003). In addition, to our knowledge only one other study in insects reported the upregulation of subunits of the V1 domain in response to feeding, namely, the upregulation of subunit C after a bloodmeal in the mosquito Lutzomyia longipalpis (Pitaluga et al., 2009). Furthermore, starvation in Manduca sexta caused disassembly of the H+ V-ATPase complex, possibly to reduce energy expenditure (Sumner et al., 1995). It would therefore be valuable to study the nutrient uptake at the midgut epithelium or nutrient levels in the hemolymph upon silencing SgVAHa1. In the locust, L. migratoria, a combined knockdown of two H+ V-ATPase subunit-a isoforms was obtained by injecting dsRNA directed against a sequence common to both isoforms. This treatment resulted in mortality and molting defects, similarly to what we observed here (Liu et al., 2022). Targeting these isoforms led to a decrease in food intake and body weight. Interestingly, researchers found no food in the midgut lumen of treated animals, fewer columnar epithelial cells and the absence of the brush border in some regions of the midgut epithelium (Liu et al., 2022). Similarly, knockdown of H+ V-ATPase subunit-a genes (vha100) or a subunit-B gene (vha55) in D. melanogaster led to increased pH in the acidic region of the midgut (Overend et al., 2016; Koyama et al., 2021), and vha55 knockdown resulted in impaired nutrient absorption and mortality (Koyama et al., 2021). It is remarkable that subunit-a is the only H+ V-ATPase subunit that was significantly upregulated in the S. gregaria midgut 2 h post-feeding. It is possible that subunit-a is under strict transcriptional control because of its critical role in H+ V-ATPase assembly as well as in targeting specific V1 domains to specific membranes.
A number of studies have evaluated the insecticidal potential of targeting H+ V-ATPase subunits in several insect species, including a variety of insect pests, showing strong negative impacts on growth and survival (Ahmed, 2016; Sato et al., 2019; Rahmani and Bandani, 2021; Guo et al., 2022; Liu et al., 2022; Shi et al., 2022; Zeng et al., 2022). So far, the majority of these studies focused on targeting the different subunits of the V1 domain of these proton pumps. To the best of our knowledge, only two studies describing the targeting of subunit-a of the H+ V-ATPase V0 domain in insects exist (Ahmed, 2016; Liu et al., 2022). In both L. migratoria and the lepidopteran Pectinophora gossypiella a H+ V-ATPase subunit-a knockdown resulted in strong negative impacts on insect growth and survival, clearly illustrating the strong insecticidal potential of targeting insect H+ V-ATPases, including SgVAHa1.
4.4 RNAi of SgNPC1b
4.4.1 Niemann-pick proteins
Both NPC1 and NPC2 proteins were identified in the S. gregaria midgut. Based on our multiple sequence alignment (Supplementary Figure S8) and phylogenetic analysis (Supplementary Figure S9), we conclude that SgNPC1b is a true ortholog of insect NPC1b. We observed a significant upregulation of SgNPC1b 2 h after feeding. Niemann-pick proteins are a family of transmembrane sterol-binding proteins known to play an important role in sterol absorption in the digestive tract of both mammals and insects (Davies et al., 2005; Voght et al., 2007; Zheng et al., 2018; Jing and Behmer, 2020). Even though the sterol uptake pathways in mammals and insects are similar, the exact role of Niemann-pick proteins in insects has so far only been studied in D. melanogaster and Helicoverpa armigera. Functional research in other insect species is currently lacking. NPC1 proteins typically contain three conserved domains which all show sterol-binding activity: N-terminal domain, patched domain and SSD (Voght et al., 2007; Zheng et al., 2018; Jing and Behmer, 2020). Due to gene duplication, the majority of insects possess two NPC1 homologues, namely, NPC1a and NPC1b (Zheng et al., 2018). NPC1b was shown to be crucial for dietary sterol absorption in the midgut of D. melanogaster and H. armigera (Voght et al., 2007; Zheng et al., 2020). After absorption, sterols are taken up in the lysosomes and are transferred by NPC2 to NPC1a which is integrated in the lysosomal membrane (Jing and Behmer, 2020). In insect herbivores, such as S. gregaria, plant sterols are dealkylated to form cholesterol, likely in the smooth endoplasmic reticulum of the midgut epithelium (Li and Jing, 2020).
4.4.2 SgNPC1b transcript profile
SgNPC1b shows a midgut and associated caeca specific expression (Figure 5A), similar to SgVAHa1, implying a specialized function of SgNPC1b in the midgut, which is consistent with findings in the holometabolan species, D. melanogaster, H. armigera, T. castaneum and Tenebrio molitor (Voght et al., 2007; Oppert et al., 2018; Zheng et al., 2020). In line with these reports, we found two NPC1-like sequences in T. castaneum in the BeetleAtlas9 database (Naseem et al., 2023), one putative NPC1a sequence (TC005088) with uniform distribution and one putative NPC1b sequence (TC033918) with midgut-specific expression. Furthermore, NPC1b expression in the digestive system is probably not restricted to insects, since NPC1L1, the NPC1b ortholog in mammals, is highly expressed in the human liver and to a lesser extent the small intestine (Davies et al., 2005).
4.4.3 SgNPC1b knockdown impairs growth and causes severe mortality and molting defects
Injection of dsNPC1b caused impaired weight gain, lowered hemolymph ecdysteroid titers, impaired molting, and high mortality (Figure 5). As NPC1b has been shown to be a midgut sterol transporter (Voght et al., 2007; Zheng et al., 2020), the phenotypes we observed here are expected to be the consequence of impaired sterol uptake. Arthropods do not synthesize sterols de novo, and thus rely entirely on intake of dietary sterols (Behmer, 2017; Li and Jing, 2020). Therefore, we propose three plausible, not mutually exclusive, hypotheses explaining the phenotypes we observed: 1. Sterols are crucial for normal growth and development since they are an integral component of biological membranes; 2. Sterols play a signaling role, being an important cue for nutritional status and thereby regulating growth and development; 3. Plant sterols are converted to cholesterol, which is the main precursor for ecdysteroid biosynthesis and therefore required for ecdysteroid hormone signaling.
Our data revealed several important phenotypes. We measured a significantly lower ecdysteroid titer in the hemolymph of SgNPC1b knockdown versus control locusts on N5D6, a developmental time point at which increased ecdysteroid levels are expected to occur in hemolymph (Verbakel et al., 2021). A possible explanation for this observation is that silencing SgNPC1b causes impaired sterol uptake in the midgut, resulting in a lack of cholesterol as precursor for ecdysteroid biosynthesis. However, this may only partially explain the observations. Locusts may still have sufficient access to cholesterol as a precursor for ecdysteroid biosynthesis based on the following arguments: 1. We knocked down SgNPC1b, meaning that we did not generate a complete knockout and presumably sterol uptake was not completely inhibited; 2. Locusts might still rely on stored steryl esters, which could potentially suffice to maintain ecdysteroid biosynthesis (Korber et al., 2017); 3. Most cholesterol is incorporated into cellular membranes and only a small fraction is needed for ecdysteroid biosynthesis (Jing and Behmer, 2020); 4. Alternative dietary sterol uptake mechanisms might still be in place, such as SCP (Guo et al., 2009). This suggests that it is unlikely that the SgNPC1b knockdown only affected ecdysteroid biosynthesis directly, due to the lack of cholesterol precursor. It is well described in insects that the attainment of a critical weight is an important trigger to stimulate ecdysteroid biosynthesis for metamorphosis or molting (Pan et al., 2021). Therefore, we suggest that the impaired weight gain during the N5 stage may also have inhibited or postponed ecdysteroid biosynthesis indirectly, resulting in the observed lower ecdysteroid titers in hemolymph. Anyway, it seems unlikely that the observed phenotypic effects, namely, reduced weight gain, impaired molting, and high mortality, were solely the consequence of a lower ecdysteroid titer. The effects on weight gain already occurred at the start of the N5 stage, long before the expected rise in ecdysteroid levels (around N5D6). Interestingly, in D. melanogaster NPC1b mutants, administration of exogenous ecdysone did not affect mortality, indicating that reduced ecdysteroid biosynthesis by itself does not explain all phenotypes observed upon impaired sterol uptake (Voght et al., 2007).
Instead, we suggest that the lethal phenotype we observed may be a consequence of impaired membrane integrity and functionality, especially at the midgut epithelium. Lack of sterols in the cellular membrane is known to cause mortality by compromising membrane integrity, affecting the function of membrane-bound enzymes, endocytosis, receptor binding and signal transduction (Behmer and Elias, 1999; Gasque et al., 2005). Nevertheless, in D. melanogaster sterols appeared to be dispensable for maintaining membrane properties such as impermeability during periods of extreme dietary sterol restriction. During such periods these membrane properties were supplied by non-sterol lipids, such as sphingolipids (Carvalho et al., 2010). In contrast to D. melanogaster, acridid grasshoppers (Orthoptera) do not tolerate high proportions of non-cholesterol sterols as structural components in their membranes, while the tolerance in the lepidopterans Heliothis virescens and Helicoverpa zea is somewhere in between (Behmer and Elias, 2000; Jing et al., 2014; Jing and Behmer, 2020). This suggests that acridid grasshoppers (Orthoptera), such as S. gregaria, are more vulnerable to reduced cholesterol levels as they need mostly cholesterol for maintaining membrane integrity.
Interestingly, cholesterol has been shown to perform an important signaling function in D. melanogaster (Texada et al., 2022). Cholesterol serves as a nutritional signal, mediated by the target of rapamycin pathway in the fat body, which stimulates growth and development by increasing insulin-like peptide transcription and release in the insulin-producing cells of the brain. Furthermore, the growth-promoting effect of cholesterol requires insulin signaling and is not the result of effects on ecdysteroid biosynthesis. It is currently unclear whether cholesterol has a growth-promoting effect in S. gregaria as well, and whether this effect is facilitated by the insulin signaling pathway. A SgNPC1b knockdown did not affect transcript levels of insulin-related peptide in the locust brain (Supplementary Figure S10), although this result does not exclude possible effects on actual insulin-related peptide release from the insulin-producing cells of the brain. Further investigation is therefore required to find out whether SgNPC1b depletion might have affected the insulin signaling pathway in S. gregaria.
Our data show that SgNPC1b performs a crucial function in the midgut. Furthermore, if compensatory mechanisms were available, either alternative sterol transporters or the incorporation of alternative sterols or non-sterol lipids in the cellular membranes, then these mechanisms were insufficient to rescue the knockdown of SgNPC1b in a timely fashion. In addition to SgNPC1b, several SCP-x and SCP2 transcripts were identified in the S. gregaria midgut. However, none of these putative sterol transporters were upregulated upon feeding. Functional characterization of these proteins is therefore necessary to determine their possible roles in S. gregaria. Our data suggest that SCPs are either unable to compensate for reduced SgNPC1b function or are not involved in sterol uptake in S. gregaria. Finally, it cannot be excluded that SgNPC1b performs another crucial function, for example, the uptake of a different essential nutrient. This was suggested earlier by Voght et al., although so far no direct support for this hypothesis was published (Voght et al., 2007). Therefore, investigating the substrate specificity of SgNPC1b as well as the exact sterol depletions caused by the knockdown of SgNPC1b may contribute to a better understanding of its role in midgut physiology. In summary, we hypothesize that injection of dsNPC1b reduced dietary sterol uptake in the midgut and may have affected membrane integrity, resulting in reduced weight gain, impaired molting, and death. Additionally, we suggest that a SgNPC1b knockdown affected ecdysteroid biosynthesis, probably more indirectly (through an effect on weight gain and metabolism) than directly (through a lack of cholesterol as ecdysteroid precursor). Overall, our experiments were the first to demonstrate the crucial role and insecticidal target potential of NPC1b in an hemimetabolan (orthopteran) insect species.
5 Conclusion
The midgut transcriptome data presented here provide a useful and promising resource for studying the midgut physiology of S. gregaria, a socio-economically important pest insect. Furthermore, most midgut gene expression analyses available in the literature are exploratory or look at changes upon infection or exposure to xenobiotics in holometabolan orders, such as Diptera, Lepidoptera or Coleoptera. By contrast, studies focusing on the temporal changes in gene expression depending on food uptake and digestion, such as the one presented here, are still underrepresented. The gene enrichment patterns we observed are consistent with the polyphagous herbivorous lifestyle of S. gregaria, which is supported by the identification of a wide array of putative digestive enzymes and detoxification systems. The S. gregaria midgut can react rapidly at the transcriptional level to the presence of food, since a broad range of intestinal genes are upregulated, including genes coding for putative digestive enzymes, nutrient transporters and detoxification enzymes. This study highlighted the significant upregulation of H+ V-ATPase subunit-a and Niemann-Pick 1b protein upon feeding. Their vital role in conjunction with their accessibility from the luminal side of the midgut make them promising insecticidal target candidates.
Data availability statement
The datasets presented in this study can be found in online repositories. The names of the repository/repositories and accession number(s) can be found below: https://www.ncbi.nlm.nih.gov/geo/, GSE226871.
Author contributions
The initial manuscript text was written by MH, JVL, and JVB, which was further edited and approved by all authors. Experiments with locusts were designed by MH, RV, DC, and JVL, performed by MH, JVL, DC, SV, and DP, and supervised by JVB. The transcriptomic experiments were performed and analyzed by LT under the supervision of FVN. All authors contributed to the article and approved the submitted version.
Funding
This work was financially supported by the Research Foundation of Flanders (FWO) [G090919N; G0I2118N (LEAP-Agri project “EntoEconomy”)]. MH was supported by a Ph.D. fellowship granted by the Agency for Innovation by Science and Technology (IWT, project number 141447). JV was supported by a Ph.D. fellowship from the Research Foundation of Flanders (FWO, grant number 1S59217N).
Acknowledgments
The authors would like to thank Evelien Herinckx and Arnold Van Den Eynde for taking care of the locust rearing facility, and Paulien Peeters and Evert Bruyninckx for technical assistance.
Conflict of interest
The authors declare that the research was conducted in the absence of any commercial or financial relationships that could be construed as a potential conflict of interest.
Publisher’s note
All claims expressed in this article are solely those of the authors and do not necessarily represent those of their affiliated organizations, or those of the publisher, the editors and the reviewers. Any product that may be evaluated in this article, or claim that may be made by its manufacturer, is not guaranteed or endorsed by the publisher.
Supplementary material
The Supplementary Material for this article can be found online at: https://www.frontiersin.org/articles/10.3389/fphys.2023.1232545/full#supplementary-material
Footnotes
1http://transdecoder.github.io
2https://www.ebi.ac.uk/interpro/
4https://services.healthtech.dtu.dk/service.php?SignalP
5https://services.healthtech.dtu.dk/service.php?TMHMM-2.0
6https://www.bioinformatics.babraham.ac.uk/projects/fastqc/
8https://primer3plus.com/cgi-bin/dev/primer3plus.cgi
References
Ahmed, M. A. M. (2016). RNAi-based silencing of genes encoding the vacuolar-ATPase subunits a and c in pink bollworm (Pectinophora gossypiella). Afr. J. Biotechnol. 15, 2547–2557. doi:10.5897/ajb2016.15611
Andersson, O., Badisco, L., Hansen, A. H., Hansen, S. H., Hellman, K., Nielsen, P. A., et al. (2014). Characterization of a novel brain barrier ex vivo insect-based P-glycoprotein screening model. Pharmacol. Res. Perspect. 2, e000500. doi:10.1002/prp2.50
Baines, D. M., Bernays, E. A., and Leather, E. M. (1973). Movement of food through the gut of fifth-instar males of Locusta migratoria migratorioides (R. & F). Acrida 2, 319–332.
Banerjee, S., and Kane, P. M. (2020). Regulation of V-ATPase activity and organelle pH by phosphatidylinositol phosphate lipids. Front. Cell. Dev. Biol. 8, 510. doi:10.3389/fcell.2020.00510
Barba, F. J., Nikmaram, N., Roohinejad, S., Khelfa, A., Zhu, Z., and Koubaa, M. (2016). Bioavailability of glucosinolates and their breakdown products: impact of processing. Front. Nutr. 3, 24. doi:10.3389/fnut.2016.00024
Bateman, A., Martin, M. J., O’Donovan, C., Magrane, M., Apweiler, R., Alpi, E., et al. (2015). UniProt: a hub for protein information. Nucleic Acids Res. 43, D204–D212. doi:10.1093/nar/gku989
Behmer, S. T., and Elias, D. O. (2000). Sterol metabolic constraints as a factor contributing to the maintenance of diet mixing in grasshoppers (Orthoptera: acrididae). Physiol. Biochem. Zool. 73, 219–230. doi:10.1086/316728
Behmer, S. T., and Elias, D. O. (1999). The nutritional significance of sterol metabolic constraints in the generalist grasshopper Schistocerca americana. J. Insect Physiol. 45, 339–348. doi:10.1016/S0022-1910(98)00131-0
Behmer, S. T. (2017). Overturning dogma: tolerance of insects to mixed-sterol diets is not universal. Curr. Opin. Insect Sci. 23, 89–95. doi:10.1016/j.cois.2017.08.001
Boeckmann, B., Blatter, M. C., Famiglietti, L., Hinz, U., Lane, L., Roechert, B., et al. (2005). Protein variety and functional diversity: swiss-prot annotation in its biological context. Comptes Rendus - Biol. 328, 882–899. doi:10.1016/j.crvi.2005.06.001
Bonelli, M., Bruno, D., Brilli, M., Gianfranceschi, N., Tian, L., Tettamanti, G., et al. (2020). Black soldier fly larvae adapt to different food substrates through morphological and functional responses of the midgut. Int. J. Mol. Sci. 21, 4955. doi:10.3390/ijms21144955
Boratyn, G. M., Camacho, C., Cooper, P. S., Coulouris, G., Fong, A., Ma, N., et al. (2013). Blast: a more efficient report with usability improvements. Nucleic Acids Res. 41, 29–33. doi:10.1093/nar/gkt282
Bryant, D. M., Johnson, K., Ditommaso, T., Tickle, T., Brian, M., Payzin-dogru, D., et al. (2017). A tissue-mapped axolotl de novo transcriptome enables identification of limb regeneration factors. Cell. Rep. 18, 762–776. doi:10.1016/j.celrep.2016.12.063
Burow, M., Markert, J., Gershenzon, J., and Wittstock, U. (2006). Comparative biochemical characterization of nitrile-forming proteins from plants and insects that alter myrosinase-catalysed hydrolysis of glucosinolates. FEBS J. 273, 2432–2446. doi:10.1111/j.1742-4658.2006.05252.x
Campbell, C. L., Vandyke, K. A., Letchworth, G. J., Drolet, B. S., Hanekamp, T., and Wilson, W. C. (2005). Midgut and salivary gland transcriptomes of the arbovirus vector culicoides sonorensis (Diptera: ceratopogonidae). Insect Mol. Biol. 14, 121–136. doi:10.1111/j.1365-2583.2004.00537.x
Carvalho, M., Schwudke, D., Sampaio, J. L., Palm, W., Riezman, I., Dey, G., et al. (2010). Survival strategies of a sterol auxotroph. Development 137, 3675–3685. doi:10.1242/dev.044560
Chintapalli, V. R., Wang, J., Herzyk, P., Davies, S. A., and Dow, J. A. T. (2013). Data-mining the FlyAtlas online resource to identify core functional motifs across transporting epithelia. BMC Genomics 14, 518. doi:10.1186/1471-2164-14-518
Coutinho-Abreu, I. V., Serafim, T. D., Meneses, C., Kamhawi, S., Oliveira, F., and Valenzuela, J. G. (2020). Leishmania infection induces a limited differential gene expression in the sand fly midgut. BMC Genomics 21, 608–616. doi:10.1186/s12864-020-07025-8
Cui, Y., and Franz, A. W. E. (2020). Heterogeneity of midgut cells and their differential responses to blood meal ingestion by the mosquito, Aedes aegypti. Insect biochem. Mol. Biol. 127, 103496. doi:10.1016/j.ibmb.2020.103496
Cullen, D. A., Cease, A. J., Latchininsky, A. V., Ayali, A., Berry, K., Buhl, J., et al. (2017). From molecules to management: mechanisms and consequences of locust phase polyphenism. Adv. Insect Phys. 53, 167–285. doi:10.1016/bs.aiip.2017.06.002
Davidson, N. M., Hawkins, A. D. K., and Oshlack, A. (2017). SuperTranscripts: a data driven reference for analysis and visualisation of transcriptomes. Genome Biol. 18, 148. doi:10.1186/s13059-017-1284-1
Davies, J. P., Scott, C., Oishi, K., Liapis, A., and Ioannou, Y. A. (2005). Inactivation of NPC1L1 causes multiple lipid transport defects and protects against diet-induced hypercholesterolemia. J. Biol. Chem. 280, 12710–12720. doi:10.1074/jbc.M409110200
Denecke, S., Rankić, I., Driva, O., Kalsi, M., Luong, N. B. H., Buer, B., et al. (2021). Comparative and functional genomics of the ABC transporter superfamily across arthropods. BMC Genomics 22, 553. doi:10.1186/s12864-021-07861-2
Dermauw, W., and Van Leeuwen, T. (2014). The ABC gene family in arthropods: comparative genomics and role ininsecticide transport and resistance. Insect biochem. Mol. Biol. 45, 89–110. doi:10.1016/j.ibmb.2013.11.001
Dhania, N. K., Chauhan, V. K., Chaitanya, R. K., and Dutta-Gupta, A. (2019). Midgut de novo transcriptome analysis and gene expression profiling of Achaea janata larvae exposed with Bacillus thuringiensis (Bt)-based biopesticide formulation. Comp. Biochem. Physiol. - Part D. Genomics Proteomics 30, 81–90. doi:10.1016/j.cbd.2019.02.005
Fischer, H. M., Wheat, C. W., Heckel, D. G., and Vogel, H. (2008). Evolutionary origins of a novel host plant detoxification gene in butterflies. Mol. Biol. Evol. 25, 809–820. doi:10.1093/molbev/msn014
Fu, L., Niu, B., Zhu, Z., Wu, S., and Li, W. (2012). CD-HIT: accelerated for clustering the next-generation sequencing data. Bioinformatics 28, 3150–3152. doi:10.1093/bioinformatics/bts565
Gasque, G., Labarca, P., and Darszon, A. (2005). Cholesterol-depleting compounds modulate K+-currents in Drosophila Kenyon cells. FEBS Lett. 579, 5129–5134. doi:10.1016/j.febslet.2005.08.022
Gazara, R. K., Cardoso, C., Bellieny-Rabelo, D., Ferreira, C., Terra, W. R., and Venancio, T. M. (2017). De novo transcriptome sequencing and comparative analysis of midgut tissues of four non-model insects pertaining to Hemiptera, Coleoptera, Diptera and Lepidoptera. Gene 627, 85–93. doi:10.1016/j.gene.2017.06.008
Guo, X. R., Zheng, S. C., Liu, L., and Feng, Q. L. (2009). The sterol carrier protein 2/3-oxoacyl-CoA thiolase (SCPx) is involved in cholesterol uptake in the midgut of Spodoptera litura: gene cloning, expression, localization and functional analyses. BMC Mol. Biol. 10, 102–118. doi:10.1186/1471-2199-10-102
Guo, Y., Fan, Y., Teng, Z., Wang, L., Tan, X., Wan, F., et al. (2022). Efficacy of RNA interference using nanocarrier-based transdermal dsRNA delivery system in the woolly apple aphid, Eriosoma lanigerum. Arch. Insect Biochem. Physiol. 110, e21888. doi:10.1002/arch.21888
Halberg, K. A., and Møbjerg, N. (2012). First evidence of epithelial transport in tardigrades: a comparative investigation of organic anion transport. J. Exp. Biol. 215, 497–507. doi:10.1242/jeb.065987
Hawkins, N. J., Bass, C., Dixon, A., and Neve, P. (2019). The evolutionary origins of pesticide resistance. Biol. Rev. 94, 135–155. doi:10.1111/brv.12440
Herde, M., and Howe, G. A. (2014). Host plant-specific remodeling of midgut physiology in the generalist insect herbivore Trichoplusia ni. Insect biochem. Mol. Biol. 50, 58–67. doi:10.1016/j.ibmb.2014.03.013
Hixson, B., Bing, X. L., Yang, X., Bonfini, A., Nagy, P., and Buchon, N. (2022). A transcriptomic atlas of Aedes aegypti reveals detailed functional organization of major body parts and gut regional specializations in sugar-fed and blood-fed adult females. Elife 11, e76132. doi:10.7554/eLife.76132
Holtof, M., Lenaerts, C., Cullen, D., and Vanden Broeck, J. (2019). Extracellular nutrient digestion and absorption in the insect gut. Cell. Tissue Res. 377, 397–414. doi:10.1007/s00441-019-03031-9
Huang, X., McNeill, M. R., Ma, J., Qin, X., Tu, X., Cao, G., et al. (2017). Gut transcriptome analysis shows different food utilization efficiency by the grasshopper oedaleous asiaticus (Orthoptera: acrididae). J. Econ. Entomol. 110, 1831–1840. doi:10.1093/jee/tox128
Hung, R. J., Hu, Y., Kirchner, R., Liu, Y., Xu, C., Comjean, A., et al. (2020). A cell atlas of the adult Drosophila midgut. Proc. Natl. Acad. Sci. U. S. A. 117, 1514–1523. doi:10.1073/pnas.1916820117
Jin, M., Shan, Y., Peng, Y., Wang, P., Li, Q., Yu, S., et al. (2022). An integrative analysis of transcriptomics and proteomics reveals novel insights into the response in the midgut of Spodoptera frugiperda larvae to Vip3Aa. Toxins (Basel) 14, 55. doi:10.3390/toxins14010055
Jing, X., and Behmer, S. T. (2020). Insect sterol nutrition: physiological mechanisms, ecology, and applications. Annu. Rev. Entomol. 65, 251–271. doi:10.1146/annurev-ento-011019-025017
Jing, X., Grebenok, R. J., and Behmer, S. T. (2014). Diet micronutrient balance matters: how the ratio of dietary sterols/steroids affects development, growth and reproduction in two lepidopteran insects. J. Insect Physiol. 67, 85–96. doi:10.1016/j.jinsphys.2014.06.004
Kawasaki-Nishi, S., Nishi, T., and Forgac, M. (2001). Yeast V-ATPase complexes containing different isoforms of the 100-kDa a-subunit differ in coupling efficiency and in vivo dissociation. J. Biol. Chem. 276, 17941–17948. doi:10.1074/jbc.M010790200
Kikuta, S., Nakamura, Y., Hattori, M., Sato, R., Kikawada, T., and Noda, H. (2015). Herbivory-induced glucose transporter gene expression in the brown planthopper, Nilaparvata lugens. Insect biochem. Mol. Biol. 64, 60–67. doi:10.1016/j.ibmb.2015.07.015
Korber, M., Klein, I., and Daum, G. (2017). Steryl ester synthesis, storage and hydrolysis: a contribution to sterol homeostasis. Biochim. Biophys. Acta - Mol. Cell. Biol. Lipids 1862, 1534–1545. doi:10.1016/j.bbalip.2017.09.002
Koyama, T., Terhzaz, S., Naseem, M. T., Nagy, S., Rewitz, K., Dow, J. A. T., et al. (2021). A nutrient-responsive hormonal circuit mediates an inter-tissue program regulating metabolic homeostasis in adult Drosophila. Nat. Commun. 12, 5178. doi:10.1038/s41467-021-25445-2
Kuang, W., Yan, C., Zhan, Z., Guan, L., Wang, J., Chen, J., et al. (2021). Transcriptional responses of Daphnis nerii larval midgut to oral infection by Daphnis nerii cypovirus-23. Virol. J. 18, 250. doi:10.1186/s12985-021-01721-x
Labbé, R., Caveney, S., and Donly, C. (2011). Genetic analysis of the xenobiotic resistance-associated ABC gene subfamilies of the Lepidoptera. Insect Mol. Biol. 20, 243–256. doi:10.1111/j.1365-2583.2010.01064.x
Leng, X. H., Manolson, M. F., and Forgac, M. (1998). Function of the COOH-terminal domain of Vph1p in activity and assembly of the yeast V-ATPase. J. Biol. Chem. 273, 6717–6723. doi:10.1074/jbc.273.12.6717
Li, B., and Dewey, C. N. (2011). Rsem: accurate transcript quantification from RNA-Seq data with or without a reference genome. BMC Bioinforma. 12, 323. doi:10.1186/1471-2105-12-323
Li, L., Lan, M., Lu, W., Li, Z., Xia, T., Zhu, J., et al. (2018). De novo transcriptomic analysis of the alimentary tract of the tephritid gall fly, Procecidochares utilis. PLoS One 13, e0201679. doi:10.1371/journal.pone.0201679
Li, S., and Jing, X. (2020). Fates of dietary sterols in the insect alimentary canal. Curr. Opin. Insect Sci. 41, 106–111. doi:10.1016/j.cois.2020.08.001
Li, W., and Godzik, A. (2006). Cd-Hit: a fast program for clustering and comparing large sets of protein or nucleotide sequences. Bioinformatics 22, 1658–1659. doi:10.1093/bioinformatics/btl158
Liu, X. J., Liang, X. Y., Guo, J., Shi, X. K., Merzendorfer, H., Zhu, K. Y., et al. (2022). V-ATPase subunit a is required for survival and midgut development of Locusta migratoria. Insect Mol. Biol. 31, 60–72. doi:10.1111/imb.12738
Livak, K. J., and Schmittgen, T. D. (2001). Analysis of relative gene expression data using real-time quantitative PCR and the 2(-Delta Delta C(T)) Method. Methods 25, 402–408. doi:10.1006/meth.2001.1262
Love, M. I., Huber, W., and Anders, S. (2014). Moderated estimation of fold change and dispersion for RNA-seq data with DESeq2. Genome Biol. 15, 550. doi:10.1186/s13059-014-0550-8
Lu, Y., Zhao, Y., Lu, H., Bai, Q., Yang, Y., Zheng, X., et al. (2018). Midgut transcriptional variation of Chilo suppressalis larvae induced by feeding on the dead-end trap plant, Vetiveria zizanioides. Front. Physiol. 9, 1067. doi:10.3389/fphys.2018.01067
Ma, W., Zhang, Z., Peng, C., Wang, X., Li, F., and Lin, Y. (2012). Exploring the midgut transcriptome and brush border membrane vesicle proteome of the rice stem borer, chilo suppressalis (walker). PLoS One 7, e38151. doi:10.1371/journal.pone.0038151
Marana, S. R., Ribeiro, A. F., Terra, W. R., and Ferreira, C. (1997). Ultrastructure and secretory activity of Abracris flavolineata (Orthoptera: acrididae) midguts. J. Insect Physiol. 43, 465–473. doi:10.1016/S0022-1910(96)00117-5
Martin, M. (2011). Cutadapt removes adapter sequences from high-throughput sequencing reads. EMBnet.J. 17, 10. doi:10.14806/ej.17.1.200
Mistry, J., Chuguransky, S., Williams, L., Qureshi, M., Salazar, G. A., Sonnhammer, E. L. L., et al. (2021). Pfam: the protein families database in 2021, Pfam protein Fam. database 2021 49, 412–419. doi:10.1093/nar/gkaa913
Mo, D., Chen, Y., Jiang, N., Shen, J., and Zhang, J. (2020). Investigation of isoform specific functions of the V-ATPase a subunit during Drosophila wing development. Front. Genet. 11, 723. doi:10.3389/fgene.2020.00723
Nadeau, J. A., Petereit, J., Tillett, R. L., Jung, K., Fotoohi, M., MacLean, M., et al. (2017). Comparative transcriptomics of mountain pine beetle pheromone-biosynthetic tissues and functional analysis of CYP6DE3. BMC Genomics 18, 311–315. doi:10.1186/s12864-017-3696-4
Naseem, M. T., Beaven, R., Koyama, T., Naz, S., Su, S., Leader, D., et al. (2023). NHA1 is a cation/proton antiporter essential for the water-conserving functions of the rectal complex in Tribolium castaneum. PNAS 120, e2217084120. doi:10.1073/pnas.2217084120
Noland, J. E., Breitenbach, J. E., Popham, H. J. R., Hum-Musser, S. M., Vogel, H., and Musser, R. O. (2013). Gut transcription in helicoverpa zea is dynamically altered in response to baculovirus infection. Insects 4, 506–520. doi:10.3390/insects4030506
Oppert, B., Perkin, L., Martynov, A. G., and Elpidina, E. N. (2018). Cross-species comparison of the gut: differential gene expression sheds light on biological differences in closely related tenebrionids. J. Insect Physiol. 106, 114–124. doi:10.1016/j.jinsphys.2017.03.010
Overend, G., Luo, Y., Henderson, L., Douglas, A. E., Davies, S. A., and Dow, J. A. T. (2016). Molecular mechanism and functional significance of acid generation in the Drosophila midgut. Sci. Rep. 6, 27242. doi:10.1038/srep27242
Pan, X., Connacher, R. P., and O’Connor, M. B. (2021). Control of the insect metamorphic transition by ecdysteroid production and secretion. Curr. Opin. Insect Sci. 43, 11–20. doi:10.1016/j.cois.2020.09.004
Pauchet, Y., Wilkinson, P., van Munster, M., Augustin, S., Pauron, D., and ffrench-Constant, R. H. (2009). Pyrosequencing of the midgut transcriptome of the poplar leaf beetle Chrysomela tremulae reveals new gene families in Coleoptera. Insect biochem. Mol. Biol. 39, 403–413. doi:10.1016/j.ibmb.2009.04.001
Pimentel, A. C., Dias, R. O., Bifano, T. D., Genta, F. A., Ferreira, C., and Terra, W. R. (2020). Cathepsins L and B in Dysdercus peruvianus, Rhodnius prolixus, and Mahanarva fimbriolata. Looking for enzyme adaptations to digestion. Insect biochem. Mol. Biol. 127, 103488. doi:10.1016/j.ibmb.2020.103488
Pitaluga, A. N., Beteille, V., Lobo, A. R., Ortigão-Farias, J. R., Dávila, A. M. R., Souza, A. A., et al. (2009). EST sequencing of blood-fed and Leishmania-infected midgut of Lutzomyia longipalpis, the principal visceral leishmaniasis vector in the Americas. Mol. Genet. Genomics 282, 307–317. doi:10.1007/s00438-009-0466-2
Qi, W., Ma, X., He, W., Chen, W., Zou, M., Gurr, G. M., et al. (2016). Characterization and expression profiling of ATP-binding cassette transporter genes in the diamondback moth, Plutella xylostella (L). BMC Genomics 17, 760. doi:10.1186/s12864-016-3096-1
Ragionieri, L., Verdonck, R., Verlinden, H., Marchal, E., Broeck, J. Vanden, and Predel, R. (2022). Schistocerca neuropeptides – an update. J. Insect Physiol. 136, 104326. doi:10.1016/j.jinsphys.2021.104326
Rahmani, S., and Bandani, A. R. (2021). A gene silencing of V-ATPase subunit A interferes with survival and development of the tomato leafminer, Tuta absoluta. Arch. Insect Biochem. Physiol. 106, e21753. doi:10.1002/arch.21753
Rane, R. V., Ghodke, A. B., Hoffmann, A. A., Edwards, O. R., Walsh, T. K., and Oakeshott, J. G. (2019). Detoxifying enzyme complements and host use phenotypes in 160 insect species. Curr. Opin. Insect Sci. 31, 131–138. doi:10.1016/j.cois.2018.12.008
Robinson, M. D., McCarthy, D. J., and Smyth, G. K. (2009). edgeR: a Bioconductor package for differential expression analysis of digital gene expression data. Bioinformatics 26, 139–140. doi:10.1093/bioinformatics/btp616
Sanders, H. R., Evans, A. M., Ross, L. S., and Gill, S. S. (2003). Blood meal induces global changes in midgut gene expression in the disease vector, Aedes aegypti. Insect biochem. Mol. Biol. 33, 1105–1122. doi:10.1016/S0965-1748(03)00124-3
Sato, K., Miyata, K., Ozawa, S., and Hasegawa, K. (2019). Systemic RNAi of V-ATPase subunit B causes molting defect and developmental abnormalities in Periplaneta fuliginosa. Insect Sci. 26, 721–731. doi:10.1111/1744-7917.12565
Shi, X., Liu, X., Cooper, A. M. W., Silver, K., Merzendorfer, H., Zhu, K. Y., et al. (2022). Vacuolar (H+)-ATPase subunit c is essential for the survival and systemic RNA interference response in Locusta migratoria. Pest Manag. Sci. 78, 1555–1566. doi:10.1002/ps.6774
Shu, B., Zou, Y., Yu, H., Zhang, W., Li, X., Cao, L., et al. (2021). Growth inhibition of Spodoptera frugiperda larvae by camptothecin correlates with alteration of the structures and gene expression profiles of the midgut. BMC Genomics 22, 391. doi:10.1186/s12864-021-07726-8
Simpson, S. J. (1983). Changes during the 5th instar of Locusta migratoria in the rate of crop emptying and their relationship to feeding and food utilization. Entomol. Expl. Appl. 33, 235–243.
Sodani, K., Patel, A., Kathawala, R. J., and Chen, Z. S. (2012). Multidrug resistance associated proteins in multidrug resistance. Chin. J. Cancer 31, 58–72. doi:10.5732/cjc.011.10329
Spit, J., Badisco, L., Vergauwen, L., Knapen, D., and Vanden Broeck, J. (2016a). Microarray-based annotation of the gut transcriptome of the migratory locust, Locusta migratoria. Insect Mol. Biol. 25, 745–756. doi:10.1111/imb.12258
Spit, J., Breugelmans, B., Van Hoef, V., Simonet, G., Zels, S., and Broeck, J. Vanden (2012). Growth-inhibition effects of pacifastin-like peptides on a pest insect: the desert locust, Schistocerca gregaria. Peptides 34, 251–257. doi:10.1016/j.peptides.2011.06.019
Spit, J., Holtof, M., Badisco, L., Vergauwen, L., Vogel, E., Knapen, D., et al. (2016b). Transcriptional analysis of the adaptive digestive system of the migratory locust in response to plant defensive protease inhibitors. Sci. Rep. 6, 32460. doi:10.1038/srep32460
Spit, J., Zels, S., Dillen, S., Holtof, M., Wynant, N., and Vanden Broeck, J. (2014). Effects of different dietary conditions on the expression oftrypsin-and chymotrypsin-like protease genes in the digestivesystem of the migratory locust, Locusta migratoria. Insect biochem. Mol. Biol. 48, 100–109. doi:10.1016/j.ibmb.2014.03.002
Sumner, J. P., Dow, J. A. T., Earley, F. G. P, Klein, U., Jager, D, Wieczorek, H., et al. (1995). Regulation of plasma membrane V-ATPase activity by dissociation of peripheral subunits. J. Biol. Chem. 270, 5649–5653. doi:10.1074/jbc.270.10.5649
Sun-Wada, G. H., and Wada, Y. (2022). The a subunit isoforms of vacuolar-type proton ATPase exhibit differential distribution in mouse perigastrulation embryos. Sci. Rep. 12, 13590. doi:10.1038/s41598-022-18002-4
Texada, M. J., Lassen, M., Pedersen, L. H., Koyama, T., Malita, A., and Rewitz, K. (2022). Insulin signaling couples growth and early maturation to cholesterol intake in Drosophila. Curr. Biol. 32, 1548–1562. doi:10.1016/j.cub.2022.02.021
Tian, L., Yang, J., Hou, W., Xu, B., Xie, W., Wang, S., et al. (2013). Molecular cloning and characterization of a P-glycoprotein from the diamondback moth, Plutella xylostella (Lepidoptera: plutellidae). Int. J. Mol. Sci. 14, 22891–22905. doi:10.3390/ijms141122891
Toei, M., Saum, R., and Forgac, M. (2010). Regulation and isoform function of the V-ATPases. Biochemistry 49, 4715–4723. doi:10.1021/bi100397s
Torrie, L. S., Radford, J. C., Southall, T. D., Kean, L., Dinsmore, A. J., Davies, S. A., et al. (2004). Resolution of the insect ouabain paradox. Proc. Natl. Acad. Sci. U. S. A. 101, 13689–13693. doi:10.1073/pnas.0403087101
Valencia, A., Wang, H., Soto, A., Aristizabal, M., Arboleda, J. W., Eyun, S. Il, et al. (2016). Pyrosequencing the midgut transcriptome of the banana weevil cosmopolites sordidus (germar) (coleoptera: curculionidae) reveals multiple protease-like transcripts. PLoS One 11, e0151001. doi:10.1371/journal.pone.0151001
Van Hiel, M. B., Van Wielendaele, P., Temmerman, L., Van Soest, S., Vuerinckx, K., Huybrechts, R., et al. (2009). Identification and validation of housekeeping genes in brains of the desert locust Schistocerca gregaria under different developmental conditions. BMC Mol. Biol. 10, 56. doi:10.1186/1471-2199-10-56
Vandesompele, J., De Preter, K., Pattyn, F., Poppe, B., Van Roy, N., De Paepe, A., et al. (2002). Accurate normalization of real-time quantitative RT-PCR data by geometric averaging of multiple internal control genes. Genome Biol. 3, RESEARCH0034.1. doi:10.1186/gb-2002-3-7-research0034
Verbakel, L., Lenaerts, C., El Asrar, R. A., Zandecki, C., Bruyninckx, E., Monjon, E., et al. (2021). Prothoracicostatic activity of the ecdysis-regulating neuropeptide crustacean cardioactive peptide (CCAP) in the desert locust. Int. J. Mol. Sci. 22, 13465. doi:10.3390/ijms222413465
Voght, S. P., Fluegel, M. L., Andrews, L. A., and Pallanck, L. J. (2007). Drosophila NPC1b promotes an early step in sterol absorption from the midgut epithelium. Cell. Metab. 5, 195–205. doi:10.1016/j.cmet.2007.01.011
Wang, N. M., Lee, M. F., and Wu, C. H. (1999). Immunologic characterization of a recombinant American cockroach (Periplaneta americana) Per a 1 (Cr-PII) allergen. Allergy Eur. J. Allergy Clin. Immunol. 54, 119–127. doi:10.1034/j.1398-9995.1999.00902.x
Watanabe, H., and Tokuda, G. (2010). Cellulolytic systems in insects. Annu. Rev. Entomol. 55, 609–632. doi:10.1146/annurev-ento-112408-085319
Wieczorek, H., Beyenbach, K. W., Huss, M., and Vitavska, O. (2009). Vacuolar-type proton pumps in insect epithelia. J. Exp. Biol. 212, 1611–1619. doi:10.1242/jeb.030007
Xu, Q., Lu, A., Xiao, G., Yang, B., Zhang, J., Li, X., et al. (2012). Transcriptional profiling of midgut immunity response and degeneration in the wandering silkworm, bombyx mori. PLoS One 7, e43769. doi:10.1371/journal.pone.0043769
Zeng, J., Kang, W. N., Jin, L., Anjum, A. A., and Li, G. Q. (2022). Vacuolar ATPase subunit F is critical for larval survival in Henosepilachna vigintioctopunctata. Insect Mol. Biol. 31, 177–189. doi:10.1111/imb.12749
Zhang, J., Zhang, Y., Li, J., Liu, M., and Liu, Z. (2016). Midgut transcriptome of the cockroach Periplaneta americana and its microbiota: digestion, detoxification and oxidative stress response. PLoS One 11, e0155254. doi:10.1371/journal.pone.0155254
Zheng, J. C., Sun, S. L., Yue, X. R., Liu, T. X., and Jing, X. (2018). Phylogeny and evolution of the cholesterol transporter NPC1 in insects. J. Insect Physiol. 107, 157–166. doi:10.1016/j.jinsphys.2018.04.007
Zheng, J. C., Yue, X. R., Kuang, W. Q., Li, S. L., Tang, R., Zhang, Z. F., et al. (2020). NPC1b as a novel target in controlling the cotton bollworm, Helicoverpa armigera. Pest Manag. Sci. 76, 2233–2242. doi:10.1002/ps.5761
Keywords: post-feeding, transcriptomics, RNA-seq, digestion, desert locust, insect, Niemann-pick 1b protein, vacuolar-type H(+)-ATPase
Citation: Van Lommel J, Holtof M, Tilleman L, Cools D, Vansteenkiste S, Polgun D, Verdonck R, Van Nieuwerburgh F and Vanden Broeck J (2023) Post-feeding transcriptomics reveals essential genes expressed in the midgut of the desert locust. Front. Physiol. 14:1232545. doi: 10.3389/fphys.2023.1232545
Received: 31 May 2023; Accepted: 26 July 2023;
Published: 10 August 2023.
Edited by:
Morena Casartelli, University of Milan, ItalyReviewed by:
Walter Terra, University of São Paulo, BrazilKenneth Veland Halberg, University of Copenhagen, Denmark
Copyright © 2023 Van Lommel, Holtof, Tilleman, Cools, Vansteenkiste, Polgun, Verdonck, Van Nieuwerburgh and Vanden Broeck. This is an open-access article distributed under the terms of the Creative Commons Attribution License (CC BY). The use, distribution or reproduction in other forums is permitted, provided the original author(s) and the copyright owner(s) are credited and that the original publication in this journal is cited, in accordance with accepted academic practice. No use, distribution or reproduction is permitted which does not comply with these terms.
*Correspondence: Jozef Vanden Broeck, am96ZWYudmFuZGVuYnJvZWNrQGt1bGV1dmVuLmJl
†These authors have contributed equally to this work and share first authorship