 Ayankola O. Ayansiji1,2
 Daniel S. Gehrke1
 Bastien Baralle3Ariel Nozain3
 Meenesh R. Singh2
 Andreas A. Linninger1,4*
- 1Department of Bioengineering, University of Illinois Chicago, Chicago, IL, United States
- 2Department of Chemical Engineering, University of Illinois Chicago, Chicago, IL, United States
- 3UIC Student Intern From EPF, Ecole D’Ingénieur, Paris, France
- 4Department of Neurosurgery, University of Illinois Chicago, Chicago, IL, United States
Background: Traditionally, there is a widely held belief that drug dispersion after intrathecal (IT) delivery is confined locally near the injection site. We posit that high-volume infusions can overcome this perceived limitation of IT administration.
Methods: To test our hypothesis, subject-specific deformable phantom models of the human central nervous system were manufactured so that tracer infusion could be realistically replicated in vitro over the entire physiological range of pulsating cerebrospinal fluid (CSF) amplitudes and frequencies. The distribution of IT injected tracers was studied systematically with high-speed optical methods to determine its dependence on injection parameters (infusion volume, flow rate, and catheter configurations) and natural CSF oscillations in a deformable model of the central nervous system (CNS).
Results: Optical imaging analysis of high-volume infusion experiments showed that tracers spread quickly throughout the spinal subarachnoid space, reaching the cervical region in less than 10 min. The experimentally observed biodispersion is much slower than suggested by the Taylor–Aris dispersion theory. Our experiments indicate that micro-mixing patterns induced by oscillatory CSF flow around microanatomical features such as nerve roots significantly accelerate solute transport. Strong micro-mixing effects due to anatomical features in the spinal subarachnoid space were found to be active in intrathecal drug administration but were not considered in prior dispersion theories. Their omission explains why prior models developed in the engineering community are poor predictors for IT delivery.
Conclusion: Our experiments support the feasibility of targeting large sections of the neuroaxis or brain utilizing high-volume IT injection protocols. The experimental tracer dispersion profiles acquired with an anatomically accurate, deformable, and closed in vitro human CNS analog informed a new predictive model of tracer dispersion as a function of physiological CSF pulsations and adjustable infusion parameters. The ability to predict spatiotemporal dispersion patterns is an essential prerequisite for exploring new indications of IT drug delivery that targets specific regions in the CNS or the brain.
Background
Previous studies on intrathecal (IT) administration in pigs using very slow infusion rates (Bernards, 2006) contributed to the widely held belief that IT administration is confined to a small location near the injection site and, thus, is unsuitable for drug targeting of the brain. A further belief concerns the conjecture that IT drug delivery follows the phenomenon of solute dispersion in oscillatory pipe flow, known as Taylor dispersion in the engineering community (Tsangaris and Athanassiadis, 1985; Nelissen, 2008). However, the applicability of Taylor dispersion on drug transport in oscillatory cerebrospinal fluid (CSF) flow has not been tested in vivo due to technical difficulties and risk to patients. Tracking tracer dispersion in vivo with multimodal PET/MRI (Tangen et al., 2020) or computed tomography angiography suffers from limitations in spatial and temporal feature resolution (Figueiredo et al., 2012). In particular, observation of fast injection jets would require real-time acquisition rates unavailable in the current non-invasive imaging technology (Gholampour and Bahmani, 2021). Hence, technical limitations for tracking solutes suspended in complex CSF flow and patient safety render in vivo quantification problematic, if not impractical. In vitro experiments, using an anatomically accurate deformable model of the spinal subarachnoid space (SAS), are a complement and a logical alternative to authentic, but often inaccurate, in vivo infusion trials with limited temporal and spatial resolution. Several labs have also employed in vitro tests (Hettiarachchi et al., 2011; Bottan et al., 2012; Tangen et al., 2016a; Tangen et al., 2017a; Gholampour and Bahmani, 2021) and CFD models (Sweetman et al., 2011; Yiallourou et al., 2012; Tangen et al., 2015; Khani et al., 2018) for studying central nervous system (CNS) dynamics. IT bench-top testing with optical image analysis offers the distinct benefit of achieving high temporal and spatial resolution, which is necessary for systematic parameter studies of the correlation between infusion and physiological parameters (=anatomy and CSF dynamics) and achievable drug distributions. A key requirement for realistic infusion bench tests is the availability of an anatomically accurate model of the spinal microanatomy with a deformable, closed, fluid-filled spinal compartment with controllable pulsatile CSF flow.
In this paper, we will present parametric studies of IT infusion experiments in a subject-specific, anatomically accurate, deformable, and transparent replica of the human spinal SASs with natural CSF pulsations within the physiological range of spinal fluid amplitude and frequency inside the closed spinal compartment reproduced in a unique 3D printed, deformable, and transparent CNS analog. High-speed video recording enabled accurate observation of spatiotemporal tracer distribution patterns following high-volume IT injection as a function of natural CSF oscillations. The results characterize the speed of the tracer front (hereafter referred to as dispersion speed) as a function of infusion settings (infusion volume, flow rate, position, duration, and catheter diameters) and natural physiological properties (i.e., CSF stroke volume amplitude and frequency). We further compare the experimental data with prior theories (Taylor) of solute transport in oscillatory pipe flow.
Materials and methods
In vitro human spine and central nervous system model
We designed a deformable model of the human CNS to reproduce functional biomechanical relations between dynamically interacting CSF compartments (Figures 1A, B). An anatomically accurate analog of the spinal SASs with the transparent spinal cord including pairs of peripheral nerve roots and the translucent dural surfaces was manufactured in a multistep 3D printing and casting process with subject-specific imaging data of a 26-year-old male volunteer (Tangen et al., 2015). A mold was 3D printed using dissolvable polyvinyl alcohol (PVA). Platinum silicone casting resin of shore A8 hardness (TAP Plastics Inc.) was used for casting a flexible and transparent phantom. All parts including the dural and pial surfaces and nerve roots are deformable. Spinal CSF motion was generated by transmitting oscillatory expansion and contraction of an inflatable balloon located in the head section to the fluid. The balloon, mimicking the cerebrocranial vascular bed, in turn, was driven by a piston pump capable of generating stroke volumes up to 1 mL/beat in the frequency range of 0–127 beats per minute, as shown in detail in Supplementary Appendix SA. The connected spinal and cranial CSF spaces had no artificial openings consistent with the closed nature of the natural CNS. The mode of pulsatile flow conditions in the spinal CSF-filled spaces of the bench model reproduces pulsatile vascular bed dilation consistent with our understanding of periodic intracranial CSF displacement (Basati et al., 2012; Tangen et al., 2015). More manufacturing details of the subject-specific CNS replica (including 3D printing settings, stitching, and patching) can be found elsewhere (Tangen et al., 2016b; Lu et al., 2016; Ayansiji, 2023).
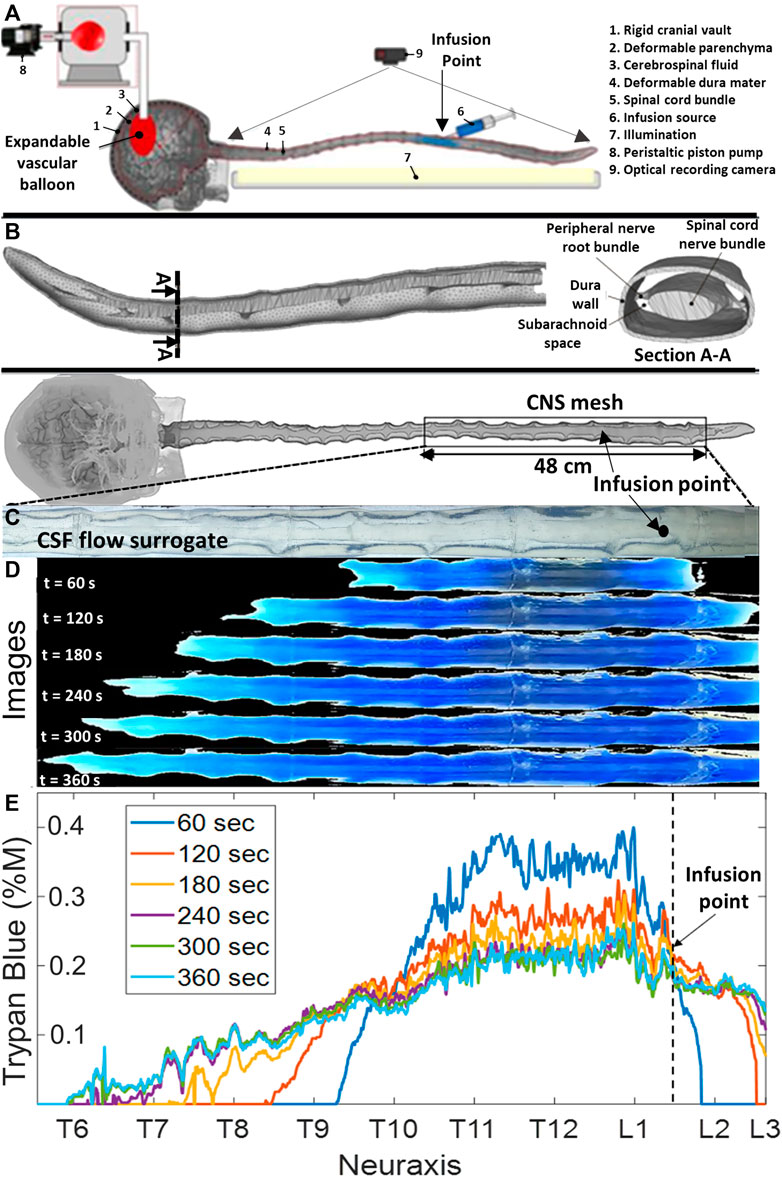
FIGURE 1. Phantom geometry and videography of the dispersion of the infused tracer in the central nervous system flow surrogate model. (A) Schematic diagram of the experimental setting. (B) Meshed model of a subject-specific central nervous system spine phantom model with peripheral nerve roots obtained from MR images. (C) Depiction of the optically clear cerebrospinal flow surrogate model before the injection (no blue dye is visible yet). (D) Progressing tracer front spreading from the injection site, preferably in the cranial direction. CSF: cerebrospinal fluid, IVF: infusion volumetric flowrate, and CNS: the central nervous system. (E) Overview of experiments and the time-lapsed images from a typical infusion experiment with IVF 2.0 mL/min, pulsation 1.0 mL/beat, and 0.4 %M of trypan blue concentration. It also shows a ruler with labels for the anatomical regions (i.e., cervical, thoracic, and lumbar) and the axial coordinate system along the neuroaxis.
To reproduce conditions of in vivo IT procedures on the bench, infusion catheters with inner diameters of 0.2 mm, 1.0 mm, and 3.2 mm were inserted into lumbar and thoracic regions with inner diameters of 0.2 mm, 1.0 mm, and 3.2 mm. The elastic dura of the spine model has a self-sealing property, thus enabling realistic catheter insertion and placement as used in clinical practice for human therapies. A wide range of infusion parameter settings (i.e., infusion volume, flow rate, position, and duration) and systemic blood pump settings (i.e., stoke volume and frequency) enabled the implementation of a comprehensive spectrum of infusion scenarios (bolus and chronic drug pump) occurring in the physiological range of CSF oscillations. More than 50 tracer infusion experiments of trypan blue (Sigma-Aldrich) released with a programmable syringe pump (Harvard Instruments) were performed to precisely investigate the correlation between dye dispersion, CSF pulsations, and infusion parameters. Trypan blue was chosen for its intense blue color needed in optical front tracking. In a clinical setting, acute high-volume injection via a catheter is administered in a lying down (horizontal) position for safety. Thus, the horizontal patient position was chosen for our experiments.
Tracer dispersion tracking with videography
Automatic image processing
Snapshots were obtained from the experimental videos showing the dispersion of the tracer at different times. Supplementary Appendix SB shows more details. MATLAB 2019b was used for semi-automated image analysis and quantification of dye dispersion. A filing system stored key parameters for each experimental run: infusion volume, infusion molarity, infusion volumetric flow rate (IVF), experiment duration, subject orientation (supine), oscillation frequency, and oscillation amplitude. Each video frame captured red–green–blue (RGB) data in the range of 0–255 for each pixel at location x and time. The RGB values were converted to grayscale and concentration to track the expansion of the dispersion front of the trypan blue, as shown in details in Supplementary Appendix SC. Analysis was divided into two phases: Phase-1 (acute infusion, t = 0–1 min) covered the time the infusion pump actively discharged dye into the CNS replica. Phase-2 (after infusion, t > 1 min) further tracked dynamic tracer spread under the influence of natural CSF pulsations (without further infusion). The results displayed in this work are of those obtained using the grayscale method and not the binary method.
Optical analysis of tracer concentration
RGB triplet values for pixels along the neuraxis were recorded in each frame used for analysis (typically snapshots 1 minute apart). The RGB color values were aggregated with a grayscale formula and intensities inferred from white-offset (white = no dye, blue = all dye). White-offset and area under the curve (AUC) scaling enabled quantitative dye concentration
Analysis of the dispersion front
A custom image analysis code was used to determine the speed and spatial position of the visible dye front. Figures 1C, D show a time-lapsed series of images showing the expansion of the blue tracer before and after infusion at time points 0 s, 60 s, 120 s 180 s, 240 s, 300 s, and 360 s. Figure 1E shows tracer concentrations profiles inferred from the extracted RGB pixel intensity as described in Materials and methods. There was no tracer absorption into the dura and parenchymal walls that would have affected lighting properties. Trypan blue did not stain our system, and no loss of material was observed after months of use.
Experimental determination of the speed of the advancement of the tracer front
The method of moments (MoM) was used to determine the apparent tracer dispersion velocity from video data because it minimizes the sensitivity of optically acquired concentration profiles to uneven lighting conditions, scattering effects, and uncertainty in concentration inference from intensity data (Birk et al., 2005). The MoM has been previously used to quantify dispersion in an annular tube (Mondal and Mazumder, 2005; Nagarani and sebastian, 2013; Debnath et al., 2019). Our experiment was insensitive to variations in lighting conditions, uncertainty of intensity quantification, and cardiac cycle synchronization; thus, we did not need gated acquisition. This is due to the advantage that MoM only tracks the slope of the evolution of moments over relative prolonged periods of time (=mean and variance of the entire intensity profile), so it is insensitive to perturbations of absolute concentrations or experimental variability. We first determined the speed of caudocranial motion of the infusate by tracking shifts in the center of gravity of the tracer profile. The first moment
where
We further computed the second moment or area moment of inertia for each time point as as follows:
The second moment can be interpreted as the mean spread of the visible concentration profile around its center,
The coefficient of the apparent dispersion can then be readily determined as the rate of change in the second moment of the concentration curves by plotting their variance as a function of time. Supplementary Appendix SD shows details.
Stroke volumes and mean pulsatile flow velocities for formal analysis
In MR imaging, it is convenient to characterize natural CSF pulsations via the instantaneous total CSF volume, V(t), cervical stroke volume,
The average CSF flow velocity, Urms, correlates a clinical MR quantity to parameters used in our formal flow analysis. Thus, two stroke volume settings of 0.5 mL/beat to 1 mL/beat in the frequency range of 0–120 beat/min enabled us to cover a wide range of CSF flow velocity averages covering the entire physiological range (0.09–0.93 cm/s).
The mean CSF flow velocity,
Statistical analysis
Initially, the experiments were repeated three times with the same settings. The repeats essentially gave the same moments, thus confirming the reproducibility and robustness of data acquisition. The results of the Shapiro–Wilk test indicated that all datasets had a normal distribution. The ANOVA test was used in the regression analyses using IBM SPSS v26 to confirm that regression models described the dependent variables. Confidence intervals were calculated for all regression results. The Durbin–Watson statistic for all regression results was 0.716; therefore, the datasets have autocorrelation. Furthermore, calculated tolerances indicated the multicollinearity effect in the datasets. A p-value of 0.05 was considered statistically significant.
Results
Dynamic tracer profile front tracking
Figure 2A shows tracer concentration profiles inferred from calibrated RGB pixel intensity as described in Materials and methods. Figure 2B shows the first and second moment for the selected experiment. The first and second moments for all the experiments are given in Supplementary Appendices SC, SD. The close agreement between three repetitions (=variance of the second moment
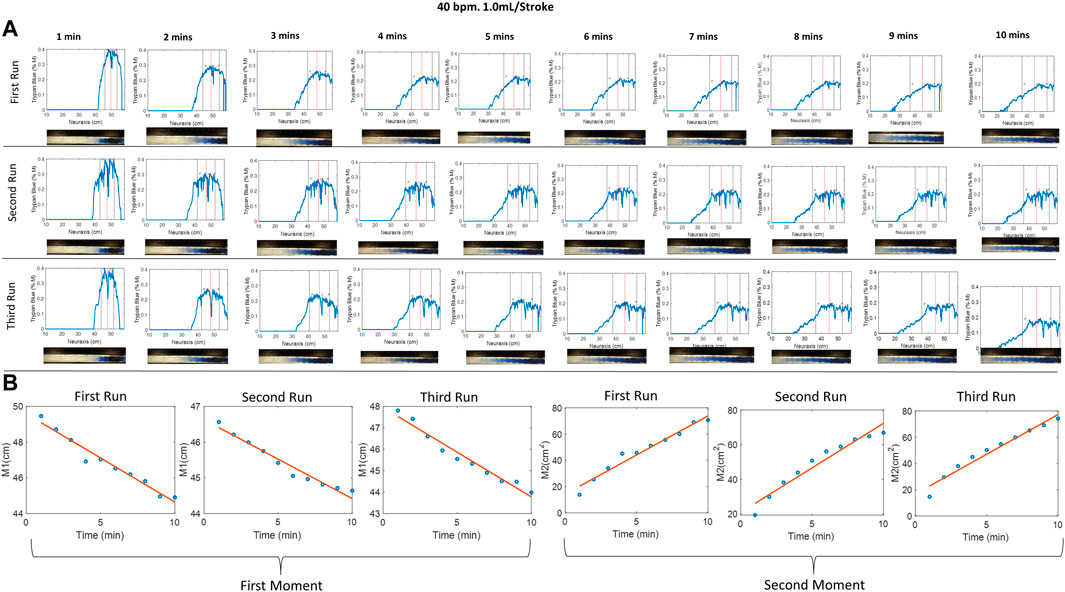
FIGURE 2. (A) Evolution of the tracer at different times of 40 bpm, 1.0 mL/stroke at different runs, where the red and black vertical lines represent the mean and variance of the curve, respectively. Img means image. (B) The first and second moment for the three identical experiments. The small difference between repetitions suggests acceptable experimental variability. The first moment, M1, indicates that the tracer moves in the cranial direction from the injection position around (50 cm) toward the thoracic region position around (44 cm). The second moment characterized the apparent speed of tracer dispersion. Half of the slope of the second moment plot gives the dispersion coefficient.
Effect of catheter diameter on initial tracer spread during acute infusion (phase-1)
We studied the effect of catheter diameter on the speed and size of the dispersion front. Infusion experiments are performed using three different catheters with inner diameters of 0.2 mm (needle N1), 1.0 mm (N2), and 3.2 mm (the widest needle N3). Infusion lasted 1 min over the course of 54 experiments. The dispersion width after 10 min, DD10, was measured from the point of the needle tip to the tip of the dye front in the caudal and cranial directions. The duration of 10 min was chosen because this initial time window is critically important for assessing acute risks associated with high-volume IT injection. High local toxicity has been implicated with granuloma formation (Kaye et al., 2004; Allen et al., 2006). We also varied infusion volumetric flow rates (IVF = 0.5, 1.0, and 2.0 mL/min).
Figure 3A shows that high-caliber catheters promote slower tracer spread during infusate injection (1 min). We observed the formation of an injection jet, which was less pronounced in high-caliber catheters leading to shorter dispersion width after 1 min, DD1. For identical infusion flow rate (IVFs from 0.5, 1.0, and 2.0 mL/min), the large caliber needle (N3) generated the shortest dispersion width. Figure 3B shows the effect of inner catheter diameter on the extent of the tracer spread observed 10 min after the infusion as a function of infusion flow. All experimental results (N = 54) were also fitted into a linear regression model that can be used to estimate the initial neuraxial coverage (=size of the region dosed by solute) as a function of catheter lumen and infusion volumes (IVF). The regression model
can serve as a guideline in the clinical practice to estimate the length of initial dispersion as a function of catheter lumen and IVF (Figure 3B), where
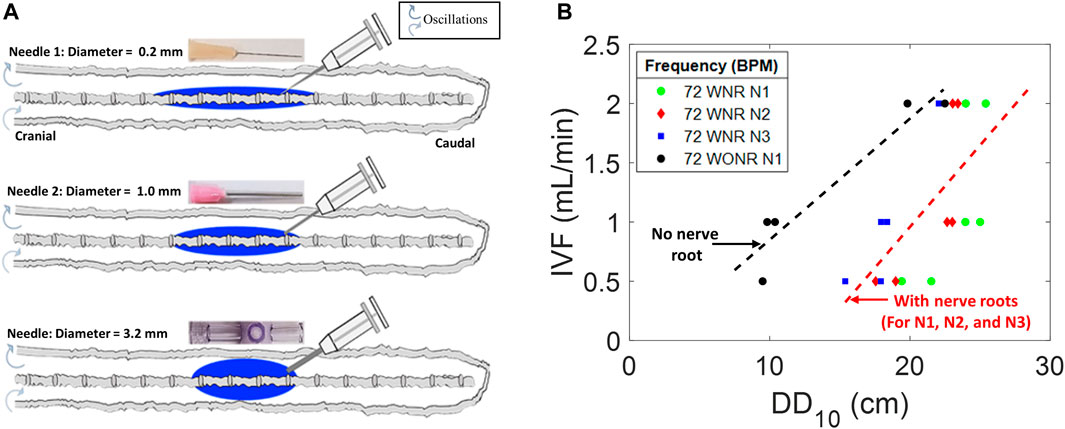
FIGURE 3. Effects of needle diameter, IVF, and DD on tracer dispersion. (A) Central nervous system spine model is shown as a diagram with varied diameter infusion catheters and corresponding idealized dispersion patterns (blue). (B) Relation of the infusion type to DD10 and needle diameter in a CNS spine model with peripheral nerve roots (colorful) and without peripheral nerve roots (gray). DD10 represents the linear dispersion distance in the tracer front after 10 min of infusion. N1, N2, and N3 represent needles 1, 2, and 3, respectively. IVF: infusion volumetric flow rate. WNR: with nerve root. WONR: without nerve root.
The realization of a fixed infusion rate with thinner catheters requires higher infusion pressure resulting in higher exit velocities (
Effect of injection parameters on initial caudocranial dispersion (phase-1, acute infusion)
Experimental settings of the injection flow rate, injection volume, and catheter specifications were varied to explore optimal conditions for targeting the cervical section or brain area. Fifty-four experiments (N = 54) were conducted to systematically characterize tracer targeting toward the cranial compartment as a function of infusion parameters (phase-1, shown in Figure 4A). The results in Figure 4B show that higher infusion flow rates IVF accelerate the speed of the tracer front advancing in the cranial direction from the infusion catheter tip. The distance the tracer front moves in the cranial direction from the infusion catheter tip for the CNS model in the supine position as observed 10 min after the infusion is represented by SDD. This effect at high-volume injections is due to the increased insertion kinetic energy (Supplementary Appendix SA).
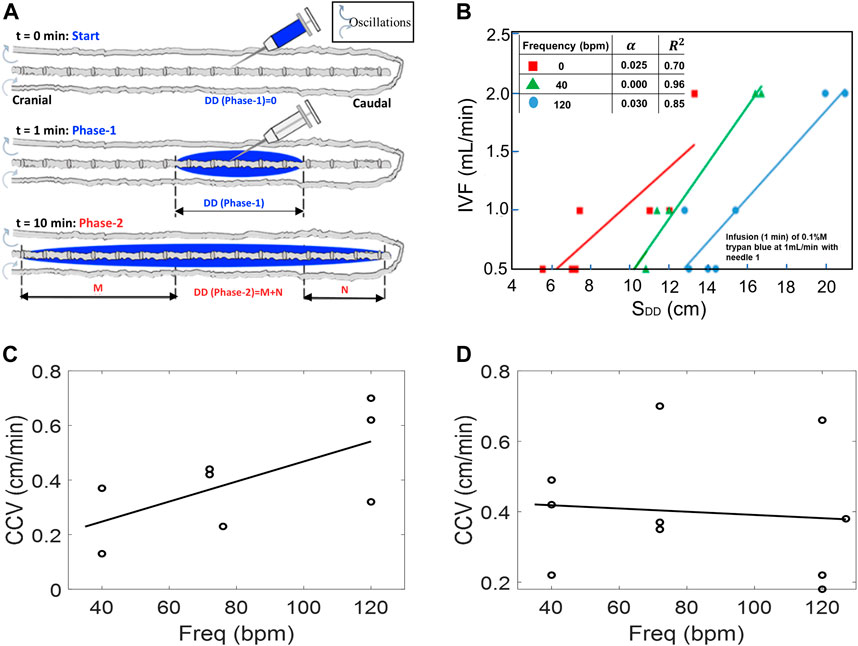
FIGURE 4. (A) Schematic depicting experimental setting in phase-1 tracer dispersion experiments. All results pertain to injection phase (phase-1). (B) Effect of CSF oscillation frequency on dispersion length SDD (with nerves) using IVF of 0.5, 1.0, and 2.0 mL/min under oscillation frequencies 0, 40, and 140 bpm, respectively. (C,D) Caudocranial velocity (CCV) changes of the tracer relative to frequency for pulsation for 0.5 mL/beat (C) and 1.0 mL/beat (D). During the infusion phase, CCV is not frequency dependent, especially at higher CSF amplitudes.
The speed of caudocranial motion, CCV, is calculated as the change of the first moment with respect to time as shown in Figure 2B. All experiments showed a shift of the first moment toward the cranium. We determined the velocity of apparent caudocranial advancement of the tracer front,
and
with constant terms
The rapid expansion of the drug front follows the amount of infused tracer qualitatively, as expected, because the main driver of the initial tracer spread is the injection impulse of fresh infusate concentrated in the relative narrow spatial confinement in the lumbar injection zone.
Dispersion by natural CSF pulsation (phase-2, after injection)
Once infusion stops (t > 1 min), further tracer spread is no longer propelled by injection impulse, but by natural oscillations of the CSF. In our closed, deformable model, induced CSF flow in the spinal SAS is also oscillatory with zero net flux. This is also approximately the situation in vivo since net flows due to bulk CSF production are much smaller than those due to oscillations. The apparent dispersion coefficient of tracer spread in the oscillatory CSF flow was determined experimentally as a function of amplitudes (cervical CSF stroke volume and mean CSF flow velocities) and frequencies in a series of dynamic tracer infusion experiments. Two stroke volume settings of 0.5–1 mL/beat in the frequency range of 0–120 beat/min enabled us to induce a wide range of CSF flow velocity averages covering a wide physiological range (Urms = 0.09–0.93 cm/s). The root-mean-square velocity of the CSF,
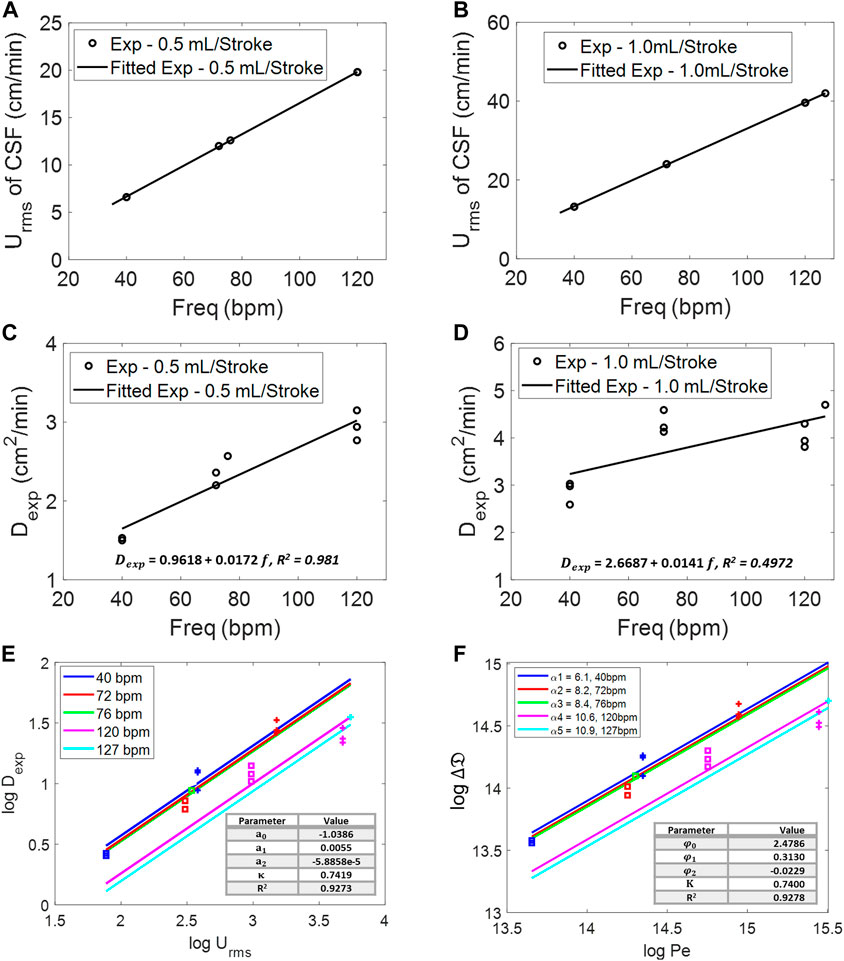
FIGURE 5. Root-mean-square velocity of the CSF at different frequencies for 0.5 mL/beat (A) and 1.0 mL/beat (B). Experimental diffusivity of infusion at different frequencies for (C) 0.5 mL/beat and (D) 1.0 mL/beat. (E) Log–log relation of root-mean-square velocity, Urms, of the CSF and experimental diffusivity,
To derive functional correlations, Figure 5E lists experimental dispersion coefficient, Dexp, as a function of natural CSF oscillations in terms of amplitude,
Is IT distribution predicted by Taylor–Aris dispersion?
We also cast all experimental results into a dimensionless form for comparison to prior transport theories. We depart from the commonly known Taylor theory (Aris, 1960) and Aris (Salerno et al., 2020), which describes the increase of the effective diffusivity over molecular diffusivity, D0, as a function of the dimensionless Peclet number,
Figure 5E shows a slope in our experiments (
The best-fit parameter set (
We compared our experimental dispersion coefficient trends to prior work, including the work of Hoagland and Prud’Homme (1985) and Dutta and Leighton (2002). Figure 6A shows that several versions of Taylor–Aris dispersion (TAD) grossly overestimate the speed of biodispersion in the human spinal SAS. Figure 6B shows the zoomed view of the experimental portion of Figure 6A for better visibility. The Taylor (1953), Hoagland and Prud’Homme (1985), and Dutta and Leighton (2002) versions do not match our experiments even qualitatively because the slopes of the Pe dependence (
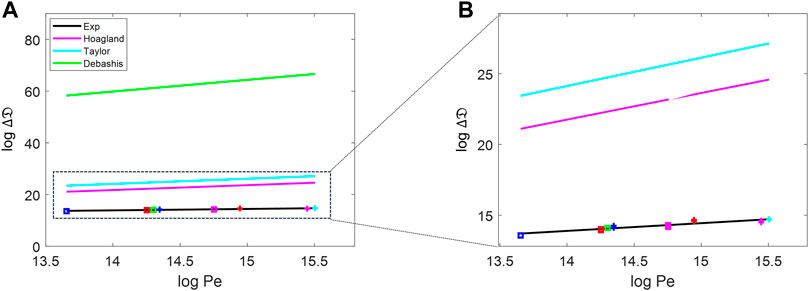
FIGURE 6. (A) Comparison of the dispersion change against the Peclet number between the experiment data, pure diffusion, and the prediction by Taylor approaches [Hoagland and Prud’Homme (1985), Taylor (1953), and Dutta and Leighton (2002)]. (B) Zoomed-in version of the experimental, Taylor, and Hoagland portions of (A). The blue-, red-, green-, magenta-, and cyan-colored data points are for the frequencies of 40, 72, 76, 120, and 127 bpm, respectively. The data represented as square are for 0.5 mL/stroke, and those represented with + are for 1.0 mL/stroke.
We also compared our experimental values to theoretical dispersion coefficient estimates by Stockman (2007), who used Lattice Boltzmann simulations. Stockman used the maximum average speed in a period of oscillation of 220.2 cm/min (in lattice unit of 1 × 10⁻² Lu/ts), and the molecular diffusion of the tracer used was D0 = 0.0024 cm2/min. The range of the determined dispersion coefficients was D = 0.6356–1.7735 cm2/min, which is much smaller than that found in our experiment by a factor of over 2.5. The Stockman data are also plotted in Supplementary Appendix SF.
In summary, Stockman’s (2007) results underestimate the speed of tracer dispersion, and the results of Hoagland and Prud’Homme (1985), Dutta and Leighton (2002), and Taylor (1953) overestimate the dispersion coefficient by three orders of magnitude or more compared to our in vitro data.
Effect of nerve roots on dispersion distance in phase-2
We previously observed that annular phantoms without microanatomical features underestimate the actual dispersion after IT (Barton, 1983; Banyte et al., 2013). To test the significance of microanatomical features on tracer dispersion, we also fabricated a spinal model without nerve roots and compared tracer propagation during infusion to the more anatomically realistic model with nerve roots. Tracer dispersion in the model with nerve roots was found to be always much more rapid than in a system lacking nerve roots under the same condition of oscillatory flow (Figure 3B). Complex flow and observable mixing patterns are absent in idealized annular models lacking spinal microanatomy (Aris, 1960; Tsangaris and Athanassiadis, 1985; Salerno et al., 2020), thus failing to boost the effective dispersion of IT-injected tracers as this is the case when microanatomical features are present. The results of this study provide further evidence for the significant impact of microanatomical features on the spatial and temporal dispersion patterns of IT-administered solutes shown previously (Tangen et al., 2015; Haga et al., 2017).
Reduced-order pharmacokinetic model for IT drug biodistribution
Experimental data for tracer infusion experiments served as the input for a reduced-order pharmacokinetic model of IT administration. The full description of this mechanistic drug administration model is beyond the scope of this manuscript but can be found elsewhere (Tangen et al., 2017a; Linninger et al., 2023). In brief, tracer biodispersion after lumbar intrathecal injection was simulated via a convection–diffusion process distributed along the neuraxis in Eq. 12. The effect of geometry-induced mixing due to natural CSF pulsations was captured via the effective diffusivity,
Tracer concentration profiles along the neuraxis as a function of time were predicted with mechanistic pharmacokinetic simulations. Pharmacokinetic tracer profile simulations with CNS dimensions and infusion settings used in the experiments took less than one CPU minute to converge, generating asymmetrical profiles with peak concentration decreases with time (Figure 7A). The comparison with the experimental run shows a qualitative match both in the spatial and the temporal dimension as shown in Figure 7A. Figure 7B shows the maximum concentration is attained in a short interval of mean path length. The preliminary results of the proposed order model show that the use of experimentally obtained effective dispersion coefficients can effectively predict drug dispersion after IT administration using a reduced-order pharmacokinetic simulation at low computational cost. It is worth noting that the simulation of biodistribution of active drugs into the CNS and the systemic circulation required additional information on biochemical parameters, denoted by the sink term
where
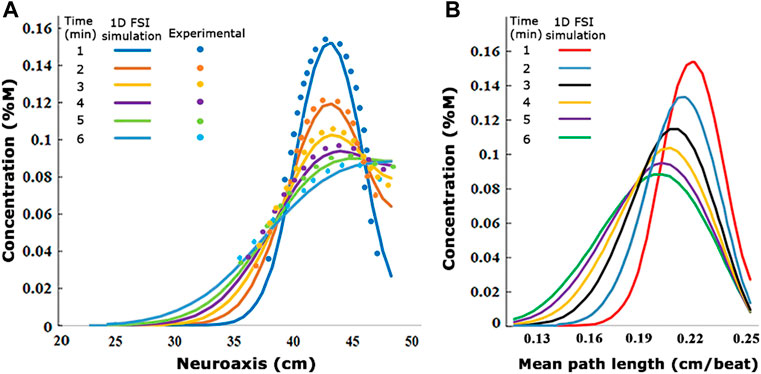
FIGURE 7. (A) Visualization of the experimentally derived concentration values compared to the 1D fluid–structure interaction simulation concentration values at different times. (B) Changes of 1D FSI simulation concentration diagrams in the different mean path lengths. The values are from infusion experiment parameters in
Discussion
Realistic replica of the human CNS
IT infusion studies under physiological conditions require deformability of the CSF spaces to accommodate realistic pulse pressure propagation and fluid motion inside a closed spinal SAS. Deformable fluid-filled spaces in the present bench test analog of the human CNS is fully enclosed between the soft dura/parenchyma surfaces and a distensible vascular interface (cranium vault with a distensible vascular balloon) without fluid exchange across the open system boundaries. The proposed configuration approximates the anatomy and fluid–structure interaction dynamics of the spinal SAS, so we have confidence that it reproduces the complex geometry-induced CSF mixing patterns that were reported in the previous work using the direct numerical simulation of spinal CSF flow (Tangen et al., 2015). The CNS model also incorporates microanatomical features of the spinal cord, epidural space, and peripheral nerve root bundles, especially, which are critical geometric aspects implicated with enhanced mixing (Yiallourou et al., 2012; Pahlavian et al., 2014) of fluid layers in the spinal SAS, leading to accelerated drug dispersion.
Moreover, transparent borders of the see-through human CNS replica enabled dynamic optical tracking of tracer concentration profiles during and after IT solute administration. Our experiments characterized in detail two stages occurring during high-volume IT infusion. The initial phase during which the drug is injected lasts only a few minutes in clinical settings. The duration of 10 min was chosen because it is suitable for assessing acute risks associated with high-volume IT administration (local toxicity and granuloma formation).
Injection phase
The axial dispersion during the injection phase (phase-1) correlated with infusion volume, IVF, and catheter diameters. Thinner catheters (inner diameter d = 0.2 mm) generate wider and fast initial solute dispersion as is attainable with high-caliber catheters (di = 3.2 mm inner diameter). Based on our series of experiments, a simple formula in Eq. 5 predicts the initial dispersion width, DD10, the distribution length after 10 min of injection, as a function of injection volume/flow rate and catheter diameter. The formula in Eq. 5 may serve to estimate the initial volume of distribution, peak concentrations, and initial neuronal tissue exposure during the acute infusion phase of high-volume drug administration as a function of catheter lumen and infusion flow rate. The peak local toxicity risk may be elevated in infusion protocols generating narrower initial spread (i.e., high-volume infusion with large caliber catheters). It can also be used to estimate the expected local volume of drug action and local drug concentration to assess the risk of granuloma formations (Allen et al., 2006).
Drug pumps
Drug pumps are often deployed for the local treatment of chronic pain or spasticity but are less suitable for targeting the brain, which was one of the main objectives of the current study. Drug pumps operate under much lower flow rate settings than possible with acute administration. Accordingly, the effect of the injection impulse may be negligible. Chronic IT administration with drug pumps are, thus, predominately governed by conditions of natural oscillation (phase-2) for its entire time course as discussed as follows. For more recent developments for effective infusion protocols from drug pumps, we refer to the work by Yaksh et al. (2012) and Hildebrand et al. (2019).
Dispersion in the naturally oscillating CSF (after the injection subsides)
After the injection ceases, the tracer spreads due to natural CSF pulsations. Oscillatory fluid flow around microanatomical features create a geometry-induced mixing pattern, which breaks the laminar flow field by introducing eddies and vortices around nerve roots. Localized and interspersed eddies were observed in the flow directly upstream and downstream of the cylindrical peripheral nerve root bundles suspended in the flow. Moreover, trabeculae can substantially enhance this effect as reported in Eq. 12.
Caudocranial motion
In all infusion experiments, slow but steady caudocranial advancement of the tracer front from the lumbar injection site toward the cranium was observed. We offer two explanations for the experimentally observed caudocranial transport.
First, lumbar injection divides the space available for the solute to disperse into a smaller distal volume containing the sacral compartment and a larger cranially facing domain stretching from the catheter tip to the thoracic, the cervical, and the cranial SAS. We observed that tracers initially spread equally in both sections, which is consistent with a diffusive process. Subsequently, the advancing dye fronts fill the closed sacral domain faster due to its smaller size. Once the closed sacral region is occupied, the tracer profile center of gravity begins shifting toward the head. The asymmetric caudocranial tracer profile develops due to a boundary effect that was confirmed with a mechanistic diffusive transport model. Systematic experiments with varying CSF conditions (amplitude and frequency) enabled the determination of a formula for the velocity of the caudocranial shift as a function of CSF pulsations and frequency as shown in Eq. 6.
The graded biomechanical deformation profile of the spinal SAS responsible for CSF pulse attenuation is a secondary factor. The CSF pulse amplitude was shown to diminish gradually from the cervical toward the sacral region (Tangen et al., 2015). The CSF pulsations and average oscillatory CSF velocities, Urms, become larger toward the cervical region compared to the lumbar region where the pulse amplitude is almost zero. Thus, effective dispersion tends to become faster in the caudocranial direction. These two effects cannot be studied in rigid, open systems.
The infusion experiments were conducted in a closed deformable CNS model with no net CSF generation or removal. This supports the notion that bulk CSF flow or absorption is not necessary for caudocranial drug dispersion to occur. Rather, experiments suggest that caudocranial transport of infused solutes can simply result from the asymmetry of the CSF spaces and graded CSF pulse amplitudes.
Recently, an interesting analytical solution for drug dispersion in the SAS was developed by Lawrence et al. (2019). Dispersion predicted inside an idealized annular geometry also found solute transport controlled by convection but not Taylor dispersion.
Derivation of guidelines from in vitro experiments
Tracer dispersion after high-volume injection was very rapid, reaching the cervical region in less than 10 minutes, and it spread quickly throughout the spinal SAS. The apparent dispersion coefficient was robustly determined experimentally as a function of CSF amplitudes and frequencies. An empirical correlation (Eq. 8) between apparent diffusion coefficient and CSF pulsations, a function of CSF amplitude and oscillation, was established. This formula can be of clinical interest to predict tracer dispersion for IT drug administration.
We provide a simple guideline for estimating the volume of distribution of the drug during the injection phase as a function of catheter caliber and injection volume based on the experimental data and model in Eq. 5. Table 1 summarizes the expected size of the injection front (dispersion length after 10 min) from the lumbar injection site. It can also be used to get an idea about the advancement from the injection site toward the cranium, since the moving front of the tracer profile advances at least half of DD10.
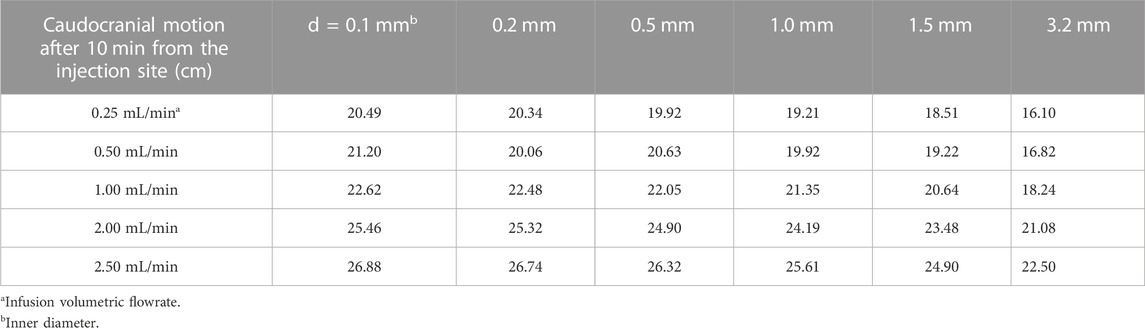
TABLE 1. Guide for caudocranial motion, DD10, as a function of injection needle diameter (top row) and infusion volumetric flow rate (first column).
For tracer dispersion in the oscillatory CSF flow (phase-2), Eq. 8 quantifies effective dispersion as a function of stroke volume and pulse frequency. Table 2 derived from these data enables the estimation of the effective dispersion coefficient based on physiological parameters. For drug molecules with different molecular diffusion coefficients (i.e., drugs with substantially different properties of our tracer), it may be used as a first approximation when no data are available or when its Pe number is in the same range as for trypan blue with a diffusion coefficient of D0 = 1.938 × 10⁻⁶ cm2/min.
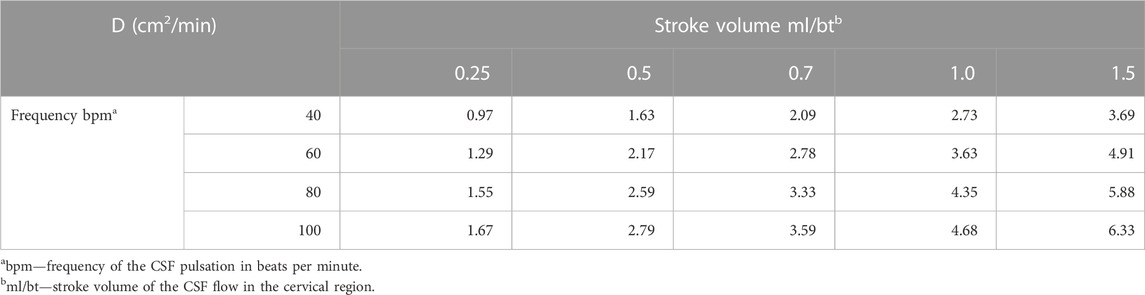
TABLE 2. Table of clinical data, dispersion coefficient D.
Comparison to Taylor–Aris dispersion theory
The analytical Taylor–Aris approach was shown to grossly overestimate the bio dispersion process. All versions of the TAD models showed that the spread of the tracer in human spine does not follow the trend proposed by Taylor dispersion. Effective dispersion by geometry-induced mixing seems to follow a different trend than that described by TAD. Moreover, TAD does not consider the effect of injection volume, catheter geometry, and placement as discussed during phase-1 of the infusion experiments. Also, TAD assumes a constant flow velocity throughout the channel. Finally, poor predictions by TAD theories for IT tracer dispersion and the very large Peclet number ranges seem to suggest that the molecular diffusivity (D0 in the denominator of Pe) may not be an ideal dimensionless scaling characteristic.
Eccentricity and stagnation zones
Several authors have implicated the eccentricity of idealized cross-sectional areas of CSF-filled spaces in the spinal SAS as a key factor for accelerated drug dispersion (Loth et al., 2001; Sánchez et al., 2018; Chu et al., 2019; Moral-Pulido et al., 2023). The insensitivity to centric or eccentric alignment in our experiments does not seem to support the notion of eccentricity as a significant factor for the speed of IT dispersion. Moreover, we could not observe stagnation or recirculation zones in our experiments.
Limitations
There are safety limits to high-volume injections adding the CSF amount during drug administration. We have experienced in rat that no more than 10% of the CSF volume can be safely injected over a period of a couple of minutes (Venugopal et al., 2017). Higher injection impulse may also contribute to the possibility of high shear rates that nerve roots experience near the catheter tip, which may again pose an additional risk that requires clinical investigation.
We did not investigate the dispersion of active drug molecules because we believe that tracers were ideal to quantify the physical transport phenomena with optical methods. We also did not consider biological functions such as the uptake in spinal or cerebral tissue because the focus was on determining dispersion coefficients as a function of physical flow phenomenon, amplitude and frequency of the CSF. Uptake studies would require a different setting. The in vivo study by Tangen et al. (2017b) could be a starting point, but parametric studies of CSF amplitude and frequency in humans are not practical, if not unethical. Therefore, the replica of the human CSF conditions seems a good choice for the parametric dispersion studies pursued here.
The biomechanical stress–strain relation of the epidural spaces is a function of several poorly understood factors. These include viscous resistance exerted by venous blood volume and fatty tissues, possible elastic deformation resistance of nerve roots bulging into peripheral distal spaces, and the biomechanical properties of the dura membrane including the stiffening effect of trabeculae and ligaments. Our system does neither consider CSF generation in the choroid plexus nor reabsorption (elimination) in the subarachnoid villi. These additional features could be incorporated in a more refined head model, which was not needed in our study focusing on spinal dynamics. The current model was able to induce cervical CSF displacements (stroke volume 0–1 mL/beat) within the physiological range but was not designed to faithfully reproduce the biomechanical compliance of the spinal compartment. Accordingly, we also did not attempt to measure the absolute pressure changes and gradients that occur during infusion. We plan to study the rise in the line pressure or the increase in pressure in the CSF of the spinal SAS as a function of injection parameters in future work.
Another related limitation pertains to the practice of fluid removal before high-volume injection (initial CSF tapping). There was no attempt made to interrogate the CNS model regarding the biomechanical response of the CSF spaces subjected to tapping.
Conclusion
We conducted an extensive parametric study of tracer distribution in a subject-specific deformable bench model of the human CNS with anatomical and functional reproduction of CSF dynamics from the spine to the cranium. A systematic variation of parameters in numerous infusion experiments enabled the in vitro quantification of the spatiotemporal tracer dispersion patterns and their dependence on significant infusion parameters and pulsatile CSF conditions. This study reports a unique set of experimental data on the combined effect of infusion and natural oscillations in a deformable CNS replica that have not been reported previously. Our bench experiments suggest the feasibility of targeting large sections of the neuroaxis to the brain with the help of high-volume injection protocols. Infusion studies using human CNS models may serve as an inexpensive surrogate for testing and optimizing infusion protocols for the safe distribution of IT-administered solutes along the neuraxis to inform clinical trials in humans.
Data availability statement
The original contributions presented in the study are included in the article/Supplementary Material. Further inquiries can be directed to the corresponding author.
Ethics statement
The studies involving acquisition of humans imaging data were approved by the University of Illinois at Chicago IRB. The studies were conducted in accordance with the local legislation and institutional requirements. The participants provided their written informed consent to participate in this study.
Author contributions
Conceptualization: AL and MS. Experiment: BB, DG, AN, and AA. Data Analysis: AA. Theory: AA, MS, and AL. Composition: AA, DG, and AL. Supervision: AL. All authors contributed to the article and approved the submitted version.
Funding
This study was funded by the National Science Foundation (https://www.nsf.gov) under grant number CBET-1301198, National Institute of Health, Neurological Disorders, and Stroke (https://www.ninds.nih.gov) under grant number NIH NINDS 1R21NS099896, and National Institute of Health, National Institute of Aging (https://www.nia.nih.gov) under grant NIH NIA 1R56AG066634-01 and NIH NINDS U19NS123717.
Acknowledgments
AL is grateful for funding from the National Science Foundation, the National Institutes of Health, Neurological Disorders, and Stroke and the National Institute of Aging. The authors thank Dr. Gholampour at the University of Chicago for the initial help with statistical methods. The experimental data of this study were first disclosed in March 2022 on biorxiv (Ayansiji et al., 2022).
Conflict of interest
The authors declare that the research was conducted in the absence of any commercial or financial relationships that could be construed as a potential conflict of interest.
Publisher’s note
All claims expressed in this article are solely those of the authors and do not necessarily represent those of their affiliated organizations, or those of the publisher, the editors, and the reviewers. Any product that may be evaluated in this article, or claim that may be made by its manufacturer, is not guaranteed or endorsed by the publisher.
Supplementary material
The Supplementary Material for this article can be found online at: https://www.frontiersin.org/articles/10.3389/fphys.2023.1244016/full#supplementary-material
References
Allen J. W., Horais K. A., Tozier N. A., Yaksh T. L. (2006). Opiate pharmacology of intrathecal granulomas. Anesthesiol. J. Am. Soc. Anesthesiol. 105 (3), 590–598. doi:10.1097/00000542-200609000-00025
Aris R. (1960). On the dispersion of a solute in pulsating flow through a tube. Proc. R. Soc. Lond. Ser. A, Math. Phys. Sci. 259, 370–376. doi:10.1098/rspa.1960.0231
Ayansiji A. O., Gehrke D. S., Baralle B., Nozain A., Singh M. R., Linninger A. A. (2022). Enhanced intrathecal drug dispersion achieved by high volume injection and natural micromixing. doi:10.1101/2022.03.22.485353
Ayansiji A. O. (2023). Drug delivery to the central nervous system. Chicago: University of Illinois. PhD Thesis.
Banyte D., Visbeck M., Tanhua T., Fischer T., Krahmann G., Karstensen J. (2013). Lateral diffusivity from tracer release experiments in the tropical North Atlantic thermocline. J. Geophys Res. Oceans 118 (5), 2719–2733. doi:10.1002/jgrc.20211
Barton N. G. (1983). On the method of moments for solute dispersion. J. Fluid Mech. 126, 205–218. doi:10.1017/s0022112083000117
Basati S., Desai B., Alaraj A., Charbel F., Linninger A. (2012). Cerebrospinal fluid volume measurements in hydrocephalic rats. J. Neurosurg. Pediatr. 10 (4), 347–354. doi:10.3171/2012.6.PEDS11457
Bernards C. M. (2006). Cerebrospinal fluid and spinal cord distribution of baclofen and bupivacaine during slow intrathecal infusion in pigs. Anesthesiology 105 (1), 169–178. doi:10.1097/00000542-200607000-00027
Birk S., Geyer T., Liedl R., Sauter M. (2005). Process-based interpretation of tracer tests in carbonate aquifers. Groundwater 43 (3), 381–388. doi:10.1111/j.1745-6584.2005.0033.x
Bottan S., Poulikakos D., Kurtcuoglu V. (2012). Phantom model of physiologic intracranial pressure and cerebrospinal fluid dynamics. IEEE Trans. Biomed. Eng. 59 (6), 1532–1538. doi:10.1109/TBME.2012.2187448
Chu H. C. W., Garoff S., Tilton R. D., Khair A. S. (2019). Dispersion in steady and time-oscillatory flows through an eccentric annulus. AIChE J. 66 (2), e16831. doi:10.1002/aic.16831
Debnath S., Saha A. K., Mazumder B. S., Roy A. K. (2019). Transport of a reactive solute in a pulsatile non-Newtonian liquid flowing through an annular pipe. J. Eng. Math. 116 (1), 1–22. doi:10.1007/s10665-019-09999-1
Dutta D., Leighton D. T. (2002). A low dispersion geometry for microchip separation devices. Anal. Chem. 74 (5), 1007–1016. doi:10.1021/ac010718c
Figueiredo G., Brockmann C., Boll H., Heilmann M., Schambach S. J., Fiebig T., et al. (2012). Comparison of digital subtraction angiography, micro-computed tomography angiography and magnetic resonance angiography in the assessment of the cerebrovascular system in live mice. Clin. Neuroradiol. 22 (1), 21–28. doi:10.1007/s00062-011-0113-2
Gholampour S., Bahmani M. (2021). Hydrodynamic comparison of shunt and endoscopic third ventriculostomy in adult hydrocephalus using in vitro models and fluid-structure interaction simulation. Comput. Methods Programs Biomed. 204, 106049. doi:10.1016/j.cmpb.2021.106049
Haga P. T., Pizzichelli G., Mortensen M., Kuchta M., Pahlavian S. H., Sinibaldi E., et al. (2017). A numerical investigation of intrathecal isobaric drug dispersion within the cervical subarachnoid space. PLOS ONE 12 (3), e0173680. doi:10.1371/journal.pone.0173680
Hettiarachchi H. D. M., Hsu Y., Harris T. J., Linninger A. A. (2011). The effect of pulsatile flow on intrathecal drug delivery in the spinal canal. Ann. Biomed. Eng. 39 (10), 2592–2602. doi:10.1007/s10439-011-0346-x
Hildebrand K. R., Page L. M., Billstrom T. M., Steinauer J. J., Eddinger K. A., Arjomand S., et al. (2019). Characterization of effect of repeated bolus or continuous intrathecal infusion of morphine on spinal mass formation in the dog. Neuromodulation Technol. Neural Interface 22 (7), 790–798. doi:10.1111/ner.12963
Hoagland D. A., Prud’Homme R. K. (1985). Taylor-aris dispersion arising from flow in a sinusoidal tube. AIChE J. 31 (2), 236–244. doi:10.1002/aic.690310210
Hsu Y., Hettiarachchi H. D. M., Zhu D. C., Linninger A. A. (2012). The frequency and magnitude of cerebrospinal fluid pulsations influence intrathecal drug distribution: key factors for interpatient variability. Anesth. Analg. 115 (2), 386–394. doi:10.1213/ANE.0b013e3182536211
Hsu Y., Linninger A. A. (2013). Quantitative integration of biological, pharmacokinetic, and medical imaging data for organ-wide dose-response predictions. IEEE Trans. Biomed. Eng. 60 (3), 625–632. doi:10.1109/TBME.2013.2244893
Kaye P. M., Svensson M., Ato M., Maroof A., Polley R., Stager S., et al. (2004). The immunopathology of experimental visceral leishmaniasis. Immunol. Rev. 201 (1), 239–253. doi:10.1111/j.0105-2896.2004.00188.x
Khani M., Sass L. R., Xing T., Keith Sharp M., Balédent O., Martin B. A. (2018). Anthropomorphic model of intrathecal cerebrospinal fluid dynamics within the spinal subarachnoid space: spinal cord nerve roots increase steady-streaming. J. Biomech. Eng. 140 (8), 0810121–08101215. doi:10.1115/1.4040401
Lawrence J. J., Coenen W., Sánchez A. L., Pawlak G., Martínez-Bazán C., Haughton V., et al. (2019). On the dispersion of a drug delivered intrathecally in the spinal canal. J. Fluid Mech. 861, 679–720. doi:10.1017/jfm.2018.937
Linninger A. A., Barua D., Hang Y., Iadevaia S., Vakilynejad M. (2023). A mechanistic pharmacokinetic model for intrathecal administration of antisense oligonucleotides. Front. Physiol. 14, 1130925. doi:10.3389/fphys.2023.1130925
Loth F., Yardimci M. A., Alperin N. (2001). Hydrodynamic modeling of cerebrospinal fluid motion within the spinal cavity. J. Biomech. Eng. 123 (1), 71–79. doi:10.1115/1.1336144
Lu L., Tangen K., Gabor T., Pan Y., Linninger A., Purandare N. (2016). Additive manufacturing of subject-specific spine model for in-vitro intrathecal drug delivery study. American Society of Mechanical Engineers Digital Collection. Available from: https://www.asmedigitalcollection.asme.org/IDETC-CIE/proceedings/IDETC-CIE2016/50145/V004T05A013/258568 (Accessed December 11, 2019).
Mondal K. k., Mazumder B. s. (2005). On the solute dispersion in a pipe of annular cross-section with absorption boundary. ZAMM - J. Appl. Math. Mech. Z Für Angew. Math. Mech. 85 (6), 422–430. doi:10.1002/zamm.200210180
Moral-Pulido F., Jiménez-González J. I., Gutiérrez-Montes C., Coenen W., Sánchez A. L., Martínez-Bazán C. (2023). In vitro characterization of solute transport in the spinal canal. Phys. Fluids 35 (5), 051905. doi:10.1063/5.0150158
Nagarani P., sebastian B. T. (2013). Dispersion of a solute in pulsatile non-Newtonian fluid flow through a tube. Acta Mech. 224, 571–585. doi:10.1007/s00707-012-0753-6
Pahlavian S. H., Yiallourou T., Tubbs R. S., Bunck A. C., Loth F., Goodin M., et al. (2014). The impact of spinal cord nerve roots and denticulate ligaments on cerebrospinal fluid dynamics in the cervical spine. PLOS ONE 9 (4), e91888. doi:10.1371/journal.pone.0091888
Salerno L., Cardillo G., Camporeale C. (2020). Aris-Taylor dispersion in the subarachnoid space. Phys. Rev. Fluids 5 (4), 043102. doi:10.1103/physrevfluids.5.043102
Sánchez A. L., Martínez-Bazán C., Gutiérrez-Montes C., Criado-Hidalgo E., Pawlak G., Bradley W., et al. (2018). On the bulk motion of the cerebrospinal fluid in the spinal canal. J. Fluid Mech. 841, 203–227. doi:10.1017/jfm.2018.67
Stockman H. W. (2007). Effect of anatomical fine structure on the dispersion of solutes in the spinal subarachnoid space. J. Biomech. Eng. 129 (5), 666–675. doi:10.1115/1.2768112
Sweetman B., Xenos M., Zitella L., Linninger A. A. (2011). Three-dimensional computational prediction of cerebrospinal fluid flow in the human brain. Comput. Biol. Med. 41 (2), 67–75. doi:10.1016/j.compbiomed.2010.12.001
Tangen K., Gabor T., Lu L., Pan Y., Linninger A. (2016b). “Digital manufacturing and in silico modeling for rational design of drug delivery to the central nervous system,” in Summer Biomechanics, 2016 Bioengineering and Biotransport Conference.
Tangen K., Narasimhan N. S., Sierzega K., Preden T., Alaraj A., Linninger A. A. (2016a). Clearance of subarachnoid hemorrhage from the cerebrospinal fluid in computational and in vitro models. Ann. Biomed. Eng. 44 (12), 3478–3494. doi:10.1007/s10439-016-1681-8
Tangen K., Nestorov I., Verma A., Sullivan J., Holt R. W., Linninger A. A. (2020). In vivo intrathecal tracer dispersion in cynomolgus monkey validates wide biodistribution along neuraxis. IEEE Trans. Biomed. Eng. 67 (4), 1122–1132. doi:10.1109/TBME.2019.2930451
Tangen K. M., Hsu Y., Zhu D. C., Linninger A. A. (2015). CNS wide simulation of flow resistance and drug transport due to spinal microanatomy. J. Biomech. 48 (10), 2144–2154. doi:10.1016/j.jbiomech.2015.02.018
Tangen K. M., Leval R., Mehta A. I., Linninger A. A. (2017a). Computational and in vitro experimental investigation of intrathecal drug distribution: parametric study of the effect of injection volume, cerebrospinal fluid pulsatility, and drug uptake. Anesth. Analg. 124 (5), 1686–1696. doi:10.1213/ANE.0000000000002011
Tangen K. M., Leval R., Mehta A. I., Linninger A. A. (2017b). Computational and in vitro experimental investigation of intrathecal drug distribution: parametric study of the effect of injection volume, cerebrospinal fluid pulsatility, and drug uptake. Anesth. Analg. 124 (5), 1686–1696. doi:10.1213/ANE.0000000000002011
Taylor G. I. (1953). Dispersion of a solute in a solvent under laminar conditions. Proc. R. Soc. Lond Ser. A 219, 186–203.
Tsangaris S., Athanassiadis N. (1985). Diffusion in oscillatory flow in an annular pipe. Angew. Math. U Mech. 65, T252–T254.
Venugopal I., Habib N., Linninger A. (2017). Intrathecal magnetic drug targeting for localized delivery of therapeutics in the CNS. Nanomed 12 (8), 865–877. doi:10.2217/nnm-2016-0418
Yaksh T. L., Kater A., Dean R., Best B. M., Miljanich G. P. (2012). Pharmacokinetic analysis of ziconotide (SNX-111), an intrathecal N-type calcium channel blocking analgesic, delivered by bolus and infusion in the dog. Neuromodulation Technol. Neural Interface 15 (6), 508–519. doi:10.1111/j.1525-1403.2012.00479.x
Yiallourou T. I., Kröger J. R., Stergiopulos N., Maintz D., Martin B. A., Bunck A. C. (2012). Comparison of 4D phase-contrast MRI flow measurements to computational fluid dynamics simulations of cerebrospinal fluid motion in the cervical spine. PLoS ONE 7 (12), e52284. doi:10.1371/journal.pone.0052284
Keywords: geometry-induced mixing, intrathecal drug delivery, method of moments, oscillatory CSF flow, in vitro deformable spine model, drug infusion parameters
Citation: Ayansiji AO, Gehrke DS, Baralle B, Nozain A, Singh MR and Linninger AA (2023) Determination of spinal tracer dispersion after intrathecal injection in a deformable CNS model. Front. Physiol. 14:1244016. doi: 10.3389/fphys.2023.1244016
Received: 21 June 2023; Accepted: 30 August 2023;
Published: 25 September 2023.
Edited by:
Dominik Obrist, University of Bern, SwitzerlandReviewed by:
Kartik Jain, University of Twente, NetherlandsDupoiron Denis, Institut de Cancérologie de l’Ouest (ICO), France
Dario Alessandro, ASST Sette Laghi, Italy
Copyright © 2023 Ayansiji, Gehrke, Baralle, Nozain, Singh and Linninger. This is an open-access article distributed under the terms of the Creative Commons Attribution License (CC BY). The use, distribution or reproduction in other forums is permitted, provided the original author(s) and the copyright owner(s) are credited and that the original publication in this journal is cited, in accordance with accepted academic practice. No use, distribution or reproduction is permitted which does not comply with these terms.
*Correspondence: Andreas A. Linninger, bGlubmluZ2VAdWljLmVkdQ==