- 1Department of Physiology and Biophysics, Institute of Biomedical Sciences, University of São Paulo (USP), São Paulo, Brazil
- 2Department of Physical Education – Presidente Prudente, University of Western São Paulo (UNOESTE), São Paulo, Brazil
- 3Postgraduate Program in Pathophysiology in Internal Medicine – Botucatu, Paulista State University (UNESP), São Paulo, Brazil
- 4Postgraduate Program in Animal Science, University of Western São Paulo (UNOESTE), São Paulo, Brazil
- 5Postgraduate Program in Physical Exercise in HealthPromotion, University North of Paraná (UNOPAR), Londrina, Paraná, Brazil
- 6Postgraduate Program in Animal Science, Campinas State University (UNICAMP), Campinas, Brazil
- 7Postgraduate Program in Movement Sciences – PresidentePrudente, Paulista State University (UNESP), São Paulo, Brazil
- 8Postgraduate Program in Health Sciences, University of Western São Paulo (UNOESTE), Presidente Prudente, Brazil
Methods: This study identified the alterations caused by concurrent training and intermittent fasting on the myocardium of rats. In total, 39 adult male Wistar rats were used, divided into four groups: control [C (n = 12)], fasting control [FC (n = 11)], training [T (n = 8)], and fasting training [FT (n = 8)]. The critical load test was performed to evaluate and determine the intensity of effort in aerobic training (AT) (swimming). The resistance training protocol (RT) (anaerobic) consisted of four series of 10 jumps, with overload corresponding to 50% of the body mass of each animal, and 1 min of rest between each series. The concurrent training (CT) was composed of a protocol of AT and RT in the same session. The intermittent fasting period was 12/12 h. At the end of the experiment, the animals were weighed to obtain the Lee index; heart weight was verified, and tissue samples were collected for further histological analysis. After obtaining the data, the Shapiro-Wilk test was performed, followed by a two-way analysis of variance (ANOVA) with Tukey’s post-test for the variables measured at the end of the experiment.
Results: For the variables body mass, feed consumption, and the anaerobic threshold, the FC group showed a greater decrease in the Lee index [(0.28 ± 0.00) p < 0.05)] in relation to the other groups. There were no significant alterations (p > 0.05) in relation to heart weight, fractal dimension, and anaerobic threshold (AnT); finally, both the T and the FT groups presented a significant decrease ([T: (277.3 ± 119.3/FT: 310.5 ± 148.8] p < 0.05) in the transverse cross-sectional area of the cardiomyocytes, when compared to the control groups.
Conclusion: The practice of concurrent training for a period of 4 weeks precipitated a decrease in the transverse cross-sectional area of the cardiomyocytes of Wistar rats. Furthermore, when combined with intermittent fasting, concurrent training not only led to a reduction in the transverse cross-sectional area of the cardiomyocytes but also resulted in a decrease in body mass compared to the isolated concurrent training model.
1 Introduction
Several modalities of physical training, performed at moderate to high intensity, are used to promote beneficial alterations in the cardiovascular system, being responsible for greater mitochondrial adaptation, physiological cardiac hypertrophy, and improvements in different cardiac variables (Ghorayeb et al., 2005; Seo et al., 2019). Among these modalities, “concurrent training” (CT) stands out, consisting of performing exercises that stimulate both aerobic and anaerobic demand in a single training session (Hickson, 1980). Studies carried out to evaluate the effects of this training model on the cardiovascular system report greater cardiovascular adaptation when compared to isolated resistance training, and that this adaptation occurs due to the competition between aerobic and anaerobic metabolisms (Coffey and John, 2017). However, if CT is carried out at very high intensities, it can cause negative effects to the practitioner, such as overtraining, which may affect the magnitude of molecular signaling and, consequently, impair protein synthesis, thus generating negative effects at the cellular level (Fyfe, Bishop, Stepto, 2014; Schoenfeld, 2010; Souza et al., 2001).
Some studies have identified that concurrent training is able to alter cardiovascular and muscle health variables to a greater extent when compared to other training modalities. These alterations include a decrease in resting heart rate, systolic and diastolic blood pressure, and an increase in maximal oxygen consumption. (Davis et al., 2008; Häkkinen et al., 2003; Sheikholeslami-Vatani et al., 2015; Takeshima et al., 2004). However, some authors suggest that the excessive fatigue caused by concurrent training (CT) may impair improvements in physical capacities, as CT activates different energy systems simultaneously and compromises the individual’s recovery (Aoki and Gomes, 2005; Bell et al., 2000). It is known that concurrent training uses energy substrates from both anaerobic and aerobic pathways and that fasting promotes less energy availability during its performance, causing the metabolism to use a greater amount of fatty acids as an energy source (Medeiros, et al., 2015; Hill et al., 2012). Intermittent fasting is one method of food restriction, consisting of fasting during the day and feeding only when the sun goes down (Saleh et al., 2005).
Studies indicate that this type of fasting promotes cardiovascular protection against heart disease, decreased heart rate, and protection against muscle injury biomarkers (Saleh et al., 2005; Mrad et al., 2019; Varady et al., 2007). It is also important to acknowledge that high-intensity physical exercise can compromise cardiac function, inducing arrhythmias, heart failure, and even sudden cardiac death. These outcomes may result from enzymatic imbalances, structural damage, and reduced cellular oxygen availability (Junqueira et al., 2016; Ventura-Clapier et al., 2011; Ping et al., 2015). Additionally, low levels of certain nutrients can increase cardiovascular risks; for instance, sodium restriction may trigger several physiological effects associated with cardiac function (Graudal et al., 2014; Paterna et al., 2008; Parrinello et al., 2009). Thus, the authors' hypothesis was that the high intensity of concurrent training (CT), combined with dietary restriction, could lead to changes in cardiac tissue, especially in cardiomyocyte size. This reduction may result from exercise-induced adaptations and altered nutrient availability due to fasting, since cardiomyocytes are responsive to both mechanical and metabolic stimuli (Trager et al., 2023). Therefore, the present study is relevant because it reports the effects of a CT model and intermittent fasting method on the myocardium.
Despite demonstrating different characteristics when compared to humans, such as the circadian cycle, studies involving animals present advantages, for example, the high control of variables and ease of manipulation. Additionally, the effects found can be extrapolated to humans or used to encourage further studies (Quinn, 2015). Thus, the aim of the present study was to verify the possible alterations in the myocardium of rats after 12 sessions of CT associated with intermittent fasting.
2 Methods
2.1 Ethical approval
The study was developed in compliance with the rules and ethical principles of the Brazilian College of Animal Experimentation (BCAE) and was approved by the Ethics Committee for the Use of Animals (ECUA-5372). The investigators understand the ethical principles under which the journal Frontiers in Physiology – Exercise Physiology operates, and this work complies with the journal’s animal ethics checklist (Grundy, 2015).
2.2 Animals
In total, 39 male Wistar rats (Rattus novergicus albinus) were used, with a mean age of 150 days and a body mass of 431 ± 2.94 g. The experiment started with 40 animals, however, there was a sample loss due to one animal drowning during the development of the study. The animals were housed in groups of 2 animals per box (polyethylene), with a controlled ambient temperature (22°C ± 2°C) and brightness (light/dark cycle of 12 h), with lights turned on at 10 a.m. and off at 10 p.m.
2.3 Division of groups
The animals were divided into four groups:
Control Group [C (n = 12)]: the animals remained loose in their cages, with free access to water and feed (feed for laboratory rats – Primor®).
Fasting Control [FC (n = 11)]: the animals remained loose in their cages, with free access to water, however, feeding was controlled to a fasting period of 12 h for 12 h of free access to feed (Ferreira Da Silva et al., 2011).
Training [T (n = 8)]: This training model was composed of two different exercise sessions, which require different energy sources during execution, one being predominantly aerobic (swimming) and the other predominantly anaerobic (jumping). Access to water and feed was ad libitum.
Fasting Training [FT (n = 8)]: This group was identical to the T group except that the animals fasted, under the same model that was applied to the FC group (12 × 12 h).
2.4 Concurrent training
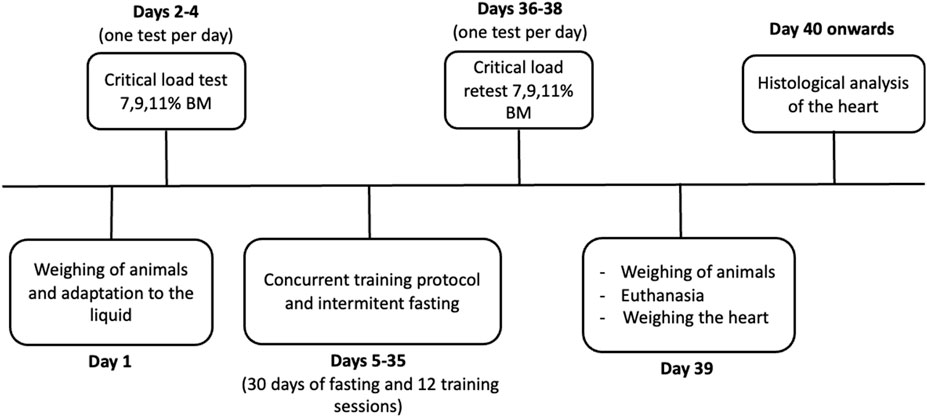
Prior to beginning the training protocols, the rats were submitted to a period of adaptation to the liquid environment and equipment (10–20 min/day, 3 days a week, for 1 week, with progressively increasing overload and duration) (Manchado et al., 2006). An adaptation period reduces the stress produced by the liquid medium and by the physiological alterations resulting from physical training (Chimin et al., 2009).
The aerobic training protocol was performed first, followed by the resistance training protocol. The protocols were performed sequentially, with a pause only to change the training area. The training was carried out three times a week for 1 month, totaling twelve training sessions. The aerobic training protocol consisted of three weekly sessions on non-consecutive days, comprising 30 min of swimming exercise, with an intensity of 80% of the anaerobic threshold (AnT), stipulated from the critical load test (Manchado et al., 2006). For the swimming exercise, a tank was used, containing cylindrical polyvinyl chloride (PVC) tubes, 25 cm in diameter and 100 cm in height, with water at a depth of 70 cm, and a controlled water temperature (Ozaki et al., 2014).
For the resistance training protocol, four series of 10 jumps were used, with overload, adjusted weekly, corresponding to 50% of the body mass of each animal. A polyvinyl chloride (PVC) tube, 25 cm in diameter, 80 cm in height, and 38 cm deep was used. The overload was carried in a waistcoat made from elastic, with a Velcro closure, attached to the chest area, specially designed for this type of exercise (Hill, 1993) (Figure 1).
2.5 Critical load test
The critical workload (CWL) and anaerobic capacity (CTA) were obtained by inducing swimming exercise with three different stimuli. Three loads were selected for each animal, corresponding to 7, 9, and 11% of body mass, so that the animals performed all efforts (Hill, 1993).
The exercises were chosen with the intention of the animals entering exhaustion after between 2 and 10 min (Hill, 1993). In this way, we recorded the time limit (Tlim) to perform the exercise at each of the loads. The animals rested for 24 h after each stimulus (Marangon et al., 2002; Chimin et al., 2009; Castoldi et al., 2013). The values established for the two variables were obtained using the formula: Critical Load = CWL+ (CTAx1/Tlim).
After performing this procedure, the aerobic capacity of each animal could be determined, which was necessary to identify the intensity of effort in the swimming exercise.
2.6 Food consumption
Food consumption was recorded at each change of feed and water to establish parameters between the groups, calculated by the ratio between the animal’s body mass (BManimal) and food consumption, both in grams (g). Consumption was calculated by the content of feed offered (FO) and subtracted from the surplus (S), using the formula [BManimal/FO-S] (De Luca et al., 1987).
2.7 Intermittent fasting protocol
Intermittent fasting was performed with a 12/12 protocol, that is, the animals performed 12 h of fasting with 12 h of feeding on every day of the week (Ferreira Da Silva et al., 2011). The fasting period started at 9 p.m. and ended the next day at 9 a.m. The training took place 1 h before the beginning of the feeding period, so the animals performed the concurrent training while still fasting. Water consumption was ad libitum, 24 h a day, for all animals.
2.8 Lee Index
The Lee index was calculated for all animals, using the ratio between the cube root of body mass (g) and the naso-anal (muzzle-coccyx) length in centimeters, as described by Novelli and colleagues (2007). Although this method provides a practical and non-invasive approach to estimate body adiposity in rodents, it represents an indirect measure and does not allow precise quantification of fat mass. Therefore, interpretation of this index should be made with caution, and future studies are encouraged to include direct assessments of body composition, such as dissection-based fat pad analysis or imaging techniques (Figure 2).
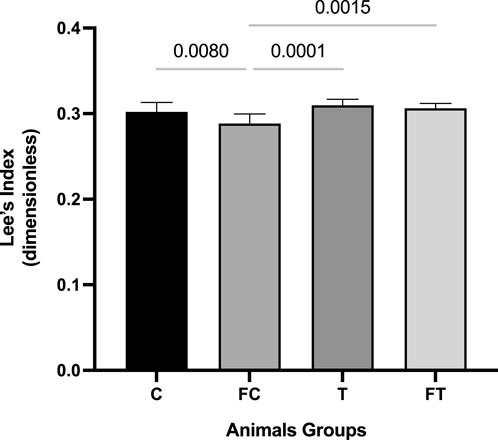
Figure 2. Comparison of the Lee Index between groups after intervention. C (12) = Control; FC (11) = Fasting control; T (8) = Training; FT (8) = Fasting training. Statistically significant difference of the two-way ANOVA test with Tukey’s post-test with 5% significance (p < 0.05).
2.9 Anesthetic protocols
The animals were euthanized 48 h after the final training session to avoid the influence of acute exercise-induced effects on the analyses and outcomes. Anesthesia was induced using an intraperitoneal injection of ketamine hydrochloride (40 mg/kg) and xylazine hydrochloride (10 mg/kg). Subsequently, the animals were euthanized by exsanguination via cardiac puncture (Castoldi et al., 2013).
2.10 Surgical procedures and weighing the heart
After euthanasia, the heart of each animal was surgically removed, and the ventricles and atria were removed and weighed separately on a precision scale, Kern & Sohn® (model PNJ 600-3M, manufactured in Balingen-Frommern, GER), and an analytical scale of the brand Marte Científica® (model AD500, manufactured in São Paulo, BRA) (Pinheiro et al., 2018), before being stored in a formaldehyde solution (10%) for histological processing (Gimenes et al., 2015).
2.11 Histological processing of the cardiac muscle
Samples of the left ventricle were fixed in a 10% buffered formaldehyde solution for a period of 48 h, after which the tissue was embedded in paraffin blocks, for later preparation of the histological slides. After fixation, the hearts were sectioned transversely immediately below the coronary sulcus, and longitudinally, to obtain only the left ventricles. Next, the hearts were washed, dehydrated, and embedded in paraffin (Noh et al., 2015). The blocks containing the fragments of the cardiac tissue were cut in a rotating microtome using the semi-serial method, with thicknesses of 5 µm.
The sections were subjected to Hematoxylin-Eosin (HE) staining for morphological-histomorphometric analysis (Ozaki et al., 2015).
2.12 Histological analysis
For the histomorphological analysis, to quantitatively evaluate the tissues, images of the slides stained with HE were obtained using the Nikon® eclipse 50i (manufactured in New York, United States) optical microscope attached to an Infinity 1 camera (manufactured in California, United States).
For the histomorphometric analysis, to qualitatively evaluate the tissues, the sectional area of cardiomyocytes was measured using NIS-Elements, advanced image acquisition, analysis and processing software developed by Nikon®. For this, images were used with a ×40 magnification, and 50 cardiomyocytes from each animal were measured. For the analysis of the left ventricle, a Leica® optical microscope (DM500 model, manufactured in Illinois, United States) was used, with Leica Application Suite software version 4.2.0. The measurement was performed through the left ventricle contour, where, at the end of the contour, the software recorded the final size of the contoured line in a micrometer (Junqueira et al., 2016).
2.13 Data analysis
After obtaining the data, the Shapiro-Wilk normality test was performed and the comparison between groups was carried out through the analysis of variances (two-way ANOVA). This procedure was performed for all variables obtained at the end of the experiment. In addition, the two-way ANOVA test with repeated measures was utilized and Tukey’s post-test for body mass, feed consumption, and the anaerobic threshold. All procedures adopted a significance value of 5% (p < 0.05). The calculations were performed using the statistical package (GraphPad Prism v.10.0. for Mac®).
3 Results
3.1 Body mass
The FT group presented decreases in body mass throughout the experiment, leading to a statistically significant decrease in mass (g) in relation to groups C (p = 0.0001), FC (p = 0.007), and T (p = 0.001). After statistical analysis, the final body mass means of all groups throughout the intervention were as follows: C (468.5 ± 20.7); FC (427.4 ± 33.5); T (431.6 ± 26.7); and FT (396.1 ± 26.3) (Figure 3).
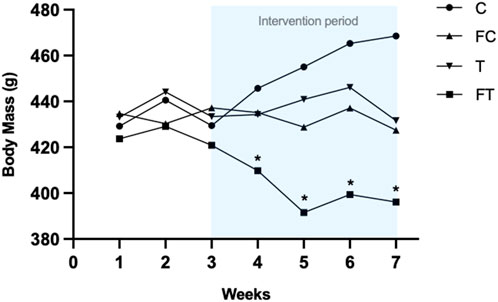
Figure 3. Body mass of groups during the evaluations. C (12) = Control; FC (11) = Fasting control; T (8) = Training; FT (8) = Fasting training. Significant difference between FT and C, FC, and T. * = statistically significant difference vs. control group.
3.2 Lee index
The FC group showed a significant decrease for the Lee’s Index variable when compared to the other groups. The means and standard deviations of the groups were: C: 0.30 ± 0.01; FC: 0.28 ± 0.00; T: 0.30 ± 0.00; and FT: 0.30 ± 0.00.
3.3 Feed consumption
A significant increase in feed consumption was verified in the FC group when compared with the other groups. The groups demonstrated the following respective means: (C = 27.12 ± 0.49); (FC = 35.41 ± 1.48); (T = 26.20 ± 1.45); (FT = 22.31 ± 0.62). After the statistical analysis of feed consumption, significant differences were noted between group FC and groups C (p = <0.0001) and FT (p = 0.0015); and between group FC (p = 0.001), and groups T and FT (p = 0.001). This result can to be see in Figure 4.
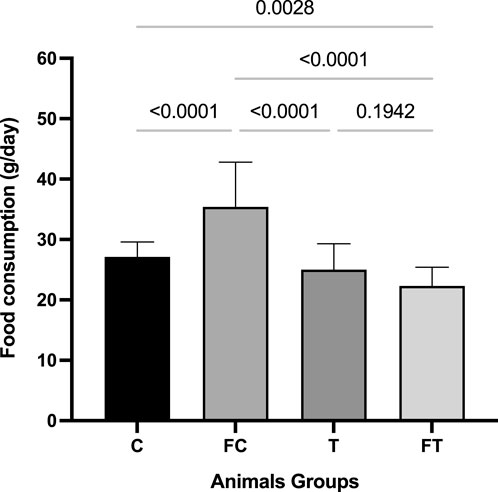
Figure 4. Comparison of Feed Consumption between groups after the intervention. C (12) = Control; FC (11) = Fasting control; T (8) = Training; FT (8) = Fasting training. Statistically significant difference by two-way ANOVA test with repeated measures and Tukey’s post-test (p < 0.05).
3.4 Anaerobic threshold
The pre-intervention Anaerobic Threshold means, expressed in % body mass × seconds (%bm*s), were as follows: (C = 6.00 ± 0.22); (FC = 5.65 ± 0.52); (T = 6.84 ± 0.17); (FT = 6.03 ± 0.20), and after 4 weeks of intervention, thpe means were: (C = 6.11 ± 0.37); (FC = 5.62 ± 0.83); (T = 6.64 ± 0.15); (FT = 6.47 ± 0.26). The results of the Anaerobic Threshold before and after the intervention did not show significant alterations after performing the statistical analysis (Figure 5).
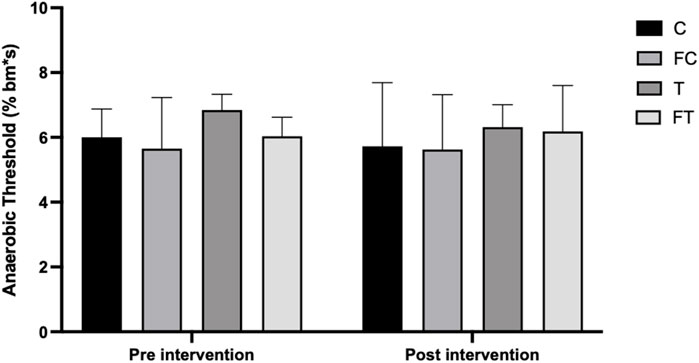
Figure 5. Pre and post anaerobic threshold of the groups. C (12) = Control; FC (11) = Fasting control; T (8) = Training; FT (8) = Fasting training. Legend: BM = Body Mass; s = seconds.
3.5 Heart weight
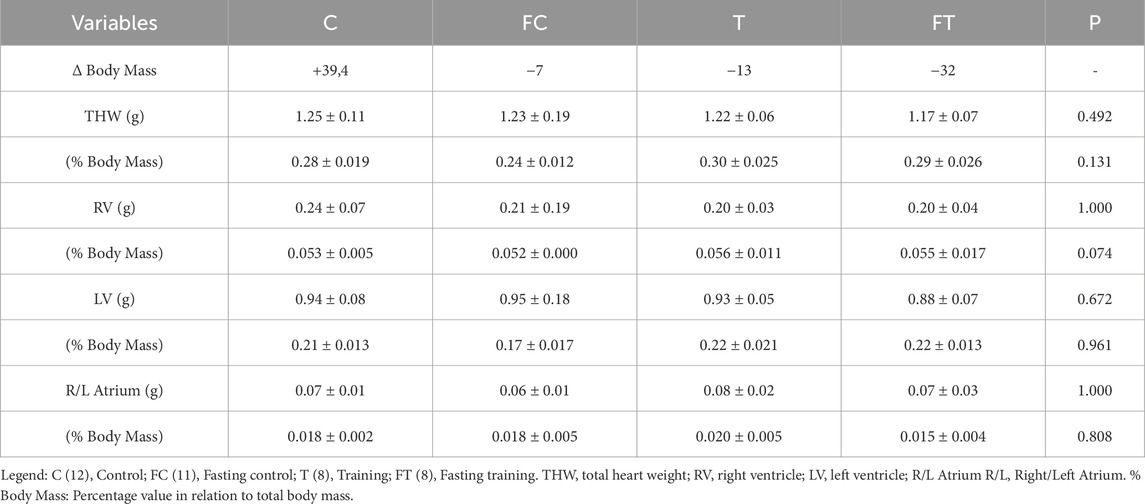
The results found related to the weight of the heart were not significant after performing the statistical test (Table 1).
3.6 Transverse cross-sectional area of cardiomyocytes
After observing the area of the cardiomyocytes of the different groups, the following medians and standard derivations were obtained: C (364.1 ± 197.2); FC (324.2 ± 150.1); T (277.3 ± 119.3); and FT (310.5 ± 148.8). A statistically significant decrease was found in the T group in relation to groups FT (p = 0.0179), FC (p = 0.0001) and C (p = <0.0001). In addition, there was also a significant decrease in the transverse cross-sectional area of cardiomyocytes in the FT group compared to group C (p = <0.001) (Figure 6).
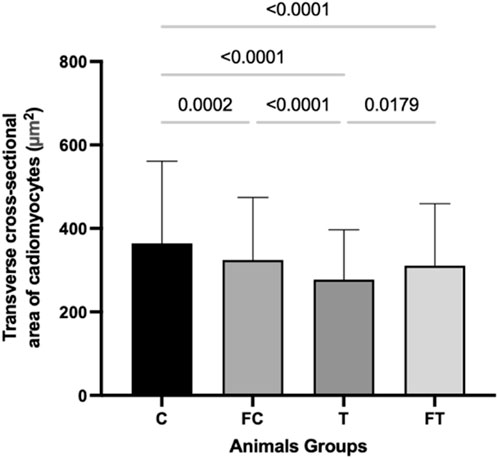
Figure 6. Comparison of transverse cross-sectional area of cardiomyocytes (µm2) between groups. C (12) = Control; FC (11) = Fasting control; T (8) = Training; FT (8) = Fasting training. Statistically significant difference of the two-way ANOVA test with Tukey’s post-test with 5% significance (p < 0.05).
3.7 Left ventricular lumen diameter
Post statistical analysis, the following results were found: C (27 ± 1.04); FC (9.18 ± 1.4); T (13.92 ± 3.91); and FT (15.14 ± 4.97). Although the trained groups presented higher values, no significant differences were verified in left ventricle lumen size and heart size (Figure 7).
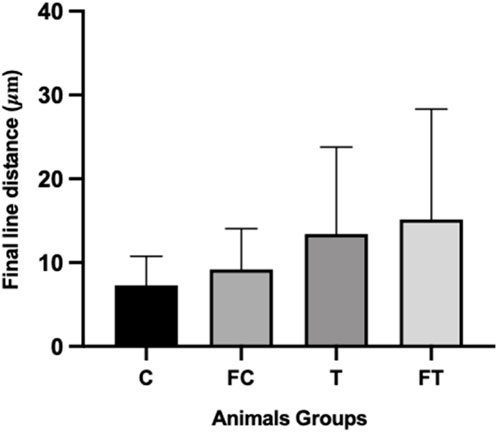
Figure 7. Final distance of left ventricle lumen contour of the different sample groups. C (12) = Control; FC (11) = Fasting control; T (8) = Training; FT (8) = Fasting training.
When performing a qualitative comparison of the cardiac histomorphology of the different sample groups, a visually apparent increase in the left ventricular lumen was observed in the trained groups (T and FT), compared to control groups (C and FC), although no statistical analysis was performed (Figure 8).

Figure 8. Histomorphology of cross-sections of the striated cardiac muscles of the different sample groups. C (12) = Control; FC (11) = Fasting control; T (8) = Training; FT (8) = Fasting training.
4 Discussion
The main finding of this study was that concurrent training promoted cardiac remodeling, characterized by a decrease in the cardiomyocyte diameter, when compared to the control group.
Interestingly, although increased intraventricular pressure and wall stress are generally expected to promote cardiomyocyte hypertrophy, since larger fibers contain more contractile elements arranged in parallel, allowing for greater force production (Rassier, 2017; Nakamura and Sadoshima, 2018), the results of the present study demonstrated a reduction in cardiomyocyte size. This apparent contradiction suggests that alternative adaptive mechanisms may be involved, particularly in the context of aerobic exercise. A plausible hypothesis is that the decrease in cardiomyocyte diameter represents physiological remodeling aimed at enhancing oxygen diffusion. In this regard, it is possible that smaller cells reduce the distance between capillaries and mitochondria, facilitating the oxygen transport needed to meet the increased metabolic demand during exercise (Kayar and Weiss, 1992; Poole and Mathieu-Costello, 1996). This interpretation aligns with the aerobic nature of the training protocol and may reflect a beneficial myocardial adaptation to optimize efficiency under conditions of elevated cardiac output, since in skeletal muscle, smaller fibers and greater capillary density reduce the diffusion distance, improving oxygen transport during exercise (Hellsten and Gliemann, 2024). However, further studies that evaluate the relationship between cardiomyocyte diameter, mitochondrial distribution, capillary distance, and oxygen delivery are needed, especially in the context of aerobic training, to validate this hypothesis.
When comparing the transverse cross-sectional area of the cardiomyocytes, an important sum of sides that reveals the outline of each cell, between the T and FT groups, a decrease was noted in the T group. This can be justified by the anti-apoptotic and anti-inflammatory protection that fasting offers cardiomyocytes (Ahmet et al., 2005). However, some studies have identified that high intensity exercise can prevent skeletal muscle atrophy and that fasting can cause atrophy in this type of muscle (Belavý et al., 2017; Masiero et al., 2009).
On the other hand, with regard to cardiac muscle tissue, it was observed that high-intensity training is related to left ventricular morphological alterations (Dores et al., 2018). In addition, studies show that insulin can attenuate the mechanism of atrophy and autophagy of genes related to cardiomyocytes, through metabolic pathways involving AKT protein phosphorylation and FOXO3a inactivation (Paula-Gomes et al., 2013). Thus, there is a hypothesis that training combined with fasting may have somehow influenced body response to insulin secretion, as there was a greater decrease in cardiomyocytes in the group that performed the isolated training. Studies involving this theme and that evaluate hormonal concentrations may contribute to the results of the current research. Another hypothesis is that a physiological cardiac adaptation to exercise may have occurred, leading to eccentric hypertrophy of the cardiomyocytes. In this case, there would be an increase in sarcomeres in relation to cell length without compromising cardiac functionality, which is expected (Nakamura and Sadoshima, 2018).
In line with the present study, other research has also shown that athletes who engage in high-intensity physical exercise may exhibit an increase in left ventricular lumen, as a physiological adaptation to the increased cardiac demand induced by exercise (Lang et al., 2006; Galderisi et al., 2015; D'Andrea et al., 2017). This type of cardiac remodeling is commonly observed in trained individuals and may represent a functional response to the volume and intensity of training. However, in some cases, this structural enlargement may be associated with greater ventricular wall stress during systole, and even the development of arrhythmias. Thus, it is hypothesized that concurrent training, due to its intensity, may induce structural adaptations in the heart, such as an increase in the left ventricular cavity, possibly accompanied by adjustments in cardiomyocyte size.
Although this variable is an indirect analysis of body adiposity, there was a significant decrease in values related to the Lee index in the T group in relation to the other groups; a decrease in the transverse cross-sectional area of cardiomyocytes of animals in the FT group, when compared with C and FC; and no significant alterations in anaerobic threshold values and heart weight. However, expansion of the cardiac chamber was observed in the trained animals (groups T and FT). This may be justified by the fact that the myocardium, in order to adapt to exercise and maintain hemodynamic homeostasis, adapts morphologically through ventricular dilation, especially the left ventricle.
In the present study, it was evidenced that the Lee Index of the FC group and of the trained groups decreased in relation to the control group. Thus, the present study corroborates the study by Machado and colleagues (2014), in which a decrease in the Lee index of animals practicing CT was found (Machado et al., 2014). This decrease may have occurred because physical training is able to decrease body fat and physical inactivity causes a decrease in muscle mass (Kang et al., 2009; Janssen et al., 2002). The Lee index was significantly lower in the FT group when compared to the T group. This can be explained by the significant decrease in body mass in the FT group, because the greater the fat loss, the lower the Lee index (Souza et al., 2001).
Unlike the Lee index, there were no alterations in the anaerobic threshold, or heart weight values between groups. A study involving different training models showed that training with continuous load promoted an increase in heart weight in relation to the control group and the group that performed the training with progressive loads (Rocha et al., 2008). Thus, there is a hypothesis that the volume of this training model is more suitable for this cardiac adaptation. On the other hand, high-intensity interval training, over a 6-week period, did not significantly alter heart variables or weight (Songstad et al., 2007).
Regarding the anaerobic threshold (AnT) evaluations, although the groups did not present a statistically significant difference between the pre and post intervention moments, a slight decrease in the AnT of the animals in the training group was noted compared to the control group. This fact may have occurred due to the increase in body fat in animals in the C and FC groups, which favors buoyancy, while muscle hypertrophy of the lower limbs, generated by training, ends up impairing the buoyancy of animals in the T group (Castoldi et al., 2016).
Regarding food consumption, both the animals that performed the concurrent training, as well as those that performed fasting coupled with training, presented significantly reduced feed intake, in relation to the control group. These results are in favor of the findings of Machado and colleagues (2014), who identified lower food consumption of animals that practiced concurrent training for 4 weeks, compared to the control group. It is noteworthy that, in the present study, the fasting control group presented a significant increase in food consumption compared to the other groups, which can be explained by the decrease that fasting causes on nocturnal leptin levels (Alzoghaibi et al., 2014).
It is important to acknowledge that the present study has limitations. Notably, it was not possible to perform functional cardiac assessments, such as echocardiography, hemodynamic analysis, or direct evaluation of myocardial contractility. The study also lacked molecular analyses that could help distinguish adaptive from maladaptive remodeling processes. These limitations restrict more comprehensive understanding of the physiological relevance of the observed morphological alterations. Despite these constraints, this study contributes to the literature by exploring the effects of concurrent training and intermittent fasting on the cardiac tissue of Wistar rats. Future studies should aim to include functional and molecular assessments, investigate different training modalities, and incorporate additional analyses, such as citrate synthase activity or protein expression, in order to better elucidate the underlying mechanisms and validate the structural findings reported herein.
In summary, it is concluded that the practice of concurrent training for a period of 4 weeks induced a decrease in the transverse cross-sectional area of cardiomyocytes in Wistar rats. Furthermore, when combined with intermittent fasting, concurrent training not only led to a reduction in transverse cross-sectional area of the cardiomyocytes, but also resulted in a decrease in body mass compared to the isolated concurrent training model.
Data availability statement
The raw data supporting the conclusions of this article will be made available by the authors, without undue reservation.
Ethics statement
The animal studies were approved by Ethics and Research Committee on Animal Use of the University of Western São Paulo. The studies were conducted in accordance with the local legislation and institutional requirements. Written informed consent was obtained from the owners for the participation of their animals in this study.
Author contributions
HM: Funding acquisition, Supervision, Writing – original draft, Writing – review and editing. MO: Funding acquisition, Validation, Writing – review and editing. LE: Conceptualization, Writing – review and editing. WR: Conceptualization, Validation, Writing – review and editing. PA: Methodology, Project administration, Writing – review and editing. GO: Software, Visualization, Writing – review and editing. EZ: Supervision, Visualization, Writing – original draft, Writing – review and editing. LV: Visualization, Writing – review and editing. FP: Funding acquisition, Methodology, Validation, Visualization, Writing – review and editing. RC: Investigation, Methodology, Resources, Supervision, Writing – original draft, Writing – review and editing.
Funding
The author(s) declare that financial support was received for the research and/or publication of this article. This work was funded by the “Programa Institucional de Bolsas de Iniciação Científica” from “Conselho Nacional de Desenvolvimento Científico e Tecnológico” (Number 135269/2019-9) and by the Fundação para o Desenvolvimento Médico e Hospitalar (Number 46.230.439/0001-01).
Acknowledgments
We thank the National Council for Scientific and Technological Development (CNPq) for supporting the current research.
Conflict of interest
The authors declare that the research was conducted in the absence of any commercial or financial relationships that could be construed as a potential conflict of interest.
Generative AI statement
The author(s) declare that no Generative AI was used in the creation of this manuscript.
Publisher’s note
All claims expressed in this article are solely those of the authors and do not necessarily represent those of their affiliated organizations, or those of the publisher, the editors and the reviewers. Any product that may be evaluated in this article, or claim that may be made by its manufacturer, is not guaranteed or endorsed by the publisher.
Supplementary material
The Supplementary Material for this article can be found online at: https://www.frontiersin.org/articles/10.3389/fphys.2025.1570624/full#supplementary-material
References
Ahmet I., Wan R., Mattson M. P., Lakatta E. G., Talan M. (2005). Cardioprotection by intermittent fasting in rats. Circulation 112 (20), 3115–3121. doi:10.1161/CIRCULATIONAHA.105.563817
Alzoghaibi M. A., Pandi-Perumal S. R., Sharif M. M., Bahammam A. S. (2014). Diurnal intermittent fasting during ramadan: the effects on leptin and ghrelin levels. PloS One 9 (3), e92214. doi:10.1371/journal.pone.0092214
Aoki M. S., Gomes R. V. (2005). Suplementação de creatina anula o efeito adverso do exercício de endurance sobre o subseqüente desempenho de força. Rev. Bras. Med. do Esporte 11 (2), 131–134. doi:10.1590/S1517-86922005000200007
Belavý D. L., Ohshima H., Rittweger J., Felsenberg D. (2017). High-intensity flywheel exercise and recovery of atrophy after 90 days bed-rest. BMJ open sport & Exerc. Med. 3 (1), e000196. doi:10.1136/bmjsem-2016-000196
Bell G. J., Syrotuik D., Martin T. P., Burnham R., Quinney H. A. (2000). Effect of concurrent strength and endurance training on skeletal muscle properties and hormone concentrations in humans. Eur. J. Appl. Physiology 81 (5), 418–427. doi:10.1007/s004210050063
Castoldi R. C., Camargo R. C. T., Magalhães A. J. B., Ozaki G. A. T., Kodama F. Y., Oikawa M. S., et al. (2013). Concurrent training effect on muscle fibers in wistar rats. Mot. Rev. Educ. Física 19 (4), 717–723. doi:10.1590/S1980-6574201300040000
Castoldi R. C., Coladello L. F., Koike T. E., Ozaki G. A. T., Magalhães A. J. B., Papoti M., et al. (2016). Efeitos da composição corporal na capacidade aeróbia de animais submetidos ao exercício de natação. Revista Brasileira de Cineantropometria & Desempenho Humano 18 (2), 136–142. doi:10.5007/1980-0037.2016v18n2p136
Chimin P., Araújo G. G., Manchado-Gobatto F. B., Gobatto C. A. (2009). Carga crítica durante treinamento contínuo e descontínuo na natação em ratos Wistar. Mot. Fundação Técnica Científica do Desporto 5 (4), 45–58. doi:10.6063/motricidade.5(4).169
Coffey V. G., John A. H. (2017). Concurrent exercise training: do opposites distract? J. physiology 595 (9), 2883–2896. doi:10.1113/JP272270
D'Andrea A., Formisano T., Riegler L., Scarafile R., America R., Martone F., et al. (2017). Acute and chronic response to exercise in athletes: the supernormal heart. Adv. Exp. Med. Biol. 999, 21–41. doi:10.1007/978-981-10-4307-9_2
Davis W. J., Wood D. T., Andrews R. G., Elkind L. M., Davis W. B. (2008). Concurrent training enhances athletes' cardiovascular and cardiorespiratory measures. J. Strength Cond. Res. 22 (5), 1503–1514. doi:10.1519/JSC.0b013e3181739f9f
De Luca R. R., Alexandre S. R., Marques T., Dudley G. A., Fleck S. J. (1987). Strength and endurance training: are they mutually exclusive? Sports Med. 4 (2), 79–85. doi:10.2165/00007256-198704020-00001
Dores H., Mendes L., Dinis P., Cardim N., Monge J. C., Santos J. F. (2018). Myocardial deformation and volume of exercise: a new overlap between pathology and athlete’s heart? Int. J. Cardiovasc. imaging 34 (12), 1869–1875. doi:10.1007/s10554-018-1412-3
Ferreira da Silva M., Pelúzio M. D. O. C., Amorim P. R., Lavorato V. N., Santos N. P., Bozi I. H., et al. (2011). Swimming training attenuates contractile dysfunction in diabetic rat cardiomyocytes. Arq. Bras. Cardiol. 97 (1), 33–39. doi:10.1590/s0066-782x2011005000055
Fyfe J. J., Bishop D. J., Stepto N. K. (2014). Interference between concurrent resistance and endurance exercise: molecular bases and the role of individual training variables. Sports Med. 44, 743–762. doi:10.1007/s40279-014-0162-1
Galderisi M., Cardim N., D’Andrea A., Bruder O., Cosyns B., Davin L., et al. (2015). The multi-modality cardiac imaging approach to the Athlete’s heart: an expert consensus of the european association of cardiovascular imaging. Eur. Heart J. Card. 16 (4), 353. doi:10.1093/ehjci/jeu323
Ghorayeb N., Batlouni M., Ibraim M. F. P., Giuseppe S. (2005). Left ventricular hypertrophy of athletes. Adaptative physiologic response of the heart. Arq. Bras. Cardiol. 85 (3), 191–197. doi:10.1590/s0066-782x2005001600008
Gimenes C., Gimenes R., Rosa C. M., Xavier N. P., Campos D. H., Fernandes A. A., et al. (2015). Low intensity physical exercise attenuates cardiac remodeling and myocardial oxidative stress and dysfunction in diabetic rats. J. Diabetes Res. 2015, 457848–10. doi:10.1155/2015/457848
Graudal N., Jürgens G., Baslund B., Alderman M. H. (2014). Compared with usual sodium intake, Low- and excessive-sodium diets are associated with increased mortality: a meta-analysis. Am. J. Hypertens. 27 (9), 1129–1137. doi:10.1093/ajh/hpu028
Grundy D. (2015). Principles and standards for reporting animal experiments in the journal of physiology and experimental physiology. Exp. Physiol. 100, 755–758. doi:10.1113/JP270818
Häkkinen A., Hannonen P., Nyman K., Lyyski T., Häkkinen K. (2003). Effects of concurrent strength and endurance training in women with early or longstanding rheumatoid arthritis: Comparison with healthy subjects. Arthritis Care & Res. 49 (6), 789–797. doi:10.1002/art.11466
Hellsten Y., Gliemann L. (2024). Peripheral limitations for performance: muscle capillarization. Scand. J. Med. Sci. Sports 34 (1), e14442–2024. doi:10.1111/sms.14442
Hickson R. C. (1980). Interference of strength development by simultaneously training for strength and endurance. Europ. J. Appl. Physiol. Occup. Physiol. 45, 255–263. doi:10.1007/BF00421333
Hill D. W. (1993). The critical power concept. A review. Sports Med. 16 (4), 237–254. doi:10.2165/00007256-199316040-00003
Hill J. O., Wyatt H. R., Peters J. C. (2012). Energy balance and obesity. Circulation 126 (1), 126–132. doi:10.1161/CIRCULATIONAHA.111.087213
Janssen I., Heymsfield S. B., Ross R. (2002). Low relative skeletal muscle mass (Sarcopenia) in older persons is associated with functional impairment and physical disability. J. Am. Geriatr. Soc. 50, 889–896. doi:10.1046/j.1532-5415.2002.50216.x
Junqueira A., Cicogna A. C., Engel L. E., Aldá M. A., De Tomasi I. C., Giuffrida R., et al. (2016). Effects of growth hormone on cardiac remodeling during resistance training in rats. Arq. Bras. Cardiol. 106 (1), 18–25. doi:10.5935/abc.20160003
Kang J., Rashti S. L., Tranchina C. P., Ratamess N. A., Faigenbaum A. D., Hoffman J. R. (2009). Effect of preceding resistance exercise on metabolism during subsequent aerobic session. Eur. J. Appl. Physiol. 107 (1), 43–50. doi:10.1007/s00421-009-1100-z
Kayar S. R., Weiss H. R. (1992). Diffusion distances, total capillary length and mitochondrial volume in pressure-overload myocardial hypertrophy. J. Mol. Cell Cardiol. 24 (10), 1155–1166. doi:10.1016/0022-2828(92)93179-n
Lang R. M., Bierig M., Devereux R. B., Flachskampf F. A., Foster E., Pellikka P. A., et al. (2006). Chamber quantification writing group; American society of echocardiography’s guidelines and standards committee; european association of echocardiography. Recommendations for chamber quantification: a report from the American society of Echocardiography’s guidelines and standards committee and the chamber quantification writing group, developed in conjuction with the european association of echocardiography, a branch of the european society of cardiology. Eur. J. Echocardiogr. 7 (2), 79–108. doi:10.1016/j.echo.2005.10.005
Machado J. H. L., Horie G. M., Castoldi R. C., Camargo R. C. T., Camargo Filho J. C. S. (2014). Efeito do Treinamento Concorrente na Composição Corporal e Massa Muscular de Ratos Wistar. Rev. Bras. Ciência Mov. 22 (3), 34–42. doi:10.18511/0103-1716/rbcm.v22n3p34-42
Manchado F. B., Gobatto C. A., Contarteze R. V. L., Papoti M., Mello M. A. R. (2006). Máxima fase estável de lactato é ergômetro-dependente em modelo experimental utilizando ratos. Rev. Bras. Med. do Esporte 12 (5), 259–262. doi:10.1590/S1517-86922006000500007
Marangon L., Gobato C. A., Mello M. A. R., Kokobun E. (2002). Utilization of an hyperbolic model for the determination of critical load in swimming rats. Appl. Physiology, Nutr. Metabolism 34 (5), 149.
Masiero E., Agatea L., Mammucari C., Blaauw B., Loro E., Komatsu M., et al. (2009). Autophagy is required to maintain muscle mass. Cell metab. 10 (6), 507–515. doi:10.1016/j.cmet.2009.10.008
Medeiros N. D. S., de Abreu F. G., Colato A. S., de Lemos L. S., Ramis T. R., Dorneles G. P., et al. (2015). Effects of concurrent training on oxidative stress and insulin resistance in Obese individuals. Oxidative Med. Cell. Longev. 0 (0), 697181–697186. doi:10.1155/2015/697181
Mrad S., Rejeb H., Abdallah J. B., Graiet H., Khelifa M. B., Abed A., et al. (2019). The impacts of ramadan intermittent fasting on oxidant/antioxidant stress biomarkers of stable chronic obstructive pulmonary disease Male patients. Am. J. Men’s Health 1 (3), 1–9. doi:10.1152/ajpcell.1993.264.5.C1180
Nakamura M., Sadoshima J. (2018). Mechanisms of physiological and pathological cardiac hypertrophy. Nat. Rev. Cardiol. 15 (7), 387–407. doi:10.1038/s41569-018-0007-y
Noh J., Wende A. R., Olsen C. D., Kim B., Bevins J., Zhu Y., et al. (2015). Phosphoinositide dependent protein kinase 1 is required for exercise-induced cardiac hypertrophy but not the associated mitochondrial adaptations. J. Mol. Cell. Cardiol. 89 (00), 297–305. doi:10.1016/j.yjmcc.2015.10.015
Novelli E. L. B., Diniz Y. S., Galhardi C. M., Ebaid G. M. X., Rodrigues H. G., Mani F., et al. (2007). Anthropometrical parameters and markers of obesity in rats. Lab. Anim. Ltd. 41 (1), 111–119. doi:10.1258/002367707779399518
Ozaki G. A. T., Camargo R. C. T., Koike T. E., Garcia A. T., Castoldi R. C., Camargo Filho J. C. S. (2015). Fractal analysis of skeletal muscle tissue of rats subjected to stretch injury. Int. J. Morphol. 33 (3), 908–913. doi:10.4067/S0717-95022015000300017
Ozaki G. A. T., Koike T. E., Castoldi R. C., Garçon A. A. B., Kodama F. Y., Watanabe A. Y., et al. (2014). Efeitos da remobilização por meio de exercício físico sobre a densidade óssea de ratos adultos e idosos. Motricidade 10 (3), 71–78. doi:10.6063/motricidade.10(3).2725
Parrinello G., Di Pasquale P., Licata G., Torres D., Giammanco M., Fasullo S., et al. (2009). Long-term effects of dietary sodium intake on cytokines and neurohormonal activation in patients with recently compensated congestive heart failure. J. Card. Fail 5, 864–873. doi:10.1016/j.cardfail.2009.06.002
Paterna S., Gaspare P., Fasullo S., Sarullo F. M., Di Pasquale P. (2008). Normalsodium diet compared with low-sodium diet in compensated congestive heart failure: is sodium an old enemy or a new friend? Clin. Sci. 114, 221–230. doi:10.1042/CS20070193
Paula-Gomes S., Gonçalves D. A. P., Baviera A. M., Zanon N. M., Navegantes L. C. C., Kettelhut I. C. (2013). Insulin suppresses atrophy-and autophagy-related genes in heart tissue and cardiomyocytes through AKT/FOXO signaling. Hormone metabolic Res. 45 (12), 849–855. doi:10.1055/s-0033-1347209
Ping Z., Zhang L., Cui Y., Chang Y., Jiang C., Meng Z., et al. (2015). The protective effects of salidroside from exhaustive exercise-induced heart injury by enhancing thePGC-1α–NRF1/NRF2Pathway and mitochondrial respiratory function in rats. Oxidative Med. Cell. Longev. 2015, 876825–876829. doi:10.1155/2015/876825
Pinheiro D. G., Oliveira F. L. G., Perrud S. N., Pereira S. O. L., Carvalho D. V. L., Oliveira A. M., et al. (2018). Cardiac analysis of rats subjected to chronic exposure of the herbicide dichlorophenoxyacetic acid (2,4-D). Colloq. Vitae 10 (3), 1–6. doi:10.5747/cv.2018.v10.n3.v236
Poole D. C., Mathieu-Costello O. (1996). Relationship between fiber capillarization and mitochondrial volume density in control and trained rat soleus and plantaris muscles. Microcirculation 3 (2), 175–186. doi:10.3109/10739689609148286
Quinn R. (2015). Comparing rat's to human's age: how old is my rat in people years? Nutrition 21 (6), 775–777. doi:10.1016/j.nut.2005.04.002
Rassier D. E. (2017). Sarcomere mechanics in striated muscles: from molecules to sarcomeres to cells. Am. J. Physiol. Cell Physiol. 313 (2), C134–C145. doi:10.1152/ajpcell.00050.2017
Rocha L. L. V., Maia M. A., Apolinário A. Q., Costa D. A., Pinto M. V. M., Póvoa H. C. C., et al. (2008). Avaliação da eficiência de programas de treinamento de resistência na indução de hipertroïfia cardíaca em ratos Wista. Fisioter. Bras. 9 (2), 106–111. doi:10.33233/fb.v9i2.1621
Saleh S. A., Elsharouni S. A., Cherian B., Mourou M. (2005). Effects of ramadan fasting on waist circumference, blood pressure, lipid profile, and blood sugar on a sample of healthy Kuwaiti men and women. Malays. J. Nutr. 11 (2), 143–150.
Schoenfeld B. J. (2010). The mechanisms of muscle hypertrophy and their application to resistance training. J. Strength Cond. Res. 24, 2857–2872. doi:10.1519/JSC.0b013e3181e840f3
Seo D. Y., Kwak H. B., Kim H. A., Park H. S., Heo J. W., Kim K. H., et al. (2019). Cardiac adaptation to exercise training in health and disease. Eur. J. Physiology 472, 155–168. doi:10.1007/s00424-019-02266-3
Sheikholeslami-Vatani D., Siahkouhian M., Hakimi M., Ali-Mohammadi M. (2015). The effect of concurrent training order on hormonal responses and body composition in Obese men. Sci. & Sports 30 (6), 335–341. doi:10.1016/j.scispo.2015.06.005
Songstad N. T., Kaspersen K. H. F., Hafstad A. D., Basnet P., Ytrehus K., Acharya G. (2007). Effects of high intensity interval training on pregnant rats, and the placenta, heart and liver of their fetuses. Plos One 10 (11), e0143095–15. doi:10.1371/journal.pone.0143095
Souza F. D., Marchesini J. B., Campos A. C. L., Malafaia O., Monteiro O. G., Ribeiro F. B., et al. (2001). Efeito da vagotomia troncular em ratos injetados na fase neonatal com glutamato monossódico: estudo biométrico. Acta Cir. Bras. 16 (1), 32–45. doi:10.1590/S0102-86502001000100006
Takeshima N., Rogers M. E., Islam M. M., Yamauchi T., Watanabe E., Okada A. (2004). Effect of concurrent aerobic and resistance circuit exercise training on fitness in older adults. Eur. J. Appl. Physiology 93 (1-2), 173–182. doi:10.1007/s00421-004-1193-3
Trager L. E., Lyons M., Kuznetsov A., Sheffield C., Roh K., Freeman R., et al. (2023). Beyond cardiomyocytes: cellular diversity in the heart's response to exercise. J. Sport Health Sci. 12 (4), 423–437. doi:10.1016/j.jshs.2022.12.011
Varady K. A., Roohk D. J., Loe Y. C., Mcevoy-Hein B. K., Hellerstein M. K. (2007). Effects of modified alternateday fasting regimens on adipocyte size, triglyceride metabolism, and plasma adiponectin levels in mice. J. Lipid Res. 48 (10), 2212–2219. doi:10.1194/jlr.M700223-JLR200
Keywords: cardiomyocyte, exercise, fasting, heart, aerobic, anaerobic
Citation: Marcelo HI, Okoshi MP, Engel LE, Rosa WdS, Aleixo PH, Ozaki GAT, Zanuto EAC, Vanderlei LCM, Pacagnelli FL and Castoldi RC (2025) Concurrent training and intermittent fasting reduce transverse cross-sectional area of cardiomyocytes and body mass in Wistar rats. Front. Physiol. 16:1570624. doi: 10.3389/fphys.2025.1570624
Received: 04 February 2025; Accepted: 17 July 2025;
Published: 30 July 2025.
Edited by:
Giuseppe D’Antona, University of Pavia, ItalyCopyright © 2025 Marcelo, Okoshi, Engel, Rosa, Aleixo, Ozaki, Zanuto, Vanderlei, Pacagnelli and Castoldi. This is an open-access article distributed under the terms of the Creative Commons Attribution License (CC BY). The use, distribution or reproduction in other forums is permitted, provided the original author(s) and the copyright owner(s) are credited and that the original publication in this journal is cited, in accordance with accepted academic practice. No use, distribution or reproduction is permitted which does not comply with these terms.
*Correspondence: Henrique Izaias Marcelo, aGVucmlxdWUubWFyY2Vsb0B1c3AuYnI=
 Henrique Izaias Marcelo
 Marina Politi Okoshi3
 Luiz Carlos Marques Vanderlei
 Francis Lopes Pacagnelli