 Elias Rapp
 Francesco Laterza
 Vincenzo Manzi
 Ferdinand Von Walden
 Daniele A. Cardinale
- 1Department of Physiology, Nutrition and Biomechanics, The Swedish School of Sport and Health Sciences GIH, Stockholm, Sweden
- 2Department of Education and Sport Sciences, Pegaso Open University, Naples, Italy
- 3Department of Neurosciences, Biomedicine and Movement Sciences, University of Verona, Verona, Italy
- 4Department of Women’s and Children’s Health, Karolinska Institutet, Stockholm, Sweden
- 5Department of Physiology and Pharmacology, Karolinska Institutet, Stockholm, Sweden
- 6The Swedish Sports Confederation (Riksidrottsförbundet), Stockholm, Sweden
Aim: This study aimed to investigate the determinants of running performance in a cross-country running race and examine whether running economy and biomechanics are affected. Moreover, we analyzed whether the magnitude of change in running economy (RE) is related to changes in biomechanics, performance, and fitness measures.
Method: Thirteen runners (12 male and 1 female), with an average 10 km personal best time of 36:46 ± 3:17 (min:s), participated in the 30 km cross-country race, Lidingöloppet. Assessments of submaximal and maximal running physiology, biomechanics, and anthropometry were conducted before and immediately after the race. A multiple linear regression model was applied to explain performance variance. Pearson’s correlation analyses examined the relationships between performance and pre-test variables, and between changes in running economy and both pre-test fitness measures and changes in biomechanics. Paired Student’s t-tests were used to compare pre- and post-race values.
Results: Performance was best explained using a model including oxygen uptake at lactate threshold (LT), fat utilization, and allometrically scaled running economy (R2 = 0.918, adjusted R2 = 0.887, F = 29.7, p < 0.01). Race performance also correlated with maximal oxygen uptake (VO2max, r = −0.776, p = 0.003), fat mass (r = 0.646, p = 0.032), and velocity at VO2max (vVO2max, r = −0.853, p < 0.01). The oxygen cost of running increased (201.8 ± 14 vs. 208.4 ± 9.3 mL kg−1·km−1; p = 0.041), whereas respiratory exchange ratio (0.91 ± 0.04 vs. 0.85 ± 0.05; p < 0.01) and body mass (69.2 ± 7.5 vs. 67.6 ± 7.7 kg; p < 0.01) decreased post-race. Energetic cost of running (0.997 ± 0.076 vs. 1.015 ± 0.052 kcal kg−1·km−1; p = 0.192) and all biomechanical measurements, including cadence, contact time, overstride, vertical displacement, and vertical force, were unaffected by the race. The magnitude of change in running economy was related only to pre-test running economy (r = −0.749; p = 0.003) but not to performance (r = −0.440; p = 0.132), other pre-test fitness measures, or any changes in biomechanics.
Conclusion: The best performance prediction model included oxygen uptake at estimated lactate threshold, fat utilization during submaximal running, and allometrically scaled running economy. Oxygen cost of running increased post-race, likely due to increased fat oxidation, despite decreased body mass. No changes in biomechanics were observed, and changes in running economy could not be explained by changes in biomechanics. Aerobic fitness, anthropometry, and performance were not associated with changes in running economy. Given the small and relatively homogeneous sample, findings should be considered exploratory, although they suggest that practitioners may benefit from targeting fat oxidation, oxygen uptake at the estimated lactate threshold, and running economy in training.
Introduction
Trail and off-road running races are typically held on undulating terrain with uneven surfaces, which may affect running mechanics and, consequently, physiological responses (Ehrström et al., 2018). Although many studies on long-distance running have focused on flat-ground performance—identifying maximum oxygen uptake (VO2max), the fraction of VO2max sustained during performance (fractional utilization, related to lactate and ventilatory thresholds), and running economy (RE) as key determinants (Bassett and Howley, 2000; Joyner and Coyle, 2008; Mclaughlin et al., 2010)—comparatively few investigations have explored performance determinants in off-road conditions, especially in races that are not extremely demanding in terms of elevation change, terrain, or duration.
The classical model of running performance appears less predictive for trail events conducted in hilly terrain (de Waal et al., 2021). In these settings, RE and variables related to fractional utilization generally do not predict performance as strongly as VO2max. For example, one study found that performance in a 27-km race (with a 1,400-m elevation gain) was best explained using VO2max, local muscle endurance (measured as a fatigue index in the knee extensor muscle through a test involving 40 consecutive maximal concentric contractions), and RE on a 10% slope (Ehrström et al., 2018). In another study, VO2max and the percentage of fat mass were the strongest predictors for performance in a 27-km event with a 1,700-m elevation gain (Alvero-Cruz et al., 2019). Similarly, in 40- and 55-km races starting at approximately 1,000 m altitude and involving 2,300–3,500 m of elevation gain, VO2max and fat substrate utilization at 10 km h−1 emerged as the strongest predictors (Pastor et al., 2022). VO2max and the peak running velocity achieved in the incremental test were also associated with performance, while RE was not (Coates et al., 2021). In a shorter-duration, sea-level 7-km trial with a 486-m elevation gain, performance was associated with VO2max, vertical uphill speed, lean mass, and body fat mass percentage (Björklund et al., 2019). Although the studies differ slightly in terms of the most relevant variables, they consistently highlight that RE does not predict performance, while VO2max remains a key parameter (Ehrström et al., 2018; Alvero-Cruz et al., 2019; Pastor et al., 2022; Coates et al., 2021). Only one study suggested that lactate threshold (LT) might also be important in XC running over 31 km, with a 550-m elevation gain (Scheer et al., 2019).
It should be noted that these studies typically assess physiological determinants such as RE in a non-fatigued state. Maintaining RE over time during a prolonged effort appears to be crucial for optimal performance, with fatigue resilience emerging as an additional determinant of endurance (Jones et al., 2021; Brueckner et al., 1991). Moreover, the ability to sustain a critical speed throughout long-distance running can differentiate athletes with similar pre-competition capabilities (Jones, 2024), emphasizing the need to evaluate performance under fatigue. However, findings regarding how RE responds to fatigue remain inconsistent across studies. Increases in oxygen uptake or energy cost at a given speed have been reported following short flat treadmill trials (approximately 12.5 min, 60 min, or even 24 h in length) (Candau et al., 1998; Hunter and Smith, 2007; Gimenez et al., 2013), flat road marathons (Brueckner et al., 1991; Kyröläinen et al., 2000; Nicol et al., 2007), and submaximal flat track running (Xu and Montgomery, 1995). Trail running also shows mixed results, with some studies reporting worsened RE after 40- and 55-km races with 2,300–3,500 m of elevation gain (Sabater Pastor et al., 2021) and after a 43-km uphill race with 3,000 m of elevation gain (Lazzer et al., 2015), while other investigations have noted decreased oxygen and energy costs after an ultramarathon of 330 km or no significant changes in several races longer than 65 km (Vernillo et al., 2017). These findings suggest that both the duration and the relative intensity of the race may affect the cost of running, with higher intensities leading to a larger increase in cost and longer races showing a smaller increase (Xu and Montgomery, 1995; Sabater Pastor et al., 2021). Notably, one study found a positive correlation between race speed in trail races of 40 km, 55 km, and over 100 km and the degree of change in RE. This result contradicts the notion that more proficient athletes exhibit less deterioration in RE (Sabater Pastor et al., 2021). Additionally, although individual variation in RE change appears to be influenced by the mechanical power of the lower limb—where higher power mitigates deterioration (Lazzer et al., 2015)—the role of aerobic fitness and potential biomechanical adjustments remains unclear as some studies report no relationship between changes in biomechanics and RE (Hunter and Smith, 2007; Kyröläinen et al., 2000; Nicol et al., 2007), whereas others indicate a connection (Lazzer et al., 2015; Vernillo et al., 2017).
Therefore, the purpose of this study was to examine the determinants of performance in a less “extreme” XC running race while investigating the effects of such a race on RE and running biomechanics. A further aim was to analyze the relationship between biomechanical changes and alterations in RE and assess potential links between the degree of RE change, race performance, and physiological fitness measures. To this end, the study focuses on the classical XC running race Lidingöloppet—a 30-km race with a 550-m elevation gain, run on gravel roads and grass on Lidingö island (Stockholm, Sweden) at sea level.
Methodology
Experimental overview
The research was conducted using a single-group repeated-measures, pre–post-test design, in which each participant was assessed before and after the intervention. All participants completed three test sessions: two test sessions within 2 weeks, in a rested state, prior to the Lidingöloppet race, and one post-test immediately after the race. The first test session, performed 5–10 days prior to Lidingöloppet, consisted of a treadmill running test to measure submaximal and maximal physiological and biomechanical parameters. The second test session consisted of an anthropometric assessment of body composition and was performed 3–7 days following the first test. Post-tests were conducted immediately after the race in a field-laboratory constructed at the finish line of the race. The Swedish Ethical Review Authority approved the study (2022-04035-01), and participants provided verbal and written consent after being informed of any potential risks associated with the experiments prior to participation. An overview of the experimental design is provided in Figure 1.
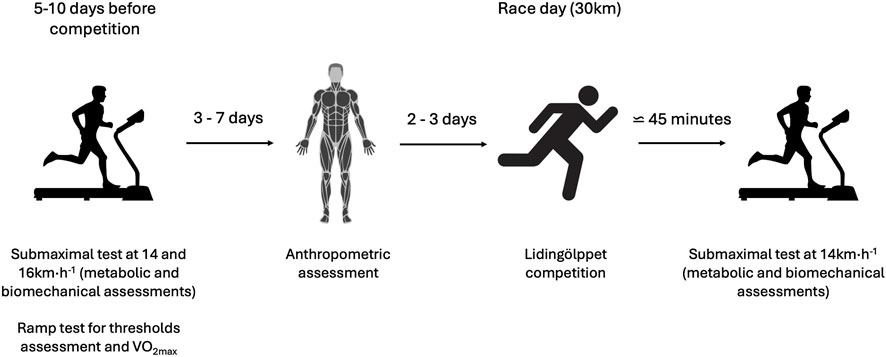
Figure 1. Timeline and flowchart of the experimental protocol.
Participants
Thirteen runners (twelve male and one female, average age 35 ± 4 years, 10 km PB = 36:46 ± 03:17 min:ss) were recruited for the study through digital advertising on social media, sports associations, and sports clubs. Participants were included if they were healthy individuals between 18 and 40 years old, willing to participate in the 30 km cross-country race “Lidingöloppet,” and able to verify their 10 km personal best. Individuals were excluded if they had any current or recent injury (within the past 6 months), were smokers, or had a 10 km personal best slower than 40 min, as verified through official race results or GPS files.
Data collection
Pre-tests
Participants arrived at the laboratory in a rested state, where their body mass and height were measured. Participants were instructed to follow the following standardization guidelines before testing: avoid any high-exertion training for 3 days prior to the test, consume the same pre-test meal for each session, refrain from eating during the 2 h preceding the test, and avoid caffeine for at least 3 h beforehand. The same pair of running shoes—relatively new and minimally worn—were to be used for both pre- and post-tests to minimize their impact on RE (Black et al., 2022). After these preparations, participants completed a treadmill running test to assess running biomechanics, the ventilatory marker of LT (Keir et al., 2022), i.e., θLT and respiratory compensation point (RCP), along with maximal physiological responses. The treadmill test started with a 5-min warm-up at a self-selected speed corresponding to a 10–12 rating of perceived exertion (RPE, on the Borg RPE scale) (Borg, 1990), followed by 3 min at a self-selected speed corresponding to 13–15 RPE, and finished with 3 min of rest. Then, a submaximal part began, consisting of two stages of 5 min running at 14 km h−1 and 16 km h−1 for measurements of cardiopulmonary variables using a metabolic-cart system equipped with a mixing chamber (COSMED, Quark CPET, Italy). During the submaximal phase, biomechanical variables (clarified in a later section) were also measured using a markerless motion capture system (MotionMetrix, 3D running gait, Sweden), a Stryd sensor (Stryd Powermeter; Stryd, Inc., Boulder, CO), and a built-in force transducer in the treadmill. Each 5-min section was followed by a 1-min break for the collection of a capillary blood sample for lactate measurement (H-la, EKF Diagnostics, Biosen C-line, United Kingdom) and assessing RPE (Borg, 1990). The test was terminated if the respiratory exchange ratio (RER) during the 5-min stage exceeded 1.0. Six athletes failed to complete the 16 km h−1 stage with an RER below 1.0, whereas all athletes completed the 14 km h−1 stage with an RER below 1.0 (Table 1). Following the two 5-min submaximal runs, there was a break consisting of 5 min of rest, followed by a maximal incremental exercise test. The maximal incremental exercise test started at 10 km h−1, and the speed was increased by 0.4 km h−1 every 30 s until task failure. RPE was collected shortly after task failure, and blood lactate was measured 1 and 3 min after task failure.
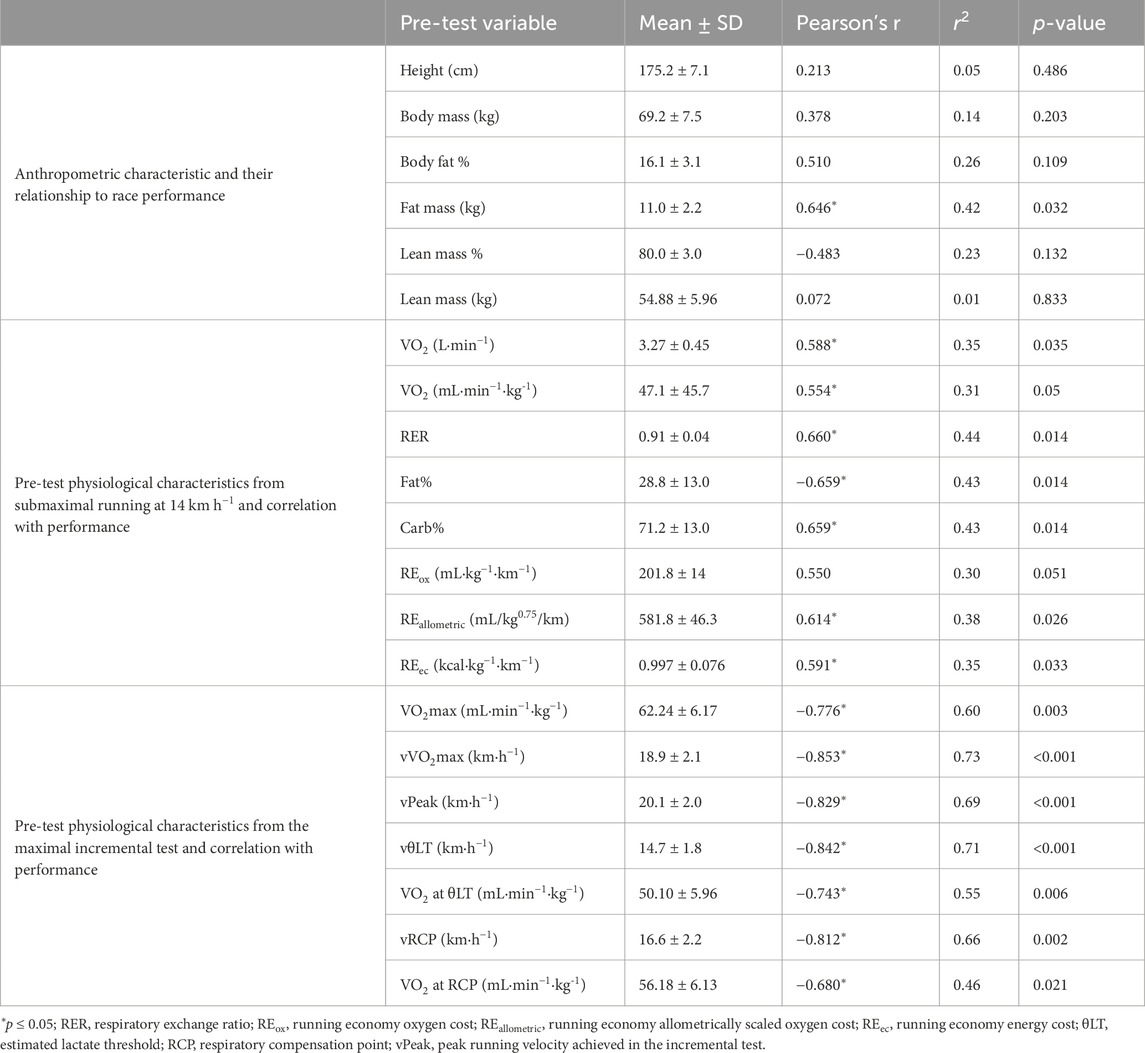
Table 1. Pre-test anthropometric and physiological data from both submaximal and maximal tests and results of correlation analysis between each variable and race time.
Before each treadmill test, the metabolic-cart system, the blood lactate measurement device, and the markerless motion capture system were calibrated according to the manufacturer’s guidelines.
At the second test session, body composition was measured via dual-energy x-ray absorptiometry (DEXA; Horizon Hologic, United States), including body fat %, body fat (kg), lean mass %, and lean mass (kg). The participants were instructed to fast for at least 5 h before the test and to refrain from alcohol and intensive training likely to cause excessive sweating on the preceding evening.
The race Lidingöloppet
Following the baseline assessment, the participants completed the XC running race Lidingöloppet—a 30-km race with a 550-m elevation gain, run on gravel roads and grass on Lidingö island (Stockholm, Sweden) at sea level. During the race, the runners aimed to perform maximally. Performance during the race was measured as the time to completion from the race start, based on the official chip time. The temperature during the race was ∼14 °C, with no rainfall.
Post-race test
At the finish line of the race, an in-field laboratory was set up inside a tent to ensure stable environmental conditions. Following race completion, the participants immediately entered the in-field laboratory for the measurement of body mass. Thereafter, the athletes completed 5-min of submaximal running at 14 km h−1. For the measurement of physiological and biomechanical variables, the same equipment and standardization procedures as in the pre-test were used. Only one athlete could be tested at a time; therefore, participants were tested in the order they finished the race. This resulted in an average waiting time of 45:15 ± 24:28 (min:ss) following race completion.
Data analysis
Physiological parameters
Submaximal values of RER, VO2 (mL·min−1·kg−1 and L·min−1), VE (L·min−1), and breathing frequency (L/min) were collected during the final minute of the 5-min stage at 14 km h−1, both pre- and post-test. Due to the low number of participants finishing the 16 km h−1 stage, no analysis was performed on these data. Thus, all presented analyses refer to the 14 km h−1 condition. To ensure valid measurements of submaximal variables during the 14 km h−1 runs, data from each participant were analyzed for steady state, i.e., an increase in VO2 of less than 100 mL min−1·kg−1 during the last minute of exercise (Fletcher et al., 2009). Based on metabolic gas exchange data, RE was expressed as either oxygen cost (REox) or energy cost in kilocalories (REec) per kilogram of body mass per kilometer at a given speed (REox, mL·kg−1·km−1 (Foster and Lucia, 2007) using the following equation:
RE, expressed as energy cost [REec, kcal·kg−1·km−1 (Fletcher et al., 2009)], was calculated from VO2 (L·min−1), RER, and the caloric equivalent of VO2 (Lusk, 1924), body mass (kg), and running speed (m/min) using the following equation:
RE, expressed as allometrically scaled oxygen cost [REallometric, mL·kg−0.75·km−1 (Svedenhag and Sjödin, 1994)], was calculated from running speed (m/min), VO2 (mL·min−1·kg−1), and allometrically scaled body mass using the following equation:
The specific scaling of body mass was arbitrarily chosen based on the research by Svedenhag and Sjödin (1994).
Furthermore, the energy cost from work of breathing (wb, kcal·kg−1·km−1) was calculated from VE (L·min−1), body mass (kg), and running speed (m/min) using the following equation adapted from Coast et al. (1993):
Moreover, the energetic cost of running (REec-wb) without wb was calculated by subtracting wb from REec, REec–wb.
During the maximal incremental test, VO2max was determined as the highest 30-s rolling average of VO2 [as previously applied, for example, by Jones et al. (2021)] for (mL·min−1·kg−1 and L·min−1). VO2max was defined as a plateau in VO2, despite increased workload. The plateau was visually determined. Moreover, the first speed to elicit VO2max was determined as vVO2max. VO2 and speed at θLT and RCP were determined during the maximal incremental test through analyses of VE, VCO2, ventilatory equivalent of VO2 (VE/VO2), and VCO2 (VE/VCO2), along with end-tidal pressure of O2 (PETO2) and CO2 (PETCO2), as described by Keir et al. (2022).
Biomechanical parameters
During the pre-and post-test, the mean values of the following variables, collected using MotionMetrix, were analyzed during steady-state running between 3:30 and 3:50 of the 5-min stages: cadence (spm), ground contact time (ms), overstride (cm), vertical displacement (cm), and vertical force (bw). No side differences were analyzed; rather, the mean between both sides was used. These variables were chosen based on the reliability and validity of the system, which are discussed in the next section.
During the submaximal test at 14 km h−1 on the pre-test day, each runner wore a Stryd sensor (Stryd Powermeter; Stryd, Inc., Boulder, CO), securely attached to the shoe, according to the manufacturer’s recommendations. The sensor streams data at 1 Hz and records variables including running power output, ground contact time, vertical oscillation, leg spring stiffness, cadence, and step length. According to Stryd’s technical specifications, no calibration was required beyond entering the runner’s basic anthropometrics, and the device’s reported measurement error is approximately 3%. Data extraction was accomplished following the manufacturer’s guidelines.
Statistical analyses
Data were tested for normality using the Shapiro–Wilk test. For analysis of variables related to performance, a hierarchical multiple linear regression model was used to explain variance in performance. Independent variables were added in order of their correlation to performance. To limit collinearity in the model, the variance inflation factor and tolerance of the regression model were calculated, with an upper limit of 2.0 for the variance inflation factor and a lower limit of 0.5 for tolerance. The regression model resulting in the highest R2 without collinearity between variables will be presented. Correlation analyses were performed between physiological variables, Stryd biomechanical variables (power output, ground contact time, vertical oscillation, leg spring stiffness, cadence, and step length), and performance using Pearson’s r. Differences between pre–post tests for physiological and biomechanical variables at 14 km h−1 were analyzed using paired sample t-tests for normally distributed variables and Wilcoxon rank for skewed variables. To study the relationship between changes in biomechanical variables and changes in RE, computed Δ variables (post−pre) for RE and biomechanics were analyzed using Pearson’s r correlation. If skewed, Spearman’s rho was used. To further investigate changes in RE, correlation analyses using Pearson’s r were performed between ΔRE and pre-test measures of VO2max (mL·min-1·kg-1), VO2 at θLT, REox, RER, and race time (s). Furthermore, correlations between ΔRE and ΔRER, ΔVE (L·min-1), Δwb (kcal·kg-1·km-1), and Δbody mass (kg) were analyzed. Statistical significance was set at p ≤ 0.05. Data are presented as the mean ± SD, if not stated otherwise. All analyses were performed using Jamovi (2.3.21, The Jamovi Project, 2022).
Results
Race performance and participant characteristics
The participants ran the race with an average speed of 13.8 ± 1.7 km h−1, resulting in an average finishing time of 02:12:20 ± 00:14:48 (hr:min:ss), 35% ± 15% slower than the winning time and with a race placement of 398 ± 342.
Pre-test anthropometric and physiological data from both submaximal and maximal tests, along with the results of the correlation analysis between each variable and race time, are presented in Table 1. The only anthropometric variable related to performance was body fat mass (kg) (r = 0.646; p = 0.032). All other anthropometric variables were not related to race performance. All the pre-test physiological variables considered were correlated with the race time under both conditions (submaximal and maximal), except for REox. No significant correlation was found between the race time and power output, ground contact time, vertical oscillation, leg spring stiffness, cadence, or step length measured using the Stryd device.
Race performance regression models
The multiple regression model, with the race time as a dependent variable resulting in the highest R2, is shown in Table 2. After controlling for collinearity, the best regression model included the independent variables Fat % at 14 km h-1 and VO2 at θLT and REallometric. This model explained 91.8% of the variance in the race time (R2 = 0.918, adjusted R2 = 0.887, F = 29.7, and p < 0.001). The results of the classical endurance performance model, including VO2max, REox, and VO2 at θLT, are presented in Table 3. Collinearity between variables existed, and R2 did not reach above 0.918 (R2 = 0.834, adjusted R2 = 0.772, F = 13.4, and p = 0.002). Although the studied group was fairly homogeneous, with most ages clustering between the early and late 30s and a CV of only ∼11%, additional analyses including age as a covariate showed that age was not a significant predictor of the race time (p = 0.566) and did not improve model fit (adjusted R2 = 0.877 vs. 0.887 without age).
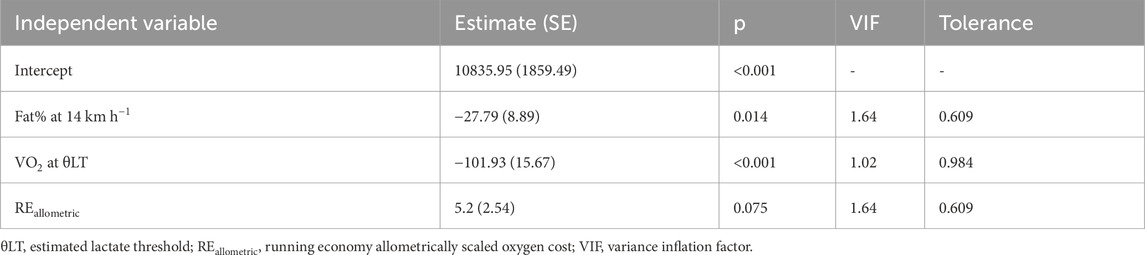
Table 2. Multiple regression analysis with race time (s) as a dependent variable.
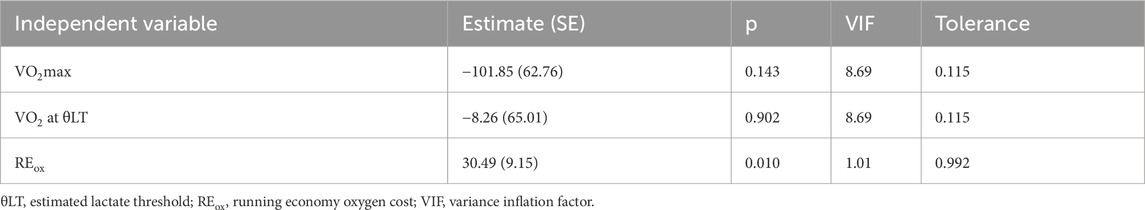
Table 3. Classical model of endurance performance with race time (s) as a dependent variable.
Post-race changes
All participants were tested after finishing the race. Physiological variables measured in both pre- and post-tests are presented in Table 4. Post-race VO2 relative to body mass (mL· min−1·kg−1) increased significantly by 3.4%, whereas absolute VO2 (L·min−1, −0.73%) and VE (4.55%) showed no significant changes. The race also negatively affected REox, which increased by 3.4% from pre- to post-race (Figure 2). However, when running economy was allometrically scaled (REallometric), it did not differ significantly (2.5%). Furthermore, REec also showed no significant difference between pre- and post-tests (2.1%). Substrate utilization (Figure 3) changed significantly post-race with decreased RER (−6.18%), increased Fat% (62.22%), and decreased Carb% (−25.32%).
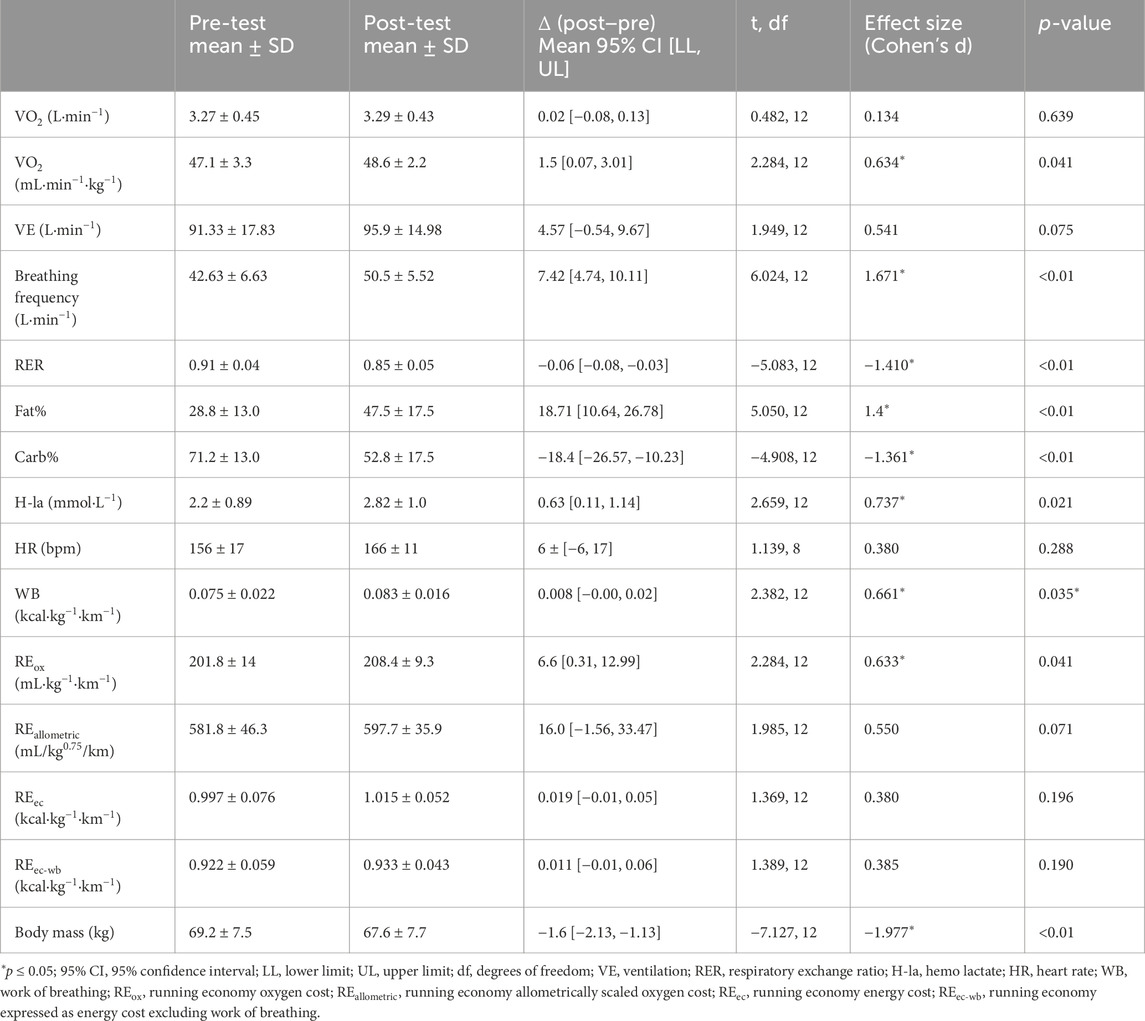
Table 4. Pre- and post-test physiological data from submaximal running at 14 kmh-1 and paired Student’s t-test results.
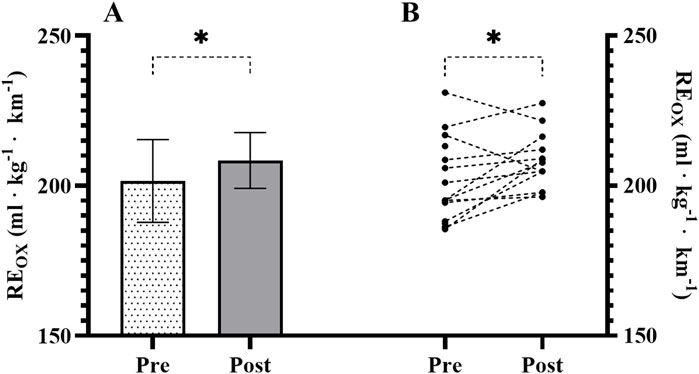
Figure 2. (A) Mean ± SD of running economy oxygen cost (REox) during the pre- and post-test at 14 kmh−1. (B) Individual values of REox at 14 kmh−1 during the pre- and post-test. *Significant difference (p ≤ 0.05) between the pre- and post-test.
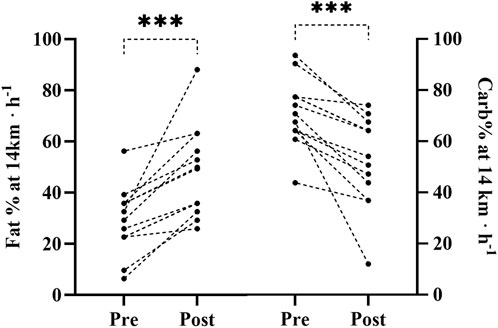
Figure 3. (Left panel) Participants’ individual fat utilization (fat%) at 14 kmh−1 in the pre-and post-test. (Right panel) Participants’ individual carbohydrate utilization (carb%) at 14 kmh−1 in the pre- and post-test. ***Significant difference (p ≤ 0.001) between the pre- and post-test for group mean.
None of the MotionMetrix biomechanical variables, such as cadence (1.2%), ground contact time (−2.3%), vertical displacement (−1%), overstride (−6.7%), or vertical force (2.6%), differed significantly between pre- and post-test for any variable (p > 0.05 for all the variables).
Relationship between changes in RE and other variables
To examine whether differences in waiting time between the end of the race and the post-test influenced changes in RE, a Pearson’s correlation analysis between ΔREox and waiting time was conducted. The results of this analysis showed that there was no significant correlation between ΔREox and waiting time (r = 0.039; p = 0.898).
Physiological and performance-related measurements
Participants’ pre-test measurements of VO2max (mL·min−1·kg−1; r = 0.181, p = 0.573), VO2 at θLT (r = 0.253, p = 0.428), and RER at 14 km h−1 (r = −0.178, p = 0.560) did not significantly relate to ΔREox. Furthermore, participants’ performance did not relate to ΔREox (r = −0.440, p = 0.132). Moreover, no significant relationships between ΔREox and ΔWB (r = 0.470, p = 0.105), ΔVE (r = 0.481, p = 0.096), Δbody mass (r = −0.493, p = 0.087), ΔH-la (r = 0.496, p = 0.084), and ΔRER (r = −0.388, p = 0.191) were observed.
Biomechanical measurements
No significant relationships were found between changes in biomechanical variables obtained from MotionMetrix and ΔREox. ΔCadence (r = 0.215, p = 0.480), Δ ground contact time (r = 0.234, p = 0.442), ΔOverstride (r = −0.250, p = 0.411), Δvertical force (r = −0.174, p = 0.569), and Δvertical displacement (r = −0.286, p = 0.343) did not relate to ΔREox.
Discussion
The main findings indicate that the optimal regression model (R2 = 0.918) included fat% at 14 km h−1, VO2 at θLT, and REallometric as the strongest predictors of performance. The race increased VO2 relative to body mass by 3.4% and REox by 3.4%. Post-race substrate utilization showed a 62.22% increase in fat oxidation and a 25.32% decrease in carbohydrate use, reducing RER by 6.18%. Biomechanical parameters did not change from pre- to post-race.
Race performance
Consistent with the classical endurance performance model (Bassett and Howley, 2000), performance in the 30 km XC Lidingöloppet correlated with VO2max, fractional utilization (speed and VO2 at θLT), speed at RCP, and RE (allometrically scaled oxygen and energy cost), but not RE without scaling. Additionally, race performance was correlated to substrate utilization at submaximal speed and fat mass. However, a regression with only VO2max, RE, and fractional utilization was limited by multicollinearity (R2 = 0.834), whereas a model including fat% at 14 km h−1, VO2 at θLT, and REallometric explained more variance (R2 = 0.918).
Although VO2max correlated strongly with performance, it was excluded from the optimal regression, somewhat contradicting previous trail-running studies (Ehrström et al., 2018; Alvero-Cruz et al., 2019; Pastor et al., 2022). As described by Costill et al. (1973), VO2max is not a good predictor among athletes with similar VO2max; in our cohort, values were homogeneous, except for two outliers. Thus, VO2max did not add explanatory power, despite its correlation. Likewise, vVO2max—linked to VO2max and RE and shown to predict trail-running performance (Alvero-Cruz et al., 2019; Coates et al., 2021; Sabater-Pastor et al., 2023)—also correlated with performance but was excluded. Nonetheless, VO2max and vVO2max remain important determinants of performance.
REallometric and REec correlated with performance and featured in our regression, contrasting earlier trail-running studies of long races (Ehrström et al., 2018; Alvero-Cruz et al., 2019; Pastor et al., 2022; Coates et al., 2021) and short races (Björklund et al., 2019). Those studies, except for that by Ehrström et al. (2018), who measured incline RE, assessed RE on level terrain despite greater elevation gain and technical demands, which may have obscured its impact. Longer races may prioritize fractional utilization and muscle preservation over RE (Millet et al., 2012; Pastor et al., 2022; Coates et al., 2021). Lidingöloppet’s moderate elevation and technicality resemble hilly road races, where RE strongly predicts marathon performance (Barnes and Kilding, 2015). Importantly, only allometrically scaled oxygen cost was related to performance, implying that VO2/body mass is not strictly proportional (Svedenhag, 1995) across a wide mass range (the body mass range in this investigation was 54–83.6 kg). Additionally, REec correlated with performance, underscoring the role of substrate utilization in RE (Fletcher et al., 2009).
θLT and RCP were strongly related to performance; VO2 at θLT featured in the optimal model, aligning with the study by Scheer et al. (2019). Conversely, VT did not predict performance in other trail races (Ehrström et al., 2018; Alvero-Cruz et al., 2019; Pastor et al., 2022), likely due to greater technical difficulty, elevation gain, and longer race duration, where low intensity diminishes the influence of VT (Millet et al., 2012). In Lidingöloppet’s shorter, less severe course, participants ran at 93% ± 5% of vθLT, indicating race pace and performance VO2 near vθLT and VO2 at θLT.
Substrate utilization correlated with performance; higher fat and lower carbohydrate oxidation at submaximal speeds likely spare glycogen. Pastor et al. (2022) also confirmed the importance of substrate utilization.
Fat mass was positively related to performance, consistent with previous studies (Alvero-Cruz et al., 2019; Pastor et al., 2022; Björklund et al., 2019). Higher fat mass increases gravitational work without enhancing capacity, explaining this relationship.
Parameters from the Stryd device (power output, ground contact time, vertical oscillation, leg spring stiffness, cadence, and step length) did not correlate with performance and were excluded, simplifying practical assessments by relying solely on metabolic-cart data.
Changes between pre- and post-race
REox significantly increased post-race, while absolute oxygen cost, REallometric, and REec remained unchanged.
These changes reflect increased fat reliance: a 62.22% increase in fat utilization demands more oxygen per energy yield, increasing REox, while REec remains stable. REallometric also remains constant due to non-linear body mass scaling. Post-race, H-la increased, RER decreased (reflecting altered substrate use), WB increased, and body mass decreased. VE and biomechanical parameters did not change, although biomechanical responses varied individually.
Absolute oxygen cost did not increase post-race; instead, reduced body mass elevated relative oxygen cost and REox. Allometric scaling neutralized this change, suggesting that body mass influences relative oxygen cost (Svedenhag, 1995), although ΔREox was not significantly related to Δbody mass, contradicting this notion. Maintaining the same absolute oxygen uptake while carrying less body mass inevitably increases REox (mL·kg-1·km-1), which can give the appearance of poorer running performance. At the same time, the substantially decreased RER implies greater fat utilization, a substrate that requires more oxygen per unit of energy produced than carbohydrate oxidation. This indicates that the post-race increase in REox may reflect the combined influence of body weight loss (via sweat and glycogen depletion) and a substrate shift toward greater fat oxidation once glycogen availability is reduced. However, ΔREox did not correlate with ΔRER. Other studies show large RER shifts with increased energetic cost (Kyröläinen et al., 2000; Nicol et al., 2007; Sabater Pastor et al., 2021), likely due to longer, more demanding races, although short trials also report notable oxygen cost increases (Candau et al., 1998). Variations in race elevation, duration, population, and test conditions likely explain discrepancies. The lack of significant VE change and absence of ΔREox correlations with ΔVE or ΔWB are in contrast with prior findings linking ΔVE and ΔRE (Thomas et al., 1995). Moreover, unchanged biomechanics and their non-association with ΔREox align with studies showing no relation between RE and biomechanical changes (Hunter and Smith, 2007; Kyröläinen et al., 2000; Nicol et al., 2007). Thus, REox changes might be likely driven by body mass loss (sweating and glycogen depletion) and decreased RER, requiring more oxygen for fat oxidation.
The performance level did not correlate with ΔREox, consistent with findings of Sabater Pastor et al. (2021), indicating that performance does not influence the degree of RE degradation in long trail races or XC races such as Lidingöloppet. This contradicts hypotheses linking RE deterioration and “fatigue resistance” (Jones et al., 2021; Brueckner et al., 1991), warranting further studies. Aerobic fitness, measured as VO2max, θLT, and submaximal running substrate use, also did not influence ΔREox. Pre-test REox negatively correlated with ΔREox: runners with higher initial oxygen cost changed the least, and only two with high pre-test REox reduced cost post-race (Figure 2). Notably, the top performer had the best pre-race REox but the largest worsening (+23%), suggesting that higher initial REox reserves allow a greater margin for decline. This variability underscores the importance of individual responsiveness post-race. This challenges the principle of Jone and s (2024) that the best resilience (least decline in critical power/velocity) confers an advantage. Although we did not consider the increase in energy cost at the individual critical speed or changes in critical power/velocity, our findings suggest that the subject with the best REox in a fresh state might still have an advantage despite the post-competition decline. However, the heterogeneity of our sample makes it difficult to draw definitive conclusions, and further investigation is warranted.
Limitations
There are some methodological limitations in the present study that need to be considered and discussed. The only speed tested that was common to all runners included in the study was 14 kmh-1; therefore, it was not possible to capture physiological and biomechanical responses post-race at different intensities. During the post-tests, waiting time before testing was minimized, resulting in a practical upper limit on the number of participants. On average, post-race measurements were delayed by 45:15 ± 24:28 (min:sec). This relatively long and inconsistent waiting period may have allowed participants to recover to varying degrees, potentially affecting the recorded physiological values and masking the true magnitude of immediate fatigue or metabolic disturbances. To avoid waiting times exceeding ∼45 min, approximately 15 participants could have been included, depending on the ranges in finishing times. With a sample size of 13, however, the statistical power to detect moderate effect sizes (Cohen’s d = 0.6) is low (0.512), and large effect sizes (Cohen’s d = 0.8) are required for sufficient power (>0.8). This suggests a likely large risk of type 2 errors in this study, indicating that moderate effect sizes do not reach significance due to the sample size. Accordingly, observed non-significant changes with moderate effect sizes should be interpreted with caution before conclusions are drawn. However, previous studies (Candau et al., 1998; Hunter and Smith, 2007; Kyröläinen et al., 2000; Nicol et al., 2007; Sabater Pastor et al., 2021; Lazzer et al., 2015) investigating the effect of fatigue caused by running on RE had sample sizes of 7–26. Another limitation in the sample size was that the group included one elite runner who was an outlier. When this elite runner is excluded, the regression model’s explained variance decreases from 91.8% to 84.9%, indicating that the presence of this outlier has an impact on our analyses. The group otherwise included runners ranging from amateur to well-trained, which limits the conclusions that can be drawn regarding the effects of fatigue in elite runners and the differences in responses between elite and well-trained athletes. However, the observed relationships did not differ much from previous research, and the participants’ results were logical and therefore included. It is also likely that adding more data points from a broader range of athletes would yield similar results. In our sample, there was only one female athlete; therefore, the results may not be representative of the female population, although the exclusion of this subject did not alter the variance explained by the model, which remained at 91.8%. Finally, the lack of a control group restricts the ability to establish causal relationships. Future studies should include larger sample sizes to increase statistical power, address sex differences, and explore the potential deterioration of running economy at different running speeds.
Conclusion
This study showed that performance in the 30 km XC-running race Lidingöloppet was related to RE, VO2max, vVO2max, θLT, along with RCP, substrate utilization, and fat mass. The best performance model could explain 91.8% of the variance in performance and included VO2 at θLT, fat% at 14 km h−1, and REallometric. Physiological variables included in the classical model of performance were also related to performance in XC running; however, exchanging VO2max with fat% at 14 km h−1 increased the model’s ability to explain variance in performance. This could practically be used by athletes and coaches to better direct training to improve performance in this type of XC race. The oxygen cost of running, REox, increased post-race, likely due to decreased body mass and increased fat oxidation. No biomechanical changes were observed post-race, and biomechanical changes could not explain increased REox. The participants’ aerobic fitness and performance level did not influence or correlate with the degree of change in REox.
Larger and more diverse studies are needed before generalizing practical applications. The present results, while important, should be considered exploratory due to methodological constraints such as the limited sample size and variability in post-race measurement timing. However, based on this study, it can be suggested that practitioners prioritize exercise and nutritional strategies that enhance fat oxidation at submaximal intensities and incorporate both plyometric and resistance training to improve allometrically scaled running economy—thereby elevating speed at the lactate threshold. Furthermore, since VO2 at θLT, fat% at 14 km h−1, and REallometric emerged as the strongest performance predictors, we recommend relying on metabolic-cart measurements rather than wearable-derived biomechanical metrics for XC performance assessment and training guidance. Future research is still needed to explain the observed changes in REox and why they differ inter-individually. Moreover, further research is required to determine whether the performance level is related to the deterioration in RE.
Data availability statement
The original contributions presented in the study are publicly available. This data can be found here: https://doi.org/10.6084/m9.figshare.29313851.v1.
Ethics statement
The studies involving humans were approved by The Swedish Ethical Review Authority 2022-04035-01. The studies were conducted in accordance with the local legislation and institutional requirements. The participants provided their written informed consent to participate in this study.
Author contributions
ER: Conceptualization, Data curation, Formal analysis, Investigation, Methodology, Software, Validation, Visualization, Writing – original draft, Writing – review and editing. FL: Data curation, Formal analysis, Methodology, Software, Validation, Visualization, Writing – original draft, Writing – review and editing. VM: Methodology, Resources, Supervision, Writing – original draft, Writing – review and editing. FV: Conceptualization, Funding acquisition, Investigation, Methodology, Project administration, Validation, Writing – original draft, Writing – review and editing. DC: Conceptualization, Formal analysis, Funding acquisition, Methodology, Project administration, Resources, Supervision, Validation, Writing – original draft, Writing – review and editing.
Funding
The author(s) declare that financial support was received for the research and/or publication of this article. This study was supported by The Swedish Sports Confederation. DAC was supported by The Swedish National Centre for Research in Sports (D2020-0010), and FW was supported by The Swedish Research Council (2022-01392) and The Swedish National Centre for Research in Sports (P2023-0137 and P2024-0102).
Acknowledgments
The authors would like to thank all the participants for their valuable contributions. The authors also extend their gratitude to Christoffer Sundqvist, Fredrik Gustavsson, TCS Lidingöloppet, and The Swedish Sports Confederation for their help during the experimental phase.
Conflict of interest
The authors declare that the research was conducted in the absence of any commercial or financial relationships that could be construed as a potential conflict of interest.
Generative AI statement
The author(s) declare that Generative AI was used in the creation of this manuscript. for grammar checks and in a few cases to improve clarity in English
Any alternative text (alt text) provided alongside figures in this article has been generated by Frontiers with the support of artificial intelligence and reasonable efforts have been made to ensure accuracy, including review by the authors wherever possible. If you identify any issues, please contact us.
Publisher’s note
All claims expressed in this article are solely those of the authors and do not necessarily represent those of their affiliated organizations, or those of the publisher, the editors and the reviewers. Any product that may be evaluated in this article, or claim that may be made by its manufacturer, is not guaranteed or endorsed by the publisher.
Abbreviations
H-la, Blood Lactate Concentration (mmol·L-1); PETCO2, End-Tidal Partial Pressure of Carbon Dioxide; PETO2, End-Tidal Partial Pressure of Oxygen; RCP, Respiratory Compensation Point; RER, Respiratory Exchange Ratio; RE, Running Economy; REallometric, Allometrically Scaled Running Economy expressed in mL·kg0.75·km-1; REec, Running Economy (energy cost) expressed in kcal·kg-1·km-1; REec-wb, Running Economy expressed as Energy Cost excluding Work of Breathing (kcal·kg-1·km-1); REox, Running Economy expressed as Oxygen Cost in mL·kg-1·km-1; VE, Ventilation; vRCP, Velocity at Respiratory Compensation Point; vVO2max, Velocity at VO2max; vθLT, Velocity at Estimated Lactate Threshold; wb, Work of Breathing (energy cost, kcal·kg-1·km-1); θLT, Estimated Lactate Threshold.
References
Alvero-Cruz J. R., Parent Mathias V., Garcia Romero J., Carrillo de Albornoz-Gil M., Benítez-Porres J., Ordoñez F. J., et al. (2019). Prediction of performance in a short trail running race: the role of body composition. Front. Physiol. 10, 1306. doi:10.3389/fphys.2019.01306
Barnes K. R., Kilding A. E. (2015). Running economy: measurement, norms, and determining factors. Sports Med. - Open 1 (1), 8. doi:10.1186/s40798-015-0007-y
Bassett D. R., Howley E. T. (2000). Limiting factors for maximum oxygen uptake and determinants of endurance performance. Med. Sci. Sports Exerc 70. doi:10.1097/00005768-200001000-00012
Björklund G., Swarén M., Born D. P., Stöggl T. (2019). Biomechanical adaptations and performance indicators in short trail running. Front. Physiol. 10, 506. doi:10.3389/fphys.2019.00506
Black M. I., Kranen S. H., Kadach S., Vanhatalo A., Winn B., Farina E. M., et al. (2022). Highly cushioned shoes improve running performance in both the absence and presence of muscle damage. Med. Sci. Sports Exerc 54 (4), 633–645. doi:10.1249/MSS.0000000000002832
Borg G. (1990). Psychophysical scaling with applications in physical work and the perception of exertion. Scand. J. Work Environ. Health 16, 55–58. doi:10.5271/sjweh.1815
Brueckner J. C., Atchou G., Capelli C., Duvallet A., Barrault D., Jousselin E., et al. (1991). The energy cost of running increases with the distance covered. Eur. J. Appl. Physiol. 62 (6), 385–389. doi:10.1007/BF00626607
Candau R., Belli A., Millet G. Y., Georges D., Barbier B., Rouillon J. D. (1998). Energy cost and running mechanics during a treadmill run to voluntary exhaustion in humans. Eur. J. Appl. Physiol. 77 (6), 479–485. doi:10.1007/s004210050363
Coast J. R., Rasmussen S. A., Krause K. M., O’Kroy J. A., Loy R. A., Rhodes J. (1993). Ventilatory work and oxygen consumption during exercise and hyperventilation. J. Appl. Physiol. 74 (2), 793–798. doi:10.1152/jappl.1993.74.2.793
Coates A. M., Berard J. A., King T. J., Burr J. F. (2021). Physiological determinants of ultramarathon trail-running performance. Int. J. Sports Physiol. Perform. 16 (10), 1454–1461. doi:10.1123/ijspp.2020-0766
Costill D. L., Thomason H., Roberts E. (1973). Fractional utilization of the aerobic capacity during distance running. Med. Sci. Sports 5 (4), 248–252. doi:10.1249/00005768-197300540-00007
de Waal S. J., Gomez-Ezeiza J., Venter R. E., Lamberts R. P. (2021). Physiological indicators of trail running performance: a systematic review. Int. J. Sports Physiol. Perform. 16 (3), 325–332. doi:10.1123/ijspp.2020-0812
Ehrström S., Tartaruga M. P., Easthope C. S., Brisswalter J., Morin J. B., Vercruyssen F. (2018). Short trail running race: beyond the classic model for endurance running performance. Med. Sci. Sports Exerc 50 (3), 580–588. doi:10.1249/MSS.0000000000001467
Fletcher J. R., Esau S. P., MacIntosh B. R. (2009). Economy of running: beyond the measurement of oxygen uptake. J. Appl. Physiol. 107 (6), 1918–1922. doi:10.1152/japplphysiol.00307.2009
Foster C., Lucia A. (2007). Running economy: the forgotten factor in elite performance. Sports Med. 37 (4), 316–319. doi:10.2165/00007256-200737040-00011
Gimenez P., Kerhervé H., Messonnier L. A., Féasson L., Millet G. Y. (2013). Changes in the energy cost of running during a 24-h treadmill exercise. Med. Sci. Sports Exerc 45 (9), 1807–1813. doi:10.1249/MSS.0b013e318292c0ec
Hunter I., Smith G. A. (2007). Preferred and optimal stride frequency, stiffness and economy: changes with fatigue during a 1-h high-intensity run. Eur. J. Appl. Physiol. 100 (6), 653–661. doi:10.1007/s00421-007-0456-1
Jones A. M. (2024). The fourth dimension: physiological resilience as an independent determinant of endurance exercise performance. J. Physiol. 602 (17), 4113–4128. doi:10.1113/JP284205
Jones A. M., Kirby B. S., Clark I. E., Rice H. M., Fulkerson E., Wylie L. J., et al. (2021). Physiological demands of running at 2-hour marathon race pace. J. Appl. Physiol. 130 (2), 369–379. doi:10.1152/japplphysiol.00647.2020
Joyner M. J., Coyle E. F. (2008). Endurance exercise performance: the physiology of champions. J. Physiol. 586 (1), 35–44. doi:10.1113/jphysiol.2007.143834
Keir D. A., Iannetta D., Mattioni Maturana F., Kowalchuk J. M., Murias J. M. (2022). Identification of non-invasive exercise thresholds: methods, strategies, and an online app. Sports Med. 52 (2), 237–255. doi:10.1007/s40279-021-01581-z
Kyröläinen H., Pullinen T., Candau R., Avela J., Huttunen P., Komi P. V. (2000). Effects of marathon running on running economy and kinematics. Eur. J. Appl. Physiol. 82 (4), 297–304. doi:10.1007/s004210000219
Lazzer S., Salvadego D., Taboga P., Rejc E., Giovanelli N., di Prampero P. E. (2015). Effects of the etna uphill ultramarathon on energy cost and mechanics of running. Int. J. Sports Physiol. Perform. 10 (2), 238–247. doi:10.1123/ijspp.2014-0057
Lusk G. (1924). Animal Calorimetry. Analysis of the oxidation of mixtures of carbohydrate and fat. A correction. J. Biol. Chem. 59, 41–42. doi:10.1016/s0021-9258(18)85293-0
Mclaughlin J. E., Howley E. T., Bassett D. R., Thompson D. L., Fitzhugh E. C. (2010). Test of the classic model for predicting endurance running performance. Med. Sci. Sports Exerc 42 (5), 991–997. doi:10.1249/MSS.0b013e3181c0669d
Millet G. Y., Hoffman M. D., Morin J. B. (2012). Sacrificing economy to improve running performance—a reality in the ultramarathon? J. Appl. Physiol. 113 (3), 507–509. doi:10.1152/japplphysiol.00016.2012
Nicol C., Komi P. V., Marconnet P. (2007). Effects of marathon fatigue on running kinematics and economy. Scand. J. Med. Sci. Sports 1 (4), 195–204. doi:10.1111/j.1600-0838.1991.tb00296.x
Pastor F. S., Besson T., Varesco G., Parent A., Fanget M., Koral J., et al. (2022). Performance determinants in trail-running races of different distances. Int. J. Sports Physiol. Perform. 17 (6), 844–851. doi:10.1123/ijspp.2021-0362
Sabater Pastor F., Varesco G., Besson T., Koral J., Feasson L., Millet G. Y. (2021). Degradation of energy cost with fatigue induced by trail running: effect of distance. Eur. J. Appl. Physiol. 121 (6), 1665–1675. doi:10.1007/s00421-021-04624-5
Sabater-Pastor F., Tomazin K., Millet G. P., Verney J., Féasson L., Millet G. Y. (2023). VO2max and velocity at VO2max play a role in ultradistance trail-running performance. Int. J. Sports Physiol. Perform. 18 (3), 300–305. doi:10.1123/ijspp.2022-0275
Scheer V., Vieluf S., Janssen T. I., Heitkamp H. (2019). Predicting competition performance in short trail running races with lactate thresholds. J. Hum. Kinet. 69 (1), 159–167. doi:10.2478/hukin-2019-0092
Svedenhag J. (1995). Maximal and submaximal oxygen uptake during running: how should body mass be accounted for? Scand. J. Med. Sci. Sports 5 (4), 175–180. doi:10.1111/j.1600-0838.1995.tb00033.x
Svedenhag J., Sjödin B. (1994). Body-mass-modified running economy and step length in elite male middle- and long-distance runners. Int. J. Sports Med. 15 (06), 305–310. doi:10.1055/s-2007-1021065
Thomas D., Fernhall B., Blanpied P., Stillwell K. (1995). Changes in running economy and mechanics during a submaximal 5-km run. J. Strength Cond. Res. 9 (3), 170–175. doi:10.1519/00124278-199508000-00009
Vernillo G., Millet G. P., Millet G. Y. (2017). Does the running economy really increase after ultra-marathons? Front. Physiol. 8, 783. doi:10.3389/fphys.2017.00783
Keywords: running economy, running, off-road running, physiological resilience, VO2max
Citation: Rapp E, Laterza F, Manzi V, Von Walden F and Cardinale DA (2025) The effect of XC-running race Lidingöloppet on determinants of performance. Front. Physiol. 16:1647810. doi: 10.3389/fphys.2025.1647810
Received: 16 June 2025; Accepted: 03 September 2025;
Published: 07 October 2025.
Edited by:
Yoshio Suzuki, Juntendo Daigaku - Sakura Campus, JapanReviewed by:
Ahmed Saleh, Al-Noor University College, IraqMohamed Twfeq Husaen Aga, University of Mosul, Iraq
Copyright © 2025 Rapp, Laterza, Manzi, Von Walden and Cardinale. This is an open-access article distributed under the terms of the Creative Commons Attribution License (CC BY). The use, distribution or reproduction in other forums is permitted, provided the original author(s) and the copyright owner(s) are credited and that the original publication in this journal is cited, in accordance with accepted academic practice. No use, distribution or reproduction is permitted which does not comply with these terms.
*Correspondence: Daniele A. Cardinale, ZGFuaWVsZS5jYXJkaW5hbGVAaG90bWFpbC5jb20=
†ORCID: Francesco Laterza, orcid.org/0009-0009-4038-273X; Vincenzo Manzi, orcid.org/0000-0002-0331-5417; Ferdinand Von Walden, orcid.org/0000-0003-1134-2252; Daniele A. Cardinale, orcid.org/0000-0002-8607-550X
‡These authors have contributed equally to this work