 Samineh Mesbah1
 Bonnie Legg Ditterline1,2
 Siqi Wang1,2
 Samuel Wu3
 Joseph Weir4Jill Wecht5
 Gail Forrest6Susan Harkema1,2,7
 Beatrice Ugiliweneza1,2,8*
- 1Kentucky Spinal Cord Injury Research Center, University of Louisville, Louisville, KY, United States
- 2Department of Neurosurgery, University of Louisville, Louisville, KY, United States
- 3Department of Biostatistics, CTSI Data Coordinating Center, University of Florida, Gainesville, FL, United States
- 4Department of Health, Sport, and Exercise Sciences, University of Kansas, Lawrence, KS, United States
- 5James J Peters VA Medical Center, Bronx, NY, United States
- 6Kessler Institute for Rehabilitation, West Orange, NJ, United States
- 7Frazier Rehab Institute, Louisville, KY, United States
- 8Department of Health Management and System Science, University of Louisville, Louisville, KY, United States
Profound dysfunction of the cardiovascular system occurs after spinal cord injury (SCI), which is a leading cause of mortality in this population. Most individuals with chronic SCI experience transient episodes of hypotensive and hypertensive blood pressure in response to daily life activities. There are currently limited tools available to evaluate the stability of blood pressure with respect to a reference range. The aim of this study was to develop a clinimetric toolset for accurately quantifying stability of the blood pressure measurements and taking into consideration the complex dynamics of blood pressure variability among individuals with SCI. The proposed toolset is based on distribution of the blood pressure data points within and outside of the clinically recommended range. This toolset consists of six outcome measures including 1) total deviation of the 90% of the blood pressure data points from the center of the target range (115 mmHg); 2) The area under the cumulative distribution curve starting from the percentage of blood pressure measurements within the range, and the percentage of values within symmetrically expanded boundary ranges, above and below the target range; 3) the slope of the cumulative distribution curve that is calculated by fitting an exponential cumulative distribution function and the natural logarithm of its rate parameter; 4) its x- and 5) y-axis intercepts; and 6) the fitting error. These outcome measures were validated using blood pressure measurements recorded during cardiovascular perturbation tests and prolonged monitoring period from individuals with chronic SCI and non-injured controls. The statistical analysis based on the effect size and intra-class correlation coefficient, demonstrated that the proposed outcome measures fulfill reliability, responsiveness and discrimination criteria. The novel methodology proposed in this study is reliable and effective for evaluating the stability of continuous blood pressure in individuals with chronic spinal cord injury.
Introduction
Spinal cord injury (SCI) leads to life-long autonomic cardiovascular dysfunction for which there is no adequate treatment (Teasell et al., 2000; Wecht et al., 2000; Wecht et al., 2003; Karlsson, 2006; Krassioukov, 2009; Wecht et al., 2013; Wecht et al., 2017; Biering-Sørensen et al., 2018; Wecht and Bauman, 2018; Wecht et al., 2020a). For the estimated millions of people living with SCI globally (Singh et al., 2014; Kumar et al., 2018), altered autonomic cardiovascular regulation leads to chronic arterial blood pressure instability (Hubli et al., 2015; Katzelnick et al., 2019) with variation between hypotension that can be exacerbated by orthostasis (e.g., position changes) and severe hypertension triggered by autonomic dysreflexia (Blackmer, 1997; Teasell et al., 2000; Wecht et al., 2003; Dolinak and Balraj, 2007; Krassioukov et al., 2009; Wecht et al., 2013; Zhu et al., 2013). Studies on individuals with chronic SCI have identified blood pressure instability as one of the determinants of cardiovascular morbidity and mortality, including a 4-fold increased stroke risk in the SCI population (Su and Miao, 2005; Jegede et al., 2010; Rothwell et al., 2010; Wu et al., 2012; Muntner et al., 2015; Piatt et al., 2016; Stevens et al., 2016; Parati et al., 2018; Wecht et al., 2018; Ditterline et al., 2020; Parati et al., 2020). Even in those without SCI, mounting evidence links blood pressure instability during orthostasis with poorer general physical and mental health (Wilkie et al., 1976; Wessely et al., 1990; Pilgrim et al., 1992; Rosengren et al., 1993; Barrett-Connor and Palinkas, 1994; Czajkowska et al., 2010; Vasudev et al., 2011; Regan et al., 2013; Briggs et al., 2016; Briggs et al., 2018; Shanbhag et al., 2018).
Recent studies have demonstrated spinal cord epidural stimulation (scES) can stabilize blood pressure toward a more normotensive range and alleviate symptoms of orthostatic hypotension when using cardiovascular-specific stimulation parameters (Harkema et al., 2018a; Aslan et al., 2018; Harkema et al., 2018b; West et al., 2018; Darrow et al., 2019). Acute use of cardiovascular specific scES in individuals with SCI that exhibit chronic hypotension can immediately increase blood pressure and maintain it within a target range of 110–120 mmHg (Harkema et al., 2018b). It is also able to acutely mitigate orthostatic stress and maintain blood pressure during a position change (Harkema et al., 2018c). It is suggested that long term use of scES may facilitate adaptive neuroplasticity to restore underlying autonomic nervous system defects: in individuals with SCI and profound cardiovascular dysregulation, use of daily cardiovascular-specific scES to stabilize blood pressure led to mitigation of orthostatic hypotension even without active scES, as well as restoration of cardiovascular autonomic reflexes (Harkema et al., 2018c; Legg Ditterline et al., 2021). Blood pressure stability generated by cardiovascular-specific scES is similar to that seen in non-injured individuals, and does not reflect the profound variability between blood pressure measurements typically observed in individuals with SCI.
Despite this, outcome measures of cardiovascular dysfunction that are both statistically and clinically relevant and can detect change in blood pressure and identify a relationship to a normative range are limited (Chen et al., 2010) and there is no comprehensive measure designed to accurately quantify the complex dynamic changes that occur during continuous blood pressure recordings in individuals experiencing cardiovascular dysfunction. In this study, we propose and validate a novel blood pressure stability toolset based on the cumulative distribution of data points within and outside of a normative range. This straightforward and intuitive method can comprehensively capture the complex and dynamic blood pressure variability that SCI population experience in their day-to-day life. The proposed framework provides a reliable toolset to accurately quantify effects of SCI on blood pressure instability, as well as provide a foundation for statistical comparison among SCI groups, e.g., in response to perturbation, or with and without interventions to stabilize blood pressure.
Materials and Methods
We used systolic blood pressure data from individuals with SCI as well as non-injured participants to evaluate stability of blood pressure in response to perturbation and over a prolonged period of time. Data from a passive sit-up test was obtained from three research centers: Kentucky Spinal Cord Injury Research Center (KSCIRC), James J Peters VA Medical Center (JJP), and Kessler Foundation (KF). Systolic blood pressure data recorded during a 70o head-up tilt maneuver, over 24 h, and over 6 h was obtained at KSCIRC.
Cardiovascular Perturbation Tests
Sit-Up Test
Individuals lay supine for 5 min (at JJP and KF) or 15 min (at KSCIRC) and then were passively moved to the seated position with hips and knees at 90o angle (Figures 1A,B) The participants remained in seated position for 5 min (at JJP and KF) or 15 min (at KSCIRC) or as long as they could tolerate without showing symptoms of presyncope. More details about this procedure is reported previously (Wang et al., 2020). In this study, we included the individuals with SCI that were identified in the previous study (Wang et al., 2020) as having a large drop in systolic blood pressure after being moved to sitting position. In total, blood pressure data from 45 individuals with SCI and 48 non-injured participants (with no known cardiovascular dysfunction) were used for this test.
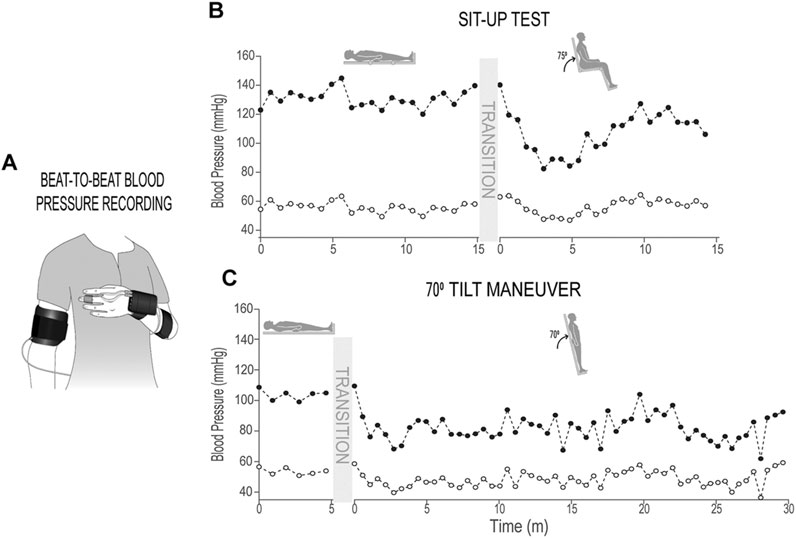
FIGURE 1. Sit-up test and 70o tilt maneuver. (A) Schematic of finger blood pressure (beat-to-beat) and brachial blood pressure (used for calibration) recording; (B) Systolic and diastolic blood pressure recordings (calibrated beat-to-beat data, down-sampled by 50 points) in supine and sitting positions during sit-up test from an individual with chronic SCI; (C) Systolic and diastolic blood pressure recordings (calibrated beat-to-beat data, down-sampled by 50 points) in supine and 70o tilt positions during 70o tilt maneuver from an individual with chronic SCI.
70o Tilt Test
Individuals lay supine for 5 min and once supported by restraints at the knees, hips, and chest the table would tilt upright to a 70o angle (Figures 1A,C); individuals would remain upright for 30 min or as long as tolerated without experiencing symptoms of pre-syncope. Blood pressure data of 34 individuals with SCI and nine non-injured participants (with no known cardiovascular dysfunction) were used for this test.
In both perturbation assessments, beat-by-beat systolic and diastolic blood pressure were obtained from finger plethysmography with intermittent brachial blood pressure measurements. Finger blood pressure measurements were calibrated to brachial blood pressure measurements offline using a 2-point calibration method (Wang et al., 2020).
Twenty Four-Hour Blood Pressure Monitoring
In addition to the two blood pressure perturbation tests described above, we tested the outcome measures of the proposed toolset with systolic blood pressure data measured over 24 h to ensure the toolset could evaluate what individuals experience daily. Blood pressure of individuals with SCI and Non-injured individuals was monitored over 24-h using an automatic brachial recording device. Blood pressure data was recorded every 15 min during awake time and every 30 min during overnight sleeping; the schedule was determined in advance by each individual. All participants kept a diary of their daily routines including the time they slept at night and the time they woke up in the morning. Participants with too many missing data points were excluded. In total, the data from 22 individuals with SCI and 12 Non-injured participants (with no known cardiovascular dysfunction) were used for the analysis.
Six-Hour Blood Pressure Recording With and Without scES Intervention
Blood pressure data were recorded every 10 or 15 min over 6 h of awake time using an automatic brachial recording device from two groups of individuals with SCI: one group with implanted scES targeting cardiovascular regulation (n = 9) and a control group without scES (n = 15). We used the blood pressure stability outcome measures that we developed in this study to see if these measures can accurately describe the cardiovascular effects of scES on blood pressure stability in individuals with SCI.
All research participants provided written informed consent about the procedures and publications of findings of the study which was approved by Institutional Review Boards at University of Louisville, James J Peters VA Medical Center, and Kessler Foundation.
Development of the Blood Pressure Stability Toolset
In the following sub-sections, details of the components of the proposed blood pressure stability toolset are described. This method describes the distribution of systolic blood pressure data with respect to the 110–120 mmHg reference range. The selection of this range as the target does not imply that all individuals should have a systolic blood pressure within 110–120 mmHg. Rather, it is a physiologically meaningful reference range because the participants’ pre-injury systolic blood pressure is unknown to us (i.e., their own “healthy” systolic blood pressure) and 110–120 mmHg is within the “healthy” systolic blood pressure range established by the American College of Cardiology (Whelton et al., 2017).
Total Deviation From Target
The first outcome measure is defined as the overall amount of deviation of the range of 90% of the blood pressure data points from the center of the target range (115 mmHg), called the Total deviation from target. We selected the data within the 5th (lower limit) and 95th (upper limit) percentiles, including 90% of all data points for analysis in order to remove effect of outliers. Total deviation from target is the sum of the deviation of measurements above 115 mmHg and deviation of data points below 115 mmHg (Figures 2A–C, Figures 3A,C). If all the blood pressure data points only fall on one side of the 115 mmHg line, Total deviation from target is calculated as the distance between 115 mmHg and the lower limit—if 90% of data points fall below 115 mmHg—or the upper limit—if 90% of data points fall above 115 mmHg only (Figure 3B). While this measure quantifies the distance of the farthest data points (i.e., those data points that are not considered outliers) from the center of the target range, it does not describe the distribution pattern of all the data points with respect to the target range.
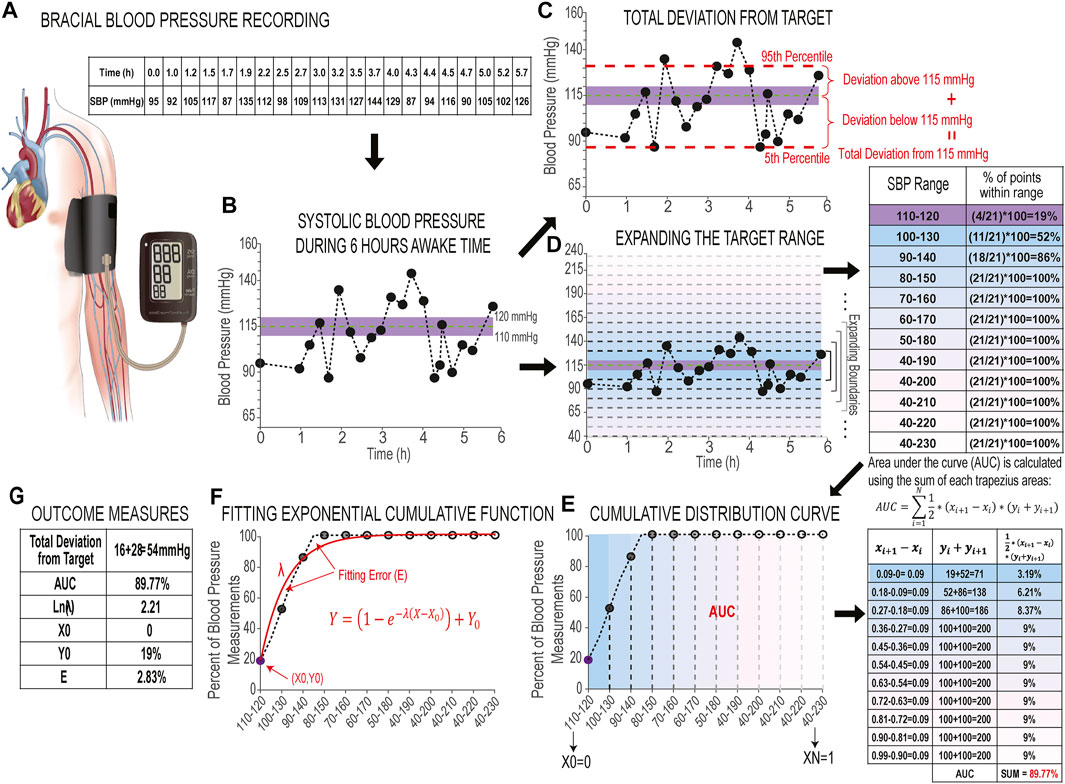
FIGURE 2. Development of blood pressure stability toolset. (A) Schematics of brachial blood pressure recording and the table of recorded systolic blood pressure measurements over 6 h of awake time in an individual with chronic SCI. (B) Plot of 6 h of systolic blood pressure measurements during awake time. The limits of the shaded area in purple illustrate the 110–120 mmHg target range, while the horizontal green line illustrates the center of the blood pressure target range (115 mmHg). (C) Plot of 6 h of systolic blood pressure (same as B) with red horizontal dashed lines to indicate the 5th (lower limit) and 95th (upper limit) percentiles of systolic blood pressure measurements. Two red vertical curly brackets indicate the distance between the upper and lower limits and 115 mmHg line (dashed green), which give the deviation above target line and deviation below target line. The sum of these two deviations gives us the Total deviation from target. (D) Plot of 6 h of systolic blood pressure (same as B and C) with Y-axis limits expanded to include 40–230 mmHg. Horizontal gradient gray dashed lines mark each expansion of the upper and lower boundaries beyond the target range with blue-pink gradient colored backgrounds (Expansion Rate is set at 10 mmHg); the adjacent table shows the percentage of data points within each expanded range, colored to correspond to the related range on the plot. (E) Cumulative distribution curve: the percentages of systolic blood pressure measurements are plotted against their corresponding ranges. The face-color of circle markers match the colors of the expanded ranges in D. The adjacent table shows the steps to calculate the area under the curve (AUC) from summation of trapezoidal areas between the curve and X-axis. (F) Fitting exponential cumulative function (shown in red) to the cumulative distribution curve: λ is the rate parameter that shows the slope, X0 and Y0 show the intercepts with X and Y-axis, and the fitting error (E) which is the difference between the cumulative curve and the exponential curve; and (G) Values of six outcome measures.
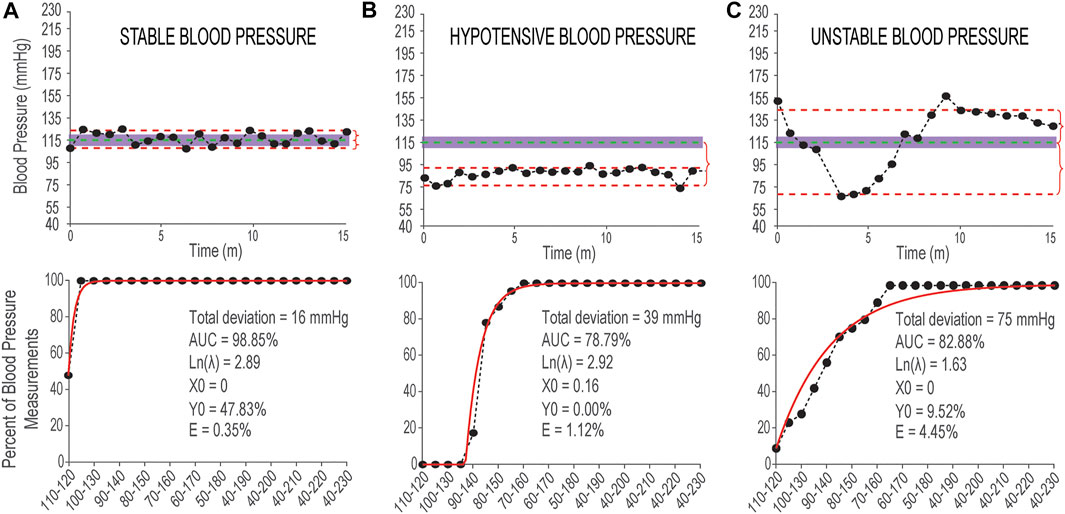
FIGURE 3. Examples of stable and unstable blood pressure during 15 min in sitting position. (A) Top panel: Systolic blood pressure measurements recorded from a non-injured individual with data points distributed within or close to the 110–120 mmHg range (shaded area). The vertical red curly brackets show the Deviation from 115 mmHg above and below. Bottom panel: Corresponding cumulative distribution curve (in back markers and line) and fitted exponential curve (in red) and the values of six outcome measures reported in black text; (B) Top panel: Systolic blood pressure measurements with hypotensive pattern recorded from an individual with SCI with data points distributed outside and below of the normative 110–120 mmHg range. Bottom panel: Corresponding cumulative distribution curve and fitted exponential curve and the values of six outcome measures; (C) Top panel: Systolic blood pressure measurements with unstable distribution pattern recorded from an individual with SCI with data points distributed above and below of the normative mmHg range. Bottom panel: Corresponding cumulative distribution curve and fitted exponential curve and the values of six outcome measures. Measurements in three top panels are recorded using finger beat-to-beat blood pressure recording during 15 min in sitting position and the data points are down-sampled by 50 points.
Cumulative Distribution Curve
In order to quantify the distribution pattern of blood pressure data points with respect to the target range, we developed a new methodology based on the theory of cumulative distribution function (Montgomery and Runger, 2018). In this method, a cumulative distribution curve is built based on the percentage of systolic blood pressure measurements within a given range, beginning with reference (110–120 mmHg), and then by expanding the upper and lower boundaries of this range by a given Expansion Rate (below); with each new expansion, the percentage of systolic blood pressure measurements within each range is calculated until the final range includes all possible systolic blood pressure values, i.e., 40–230 mmHg (Figures 2D,E). It should be noted that there is a floor-effect with this analysis: the lower range ends at 40 mmHg while the upper range expands to include the largest possible systolic blood pressure value (230 mmHg) to reflect the physiological limits of systolic blood pressure. The Expansion Rate is a parameter that defines the spatial resolution of the proposed method and it can be any values between 1 mmHg (highest spatial resolution) and 10 mmHg. For beat-to-beat blood pressure recordings where there are many data points, it is ideal to set the Expansion Rate to 1 mmHg so the method can capture all details about the distribution patterns of data points. For brachial blood pressure recordings (Figures 2A,B) where fewer data points are obtained, and especially when data points can be distributed widely throughout the range, the Expansion Rate can be set at 5 or 10 mmHg to achieve a smoother cumulative distribution curve. We have performed sensitivity analysis to test the effects of variable Expansion Rates on the outcome measures. This analysis and findings are described in the validation and results sections.
Area Under the Curve
From the cumulative distribution curve, we calculated the area under the curve (AUC): a percentage calculated as the sum of all trapezoidal areas contained between each pair of consecutive points on the curve and the x-axis (Figure 2E). To calculate the AUC, the x-axis is mapped linearly and equidistant between 0 and 1 based on the selected Expansion Rate. The calculation formula for AUC is as following:
Where N is the number of expansions;
Exponential Cumulative Distribution Function
In order to quantitatively describe the shape of the cumulative distribution curve, we fit an exponential cumulative distribution function (Figure 2F) to this curve with the following equation:
and from this function five outcome measures are calculated (described below). We used the exponential function for fitting to the cumulative curve because the fast-rising quality of this function can accurately model stable blood pressure data points that are either inside the target range or distributed very close it.
Natural Logarithm of the Rate Parameter
The rate parameter (
x- and y-Axis Intercepts
The intercepts of the fitted exponential function on the x- and y-axis (
It should be noted that although the rate parameter and
Maximum value of
Fitting Error
The Fitting error (
The combination of these six outcome measures can accurately describe various distribution patterns of systolic blood pressure recordings to quantify the differences between systolic blood pressure that is stable and within normative range (Figure 3A), stable but hypotensive (or hypertensive) systolic blood pressure (Figure 3B), and unstable systolic blood pressure with episodes of hypotension and hypertension (Figure 3C).
Validation of the Stability Measure
The proposed stability measures are validated based on the effect size (ES) to analyze discrimination (SCI vs NI) and responsiveness (supine vs sit/tilt for SCI), and based on the intra-class correlation coefficient (ICC) to evaluate the test-retest reliability (multiple assessments during screening in supine/awake for SCI).
Evaluating Discrimination
The discrimination refers to the ability of the measure to distinguish groups of individuals known to be different (ability to detect inter-group differences). In this case, it is important for this measure to distinguish between individuals who have cardiovascular dysfunction and those who do not. Discrimination is evaluated with effect size (Cohen, 1988; Lakens, 2013). The effect size is the standardized mean difference between the two groups. It quantifies the observed difference in terms of the pooled standard deviation. The effect size is classified as tiny (< 0.01), very small (0.01–0.2), small (0.2–05), medium (0.5–0.8), large (0.8–1.2), very large (1.2–2.0) and huge (> 2.0) (Cohen, 1988; Sawilowsky, 2009). An effect size of 0.5 or higher is considered relevant (Norman et al., 2003).
Evaluating Responsiveness
A measure is responsive if it can detect a change within individuals. During the sit-up and tilt maneuver, we want to know if the measure can detect changes in blood pressure when moving from one position (supine) to another (sit or tilt) or from awake to sleep during 24-h blood pressure monitoring. Responsiveness was also measured with the effect size of paired differences.
Evaluating Reliability
We have also measured the consistency of the outcome measures over time, i.e., the test-retest reliability. The test-retest reliability refers to the property of a measure to be statistically stable across time when the individuals do not experience any change. In this study, reliability (also called consistency) was evaluated using intra-class correlation coefficient (ICC) and standard error of measurement (SEM) (Weir, 2005; Koo and Li, 2016). The ICC is calculated using mixed models. Let
The SEM is also a clinically useful metric which allows practitioners to make inferences about individual changes in a test. SEM values are in the same units as the units of the variable being analyzed.
Figure 3 shows three examples of systolic blood pressure recordings with stable and two different unstable patterns and the corresponding outcome measures for each example.
Sensitivity Analysis: Effects of Expansion Rate, Averaging and Down-Sampling on Proposed Outcome Measures
In analysis of continuous blood pressure recordings obtained from the finger, it is routine to average the data points over a short period of time to remove clinically insignificant variabilities in the data that occur due to acquisition methodology. Down-sampling the data points is also sometimes used to remove excessive number of data points. The definition of the stability measures also involves the choice of the Expansion Rate parameter from the target range 110–120 mmHg. A sensitivity analysis was performed to evaluate whether the results obtained would change based on a different choice of these parameters.
Data Averaging
Analyzing systolic blood pressure data might use beat-to-beat data or averaging over a selected time interval. To evaluate any effect on the results found, multiple averaging schemas were performed (5, 10, 15, … , 60 s). Stability measures were calculated for each averaging and were compared to those obtained with no averaging (beat-to-beat data).
Down-Sampling
Down-sampling refers to a systematic choice of fewer points from the sample. The effect of picking every nth systolic blood pressure value on the obtained stability measure was evaluated by varying n from 2 (every other data point) to 20 (every 20th data point) and calculating the corresponding stability measures and comparing them to what is obtained when every measurement it considered.
Expansion Rate
To calculate the area under the curve, boundaries are expanded symmetrically from the target range 110–120 mmHg with equal jumps and the percentage of values falling in that range are calculated. The effects that the choice of R would have on the calculated outcome measures were evaluated by comparing the values found when R = 2, 3, 4, … 10 mmHg and comparing to R = 1 mmHg for beat-to-beat blood pressure recordings.
Statistical Analysis
Participants characteristics (demographics and injury details) were summarized using mean and standard deviation (SD) for continuous descriptors, and frequency count and percentage for categorical descriptors.
Discrimination was evaluated between groups known and statistically confirmed to have physiologically different responses, i.e., comparing non-injured vs individuals with SCI in the Sit Up Test, 70o tilt test, and 24 h BP Monitoring assessments. The measure used is effect size using Cohen’s d (for similar sample sizes) or Hedges’ g (for different sample sizes) formulas, calculated as the standardized difference between the mean values of the non-injured and SCI groups in sitting and tilt positions and during awake time from 24-h recordings divided by the Satterhwaite standard deviation. The systolic blood pressure data from Sit-up test and 70o Tilt test was used to evaluate responsiveness given the known and statistically confirmed changes that occur in individuals with SCI from supine to sitting or from supine to tilt. Paired changes, supine to sitting or tilt, were calculated for each individual and used to calculate the effect size (mean change divided by change standard deviation). The ICC value used to evaluate reliability was obtained from mixed models using data recorded in supine from SCI participants who have had two measurements during the screening phase without any changes to their day-to-day life and statistically confirmed no change in their cardiovascular function in between. These models included a random intercept for each participant. The variance of the residuals
The evaluation of the effects of averaging, down-sampling and Expansion Rate were performed using paired t-test of the stability measure values resulting from different scenarios described in Sensitivity analysis: Effects of expansion rate, averaging and down-sampling on proposed outcome measures.
All tests were 2-sided with a significance level of 0.05. Data preprocessing and analyses were performed in MATLAB R2017b and SAS 9.4 (SAS Inc., Cary, NC).
Results
Participants Characteristics
Sit up test: The combined Kessler, VA, and KSCIRC non-injured group of 48 individuals were 40 ± 13 years old and 67% were males. The combined SCI group (n = 45) was composed of 37 ± 11 years old individuals, 27 ± 12 years after injury, 84% males with 78% cervical injuries distributed across AIS A-D.
70° tilt test: The nine non-injured participants were 31 ± 11 years old at the time of experiments and 67% were males. The 24 SCI were 39 ± 11 years old, 75% males, 71% cervical injuries, 50% AIS A, 38% AIS B and 13% AIS C, and 11 ± 8 years after injury. A subset of SCI (n = 10, all cervical injuries) was used for test-retest reliability (80% male, 33 ± 13 years old, 7 ± 4 years post injury).
24-h blood pressure monitoring: Of the twelve non-injured individuals included in the 24-h blood pressure monitoring, 58% males and 27 ± 5 years old at the time of assessment. The individuals with SCI were divided into two groups: the screening group (SCI-G1: n = 13) and the scES implanted group (SCI-G2: n = 9); during the 24-h blood pressure monitoring assessment, stimulation remained OFF throughout the recording. The SCI-G1 were 54% males and 37 ± 14 years old at the time of assessment and 9 ± 6 years post injury. The SCI-G2 were 89% males and 31 ± 9 years old at the time of screening and 7 ± 4 years post injury. Only SCI-G1 data was used for discrimination and responsiveness analysis to avoid the interference of possible effects of scES on daily blood pressure in SCI-G2. A subgroup of SCI-G1 and all participants data in SCI-G2 were used for test-retest analysis (n = 15). The test-retest blood pressure recordings for SCI-G2 were performed with scES off and prior to scES-cardiovascular training, therefore no effects from the stimulation were expected.
6-h blood pressure monitoring for scES effects: Individuals with SCI without intervention for cardiovascular stability (n = 15) were 60% male, 36 ± 15 years old, 10 ± 9 years post injury; individuals with the scES implant targeting cardiovascular function (n = 9) were 78% male, 31 ± 6 years old, 7 ± 3 years post injury.
Validation of Blood Pressure Stability Outcome Measures
Results of the validation measures for the proposed blood pressure stability toolset, i.e., discrimination, responsiveness and test-retest analysis, are presented in Figures 4A–C and Table 1. The validation analysis demonstrates all proposed outcome measures for blood pressure stability are discriminatory, responsive, and test-retest reliable based on the ES for data recorded during sit-up test, 70o tilt test, and 24-h blood pressure monitoring. While all four outcome measures demonstrate the difference between non-injured and SCI (discrimination) and SCI in supine versus sitting positions (responsiveness), total deviation from 115 mmHg has the greatest ES values (statistically significant); this is expected, since this measure depends on the most (non-outlier) extreme blood pressure values that individuals experience during the perturbation tests and daily variability of their blood pressure. The AUC and integrated value for ln(λ), Y0, and X0 demonstrate the difference in variability of systolic blood pressure with respect to the target range between individuals with SCI and non-injured individuals and they both show statistically significant differences between the groups for discrimination and responsiveness. The Fitting Error demonstrates how closely the cumulative distribution curve follow an exponential cumulative curve and shows statistically significant differences between all groups for discrimination and responsiveness except the NI vs SCI 24-h comparison. In test-retest analysis performed on repeated blood pressure recordings (Figure 4C), all outcome measures demonstrate no significant difference between the two perturbation tests or 24-h tests across individuals with chronic SCI based on ICC and p-values with the exception of Fitting Error for SCI 24-h data day 1 vs day 2.
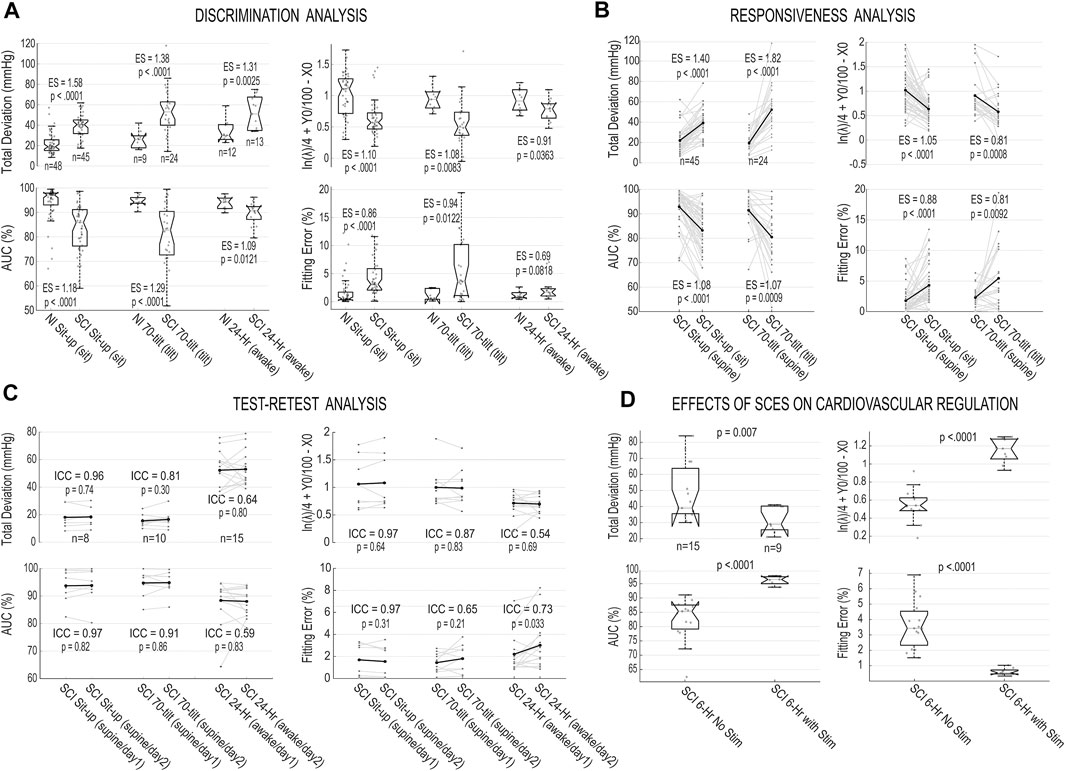
FIGURE 4. Validation analysis for the blood pressure stability outcomes and effects of spinal cord epidural stimulation (scES) on cardiovascular function. (A) Box plots and individual values of stability outcome measures for systolic blood pressure recorded from non-injured (NI) and SCI groups during sit-up test (during sitting position), 70o tilt manuever (during the tilt) and 24-h blood pressure monitoring (the awake period) for Total Deviation from 115 mmHg; Area under the cumulative distribution curve (AUC); integrated value for logarithm of rate parameter and x- and y-axis intercepts of fitted exponential function
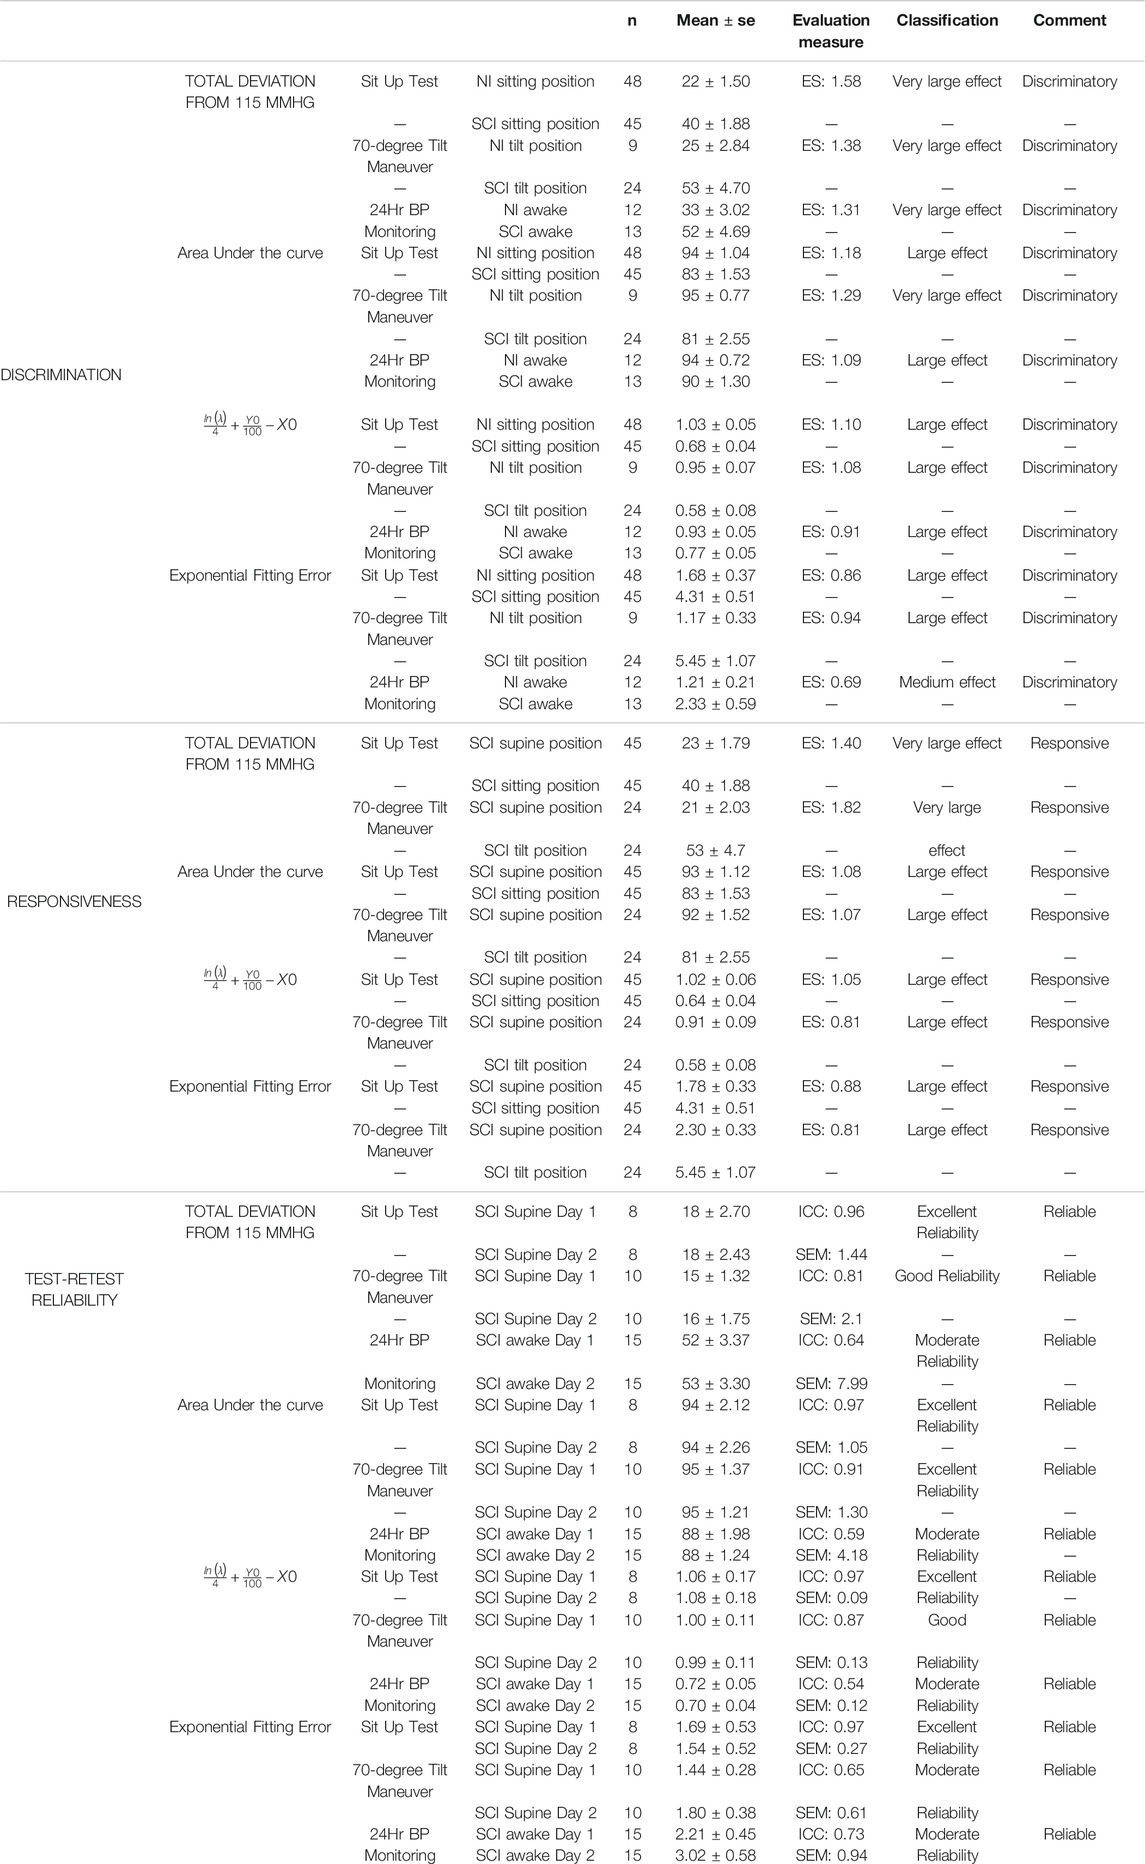
TABLE 1. Validation characteristics of the proposed blood pressure stability outcome measures. Reliability, discrimination and responsiveness were evaluated. Responsiveness and discrimination were evaluated using effect size (ES). ES is classified as tiny (< 0.01), very small (0.01–0.2), small (0.2–0.5), medium (0.5–0.8), large (0.8–1.2), very large (1.2–2.0) and huge (> 2.0). An ES of 0.5 or larger has been classified as relevant. Reliability was measure with the intraclass correlation coefficient (ICC) and standard error of measurement (SEM). ICC is classified as poor (0–0.25), fair (0.25–0.5), moderate (0.5–0.75), good (0.75–0.90) and excellent (> 0.90). A measure with ICC of 0.5 is considered to be reliable. Estimate values above this 0.5 represent a discriminatory, responsive or reliable measure. SE: Standard Error.
Table 1 presents the details of discrimination, responsiveness and test-retest analysis with the classification of the evaluation measures.
Effects of scES Intervention on Cardiovascular Function
The effects of scES stimulation on cardiovascular function between two groups of individuals with chronic SCI, one group with and the other group without a scES intervention that targets cardiovascular regulation are depicted in Figure 4D. The results are illustrating all outcome measures proposed in this study can demonstrate the improvement in the blood pressure stability in the presence of scES and the differences between the two groups are statistically significant.
Sensitivity Analysis
Results of sensitivity analysis on the choice of averaging, down-sampling and expansion rate are reported in Table 2. We found that averaging data has a significant effect on the resulting Stability Measure outcomes. Down-sampling did not have a significant effect on the AUC, total deviation from 115 mmHg, and SBP range containing 90% of the data for most choices. Down-sampling significantly altered the values obtained for the curve corresponding exponential function fitting error. The expansion rate had a significant effect on the AUC, and the fitting error but minor effect on the curve corresponding to exponential function parameter
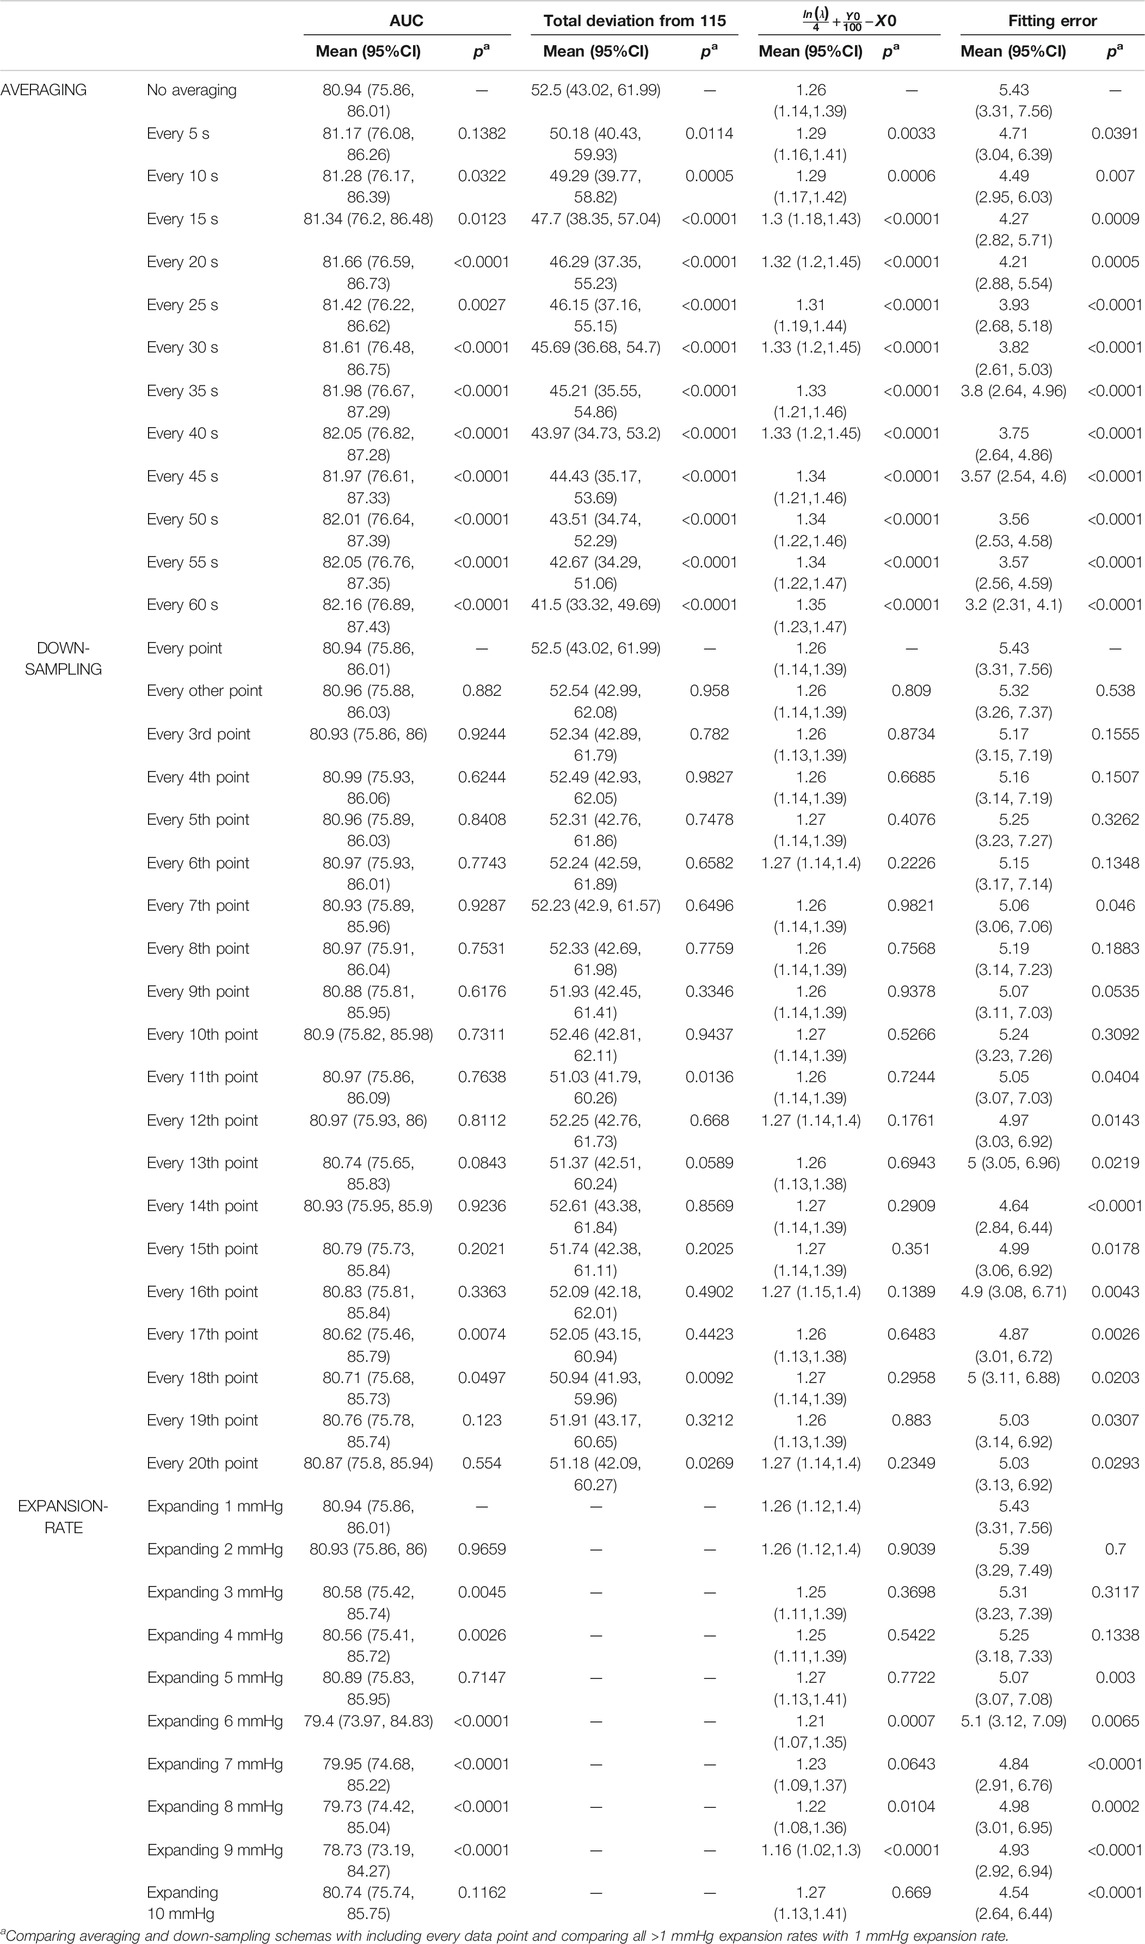
TABLE 2. Effect of averaging, down-sampling and expansion rate on the proposed stability measure outcomes.
Discussion
The aim of this study was to develop a blood pressure stability toolset based on the cumulative distribution of data points around a normative blood pressure range and validate it with respect to discrimination, responsiveness, and reliability properties. We demonstrated that outcome measures introduced in this study, i.e., the area under the curve, the natural log of rate parameter of the fitted exponential curve with x-axis and y-axis intercepts, the fitting error, and the total deviation from 115 mmHg are effective at quantifying blood pressure instability and deviation from clinically recommended values and that they are reliable, responsive, and discriminatory. Each of the proposed outcome measures reveal different aspects of blood pressure instability and they could be used for classification and categorizing various types of cardiovascular dysfunction.
Traditionally, summary statistics, mainly mean and standard deviation or median, quartiles and extremas (minimum and maximum), have been used to measure blood pressure over time and response to treatments (Penzel, 1995; di Rienzo et al., 1983). The average provides the central tendency of the data over the recording period and can be highly discriminatory between two different recordings when the mean of the measurements changes. However, it fails to provide insights regarding how far the measurements are from a clinically accepted “normal” range and whether observed changes between two recordings indicates the data are trending closer or further from normal. Such insights are critical in order to determine the clinical relevance of the change in distribution. Additionally, mean and standard deviation are highly sensitive to extreme occurrences—one aberrant blood pressure value can highly impact the accurate quantification of the blood pressure recorded over time as it skews the mean and inflates the standard deviation. Furthermore, in order to understand the distribution of the blood pressure over time, the median and both quartiles with extremas must be included. This makes it difficult to evaluate a group of individuals or use it as a study outcome measure.
For these reasons, it is more desirable to compare the blood pressure measurements to a clinically valid normative range. One option is to use the percentage of measurements falling within a pre-specified range. This method will fail to account for values that inevitably fall outside the range, and given the variability inherent to cardiovascular function and the additional variability that occurs as a consequence of SCI, clinically relevant measurements that fall remarkably close to the boundaries will be ignored. This problem could be overcome by expanding the range, however, there is no consensus on how wide the range should be. The Total deviation from a target line introduced herein addresses the boundary issue and provides an overall view of how far the measurements fall from a target. It is also demonstrated to be highly discriminatory between different recordings.
Despite this, Total deviation alone does not comprehensively describe the distribution of data points with respect to the target. The proposed methodology based on cumulative distribution of blood pressure measurements (Figure 2), overcomes this limitation. It accounts for values falling within and outside the range, can include extreme measures without being significantly influenced by them, and it provides a comprehensive model of the distribution of blood pressure measurements within a recording. In order to quantitatively describe the cumulative distribution curve (Figure 2B), we proposed five outcome measures: the area under the curve, which is directly calculated from the cumulative distribution curve; the rate parameter (log) of the fitted exponential curve and its x and y intercepts (and the sum of their normalized values
The sensitivity analysis demonstrated the commonly-used method of averaging blood pressure data points are detrimental to the blood pressure stability analysis: averaging essentially smooths the distribution and replaces actual recorded blood pressure values with artificial values calculated from smoothing. We recommend using all data points for the variability/stability analysis; if it is necessary to reduce the number of recordings, down-sampling is preferred as it has significantly less impact on the stability measure outcomes. Results presented in Table 2 demonstrate total deviation is more sensitive to down-sampling, followed by AUC; but outcome measures calculated from the exponential fitted curve
There are several considerations for which to account when using the proposed blood pressure stability toolset: this method is only sensitive to changes in blood pressure with respect to the target range, and it can accurately detect a clinically relevant improvement in the stability of the blood pressure. However, given two recordings—one of sustained hypertension and another of sustained hypotension equally distant from the target—outcome measures will not indicate a meaningful difference between them because, from the viewpoint of “blood pressure stability”, each recording represents far-from-stable blood pressure without improvement towards the target range. This method also does not account for the recording duration and it is recommended that when using these outcome measures, all measurements be of similar a duration. In applications where comparison between two recordings with different durations is unavoidable, the underlying presumption for these stability measures is the distribution pattern of data points in the shorter recording would have remained the same if it was recorded for longer—i.e., increasing the observation time will not itself lead to improvements in stability of the data. This methodology is also not concerned with providing specific time points of stable or unstable blood pressure within a recording and only provides a measure of stability over the entire recording. These outcome measures can be used in conjunction with visualization of raw blood pressure measurements over time, the cumulative distribution curves and the mean values, especially when uncertainty arises.
The proposed clinimetric toolset for blood pressure stability is particularly valuable in the application of using epidural stimulation for improving cardiovascular function in individuals with chronic SCI. Given that the pre-injury blood pressure range in this population is often unknown, a clinically recommended range is used as a target. Individuals that are implanted with scES participate in experiments in which the examiners search for optimum stimulation parameters (electrode contact combinations, polarity, intensity, pulse width, and frequency) that maintain blood pressure within or close to the target range (Harkema et al., 2018b). By systematically changing stimulation parameters while measuring beat-by-beat blood pressure and heart rate, examiners can identify optimum stimulation parameters that lead to immediate increases in blood pressure from a chronically hypotensive state. Cardiovascular-specific scES can be used to maintain blood pressure within a target range in the research setting as well as in the community with the use of a pre-programmed brachial blood pressure device, allowing individuals to participate in their activities of daily life while their blood pressure is safely monitored. The proposed outcome measures (Total deviation, AUC and the combination of slope and x- and y-axis intercepts) would allow the researchers to quantitatively assess the changes in blood pressure recordings with scES and how close they get to the target range. In addition to measuring the overall deviation of data points from the target, the proposed outcome measures based on the expanding boundaries of the target range would also provide detailed assessment of the distribution patterns of the blood pressure measurements. This toolset provides a valuable framework for researchers and clinicians in the field to assess the effectiveness of scES quantitatively.
Utilizing the proposed method for expanding the boundaries of a target range and generating the cumulative distribution curve and related outcome measures can be expanded to other blood pressure stabilizing interventions and longer blood pressure monitoring periods (i.e., 48- or 96-h) which will be the focus of future studies. The proposed method also has implications beyond blood pressure analysis. With the rapid development of wearable sensors (Zhang et al., 2019; Moonen et al., 2020) and point of care tests (Huang et al., 2019; Liu et al., 2020; Xu et al., 2020) as well as the advancements in neuromodulation and pharmaceutical interventions, the applications of modulating various biomarkers to fall into clinically accepted ranges are often desired. Therefore, the utilization of the methodology proposed in this study can be expanded into these other areas.
Conclusion
The blood pressure stability outcome measures proposed in this study are reliable, responsive, and discriminatory. They provide a solid ground for comprehensive and objective quantification of the effects of SCI on cardiovascular function, and can evaluate the effectiveness of clinical interventions that target blood pressure stability in individuals with chronic SCI.
Data Availability Statement
The raw data supporting the conclusion of this article will be made available by the authors, without undue reservation.
Ethics Statement
The studies involving human participants were reviewed and approved by Institutional Review Boards at University of Louisville, James J Peters VA Medical Center, and Kessler Foundation. The patients/participants provided their written informed consent to participate in this study.
Author Contributions
SM contributed in conceptualization, methodology, software, original draft preparation, review and editing. BD contributed in investigation, resources, data curation, review and editing. SWang contributed in resources and data curation. SWu contributed in conceptualization and methodology. JWeir contributed in formal analysis, review and editing. JWecht contributed in project administration, investigation and resources. GF contributed in project administration, investigation, resources and methodology. SH contributed in project administration, funding acquisition, supervision, investigation, resources, review and editing. BU contributed in methodology, formal analysis, validation, original draft preparation, review and editing.
Funding
This work was funded by Christopher and Dana Reeve Foundation #ES_BI-2017, Leona M. & Harry B. Helmsley Charitable Trust #2016PG-MED001, Craig H. Nielsen Foundation #ES2-CHN-2013, Kessler Foundation, Veterans Affairs Rehabilitation Research and Development Service Grant #B2020-C, Commonwealth of Kentucky Challenge for Excellence Trust Fund, UofL Health-University of Louisville Hospital and Medtronic Plc.
Conflict of Interest
The authors declare that the research was conducted in the absence of any commercial or financial relationships that could be construed as a potential conflict of interest.
Publisher’s Note
All claims expressed in this article are solely those of the authors and do not necessarily represent those of their affiliated organizations, or those of the publisher, the editors and the reviewers. Any product that may be evaluated in this article, or claim that may be made by its manufacturer, is not guaranteed or endorsed by the publisher.
Acknowledgments
We are indebted to our research participants for their courage, dedication, motivation, and perseverance that made these research findings possible. Drs. Douglas Stevens, Glen Hirsch, Darryl Kaelin, and Sarah Wagers provided medical oversight. Yukishia Austin, Lynn Robbins, and Kristen Johnson provided medical management. We would like to thank Dr Yangshen Chen for engineering leadership and Taylor Blades and Christie Ferreira for project management. Rebekah Morton, Matthew Green, Paul Criscola, Justin Vogt, Katie Pfost, Katelyn Brockman, Brittany Logdson, Ricky Seither, Kristin Benton, Dylan Pfost, and Joseph Carrico lead research interventions and provided support of research participants.
References
Aslan, S. C., Legg Ditterline, B. E., Park, M. C., Angeli, C. A., Rejc, E., Chen, Y., et al. (2018). Epidural Spinal Cord Stimulation of Lumbosacral Networks Modulates Arterial Blood Pressure in Individuals with Spinal Cord Injury-Induced Cardiovascular Deficits. Front. Physiol. 9, 565. doi:10.3389/fphys.2018.00565
Barrett-Connor, E., and Palinkas, L. A. (1994). Low Blood Pressure and Depression in Older Men: a Population Based Study. BMJ 308 (6926), 446–149. doi:10.1136/bmj.308.6926.446
Biering-Sørensen, F., Biering-Sørensen, T., Liu, N., Malmqvist, L., Wecht, J. M., and Krassioukov, A. (2018). Alterations in Cardiac Autonomic Control in Spinal Cord Injury. Auton. Neurosci. 209, 4–18. doi:10.1016/j.autneu.2017.02.004
Blackmer, J. (1997). Orthostatic Hypotension in Spinal Cord Injured Patients. J. spinal cord Med. 20 (2), 212–217. doi:10.1080/10790268.1997.11719471
Briggs, R., Kenny, R. A., and Kennelly, S. P. (2016). Systematic Review: The Association between Late Life Depression and Hypotension. J. Am. Med. Directors Assoc. 17 (12), 1076–1088. doi:10.1016/j.jamda.2016.06.027
Briggs, R., Carey, D., Kennelly, S. P., and Kenny, R. A. (2018). Longitudinal Association between Orthostatic Hypotension at 30 Seconds Post-Standing and Late-Life Depression. Hypertension 71 (5), 946–954. doi:10.1161/hypertensionaha.117.10542
Chen, J. C., Shernan, S. K., Dyke, C., and Aronson, S. (2010). A Target for Perioperative Blood Pressure during Cardiac Operations. Ann. Thorac. Surg. 89 (2), 672–673. doi:10.1016/j.athoracsur.2009.08.047
Cohen, J. (1988). Statistical Power Analysis for the Behavioral Sciences. 2nd ed. New York, NY: USA Lawrence Erilbaum Associates. doi:10.4324/9780203771587
Czajkowska, J., Ozhog, S., Smith, E., and Perlmuter, L. C. (2010). Cognition and Hopelessness in Association with Subsyndromal Orthostatic Hypotension. J. Gerontol. Ser. A: Biol. Sci. Med. Sci. 65A (8), 873–879. doi:10.1093/gerona/glq068
Darrow, D., Balser, D., Netoff, T. I., Krassioukov, A., Phillips, A., Parr, A., et al. (2019). Epidural Spinal Cord Stimulation Facilitates Immediate Restoration of Dormant Motor and Autonomic Supraspinal Pathways after Chronic Neurologically Complete Spinal Cord Injury. J. Neurotrauma 36 (15), 2325–2336. doi:10.1089/neu.2018.6006
di Rienzo, M., Grassi, G., Pedotti, A., and Mancia, G. (1983). Continuous vs Intermittent Blood Pressure Measurements in Estimating 24-hour Average Blood Pressure. Hypertension 5 (2), 264–269. doi:10.1161/01.hyp.5.2.264
Ditterline, B. L., Wade, S., Ugiliweneza, B., Singam, N. S. V., Harkema, S. J., Stoddard, M. F., et al. (2020). Systolic and Diastolic Function in Chronic Spinal Cord Injury. PLoS One 15 (7), e0236490. doi:10.1371/journal.pone.0236490
Dolinak, D., and Balraj, E. (2007). Autonomic Dysreflexia and Sudden Death in People with Traumatic Spinal Cord Injury. Am. J. Forensic Med. Pathol. 28 (2), 95–98. doi:10.1097/paf.0b013e3180600f99
Harkema, S. J., Legg Ditterline, B., Wang, S., Aslan, S., Angeli, C. A., Ovechkin, A., et al. (2018). Epidural Spinal Cord Stimulation Training and Sustained Recovery of Cardiovascular Function in Individuals with Chronic Cervical Spinal Cord Injury. JAMA Neurol. 75 (12), 1569–1571. doi:10.1001/jamaneurol.2018.2617
Harkema, S. J., Wang, S., Angeli, C. A., Chen, Y., Boayke, M., Ugiliweneza, B., et al. (2018). Normalization of Blood Pressure with Spinal Cord Epidural Stimulation after Severe Spinal Cord Injury. Front. Hum. Neurosci. 12, 83. doi:10.3389/fnhum.2018.00083
Harkema, S. J., Legg Ditterline, B., Wang, S., Aslan, S., Angeli, C. A., Ovechkin, A., et al. (2018). Epidural Spinal Cord Stimulation Training and Sustained Recovery of Cardiovascular Function in Individuals with Chronic Cervical Spinal Cord Injury. JAMA Neurol. 75 (12), 1569–1571. doi:10.1001/jamaneurol.2018.2617
Huang, L., Gurav, D. D., Wu, S., Xu, W., Vedarethinam, V., Yang, J., et al. (2019). A Multifunctional Platinum Nanoreactor for Point-of-Care Metabolic Analysis. Matter 1 (6), 1669–1680. doi:10.1016/j.matt.2019.08.014
Hubli, M., Gee, C. M., and Krassioukov, A. V. (2015). Refined Assessment of Blood Pressure Instability after Spinal Cord Injury. Am. J. Hypertens. 28 (2), 173–181. doi:10.1093/ajh/hpu122
Jegede, A. B., Rosado-Rivera, D., Bauman, W. A., Cardozo, C. P., Sano, M., Moyer, J. M., et al. (2010). Cognitive Performance in Hypotensive Persons with Spinal Cord Injury. Clin. Auton. Res. 20 (1), 3–9. doi:10.1007/s10286-009-0036-z
Karlsson, A.-K. (2006). Overview: Autonomic Dysfunction in Spinal Cord Injury: Clinical Presentation of Symptoms and Signs. Prog. Brain Res. 152, 1–8. doi:10.1016/s0079-6123(05)52034-x
Katzelnick, C. G., Weir, J. P., Jones, A., Galea, M., Dyson-Hudson, T. A., Kirshblum, S. C., et al. (2019). Blood Pressure Instability in Persons with SCI: Evidence from a 30-Day Home Monitoring Observation. Am. J. Hypertens. 32 (10), 938–944. doi:10.1093/ajh/hpz089
Koo, T. K., and Li, M. Y. (2016). A Guideline of Selecting and Reporting Intraclass Correlation Coefficients for Reliability Research. J. Chiropr. Med. 15 (2), 155–163. doi:10.1016/j.jcm.2016.02.012
Krassioukov, A., Eng, J. J., Warburton, D. E., and Teasell, R. (2009). A Systematic Review of the Management of Orthostatic Hypotension after Spinal Cord Injury. Arch. Phys. Med. Rehabil. 90 (5), 876–885. doi:10.1016/j.apmr.2009.01.009
Krassioukov, A. (2009). Autonomic Function Following Cervical Spinal Cord Injury. Respir. Physiol. Neurobiol. 169 (2), 157–164. doi:10.1016/j.resp.2009.08.003
Kumar, R., Lim, J., Mekary, R. A., Rattani, A., Dewan, M. C., Sharif, S. Y., et al. (2018). Traumatic Spinal Injury: Global Epidemiology and Worldwide Volume. World Neurosurg. 113, e345–e363. doi:10.1016/j.wneu.2018.02.033
Lakens, D. (2013). Calculating and Reporting Effect Sizes to Facilitate Cumulative Science: a Practical Primer for T-Tests and ANOVAs. Front. Psychol. 4, 863. doi:10.3389/fpsyg.2013.00863
Legg Ditterline, B. E., Aslan, S. C., Wang, S., Ugiliweneza, B., Hirsch, G. A., Wecht, J. M., et al. (2021). Restoration of Autonomic Cardiovascular Regulation in Spinal Cord Injury with Epidural Stimulation: a Case Series. Clin. Auton. Res. 31 (2), 317–320. doi:10.1007/s10286-020-00693-2
Liu, J., Cai, C., Wang, Y., Liu, Y., Huang, L., Tian, T., et al. (2020). A Biomimetic Plasmonic Nanoreactor for Reliable Metabolite Detection. Adv. Sci. 7 (10), 1903730. doi:10.1002/advs.201903730
Montgomery, D. C., and Runger, G. C. (2018). Applied Statistics and Probability for Engineers. Seventh edition. Hoboken, NJ: Wiley. pages cm p.
Moonen, E. J. M., Haakma, J. R., Peri, E., Pelssers, E., Mischi, M., and den Toonder, J. M. J. (2020). Wearable Sweat Sensing for Prolonged, Semicontinuous, and Nonobtrusive Health Monitoring. View 1 (4), 20200077. doi:10.1002/viw.20200077
Muntner, P., Whittle, J., Lynch, A. I., Colantonio, L. D., Simpson, L. M., Einhorn, P. T., et al. (2015). Visit-to-Visit Variability of Blood Pressure and Coronary Heart Disease, Stroke, Heart Failure, and Mortality. Ann. Intern. Med. 163 (5), 329–338. doi:10.7326/m14-2803
Norman, G. R., Sloan, J. A., and Wyrwich, K. W. (2003). Interpretation of Changes in Health-Related Quality of Life. Med. Care 41 (5), 582–592. doi:10.1097/01.mlr.0000062554.74615.4c
Parati, G., Stergiou, G. S., Dolan, E., and Bilo, G. (2018). Blood Pressure Variability: Clinical Relevance and Application. J. Clin. Hypertens. 20 (7), 1133–1137. doi:10.1111/jch.13304
Parati, G., Torlasco, C., Pengo, M., Bilo, G., and Ochoa, J. E. (2020). Blood Pressure Variability: its Relevance for Cardiovascular Homeostasis and Cardiovascular Diseases. Hypertens. Res. 43 (7), 609–620. doi:10.1038/s41440-020-0421-5
Penzel, T. (1995). Blood Pressure Analysis. J. Sleep Res. 4 (1), 15–20. doi:10.1111/j.1365-2869.1995.tb00180.x
Piatt, J. A., Nagata, S., Zahl, M., Li, J., and Rosenbluth, J. P. (2016). Problematic Secondary Health Conditions Among Adults with Spinal Cord Injury and its Impact on Social Participation and Daily Life. J. Spinal Cord Med. 39 (6), 693–698. doi:10.1080/10790268.2015.1123845
Pilgrim, J. A., Stansfeld, S., and Marmot, M. (1992). Low Blood Pressure, Low Mood? BMJ 304 (6819), 75–78. doi:10.1136/bmj.304.6819.75
Portney, L. G., and Watkins, M. P. (2008). Foundations of Clinical Research: Applications to Practice. 3rd ed. New Jersey: Prentice-Hall.
Regan, C. O., Kearney, P. M., Cronin, H., Savva, G. M., Lawlor, B. A., and Kenny, R. (2013). Oscillometric Measure of Blood Pressure Detects Association between Orthostatic Hypotension and Depression in Population Based Study of Older Adults. BMC Psychiatry. 13, 266. doi:10.1186/1471-244X-13-266
Rosengren, A., Tibblin, G., and Wilhelmsen, L. (1993). Low Systolic Blood Pressure and Self Perceived Wellbeing in Middle Aged Men. Bmj 306 (6872), 243–246. doi:10.1136/bmj.306.6872.243
Rothwell, P. M., Howard, S. C., Dolan, E., O'Brien, E., Dobson, J. E., Dahlöf, B., et al. (2010). Effects of β Blockers and Calcium-Channel Blockers on Within-Individual Variability in Blood Pressure and Risk of Stroke. Lancet Neurol. 9 (5), 469–480. doi:10.1016/s1474-4422(10)70066-1
Sawilowsky, S. S. (2009). New Effect Size Rules of Thumb. J. Mod. App. Stat. Meth. 8 (2), 597–599. doi:10.22237/jmasm/1257035100
Shanbhag, A., Awai, H., Rej, S., Thomas, A. J., Puka, K., and Vasudev, A. (2018). Orthostatic Hypotension in Patients with Late-Life Depression: Prevalence and Validation of a New Screening Tool. Int. J. Geriatr. Psychiatry 33 (10), 1397–1402. doi:10.1002/gps.4951
Singh, A., Tetreault, L., Kalsi-Ryan, S., Nouri, A., and Fehlings, M. G. (2014). Global Prevalence and Incidence of Traumatic Spinal Cord Injury. Clin. Epidemiol. 6, 309–331. doi:10.2147/CLEP.S68889
Stevens, S. L., Wood, S., Koshiaris, C., Law, K., Glasziou, P., Stevens, R. J., et al. (2016). Blood Pressure Variability and Cardiovascular Disease: Systematic Review and Meta-Analysis. BMJ 354, i4098. doi:10.1136/bmj.i4098
Su, D.-F., and Miao, C.-Y. (2005). Reduction of Blood Pressure Variability: a New Strategy for the Treatment of Hypertension. Trends Pharmacol. Sci. 26 (8), 388–390. doi:10.1016/j.tips.2005.06.003
Teasell, R. W., Arnold, J. M. O., Krassioukov, A., and Delaney, G. A. (2000). Cardiovascular Consequences of Loss of Supraspinal Control of the Sympathetic Nervous System after Spinal Cord Injury. Arch. Phys. Med. Rehabil. 81 (4), 506–516. doi:10.1053/mr.2000.3848
Vasudev, A., O'Brien, J. T., Tan, M. P., Parry, S. W., and Thomas, A. J. (2011). A Study of Orthostatic Hypotension, Heart Rate Variability and Baroreflex Sensitivity in Late-Life Depression. J. Affect Disord. 131 (1-3), 374–378. doi:10.1016/j.jad.2010.11.001
Wang, S., Wecht, J. M., Legg Ditterline, B., Ugiliweneza, B., Maher, M. T., Lombard, A. T., et al. (2020). Heart Rate and Blood Pressure Response Improve the Prediction of Orthostatic Cardiovascular Dysregulation in Persons with Chronic Spinal Cord Injury. Physiol. Rep. 8 (20), e14617. doi:10.14814/phy2.14617
Wecht, J. M., and Bauman, W. A. (2018). Implication of Altered Autonomic Control for Orthostatic Tolerance in SCI. Auton. Neurosci. 209, 51–58. doi:10.1016/j.autneu.2017.04.004
Wecht, J. M., de Meersman, R. E., Weir, J. P., Bauman, W. A., and Grimm, D. R. (2000). Effects of Autonomic Disruption and Inactivity on Venous Vascular Function. Am J. Physiol Heart Circ. Physiol. 278 (2), 515–520. doi:10.1152/ajpheart.2000.278.2.h515
Wecht, J. M., de Meersman, R. E., Weir, J. P., Spungen, A. M., and Bauman, W. A. (2003). Cardiac Autonomic Responses to Progressive Head-Up Tilt in Individuals with Paraplegia. Clin. Auton. Res. 13 (6), 433–438. doi:10.1007/s10286-003-0115-5
Wecht, J. M., Zhu, C., Weir, J. P., Yen, C., Renzi, C., and Galea, M. (2013). A Prospective Report on the Prevalence of Heart Rate and Blood Pressure Abnormalities in Veterans with Spinal Cord Injuries. J. spinal cord Med. 36 (5), 454–462. doi:10.1179/2045772313y.0000000109
Wecht, J. M., Weir, J. P., and Bauman, W. A. (2017). Inter-day Reliability of Blood Pressure and Cerebral Blood Flow Velocities in Persons with Spinal Cord Injury and Intact Controls. J. Spinal Cord Med. 40 (2), 159–169. doi:10.1080/10790268.2015.1135556
Wecht, J. M., Weir, J. P., Katzelnick, C. G., Wylie, G., Eraifej, M., Nguyen, N., et al. (2018). Systemic and Cerebral Hemodynamic Contribution to Cognitive Performance in Spinal Cord Injury. J. Neurotrauma 35 (24), 2957–2964. doi:10.1089/neu.2018.5760
Wecht, J. M., Harel, N. Y., Guest, J., Kirshblum, S. C., Forrest, G. F., Bloom, O., et al. (2020). Cardiovascular Autonomic Dysfunction in Spinal Cord Injury: Epidemiology, Diagnosis, and Management. Semin. Neurol. 40 (5), 550–559. doi:10.1055/s-0040-1713885
Wecht, J. M., Weir, J. P., Katzelnick, C. G., Chiaravalloti, N. D., Kirshblum, S. C., Dyson-Hudson, T. A., et al. (2020). Double-blinded, Placebo-Controlled Crossover Trial to Determine the Effects of Midodrine on Blood Pressure during Cognitive Testing in Persons with SCI. Spinal Cord 58 (9), 959–969. doi:10.1038/s41393-020-0448-0
Weir, J. P. (2005). Quantifying Test-Retest Reliability Using the Intraclass Correlation Coefficient and the SEM. J. Strength Cond Res. 19 (1), 231–240. doi:10.1519/15184.1
Wessely, S., Nickson, J., and Cox, B. (1990). Symptoms of Low Blood Pressure: a Population Study. BMJ 301 (6748), 362–365. doi:10.1136/bmj.301.6748.362
West, C. R., Phillips, A. A., Squair, J. W., Williams, A. M., Walter, M., Lam, T., et al. (2018). Association of Epidural Stimulation with Cardiovascular Function in an Individual with Spinal Cord Injury. JAMA Neurol. 75 (5), 630–632. doi:10.1001/jamaneurol.2017.5055
Whelton, P. K., Carey, R. M., Aronow, W. S., Casey, D. E., Collins, K. J., Dennison Himmelfarb, C., et al. (2017). 2017 ACC/AHA/AAPA/ABC/ACPM/AGS/APhA/ASH/ASPC/NMA/PCNA Guideline for the Prevention, Detection, Evaluation, and Management of High Blood Pressure in Adults: Executive Summary: A Report of the American College of Cardiology/American Heart Association Task Force on Clinical Practice Guidelines. J. Am. Coll. Cardiol. 71 (6), 2199–2269. doi:10.1016/j.jacc.2017.11.005
Wilkie, P. L., Eisdorfer, C., and Nowlin, J. B. (1976). Memory and Blood Pressure in the Aged. Exp. Aging Res. 2 (1), 3–16. doi:10.1080/03610737608257972
Wu, J.-C., Chen, Y.-C., Liu, L., Chen, T.-J., Huang, W.-C., Cheng, H., et al. (2012). Increased Risk of Stroke after Spinal Cord Injury: a Nationwide 4-year Follow-Up Cohort Study. Neurology 78 (14), 1051–1057. doi:10.1212/wnl.0b013e31824e8eaa
Xu, W., Wang, L., Zhang, R., Sun, X., Huang, L., Su, H., et al. (2020). Diagnosis and Prognosis of Myocardial Infarction on a Plasmonic Chip. Nat. Commun. 11 (1), 1654. doi:10.1038/s41467-020-15487-3
Zhang, R., Rejeeth, C., Xu, W., Zhu, C., Liu, X., Wan, J., et al. (2019). Label-Free Electrochemical Sensor for CD44 by Ligand-Protein Interaction. Anal. Chem. 91 (11), 7078–7085. doi:10.1021/acs.analchem.8b05966
Keywords: spinal cord injury, cardiovascular dysfunction, cardiovascular perturbation, spinal cord epidural stimulation, blood pressure stability
Citation: Mesbah S, Legg Ditterline B, Wang S, Wu S, Weir J, Wecht J, Forrest G, Harkema S and Ugiliweneza B (2021) Novel Clinimetric Toolset to Quantify the Stability of Blood Pressure and Its Application to Evaluate Cardiovascular Function After Spinal Cord Injury. Front. Anal. Sci. 1:701891. doi: 10.3389/frans.2021.701891
Received: 28 April 2021; Accepted: 12 July 2021;
Published: 11 August 2021.
Edited by:
Liang Qiao, Fudan University, ChinaReviewed by:
Kun Qian, Shanghai Jiao Tong University, ChinaRuo-Can Qian, East China University of Science and Technology, China
Copyright © 2021 Mesbah, Legg Ditterline, Wang, Wu, Weir, Wecht, Forrest, Harkema and Ugiliweneza. This is an open-access article distributed under the terms of the Creative Commons Attribution License (CC BY). The use, distribution or reproduction in other forums is permitted, provided the original author(s) and the copyright owner(s) are credited and that the original publication in this journal is cited, in accordance with accepted academic practice. No use, distribution or reproduction is permitted which does not comply with these terms.
*Correspondence: Beatrice Ugiliweneza, YmVhdHJpY2UudWdpbGl3ZW5lemFAbG91aXN2aWxsZS5lZHU=