 Dinesh Kumar1,2*
 Ramiz M. R. Azad3
 Dasharath Oulkar3Harinder Singh Oberoi1Sanu Jacob1
 B. C. Koner4,5
 S. C. Sonkar5,6*
- 1Food Safety and Standards Authority of India (FSSAI), New Delhi, India
- 2National Institute of Health and Family Welfare (NIHFW), New Delhi, India
- 3Food Safety Solution Center, NFL Ghaziabad, Ghaziabad, India
- 4Multidisciplinary Research Unit (MRU), Maulana Azad Medical College and Associated Hospital, New Delhi, India
- 5Department of Biochemistry, Maulana Azad Medical College and Associated Hospital, New Delhi, India
- 6Delhi School of Public Health (DSPH), Institute of Eminence(IoE), University of Delhi, Delhi, India
Backgrounds: Oxytocin is nowadays used to increase the agricultural products besides its use during the milking of cattle leading to the contamination of agricultural produce and milk with oxytocin. Monitoring of accurate oxytocin contaminations from foodstuffs is sometimes required to maintain the quality standard. The commonly used oxytocin assays in this study were interfered with by the food matrix. There is a need to develop an accurate and confirmed method for monitoring oxytocin contaminations in foodstuffs.
Objective: An attempt is made to develop an accurate assay method of oxytocin from milk and agricultural produces.
Methods: The acidified methanol was used for the extraction of oxytocin from target food stuff/matrices (agricultural produce and Milk). LC-MS/MS was used for its detection and quantification. In the chromatographic separation, Oxytocin concentration was optimized using selective reaction monitoring (SRM) with heated electrospray ionization (HESI) in positive polarity. The chromatographic separation was performed using a reversed-phase C18 column with gradient elution at a flow rate of 0.4 ml/min. The acidified methanol was used for the extraction of oxytocin in all target food matrices. The method performance was verified as per the SANTE 2021 guideline. After method validation, the method was applied in real food samples analysis for assessing the presence/absence of oxytocin.
Results: The calibration curve offered excellent linearity (R2 = 0.999) with less than 15% residuals. The matrix effect was <20% observed for all target matrices. The mean recoveries were within 70%–115% with <11% RSD at four different levels in milk and 0.01 mg/kg in fruits and vegetables. The optimized method was applied to 50 random samples of milk, fruits, and vegetables from the market for the purposes of an established quality control approach. Based on the results, we did observe a signal of oxytocin in the random samples Therefore, this method has shown its practical suitability for the detection of oxytocin in milk, fruits, and vegetables.
Conclusion: Extraction of oxytocin using acidified methanol followed by assays using LC-MS/MS is a simple, sensitive, accurate, reproducible, and practically suitable method for detection and quantification of oxytocin from milk, fruits, and vegetables.
1 Introduction
Oxytocin is a mammalian neuropeptide containing nine amino acids and plays important role in various biochemical functions such as birth, lactation, parenting, social recognition, and relationship bonding [(Wang et al., 2019)] [(Carter et al., 2007)] [(Uvnäs-Moberg, 1998)] [(Bakermans-Kranenburg and van I Jzendoorn, 2013)] [(Ross and Young, 2009)]. Thus it becomes imperative to monitor oxytocin concentrations in the food samples. Oxytocin is a birth hormone showing uterotonic and galactogenic activity which occurs naturally in animals. Oxytocin, when injected into plant parts, such as the stem, it functions as a growth promoter. It stimulates the plant hormones such as cytokinin that invariably cause cell division resulting in excess productivity of fruits and vegetables (Chandravathi et al., 2016). As oxytocin is very cheap and easily available in the Indian market, it has been reported that the farmers are using oxytocin to increase the extraordinary growth of vegetables like pumpkin, watermelon, brinjal, gourd, and cucumber in a shorter time for meeting its increased market demand and getting a better value for the produce (Prakash et al., 2009; Rani et al., 2013). Oxytocin is utilized by dairy farmers for improving milk yields. However, Oxytocin is hazardous and not safe for a human being when it enters a food chain (Parra et al., 2005). Presently, different techniques like high-performance thin-layer chromatography (HPTLC), enzyme-linked immunosorbent assays (ELISA), radioimmunoassay (RIA), high-performance liquid chromatography (HPLC), and liquid chromatography tandem mass spectrometry (LC-MS/MS) have been used for the analysis of oxytocin in various biological samples (Szeto et al., 2011; Zhang et al., 2011; Mishra et al., 2013; Rani et al., 2013; Robinson et al., 2014). However, the conventional HPLC-UV also has poor sensitivity and resolution without mass spectrometry (Wang et al., 2019). Due to other peptide interferences, the false-positive signals were observed in ELISA and RIA techniques (non-specific). This is called matrix effect, due to presence of foodstuff such as fruits, vegetables, milk has varied matrix that has potential to interfere with the assay methods. However, the LC-MS/MS has many advantages in terms of selectivity, sensitivity, the optimum resolution required for accurate identification and conformation followed by quantitation of oxytocin.
There are few research articles already published on oxytocin analysis using LC-MS/MS, but those reported methods have various specific pre-requisites for sample preparation i.e. extraction followed by evaporation of extract, protein precipitation followed by SPE cleanup, and/or extraction followed by Solid-phase micro-extraction (SPME) (Zhang et al., 2011; Mishra et al., 2013; Brandtzaeg et al., 2016; Wang et al., 2019). Another study built a platform containing automated filtration/filter backflushing (AFFL), online SPE, and a nano LC-MS system (Moriyama and Kataoka, 2015). Online in-tube Solid-phase micro-extraction (SPME) to couple with LC-MS for measuring salivary oxytocin (Kataoka and Nakayama, 2022).
The present work focuses on the detection and quantitation of oxytocin, artificially spiked in certain food commodities. The objective of this study was to develop and validate a LC-MS/MS based assay method for the quantification of oxytocin in food commodities.
2 Materials and methods
2.1 Reagent and materials
Oxytocin acetate (≥96%) was purchased from Fisher Scientific (Mumbai, India). OptimaTM LC-MS grade water, acetonitrile, methanol, and formic acid (≥85%) were procured from Fisher Scientific (Mumbai, India). Analytical balance (ACZET, CY2202) and precision balance (ACZET, CY205C, San Diego, CA) were used for weighing the samples. The vortex-mixer refrigerated centrifuge (Sorvall™ ST8 ventilated benchtop centrifuge) and variable volume micropipettes, centrifuge tubes (2, 15, 50 ml) were procured from Thermo Scientific (Mumbai, India).
2.2 Sample preparation
Milk (cow and buffalo), cucumber, pumpkin, watermelon, and brinjal samples were collected from the local farmers. All the vegetable samples were homogenized directly using a mixer and grinder to get a uniform size except brinjal. Brinjal was homogenized by the addition of water (1:1) to get a better uniform and homogenous material. Milk was shaken and mixed properly before the conduct tested. A test portion (5 g ± 0.05) was extracted using 10 ml acidified methanol (1% formic acid), vortexed for 2 min, followed by centrifugation at 5000G. The supernatant was diluted with acidified water (1:2, v/v) and centrifuged at 10,000 G the supernatant was filtered through a 0.2 µm nylon membrane filter and then injected into LC-MS/MS.
2.3 Liquid chromatography tandem mass spectrometry analysis
All the samples and calibration standards were analyzed using a Vanquish™ UHPLC Binary Flex and TSQ Quantis tandem quadrupole mass spectrometer (Thermo Scientific™ San Jose, United States). The chromatographic separation was performed on Hypersil Gold C18 (100 × 2.1 mm, 1.9 µm particle size, Thermo Scientific™, San Jose, United States), and the flow rate was 0.4 ml/min. The mobile phase contained (A) water and (B) MeOH: Acetonitrile, both with 0.1% HCOOH. The gradient was 0–0.5 min, 10% B; 0.5–4 min, 10%–90%B; 4–6 min, 90% B; 6–6.5 min, 90%–10% B, and 6.5–10 min, 10% B. The autosampler tray was set at 20°C, the column temperature was set at 40°C, and the injection volume was fixed at 5 µl.
Selective reaction monitoring (SRM) was used in heated electrospray ionization (H-ESI) in positive polarity. Based on the retention time, auto-optimized dwell time (130 ms), and chromatographic peak width (10s) were utilized in a 1s target scan cycle to achieve greater than 12 scans/data points per peak. The source parameters include sheath gas (50arb), aux gas (10arb), and sweep gas (1arb) along with collision gas (2 mTorr) setting with ion spray voltage at 3500 V in positive polarity. The H-ESI was operated with the auxiliary gas heater temperature at 350°C and ion transfer tube at 275°C temperature. The identification and quantification were performed by SRM of the protonated precursor molecular ions (M + H)+, and a few fragments/product ions. The SRMs transition of oxytocin were used for quantitation (m/z 1007.5 > 723.5) and confirmation (m/z 1007.5 > 990.054, 1007.5 > 706.024). For instrument control, data acquisition, processing, and reporting the Trace Finder 4.1 software (Thermo Scientific, San Jose, United States) was used.
2.4 Method performance
A single laboratory method validation was performed to increase the confidence and ensure the validity of test results obtained by following the optimized protocol. The method performance was evaluated for the calibration curve, sensitivity, selectivity, matrix effects, recovery, precision, and robustness as per the criteria defined in the SANTE and bio-analytical method validation guidelines of the US Food and Drug Administration [(Author anonymus, 2021)] [(Author anonymus, 2018)].
2.4.1 Linearity and limit of quantitation
The calibration curve was plotted by using the peak area against the concentrations of oxytocin spiked in a solvent followed by linear regression with a 1/x weighting factor. Linearity was evaluated by monitoring the correlation coefficient (r2) of the calibration curves. The method performance was assessed through sensitivity by determining the limit of quantitation (LOQ). For the establishment of LOQs, the target matrices were spiked at the lowest concentration in replicates (n = 6). The lowest spike concentration was done to meet the two transitions with the signal-to-noise ratio of 10:1 (quantitation transition) with acceptable recoveries (70%–120%) with <20% RSD.
2.4.2 Matrix effect
The matrix effect was assessed based on the signal suppression or enhancement. This was performed by comparison of oxytocin area in extracted matrix versus area in the solvent (Kittlaus et al., 2011) with six replications.
2.4.3 Recovery and precision
Both recovery and precision were estimated at three different levels i.e., LOQ (low), middle, and higher by spiking in the milk matrices. It was extended to other fruits and vegetables by spiking at 0.01 mg/kg (default maximum residue limit). Recoveries were estimated based on the measured concentration target matrix in comparison to the spiked amount of oxytocin. Precision was evaluated by measuring the % RSD for the replicate results of the concentration/recovery.
2.5 Application of method in samples
The method’s efficiency was evaluated by measuring oxytocin concentrations present in the market samples collected from the local area. All the collected samples were stored at 4°C–8°C till analysis, in brief, as mentioned in the standard operating procedure (SOP).
2.6 Throughputs and cost variations
Other methods of oxytocin assays was collected from literature. The cost of oxytocin assays was estimated from the cost of reagents.
3 Standard operating procedure and results
3.1 Sample preparation
Oxytocin is a polar analyte and consists of amino acids. So, the extraction from the target matrices was performed using acidified methanol, dichloromethane, and acetonitrile. Dichloromethane and acetonitrile extraction carried partial extraction of oxytocin and results in poor extraction efficiency. To avoid the liquid-liquid partitioning, an acidified methanol extraction was preferred which did not separate water and methanol. This mixture of methanol and water generated an exothermic reaction which helped in getting t better extraction efficiency and recovery. In addition, the crude extract was diluted with water, filtered through a 0.22 µm nylon membrane filter, and injected 5 µl to LC-MS/MS. This dilution approach minimizes the matrix concentration injected to LC-MS/MS, the clean extract reduced the ESI source cleaning frequency with increased system throughput. The steps like protein precipitation and dispersive solid-phase extraction (DSPE) were eliminated during sample preparation and a simple dilution approach was preferred which reduced the cost of sample preparation and increased overall method throughput by 50% as compared to earlier reported methods (Zhang et al., 2011; Mishra et al., 2013; Brandtzaeg et al., 2016; Wang et al., 2019).
3.2 Liquid chromatography tandem mass spectrometry analysis
The UHPLC-MS/MS conditions and sample preparation protocol were critically improved to achieve optimum and better performance. The selective reaction monitoring (SRM) parameters were optimized by injecting 5 μl/min of 1 μg/ml solution of oxytocin prepared in 0.1% (v/v) formic acid (FA) with 50% aqueous acetonitrile (1). With this approach, it was possible to achieve the best and stable signal of a parent as well as fragment ions. Finally, the best transitions i.e., 1007.5 > 723.07 (Quantitative), 1007.5 > 723.07 (Confirmatory), and 1007.5 > 723.07 (Confirmatory) were selected in this experiment in agreement with earlier studies (Zhang et al., 2011; Moriyama and Kataoka, 2015; Brandtzaeg et al., 2016; López-Arjona et al., 2021).
The heated electrospray ionization (HESI) source parameters i.e., ion spray voltage, sheath gas, auxiliary gas, sweep gas, ion transfer tube temperature, and auxiliary gas heater temperature were optimized based on the composition and flow rate of the mobile phase which offered the best signal. A representation of oxytocin in a neat solution has shown the two transitions signal at the same retention (3.11 min) with a sufficient signal to noise ratio (78:1) at 0.5 ng/ml (Figure 1).
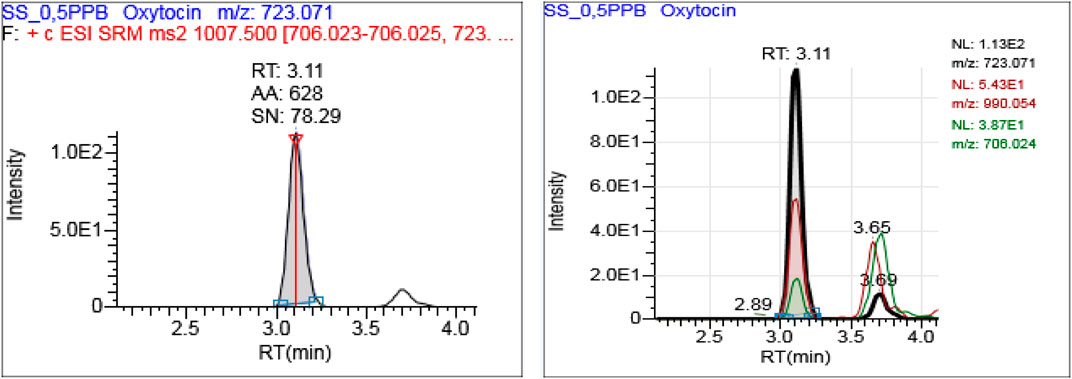
FIGURE 1. A representative extracted ion chromatogram for oxytocin at 0.5 ng/mL in a neat solution.
The chromatographic conditions were optimized using 0.1% formic acid as mobile phase additives in the mobile phase which helps to provide the best signal for oxytocin in the positive polarity. Normally, the slow gradient program is preferred to achieve better retention with a good peak shape. In this case, the oxytocin signal is masked by the isobaric interference observed in buffalo milk and it was very difficult to identify and confirm the signal at 3.31 min shown in Figure 2A. Hence, the gradient program was amended with minor modifications which include 10% acetonitrile at the initial stage with a gradual increase to 90% at 4 min which offered better separation between oxytocin signal and isobaric interference from the matrix (Figure 2B). Isobaric interference peaks for oxytocin with higher intensity were observed in the buffalo milk as compared to the other target matrices. A representative extracted ion chromatogram for the milk matrix is shown in Figure 2. These optimized gradient chromatographic conditions offered a consistent and better response for oxytocin as compared to the earlier reported short methods (Zhang et al., 2011; Mishra et al., 2013; Moriyama and Kataoka, 2015).
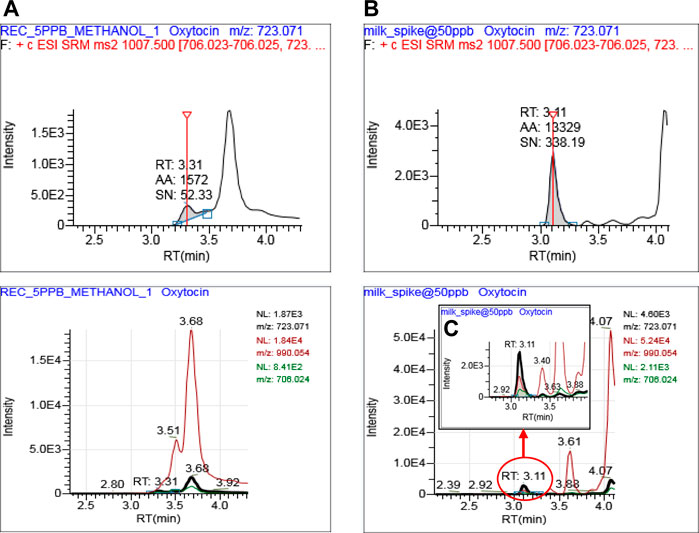
FIGURE 2. An optimized chromatographic conditions for accurate identification, confirmation, and quantitation of oxytocin in buffalo milk. Oxytocin signal at 3.31 min masked by matrix interference peak in general gradient (A), Oxytocin signal (3.11 min) well separated from isobaric interferences (B) and zoomed signal of Oxytocin at 3.11 min (C).
3.3 Method performance
3.3.1 Selectivity and specificity
Method selectivity was demonstrated through optimizing the gradient chromatography which enables the excellent separation between oxytocin and the potential isobaric interfering matrix components. This helped in an accurate identification and confirmation of oxytocin in agreement with reference standard. This was further confirmed by spiking of oxytocin in all target matrices at lower levels (0.01 mg/kg) followed by effective identification and quantitation showing excellent method selectivity and specificity. There was no carryover or memory effect observed during the oxytocin method validation as well as real sample analysis.
3.3.2 Linearity
The calibration curve was plotted with area against the different level of concentrations to demonstrate the relation between them. The calibration curve was plotted in the range of 0.5–100 ng/ml in the solvent as well as in the matrices. The calibration curve offered excellent linearity (r2 = ≥ 0.999) and <15% residuals by following a linear equation with a 1/x weighting factor. For recovery and precision studies, the calibration curves were plotted in the range of 0.5–50 ng/ml for the recovery and precision studies in all targeted matrices.
3.3.3 Limit of quantification
The Limit of quantification (LOQ) was established by spiking at 0.01 mg/kg which offered the best performance in terms of identification, confirmation following the retention time (±0.1 min), and ion ratio (±30%) criteria [(Kataoka and Nakayama, 2022)] [(Author anonymus, 2021)]. Based on the signal to noise (>10:1), the recovery and precision were observed within acceptable criteria. Hence, the lower spike level i.e., 0.01 mg/kg (effective concentration is 0.0011 mg/kg) level is considered as LOQ for all target matrices which meets the European Union default MRL (Supplementary Figure S1). The sample gets diluted nine times so the matrix effect is also minimized (<20%). So the quantitation was performed by use of external solvent standards.
3.3.4 Matrix effect
Matrix effect plays an important role in food analysis specially using LC-MS/MS. As methanol was used for extraction which supposed to carry lot of polar matrix components along with oxytocin. This crude extract direct injection could incur the ion suppression up to 50%. To avoid such incidences, a water-based dilution approach preferred by minimizing the matrix effect (<20%) and the quantitation was performed using external standards.
3.3.5 Recovery and precision
The recovery experiment was carried out by spiking at four different levels i.e., 0.01, 0.025, 0.05, and 0.1 mg/L in both cow as well as buffalo milk. The mean recovery and precision (repeatability in terms of %RSD) were observed in the range of 84–92% with <7% RSD in cow milk and 74%–91% with <5% RSD in buffalo milk, respectively. The expanded scope of the method was evaluated into randomly collected samples like cucumber, watermelon, pumpkin, and brinjal by spiking at 0.01 mg/kg (n = 6) and demonstrated in Supplementary Figure S1. The mean % recovery and precision (repeatability in terms of % RSD) were 115%, 9.9%; 104%, 11%; 115%, 5%; and 115%, 7% respectively. Further, the method performance was evaluated for routine testing by injecting the bracketing standard. The bracketing standard (0.01 μg/ml) was injected after every 9–10 injections of the matrix (cucumber, watermelon, pumpkin, and brinjal) and evaluated for area variation in terms of %RSD. The bracketing standard variation was within 4% without applying any internal standard correction (Figure 3). Oxytocin gets better stability in methanol extraction demonstrated through the repeatability as reported earlier. These results indicated that the method could able to complete at least more than 50 injections of vegetable extract without any problem.
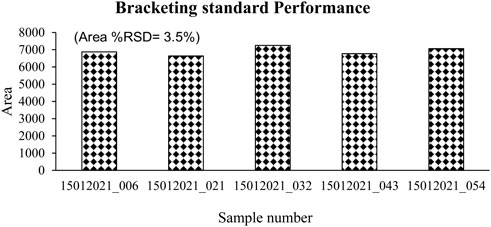
FIGURE 3. Oxytocin bracketing standard performance in a sequence of vegetables.
3.4 Measurement of oxytocin in the market sample
The optimized and validated method was further applied for the measurement of oxytocin content in the milk, and vegetable samples (50 no) collected from the market. The collected samples were kept in controlled conditions (4°C–8°C) till the analysis. All the samples were processed (extracted, and analyzed) as per the optimized protocol. Out of 50 samples, there is no single sample that showed any traces of oxytocin content.
3.5 Throughput and cost comparisons with other methods
Multiple assays are available for measurements of oxytocin from biological samples and methods have been evaluated in various biological samples. While LC-MS/MS method is effective and have capacity to measure traces of oxytocin contaminations in food samples. But, it is not available in many settings due to its high cost—in the low resource settings countries, its cost is nearly 20 times that of existing assays of estimation traces of oxytocin contaminations (Tabak et al., 2022).
4 Discussion and conclusion
A simple, sensitive, cost-effective, accurate, and robust method for oxytocin analysis in food matrices has been developed and validated. Acidified methanolic extraction followed by LC-MS/MS analysis offered excellent linearity (r2 = 0.999) with the best LOQ (0.01 mg/kg). Mean recovery and precision synchronized well with acceptable criteria. The proposed protocol is offering a generic approach for measurement of oxytocin concentration in diversified commodities i.e., high-fat milk as well as vegetables having high water content (pumpkin, cucumber, watermelon, and brinjal). The lab chemist/analyst (alone) could process more than 50 samples effectively within 8 h. In comparison with earlier reported methods i.e., evaporation and reconstitution, protein precipitation, and SPE cleanup followed by special chromatographic requirements, the proposed method was able to increase the high throughput in terms of sample preparation and analysis and also by decreasing the cost of analysis by 50%. This indicates that the method developed and validated in the present study has practical significance and can be easily adapted for faster detection, quantifications and monitoring of oxytocin in Milk and vegetables in real samples.
Data availability statement
The original contributions presented in the study are included in the article/Supplementary Material, further inquiries can be directed to the corresponding authors.
Author contributions
DK, SJ, and HO conceived and designed the experiments, DK, SS, RA, DO, and HO carried out the experiments, DK, HO, and SJ analyzed, DK, SS, and BK wrote and finalized the manuscript. All authors read and approved the final manuscript.
Funding
This study was supported by the team of FSSAI-Thermo Fisher Scientific, Food Safety Solution Centre, Ghaziabad, India and Using Facilities of MRU acknowledge.
Acknowledgments
We acknowledge Prof. T. G Shrivastav, Ex-Head RBM, NIHFW to support and encourage the study and also sincerely thank the CEO, FSSAI, and Director NFL, Ghaziabad, and Multidisciplinary Research Unit, Maulana Azad Medical College and Associated Hospital, New Delhi India for allowing us to use the facilities for successful completion of the study.
Conflict of interest
The authors declare that the research was conducted in the absence of any commercial or financial relationships that could be construed as a potential conflict of interest.
Publisher’s note
All claims expressed in this article are solely those of the authors and do not necessarily represent those of their affiliated organizations, or those of the publisher, the editors and the reviewers. Any product that may be evaluated in this article, or claim that may be made by its manufacturer, is not guaranteed or endorsed by the publisher.
Supplementary material
The Supplementary Material for this article can be found online at: https://www.frontiersin.org/articles/10.3389/frans.2022.1039606/full#supplementary-material
Supplementary Figure 1 | A representative extracted ion chromatogram (EIC) along with confirmatory transitions overlayed at the same retention time of oxytocin spiked at 0.01 mg/kg in watermelon (A), cucumber (B), cow milk (C), brinjal (D), pumpkin (E), and buffalo milk (F).
References
Author anonymus (2018). Bioanalytical method validation guidance for industry. https://www.fda.gov/files/drugs/published/Bioanalytical-Method-Validation-Guidance-for-Industry.pdf.
Author anonymus (2021). SANTE guideline. https://www.eurl-pesticides.eu/userfiles/file/EurlALL/SANTE_11312_2021.pdf.
Bakermans-Kranenburg, M. J., and van I Jzendoorn, M. H. (2013). Sniffing around oxytocin: Review and meta-analyses of trials in healthy and clinical groups with implications for pharmacotherapy. Transl. Psychiatry 3 (5), e258. doi:10.1038/tp.2013.34
Brandtzaeg, O. K., Johnsen, E., Roberg-Larsen, H., Seip, K. F., MacLean, E. L., Gesquiere, L. R., et al. (2016). Proteomics tools reveal startlingly high amounts of oxytocin in plasma and serum. Sci. Rep. 6, 31693. doi:10.1038/srep31693
Carter, C. S., Pournajafi-Nazarloo, H., Kramer, K. M., Ziegler, T. E., White-Traut, R., Bello, D., et al. (2007). Oxytocin: Behavioral associations and potential as a salivary biomarker. Ann. N. Y. Acad. Sci. 1098, 312–322. doi:10.1196/annals.1384.006
Chandravathi, C., Mahadevan, K., Sheela, P. K., Kumari, S., and Ahamed Hr, R. (2016). Detection of oxytocin in fruits and vegetables using wireless sensor. Indian J. Sci. Technol. 9 (16). doi:10.17485/ijst/2016/v9i16/92211
Kataoka, H., and Nakayama, D. (2022). Online in-tube solid-phase micro-extraction coupled with liquid chromatography-tandem mass spectrometry for automated analysis of four sulfated steroid metabolites in saliva samples. Molecules 27 (10), 3225. doi:10.3390/molecules27103225
Kittlaus, S., Schimanke, J., Kempe, G., and Speer, K. (2011). Assessment of sample cleanup and matrix effects in the pesticide residue analysis of foods using postcolumn infusion in liquid chromatography-tandem mass spectrometry. J. Chromatogr. A 1218 (46), 8399–8410. doi:10.1016/j.chroma.2011.09.054
López-Arjona, M., Tecles, F., Mateo, S. V., Contreras-Aguilar, M. D., Martínez-Miró, S., Cerón, J. J., et al. (2021). A procedure for oxytocin measurement in hair of pig: Analytical validation and a pilot application. Biol. (Basel) 10 (6), 527. doi:10.3390/biology10060527
Mishra, M., Ali, S., and Das, M. (2013). A New extraction method for the determination of oxytocin in milk by enzyme immune assay or high-performance liquid chromatography: Validation by liquid chromatography-mass spectrometry. Food Anal. Methods 6, 1308–1319. doi:10.1007/s12161-012-9544-x
Moriyama, E., and Kataoka, H. (2015). Automated analysis of oxytocin by on-line in-tube solid-phase micro-extraction coupled with liquid chromatography-tandem mass spectrometry. Chromatography 2 (3), 382–391. doi:10.3390/chromatography2030382
Parra, M. D., Tecles, F., Martínez-Subiela, S., and Cerón, J. J. (2005). C-reactive protein measurement in canine saliva. J. Vet. Diagn. Invest. 17 (2), 139–144. doi:10.1177/104063870501700207
Prakash, B. S., Paul, V., Kliem, H., Kulozik, U., and Meyer, H. H. (2009). Determination of oxytocin in milk of cows administered oxytocin. Anal. Chim. Acta 636 (1), 111–115. doi:10.1016/j.aca.2009.01.050
Rani, R., Medhe, S., Raj, K. R., and Srivastava, M. (2013). Standardization of HPTLC method for the estimation of oxytocin in edibles. J. Food Sci. Technol. 50 (6), 1222–1227. doi:10.1007/s13197-013-1036-5
Robinson, K. J., Hazon, N., Lonergan, M., and Pomeroy, P. P. (2014). Validation of an enzyme-linked immunoassay (ELISA) for plasma oxytocin in a novel mammal species reveals potential errors induced by sampling procedure. J. Neurosci. Methods 226, 73–79. doi:10.1016/j.jneumeth.2014.01.019
Ross, H. E., and Young, L. J. (2009). Oxytocin and the neural mechanisms regulating social cognition and affiliative behavior. Front. Neuroendocrinol. 30 (4), 534–547. doi:10.1016/j.yfrne.2009.05.004
Szeto, A., McCabe, P. M., Nation, D. A., Tabak, B. A., Rossetti, M. A., McCullough, M. E., et al. (2011). Evaluation of enzyme immunoassay and radioimmunoassay methods for the measurement of plasma oxytocin. Psychosom. Med. 73 (5), 393–400. doi:10.1097/PSY.0b013e31821df0c2
Tabak, B. A., Leng, G., Szeto, A., Parkar, K. J., Verbalis, J. G., Ziegler, T. E., et al. (2022). Advances in human oxytocin measurement: Challenges and proposed solutions. Mol. Psychiatry. doi:10.1038/s41380-022-01719-z
Uvnäs-Moberg, K. (1998). Oxytocin may mediate the benefits of positive social interaction and emotions. Psychoneuroendocrinology 23 (8), 819–835. doi:10.1016/s0306-4530(98)00056-0
Wang, L., Marti, D. W., and Anderson, R. E. (2019). Development and validation of a simple LC-MS method for the quantification of oxytocin in dog saliva. Molecules 24 (17), 3079. doi:10.3390/molecules24173079
Keywords: Milk, fruits and vegetables, mass spectrometry, oxytocin, validation, LC-MS/MS
Citation: Kumar D, Azad RMR, Oulkar D, Oberoi HS, Jacob S, Koner BC and Sonkar SC (2022) A quantification method for trace level of oxytocin in food matrices using LC-MS/MS. Front. Anal. Sci. 2:1039606. doi: 10.3389/frans.2022.1039606
Received: 08 September 2022; Accepted: 18 November 2022;
Published: 08 December 2022.
Edited by:
Liang Qiao, Fudan University, ChinaReviewed by:
Alexandre Zatkovskis Carvalho, Federal University of ABC, BrazilMilad Ghani, University of Mazandaran, Iran
Copyright © 2022 Kumar, Azad, Oulkar, Oberoi, Jacob, Koner and Sonkar. This is an open-access article distributed under the terms of the Creative Commons Attribution License (CC BY). The use, distribution or reproduction in other forums is permitted, provided the original author(s) and the copyright owner(s) are credited and that the original publication in this journal is cited, in accordance with accepted academic practice. No use, distribution or reproduction is permitted which does not comply with these terms.
*Correspondence: S. C. Sonkar, ZHJzY3NvbmthckBnbWFpbC5jb20=; Dinesh Kumar, ZHJkaW5lc2guZnNzYWlAZ21haWwuY29t