 Clément Martin1
 Noémie Willem2
 Sorenza Desablens2
 Vincent Menard2
 Sophia Tajri1
 Solène Blanchard1
 Yves Brostaux3François Verheggen1
 Claire Diederich2*
- 1TERRA, Gembloux Agro-Bio Tech, University of Liège, Gembloux, Belgium
- 2Namur Research Institute for Life Sciences (NARILIS), University of Namur, Namur, Belgium
- 3Department of Applied Statistics, Computer Science and Mathematics, Gembloux Agro-Bio Tech, University of Liege, Gembloux, Belgium
Dogs have a powerful olfactory system, which is used in many areas of the police and military to detect drugs, human remains, and explosives, among other items. Despite these powerful detection abilities, methods assessing the performance (MAP) of dogs remain scarce, and have never been validated. In particular, scientific knowledge on post-training performance assessments is scarce. To validate a quantitative MAP, an efficient detection dog (DD) must first be defined. Here, we aimed to define what an efficient DD is, and to develop a quantitative MAP. Specifically, we conducted 1) an international survey sent to professional DD practitioners (n = 50), and 2) an experimental assay on cadaver and drug DDs (n = 20). Based on the survey, efficient DDs were defined as confident animals, making few mistakes, alerting to the presence of target odors as close as possible, able to strategically screen the search area effectively, independent and not easily distracted. The developed quantitative MAP was based on video tracking DDs in a circular behavioral arena, in which the error rate of DD was recorded, including accuracy and the strategy level. Previous studies have already demonstrated that DDs are usually confidant. Guidance was not assessed during MAP development; however, handlers could not guide DDs during the search session. Based on this method, future studies should evaluate DD performance throughout the entire training process. Such monitoring would allow thresholds to be determined, allowing efficient DDs to be identified, along with the effect of certain factors on performance (e.g., dogs breed, gender, and training aids used during DD conditioning).
Introduction
Dogs are efficient scent detection animals. Their powerful olfactory system and their ability to be trained explain why they are used in so many police and military applications as bio-detectors (e.g., drug, human remains, explosive) (Harper and Furton, 2007; Quignon et al., 2012; Jezierski et al., 2014; Polgár et al., 2016; Hackner and Pleil, 2017; Martin et al., 2020). Despite their high potential, low performance is sometimes observed in detection dogs (DDs), which might be due to a lack of knowledge on their neurophysiology and related behaviors (Beebe et al., 2016; Jamieson et al., 2017; Lazarowski et al., 2020). An operational DD is the result of several factors: 1) selecting a promising puppy, 2) conducting efficient training, and 3) continuously assessing the dog’s working performance (Beebe et al., 2016; Polgár et al., 2016; Thrailkill et al., 2018; Martin et al., 2020). However, current methods used to assess the performance (MAP) of dogs are limited, and require validation. Here, we aimed to fill this knowledge gap.
Puppies are generally selected based on both anatomical and behavioral traits. Cranial anatomy and ability to thermoregulate are good biological indicators for selecting breeds to optimize odor perception by avoiding panting behavior which divert the inhaled air to the respiratory tract instead of the nose. Individual dogs are selected based on temperament. For instance, a social, cooperative, and confident puppy with a particular motivation to be trained (usually observed by a high reward drive) is preferred by handlers (Gazit and Joseph, 2003; Hussein et al., 2012; Beebe et al., 2016; Jamieson et al., 2017; Martin et al., 2020).
The second factor for producing an operational DD is the type of training that is implemented, particularly the olfactory stimuli used (termed training aids). Training aids must be representative of the target odor to avoid false identification (Porritt et al., 2015; Martin et al., 2020). While training methods are typically based on positive reinforcement (operant conditioning), training aids are diverse, with limited investigations on how they impact DD performance. Three types of olfactory training aids are commonly used: genuine materials, pseudo-scents, and non-pseudo alternatives. Genuine material is the target odor itself, and is the recommended aid (Simon et al., 2020). Pseudo-scents are synthetic aids that, ideally, mimic the smell of the genuine material (Stadler et al., 2012; Tipple et al., 2014). Non-pseudo alternatives include dilution, encapsulation, ad/absorption, or extraction of the targeted odor (Simon et al., 2020). The representability of pseudo-scents had been questioned (Stadler et al., 2012), while non-pseudo scent alternatives require validation (Simon et al., 2020).
Assessing the performance of working dogs allows the evolution of their field efficiency to be followed, and to correct for errors. However, scientific knowledge on post-training performance assessment remains scarce (Brady et al., 2018; Lazarowski et al., 2020). Most studies assess DD performance by measuring the duration (speed) and precision (number of false positives) of a task (Jezierski et al., 2014; Jamieson et al., 2017; Bennett et al., 2020). However, these approaches are not based on any definition of what is considered an efficient DD. This raises questions about the validity of these measures to assess DD performance. Hence, there is a need to define what an efficient DD is, to allow the development of a validated quantitative MAP (Johnen et al., 2013).
Thus, here, we aimed to define what an efficient DD is, and to develop a quantitative MAP. To accomplish this, we conducted 1) an international survey sent to professional DD practitioners (n = 50), and 2) an experimental assay performed on cadaver and drug DDs (n = 20). Our results are expected to help define what an efficient DD is, and generate a baseline quantitative MAP.
Materials and methods
Survey
A survey (LimeSurvey®) containing six questions based on empirical information (DD handlers in Belgium) and scientific literature (Table 1) was compiled. This survey was sent to the international police network for law enforcement dog professionals (Kynopol). The agency then forwarded the survey to all affiliated DD brigades globally. Twenty-five handlers and 25 brigade supervisors from Europe answered the survey between March 30 and 27 April 2021.
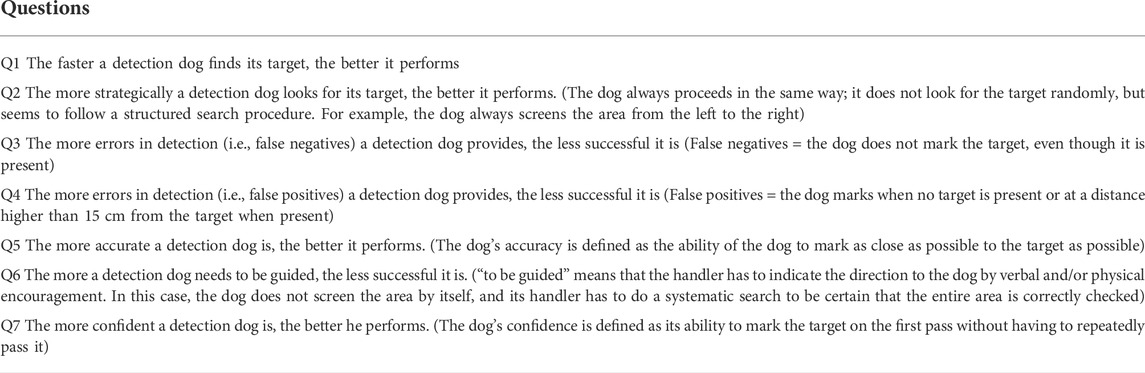
TABLE 1. Survey sent to DD handlers belonging to the Kynopol network. For each question, a grade from 1 (strongly disagree) to 10 (totally agree) had to be given.
Quantitative methods assessing the performance
Four human remains DD-handler teams (sex of dogs: male; breed: Springer spaniel) and 16 drug DD-handler teams (sex of dogs: nine males and seven females; breed: six Springer spaniels, eight Belgian shepherds, and two German shepherds) were used to validate a new quantitative method to assess performance (MAP) (Figure 1). All teams belonged to the Belgian federal police DACH (canine support direction). DDs belonged to operational police forces, and had between 2 and 6 years of experience, with the exception of four dogs (1 year of experience). All dogs received training three times a week. Except for the one-year-operational DDs (for which no statistical analyses were available), drug DDs had performed 165 ± 35 police operations per year, while human remains DDs had performed 13 ± 3 police operations per year.
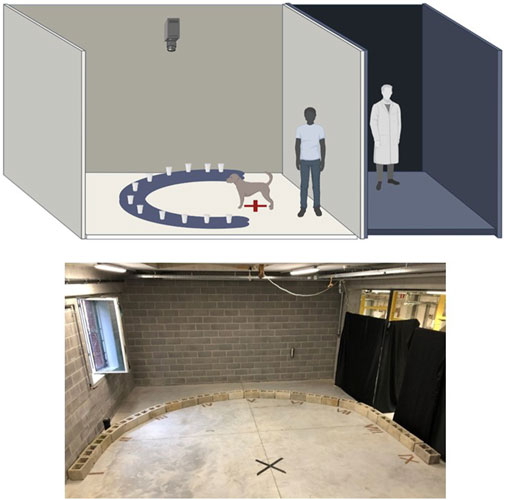
FIGURE 1. Behavioral arena formed of half circle cinderblocks, in which plastic cups were placed containing distractive and target odors. The dog started the odor search trial at an equal distance from each cinderblock. The handler stayed next to the detection dog (DD) to provide comments (motivation and starting), but was not allowed to guide the dog by pointing out any blocks. The experimenter stayed outside the arena to avoid the “clever Hans” effect, and followed the dog’s behavior on a screen linked to the camera placed above the arena.
Each dog-handler team participated to three sessions, separated at 1-month intervals. These sessions were considered by handlers as one of their dog’s weekly training sessions. Each session included 10 trials of target odor tasks in an arena (6 × 8 m) kept at 20°C. One session lasted about 2 h per dog. Between sessions, the room was naturally ventilated for 1 h, and the floor was cleaned with soap (Dettol®) to remove all odors from previous sessions. Twenty-five cinderblocks were placed in half a circle (d = 6 m, Figure 1). An empty plastic cup was placed in each cinderblock. In eight of the 10 trials, four distractive odors and one target odor (see odor section) were randomly placed in some of the 10 cups using “alea” function in excel. All other cups were filled with blank gauzes. Two control trials were included in each session: distractive odors only were dispatched in the blocks for Trial 1, and at random in one of the other nine trials. Handlers were advised that the first trial was a control one. This first control was performed to confirm that the arena was not contaminated by previous assays. Regarding the second control, we advised handlers that some control searches were implemented through the session. However, they were not aware of the number of controls per session neither when the control was performed, to have a double-blind assay. To avoid cross contamination, the experimenter changed gloves between the placement of distractive odors and target odor in the arena. To prevent the experimenter smell providing a clue for the dog to reach the target odor, all the blocks were touched with one hand without gloves before the beginning of the trial.
Each trial was initiated by placing the dog at an equal distance from each odor source (Figure 1). A Go-Pro camera, hanging from the ceiling (h = 3 m) was used to record how dogs worked. The Go-Pro was directly connected to a video monitor outside the arena (hidden experimenter), allowing live observation. To avoid the “clever Hans” effect” (Sebeok and Rosenthal, 1981), the handler did not know whether the test was a control or target search. The handler was allowed to stay next to their dog to give commands, but was not allowed to guide the dog by pointing out any area of the arena. The signal to end the trial was given by the handler, by orally indicating the presence or absence of a target odor to the experimenter, as well as its position, if applicable. If the position was correct, handlers stopped the search and rewarded their dogs, if not, the search was stopped without rewarding dogs.
Odor
Four distractive odors were used for the quantitative MAP; namely, chocolate, toilet spray (Air Wick® aerosol, pure spring dew), fresh basil, and coffee. A week before a session, 20 sterile gauzes per odor were placed in a 2 L glass bottles containing 20 g chocolate, 20 g fresh basil, 20 g ground coffee, or was sprayed for 20 s with an odor spray. The bottles were then kept sealed at ambient temperature. The target odor for human remains DDs, provided by DD handlers, was made of paperclips that had been placed 1 month before each session in a plastic container with decaying human tissue. Paperclips were used as odor carriers for decaying human smell because it allows to trap a small amount of odors to avoid to saturate the arena with the decaying smell. The target odor for drug DDs was 1 g pure heroine, provided by the drug detection canine brigade supervisor placed in a plastic zipper bag.
Data collection
Video recordings were analyzed with tracking software (Ethovision®, Noldus®, Bejing China). Collected variables included: search duration, target frequency, zero angle, target angle, eye contact, previous angle, previous target angle, number of false negatives, number of false positives, distance of search (see Table 2 for descriptions of the variables). We hypothesized angles could be indicators of strategy, in particular if dogs always use same angles through searches.
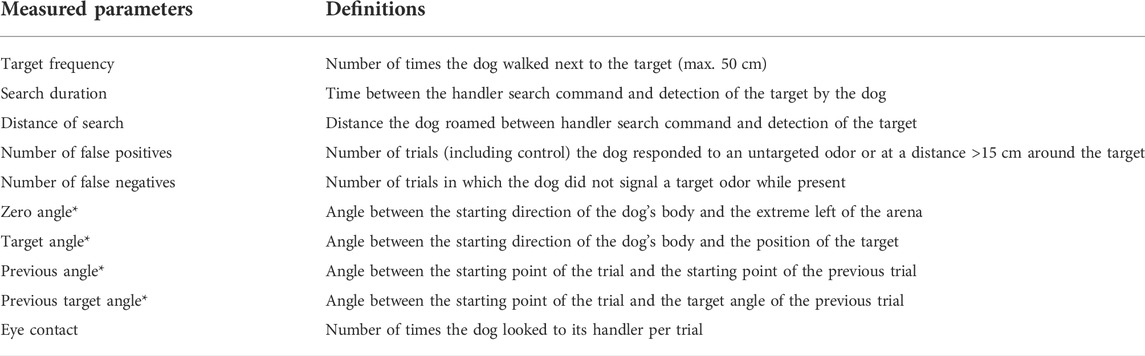
TABLE 2. Descriptions of the variables collected per trial from video recordings of the arena. Ten trials of odor search were conducted across sessions. (Parameters identified by * are presented in Supplementary Figure S1).
Qualitative methods assessing the performance by handlers and brigade supervisors
Information on dogs was collected through interviews with handlers and two brigade supervisors (one supervisor for human remains DDs and one for drug DDs) prior the quantitative MAP took place. The supervisors were asked to grade the performance of their dogs during police operations (Table 3).
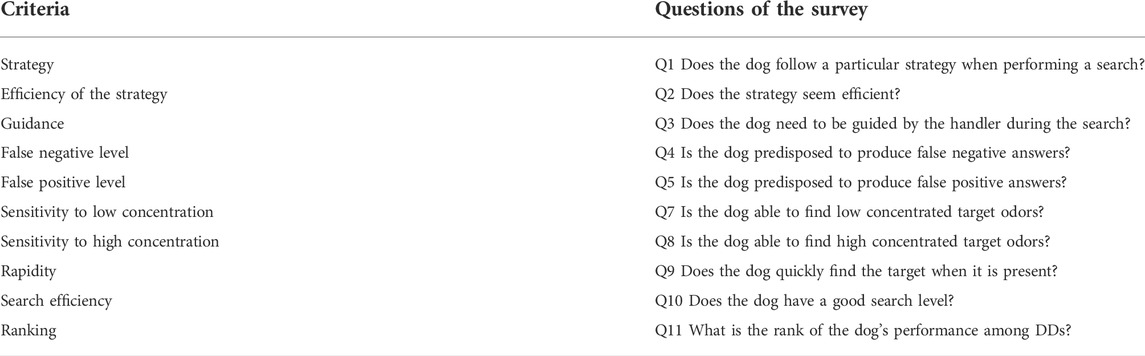
TABLE 3. Evaluation of detection dog (DD) operational performance by handlers and brigade supervisors. For each question, a graduation from 0 (no) to 10 (absolutely) was used.
Statistics
1) Survey and Qualitative MAP: Unpaired Student’s t-tests (“t-test” command, R-package stats, R studio) were used to compare the responses of surveyed international handlers and brigade supervisors. In addition to ranking different criteria in terms of importance, ANOVA was performed. 2) Quantitative MAP: To test for consistency between the three sessions of each DD, a PermMANOVA was performed on behavioral measures, including a type-one Bonferroni correction and 999 permutations (“adonis” command, R-package vegan, (Oksanen et al., 2017), R studio). The results of the PermMANOVA were illustrated using principal compound analysis (PCA) (“PCA” command, R-package FactoMineR, R studio). If no differences between sessions were detected, the mean and variance of each variable were calculated, except for false positive and false negative numbers, which were added together to obtain a global error rate. 3) Co-inertia analysis (COIA) (“coinertia” command, R-package ade4, R studio) was selected to enhance correlations among qualitative and quantitative MAPs (Dolédec and Chessel, 1994). To perform the COIA, a standard multivariate analysis as PCA was first computed on each MAP data set: qualitative MAP (PCA handlers MAP and PCA supervisors MAP) and quantitative MAP (PCA quantitative MAP) (“dudipca” command, R-package ade4, R studio). This method provided three pairs of axes: PCA (D1, D2) handlers MAP; PCA (D1, D2) supervisors MAP and PCA (D1, D2) quantitative MAP. The COIA uses the first plan of two PCAs to identify common trends in both datasets (by selecting axes that maximized the square covariance). Hence, three COIAs were performed allowing pairwise comparisons between each PCA: (COIA 1: PCA handlers MAP vs. PCA supervisors MAP, COIA 2: PCA handlers MAP vs. PCA quantitative MAP; COIA 3: PCA supervisors MAP vs. PCA quantitative MAP). The global correlation or co-structure of each COIA was measured by the RV coefficient (multivariate extension of the Pearson correlation coefficient), which ranged from 0 to 1, whereby a high RV-coefficient indicated a high degree of co-structure (Robert and Escoufier, 1976). COIA 1 allowed us to compare the evaluation of dogs by handlers versus the brigade supervisors. COIA 2 and 3 allowed us to compare the handlers and brigade supervisors qualitative MAP using the developed quantitative MAP. When a trend was highlighted between two axes (PCA dimensions), the axes correlations (behavioral parameters of PCA handlers and PCA supervisors, and measured data for PCA quantitative MAP) were confirmed using a correlation test (“cor.test” command, R-package stats, R studio) on variables explaining each axis.
Results
Survey
Twenty-five international DD handlers and 25 international DD brigade supervisors responded the survey about efficient DDs. The t-tests performed on each question (parameter) showed no difference in the responses of handlers versus supervisors: rapidity (t47,205 = −1.121; p-value = 0.268), strategy (t47,699 = −1.614; p-value = 0.113), false negative (t41,979 = −1.786; p-value = 0.081), false positive (t47,582 = −0.907; p-value = 0.369), accuracy (t44,35 = −0.583; p-value = 0.563), confidence (t43,912 = −1.729; p-value = 0.091), and guidance (t47,258 = −0.096; p-value = 0.924). The survey parameters to assess performance were grouped according to their importance (F6 = 91.04; p-value < 0.001; Figure 2): major importance (confidence, false positive, and false negative), medium importance (accuracy, strategy, and guidance) and minor importance (rapidity).
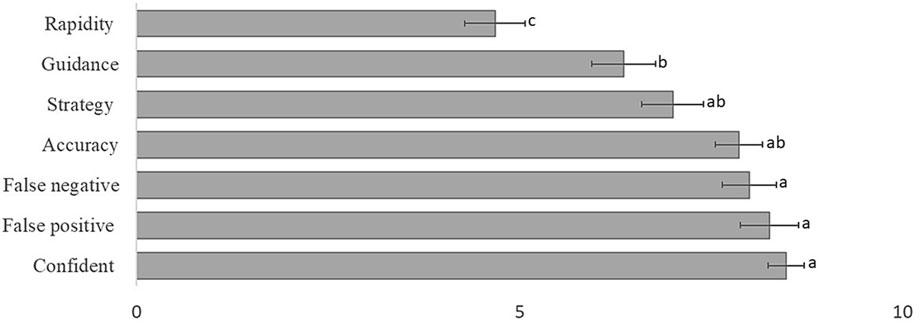
FIGURE 2. Importance of different criteria on the performance of detection dogs (DDs). These criteria were based on surveys completed by 25 DD brigade supervisors and 25 DD handlers. For a description of the criteria, see Table 1. More important criteria had higher ratings (modalities sharing the same letters are not different p > 0.05).
Quantitative methods assessing the performance accuracy
The means and standard deviations of each variable studied during the 490 trials were calculated and are presented, per session, in Table 4. When comparing recorded false positives and false negatives, DDs did not miss a target so often but could sometimes mark areas of the arena where the target was not present. Regarding the distance, dogs mostly focused their search around the cinderblock circle explaining the small distance covered in the arena during trials. DDs usually needed to pass next to the target several times before to show its presence to the handlers. During trials, eye contacts with handlers were mainly observed when dogs marked the target instead of during the search time. Finally, no particular pattern was observed regarding the angles studies in the quantitative MAP. The PermMANOVA highlighted no difference in behavioral responses across the three sessions (F2,57 = 1.449; p-value = 0.122; Supplementary Figure S2). Therefore, we can confirm that the accuracy of the quantitative MAP is respected.
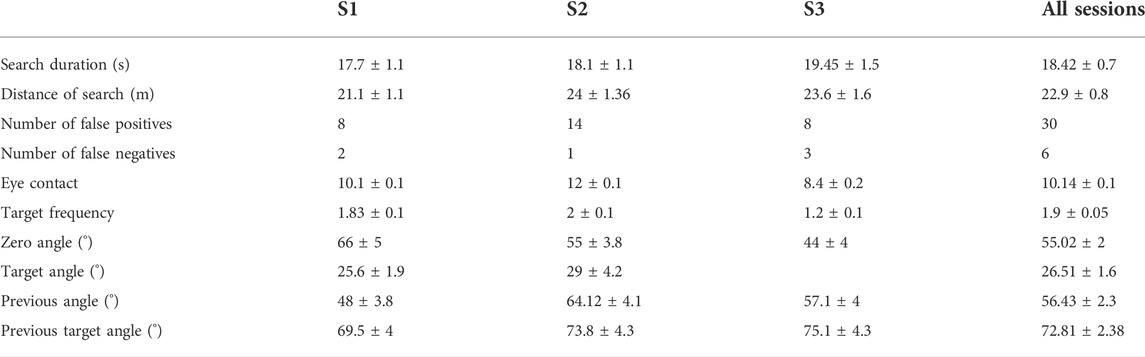
TABLE 4. Means and standard deviations of each studied quantitative MAP variables, in each of the 3 sessions (1-month intervals).
Principal compound analysis analyses
To interpret the COIAs, each PCA was first described (PCA handlers MAP, PCA supervisors MAP and PCA quantitative MAP) (Figure 3). The first factorial plane of the PCA handlers MAP explained 52.2% of variation in the handler’s evaluation. The five variables loaded on the first dimension (D1) were: Search efficiency, Sensibility to low concentration, False negative level, Ranking given by handlers, and Presence of a strategy (Table 3). The second dimension (D2) was explained by: Strategy, Sensitivity to high concentration, Efficacity of the strategy, and Rapidity (Table 3). The first factorial plane PCA supervisor MAP explained 71.3% of variation in the supervisor’s evaluation (Figure 3). The five variables loaded on the first dimension were: Efficacity of the strategy, Strategy level, Search efficacity, Rapidity, and Level of false positives. The second dimension was explained by: Guidance, Ranking, Sensibility to high concentration, Search efficacity, and Level of false positives. The PCA quantitative MAP explained 56.7% of variability in dog behavioral parameters (Figure 3). The criteria loaded on the first dimension were: Variance of frequency, Mean distance, Variance of distance, Variance of search time, Mean of frequency, Mean of time, and Variance in eye contact number. The second dimension was explained by: Variance of starting point angle, Mean of previous angle, Variance of targeted angle, Number of false negatives, Variance of previous angle, Mean starting angle, Number of false positives, and Mean of search time.
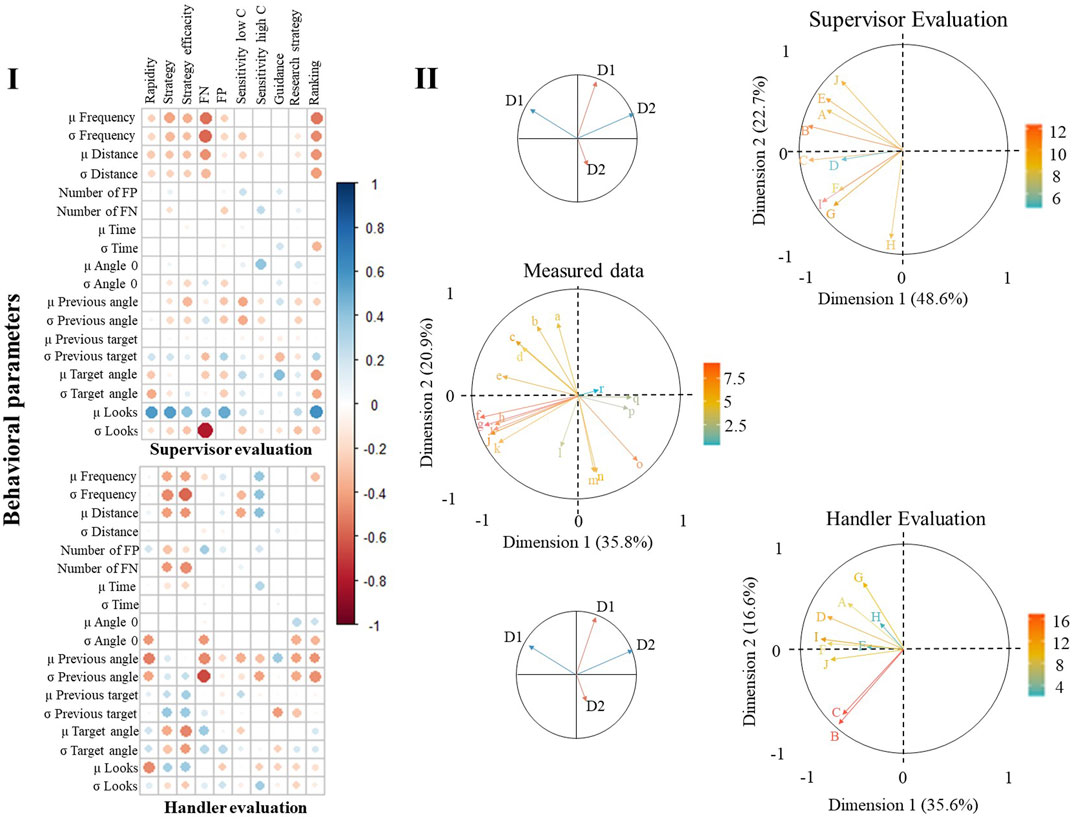
FIGURE 3. | Coinertia analyses (I) including the correlation (II) between the evaluation of the handlers or supervisor (top right correlation circle). A Rapidity; B: Strategy level; C: Strategy efficacity; D: False negative; E: False positive; F: Sensitivity to low concentration; G: Sensitivity to high concentration; H: Guidance; I: Search efficacity; J: Ranking. The data were measured during the behavioral tests (top left correlation circle). a: variance of angle between the start point and the target; b: number of false negative; c: number of false positive; d: mean of angle between the start point and the target; e: variance in eye contact; f: variance of frequency target zone visit; g: mean of distance; h: mean of frequency target zone visit; i: variance of search time; j: mean of search time; k: variance distance; l: mean starting point angle; m: mean precedent angle; n: variance starting point; o: variance previous angle, p: mean angle previous target; q: mean eye contact; r: variance previous target). The correlation between the dimensions of each correlation circle is represented in the two circles. Red: PCA dimension of the experiment; blue: PCA dimension of the evaluation of handler and supervisor, respectively. (The contribution of each variable is provided on the correlation circle).
Comparison of both qualitative methods assessing the performance (handlers and supervisors)
The COIA comparing the evaluation of dog performance by handlers versus brigade supervisors covered 86% of the observed variability in both qualitative MAPs (Supplementary Figure S2). Despite, similarities between both qualitative MAPs (RV = 0.31) no agreement between the two groups when assessing the performance of the same DD was observed. In fact, none of the qualitative criteria were correlated (R2 = −0.47, D1handlers vs. D1supervisor: t18 = 1.982; p-value = 0.063, D1handlers vs. D2supervisor: t18 = −0.926; p-value = 0.366 and D2handlers vs. D1supervisor: t18 = 0.565; p-value = 0.579); except one (D2handlers vs. D2supervisor: t18 = −2.220; p-value = 0.039). However, no agreement was found when comparing the variables explaining second dimensions in handlers’ and in supervisors’ qualitative MAPs, illustrating differences in rating DDs operational performance’ criteria (Table 3).
Quantitative methods assessing the performance validation
The COIA quantitative MAP vs. supervisors MAP explained 79.5% of total variability observed in both MAPs. The similarities between both MAPs identified a low level of concordance (RV = 0.23), which was confirmed by the absence of correlation between variables of the two first dimensions of both PCAs (quantitative MAP and Supervisor MAP). DD performance could not be assessed in the quantitative MAP, as supervisors assessed their performance during the qualitative MAP (D1PCA supervisors MAP vs. D1PCA quantitative MAP: t18 = −1.10; p-value = 0.287, D1PCA supervisors MAP vs. D2PCA quantitative MAP: t18 = −0.55; p-value = 0.589, D2PCA supervisors MAP vs. D2PCA quantitative MAP: t18 = −0.27; p-value = 0.792 and D2PCA supervisors MAP vs. D1PCA quantitative MAP: t18 = 1.07; p-value = 0.297). The COIA quantitative MAP vs. handlers MAP explained 81.3% of total variability observed in both MAPs. The similarities between MAPs were slightly higher than those for COIA quantitative MAP vs. Handlers MAP (RV = 0.34; Figure 3). A correlation test was performed on both dimensions from the first plan of the PCA quantitative MAP and PCA handlers MAP. Only the second dimension of the qualitative MAP was correlated with the first dimension of the quantitative MAP (D1PCA handlers MAP vs. D1PCA quantitative MAP: t18 = −0.57; p-value = 0.577, D1PCA handlers MAP vs. D2PCA quantitative MAP: t18 = −1.22; p-value = 0.238, D2PCA handlers MAP vs. D2PCA quantitative MAP: t18 = 1.20; p-value = 0.246 and D2PCA handlers MAP vs. D1PCA quantitative MAP: t18 = −3.59; p-value = 0.002). Some criteria of the handler evaluation were correlated with some measures in the quantitative MAP. One such correlation was detected in COIA quantitative MAP vs. handlers MAP: D2PCA handlers MAP vs. D1PCA quantitative MAP (t18 = −3.59; p-value = 0.002). To confirm this result, each variable from the first dimension of PCA quantitative MAP was tested with each criterion of evaluation from the second dimension of PCA handlers MAP using a correlation test. Six correlations were recorded: strategy level versus variance frequency (t18 = −2.32; p-value = 0.033; R2 = −0.48), strategy level versus variance in the distance (t18 = −2.55; p-value = 0.020; R2 = −0.51), efficacity of the strategy versus variance frequency (t18 = −2.94; p-value = 0.009; R2 = −0.57); efficacity of the strategy versus mean distance (t18 = −2.32; p-value = 0.033; R2 = −0.44); efficacity of the strategy versus variance in distance (t18 = −2.98; p-value = 0.008; R2 = −0.57), and efficacity of the strategy versus variance in time (t18 = −2.46; p-value = 0.024; R2 = −0.50). Thus, certain qualitative criteria in the evaluation used by handlers could be linked with quantitative measures in the quantitative MAP.
Discussion
This study identified and validated criteria for selecting appropriate detection dogs. Through our international survey, the defining the performance of DDs were delineated in order of importance: major (confidence, false positives, and false negatives), moderate (accuracy, strategy, and guidance), minor (rapidity). As such, efficient detection dogs were defined as confident animals, making few mistakes, alerting to the presence of target odors as close as possible, able to strategically screen the search area effectively, independent and not easily distracted. Team supervisors and dog handlers had different opinions regarding the qualitative MAPs of tested DDs. Only the qualitative MAP of handlers was correlated with quantitative measures, indicating that handlers were more reliable than supervisors in assessing DD performance. This difference was attributed to handlers knowing the strengths and weaknesses of their dogs better. This study provides new insights on how to define efficient DDs, and the reliability of the identified criteria as good predictors of performance.
The three criteria of major importance (confidence, false positives, and false negatives) supported the published literature (Meester et al., 2008; Sinn et al., 2010; Cablk and Sagebiel, 2011; Alexander et al., 2015; Martin et al., 2020). A dog’s confidence is typically measured as a fear response to a stimulus; specifically, the more confident the dog, the less fearful (Meester et al., 2008; Fratkin et al., 2015; Beebe et al., 2016). Hence, an efficient DD should express no fear (e.g., shaking, salivation) when performing searches. Fearful DDs should be scarce, as dogs should trained based on a positive reinforcement method, which reduces undesirable behaviors, including fear (Hiby et al., 2004; Blackwell et al., 2008). A good indicator of fear is the eye contact avoidance even if no correlation was observed on our data (Rooney et al., 2009). Eye contact can also be a good indicator of the intensity of the relation between the dog and the handler (Hare and Morgan, 2021). Reduced number of errors (including false positives and false negatives) is also a major criterion (Cablk and Sagebiel, 2011; Alexander et al., 2015). Errors may result from unintentional handler cues promoting DD responses (Curran et al., 2010; Greatbatch et al., 2015), or inappropriate training aids (Tipple et al., 2014; Rice and Koziel, 2015; Hayes et al., 2018), inadequate and variable training and working methods (Lit and Crawford, 2006; Lazarowski et al., 2019). Such errors should be identified during training or operation, and should be corrected by handlers to avoid recurrence. Previous studies highlight that sniffing duration represents a good way of identifying errors; the shorter the duration, the more correct the response (Concha et al., 2014). False positives and false negatives rates were calculated during the MAP validation. However, comparison of error rates to the level of error (false positives and negatives) identified by handlers and supervisors during MAP validation in our study showed no relationship; thus, it was not possible to delineate an acceptance threshold for errors to rank DDs. The mean error rates (false positives and false negatives rates) measured in this study could be used as tentative thresholds: 5% false positives and 1% false negatives. Other studies investigating the performance of DDs recorded success rate ranging of 83%–100% (Gazit and Joseph, 2003; Porritt et al., 2015; Angle et al., 2016; Dickey and Junqueira, 2021), with our results falling within this range.
Accuracy, as well as the strategy of the dog and guidance by the handler were of moderate importance when assessing DD performance. In our study, accuracy was defined as the ability of the dog to detect the targeted odor source, based on Cablk and Sagebiel (2011). Hence, accuracy was closely correlated with the level of error. For instance, if the dog marked the target odor too far away (that is more than 15 cm), it was considered as a false positive. Before the current study, there is no precedent on acceptable target-marks distance. Yet, this criterion is highly important, especially during police operations when odor sources must be detected with high precision, particularly if dangerous (e.g., explosive). Existing studies on DD search strategies were also lacking in the published literature. Our quantitative MAP showed that search strategies could be defined as the search behavior in a known environment. Because variance is a measure of data dispersion, the search strategy level was mainly explained by the variance of certain parameters (frequency of visiting the target zone, search time, and search distance), rather than the mean value. As all observed correlations were negative, the closer to the mean that a dog performs its search, the more strategic it is. In a known environment, then search behavior should be consistent, when defining a good dog strategy. This criterion could be assessed using the duration and distance covered by the search, including the number of times the dog passes at predefined distance thresholds of the target before reporting it. These parameters should be similar every time the dog repeats the search in the same environment (e.g., arena). Finally, professionals suggest that handlers should need to minimally guide efficient DDs. This criterion was directly correlated with dog independence. Thus, surveyed professionals considered an independent DD as efficiency. This criterion has been highlighted in the published literature as important, especially during DD selection (Martin et al., 2020). The more you guide a DD, the more distracted the dog becomes (Lazarowski et al., 2020). During the quantitative MAP in our study, handlers were not allowed to give any instruction to their dogs that were searching independently. Dependent dogs were expected to make more mistakes during the quantitative MAP. Ultimately, a clear definition and measure of DD independence would help enhance the proposed method.
Finally, the rapidity of searches was ranked as a minor important criterion, as the main goal of DDs is to locate the target. Whether the dog is fast or not, is not relevant to the quality of the dog’s work.
Conclusion
This study provided the first definition of performance in the framework of DD work by professionals, and validated it through objective trials. Future studies should implement DD performance evaluation throughout the entire training process. This way of monitoring performance would allow thresholds to be delineated to identify efficient DDs, as well as to identify factors affecting performance during conditioning (e.g., dog breed, gender, and training aids).
Data availability statement
The raw data supporting the conclusion of this article will be made available by the authors, without undue reservation.
Ethics statement
Ethical review and approval was not required for the present study as detection dogs which participated to the study did not submit an animal experimentation. Indeed, we asked dogs to perform research in an arena as they could do during an operation with police forces. They therefore did a detection as they could do it during any daily operation. In this context an ethical review and approval was not required. They were not in contact with any chemical substance and no invasive experiments were performed. Written informed consent was obtained from the owners for the participation of their animals in this study.
Author contributions
CM: Conceptualization, methodology, formal analysis, data curation, software, writing—original draft. NW: Formal analysis. SD: Formal analysis. VM: Formal analysis. ST: Methodology. SB: Methodology. YB: statistical analysis. FV: Conceptualization, methodology, supervision, project administration, writing—review and editing, funding acquisition. CD: conceptualization, methodology, supervision, project administration, writing—review and editing, funding acquisition.
Funding
This work was funded with research unit funding (TERRA and NARILIS).
Acknowledgments
Authors thank Chloé Galland, Antoine Boullis and Nicolas Leroy for the support and advices provided during the writing of the paper.
Conflict of interest
The authors declare that the research was conducted in the absence of any commercial or financial relationships that could be construed as a potential conflict of interest.
Publisher’s note
All claims expressed in this article are solely those of the authors and do not necessarily represent those of their affiliated organizations, or those of the publisher, the editors and the reviewers. Any product that may be evaluated in this article, or claim that may be made by its manufacturer, is not guaranteed or endorsed by the publisher.
Supplementary material
The Supplementary Material for this article can be found online at: https://www.frontiersin.org/articles/10.3389/frans.2022.932857/full#supplementary-material
References
Alexander, M. B., Hodges, T. K., Bytheway, J., and Aitkenhead-Peterson, J. A. (2015). Application of soil in forensic science: residual odor and HRD dogs. Forensic Sci. Int. 249, 304–313. doi:10.1016/j.forsciint.2015.01.025
Angle, T. C., Passler, T., Waggoner, P. L., Fischer, T. D., Rogers, B., Galik, P. K., et al. (2016). Real-time detection of a virus using detection dogs. Front. Vet. Sci. 2, 79. doi:10.3389/fvets.2015.00079
Beebe, S. C., Howell, T. J., and Bennett, P. C. (2016). Using scent detection dogs in conservation settings: a review of scientific literature regarding their selection. Front. Vet. Sci. 3, 96. doi:10.3389/fvets.2016.00096
Bennett, E. M., Hauser, C. E., and Moore, J. L. (2020). Evaluating conservation dogs in the search for rare species. Conserv. Biol. 34 (2), 314–325. doi:10.1111/cobi.13431
Blackwell, E. J., Twells, C., Seawright, A., and Casey, R. A. (2008). The relationship between training methods and the occurrence of behavior problems, as reported by owners, in a population of domestic dogs. J. Vet. Behav. 3 (5), 207–217. doi:10.1016/j.jveb.2007.10.008
Brady, K., Cracknell, N., Zulch, H., and Mills, D. S. (2018). Factors associated with long-term success in working police dogs. Appl. Animal Behav. Sci. 207, 67–72. doi:10.1016/j.applanim.2018.07.003
Cablk, M. E., and Sagebiel, J. C. (2011). Field capability of dogs to locate individual human teeth. J. Forensic Sci. 56 (4), 1018–1024. doi:10.1111/j.1556-4029.2011.01785.x
Concha, A., Mills, D. S., Feugier, A., Zulch, H., Guest, C., Harris, R., et al. (2014). Using sniffing behavior to differentiate true negative from false negative responses in trained scent-detection dogs. Chem. Senses 39 (9), 749–754. doi:10.1093/chemse/bju045
Curran, A. M., Prada, P. A., and Furton, K. G. (2010). Canine human scent identifications with post-blast debris collected from improvised explosive devices. Forensic Sci. Int. 199 (1–3), 103–108. doi:10.1016/j.forsciint.2010.03.021
Dickey, T., and Junqueira, H. (2021). Toward the use of medical scent detection dogs for COVID-19 screening. J. Osteopath. Med. 121 (2), 141–148. doi:10.1515/jom-2020-0222
Dolédec, S., and Chessel, D. (1994). Co-inertia analysis: an alternative method for studying species–environment relationships. Freshw. Biol. 31 (3), 277–294. doi:10.1111/J.1365-2427.1994.TB01741.X
Fratkin, J. L., Sinn, D. L., Scott, T., Stewart, H., Olson, Z., and Gosling, S. D. (2015). Do you see what I see? Can non-experts with minimal training reproduce expert ratings in behavioral assessments of working dogs? Behav. Process. 110, 105–116. doi:10.1016/j.beproc.2014.09.028
Gazit, I., and Joseph, T. (2003). Explosives detection by sniffer dogs following strenuous physical activity. Appl. Animal Behav. Sci. 81 (2), 149–161. doi:10.1016/S0168-1591(02)00274-5
Greatbatch, I., Gosling, R. J., and Allen., S. (2015). Quantifying search dog effectiveness in a terrestrial search and rescue environment. Wilderness Environ. Med. 26 (3), 327–334. doi:10.1016/j.wem.2015.02.009
Hackner, K., and Pleil, J. (2017). Canine olfaction as an alternative to analytical instruments for disease diagnosis: understanding ‘dog personality’ to achieve reproducible results. J. Breath. Res. 11 (1), 012001. doi:10.1088/1752-7163/aa5524
Hare, B., and Morgan, F. (2021). Is cognition the secret to working dog success? Anim. Cogn. 24 (231), 231–237. doi:10.1007/s10071-021-01491-7
Harper, R. J., and Furton, K. G. (2007). “Biological detection of explosives,” in Counterterrorist detection techniques of explosives. Editor J. Yinon (Elsevier Science B.V), 395–431. doi:10.1016/B978-044452204-7/50032-8
Hayes, J. E. E., McGreevy, P. D. D., Forbes, S. L. L., Laing, G., and Stuetz, R. M. M. (2018). Critical review of dog detection and the influences of physiology, training, and analytical methodologies. Talanta 185, 499–512. doi:10.1016/j.talanta.2018.04.010
Hiby, E. F., Rooney, N. J., and Bradshaw, J. W. S. (2004). Dog training methods: their use, effectiveness and interaction with behaviour and welfare. Anim. Welf. 13 (1), 63–69.
Hussein, A. K., Sullivan, M., and Penderis, J. (2012). Effect of brachycephalic, mesaticephalic, and dolichocephalic head conformations on olfactory bulb angle and orientation in dogs as determined by use of in vivo magnetic resonance imaging. Am. J. Vet. Res. 73 (7), 946–951. doi:10.2460/ajvr.73.7.946
Jamieson, L. T. J., Baxter, G. S., and Murray, P. J. (2017). Identifying suitable detection dogs. Appl. Animal Behav. Sci. 195, 1–7. doi:10.1016/j.applanim.2017.06.010
Jezierski, T., Adamkiewicz, E., Walczak, M., Sobczyńska, M., Górecka-Bruzda, A., Ensminger, J., et al. (2014). Efficacy of drug detection by fully-trained police dogs varies by breed, training level, type of drug and search environment. Forensic Sci. Int. 237, 112–118. doi:10.1016/j.forsciint.2014.01.013
Johnen, D., Heuwieser, W., and Fischer-Tenhagen, C. (2013). Canine scent detection-fact or fiction? Appl. Animal Behav. Sci. 148 (3–4), 201–208. doi:10.1016/j.applanim.2013.09.002
Lazarowski, L., Paul Waggoner, L., Krichbaum, S., Singletary, M., Haney, P., Rogers, B., et al. (2020). Selecting dogs for explosives detection: behavioral characteristics. Front. Vet. Sci. 7, 597. doi:10.3389/fvets.2020.00597
Lazarowski, L., Rogers, B., Waggoner, L. P., and Katz, J. S. (2019). When the nose Knows: ontogenetic changes in detection dogs’ (Canis familiaris) responsiveness to social and olfactory cues. Anim. Behav. 153, 61–68. doi:10.1016/j.anbehav.2019.05.002
Lit, L., and Crawford, C. A. (2006). Effects of training paradigms on search dog performance. Appl. Animal Behav. Sci. 98 (3–4), 277–292. doi:10.1016/j.applanim.2005.08.022
Martin, C., Diederich, C., and Verheggen, C. (2020). Cadaver dogs and the deathly hallows — a survey and literature review on selection and training procedure. Animals 10 (1219), E1219. doi:10.3390/ani10071219
Meester, R. H. D., De Bacquer, D., Peremans, K., Simon, V., Planta, D. J., Coopman, F., et al. (2008). A preliminary study on the use of the socially acceptable behavior test as a test for shyness/confidence in the temperament of dogs. J. Vet. Behav. 3 (4), 161–170. doi:10.1016/j.jveb.2007.10.005
Oksanen, J., Blanchet, F. G., Friendly, M., Kindt, R., Legendre, P., Mcglinn, D., et al. (2017). Package vegan: community ecology package. R Package Version 2.0-7.
Polgár, Z., Kinnunen, M., Ujváry, D., Miklósi, A., Gácsi, M., Újváry, D., et al. (2016). A test of canine olfactory capacity: comparing various dog breeds and wolves in a natural detection task. PLoS One 11 (5), e0154087. doi:10.1371/journal.pone.0154087
Porritt, F., Mansson, R., Berry, A., Cook, N., Sibbald, N., and Steve, N. (2015). Validation of a short odour discrimination test for working dogs. Appl. Animal Behav. Sci. 165, 133–142. doi:10.1016/j.applanim.2014.11.021
Quignon, P., Rimbault, M., Robin, S., and Galibert, F. (2012). Genetics of canine olfaction and receptor diversity. Mamm. Genome 23 (1–2), 132–143. doi:10.1007/s00335-011-9371-1
Rice, S., and Koziel, J. A. (2015). The relationship between chemical concentration and odor activity value explains the inconsistency in making a comprehensive surrogate scent training tool representative of illicit drugs. Forensic Sci. Int. 257, 257–270. doi:10.1016/j.forsciint.2015.08.027
Robert, P., and Escoufier, Y. (1976). A unifying tool for linear multivariate statistical methods: the RV-coefficient. Appl. Stat. 25 (3), 257–265. doi:10.2307/2347233
Rooney, N., Gaines, S., and Hiby, E. (2009). A practitioner’s guide to working dog welfare. J. Vet. Behav. 4 (3), 127–134. doi:10.1016/j.jveb.2008.10.037
Sebeok, T. A., and Rosenthal, R. (1981). The clever Hans phenomenon: communication with horses, whales, apes, and people. Ann. N. Y. Acad. Sci. 47, 1–309.
Simon, A., Lazarowski, L., Singletary, M., Barrow, J., Arsdale, K. V., Angle, T., et al. (2020). A review of the types of training aids used for canine detection training. Front. Vet. Sci. 7, 313. doi:10.3389/fvets.2020.00313
Sinn, D. L., Gosling, S. D., and Stewart, H. (2010). Personality and performance in military working dogs: reliability and predictive validity of behavioral tests. Appl. Animal Behav. Sci. 127 (1–2), 51–65. doi:10.1016/j.applanim.2010.08.007
Stadler, S., Stefanuto, P.-H., Byer, J. D., Brokl, M., Forbes, S. L., and Focant, J.-F. (2012). Analysis of synthetic canine training aids by comprehensive two-dimensional gas chromatography-time of flight mass spectrometry. J. Chromatogr. A 1255, 202–206. doi:10.1016/j.chroma.2012.04.001
Thrailkill, E. A., Porritt, F., Kacelnik, A., and Bouton, M. E. (2018). Maintaining performance in searching dogs: Evidence from a rat model that training to detect a second (irrelevant) stimulus can maintain search and detection responding. Behav. Process. 157, 161–170. doi:10.1016/j.beproc.2018.09.012
Keywords: discriminative olfactory stimulus, scent detection dogs, working dog, performance assessment, forensic science
Citation: Martin C, Willem N, Desablens S, Menard V, Tajri S, Blanchard S, Brostaux Y, Verheggen F and Diederich C (2022) What a good boy! Deciphering the efficiency of detection dogs. Front. Anal. Sci. 2:932857. doi: 10.3389/frans.2022.932857
Received: 30 April 2022; Accepted: 03 August 2022;
Published: 30 August 2022.
Edited by:
James J. Harynuk, University of Alberta, CanadaReviewed by:
Shari L. Forbes, Université du Québec à Trois-Rivières, CanadaAlison G. Simon, Oklahoma State University Center for Health Sciences, United States
Copyright © 2022 Martin, Willem, Desablens, Menard, Tajri, Blanchard, Brostaux, Verheggen and Diederich. This is an open-access article distributed under the terms of the Creative Commons Attribution License (CC BY). The use, distribution or reproduction in other forums is permitted, provided the original author(s) and the copyright owner(s) are credited and that the original publication in this journal is cited, in accordance with accepted academic practice. No use, distribution or reproduction is permitted which does not comply with these terms.
*Correspondence: Claire Diederich, Y2xhaXJlLmRpZWRlcmljaEB1bmFtdXIuYmU=