 Alejandro J. Mancilla-Rico
 Eduardo Rodríguez de San Miguel*
- Departamento de Química Analítica, Facultad de Química, Universidad Nacional Autónoma de México (UNAM), Ciudad Universitaria, Mexico City, Mexico
Polymer inclusion membranes (PIMs) are developed to be used as colorimetric sensors for the simultaneous determination and quantification of Cu(II), Zn(II), Pb(II) from aqueous solutions using chemometric methods. Different physical and chemical factors that influence the detection process of the analytes are studied, i.e., the concentration of the metal cation, the amount of membrane, and the pH of the solution. The most significant variables within the detection process in membrane sensors are those that are closely related to the chemical reaction of the detection, that is, the concentration of the metal cation and the number of active sites available in the optomembrane. The reversibility and durability of the signal are evaluated as well. The optomembrane reaches 95% of the optical signal attributed to the process of formation of the different colorful complexes in 20 min, regardless of the metal cation. The optomembrane of CTA—TEHP—PAN presents a very narrow linear interval of response to the concentration of the cations, Zn(II) and Cu(II) ranging from 0.6 to 6 ppm; for higher concentrations the polymeric detector presents saturation. The response of the sensor to different concentrations of Pb(II) is not linear, which can be attributed to the lack of chemical affinity to generate the complex in the polymer film. The simultaneous determination of the three metal cations by three chemometric methods [multivariate curve resolution (MCR), artificial neural networks (ANNs) and partial least squares (PLS)] is performed with an experimental central composite design matrix at five levels and three experimental factors. The construction of the quantification model is carried out from the information obtained from the VIS spectrum of the PIMs exposed to the aqueous solutions. The predictive power of the quantification models for each of the metal cations is evaluated contemplating the determination coefficient (R2) and the root mean square error (RMSE) values. Results favors the use of the PLS algorithm, although due to the competition for the actives sites of the chromophore, Pb(II) determination is not satisfactorily acomplished. Principal component analysis (PCA) is in addition employed to visualize patterns in the synthesized membranes.
1 Introduction
The large-scale production of a wide variety of chemical compounds and their subsequent discharge into natural ecosystems has caused the global deterioration of the environmental quality of these areas. Among these chemical species are metals in aqueous media, which are highly toxic and represent a serious threat to human health and a major cause of environmental catastrophes (Tharakeswar et al., 2012; Zawierucha et al., 2016).
Optical sensors are defined as compact materials capable of responding with high sensitivity and selectivity to the presence of metal ions, generating optical information. If the effects and the information generated on the material are reversible, the material is said to be a sensor, on the contrary, if the effects are irreversible, the material is a probe. Sensors and probes for metals are usually plasticized polymer films or thin membranes doped with an ionophore, fluorescent compounds, enzymes, chromogenic agents that react with the analyte (usually metal cations, anions, or neutral molecules) to produce a change in the optical properties of the material (color, fluorescence, refractive index) and whose detection is generally chemical. Despite the wide variety of selective reagents, some of the optical indicators react with more than one metal ion, so the selectivity can be adjusted with a suitable pH. For indicators with limited selectivity, it is possible to co-immobilize masking agents such as fluoride to eliminate unwanted interference from the presence of other metal ions, even some devices contain reducing agents to convert the analyte through a redox process into more species related to the chemical detector. The optical response of the sensors can be interpreted by various spectroscopic methods such as ultraviolet-visible, infrared or fluorescence spectroscopy. The sensors can be presented in a considerable variety of devices in the form of disposable strips, adapted to optical fibers or capillary devices, among others. In addition, the use of specific indicators and the possibility of covering a wide spectrum of wavelengths together with the use of multivariate analysis techniques improve the quality of the results (Oehme and Wolfbeis, 1997; Ensafi et al., 2008).
The analysis of the information provided by the sensors can be better exploited by making use of multivariate analysis techniques. The objective of multivariable calibration is the simultaneous determination of several analytes or that of a single analyte in the presence of a complex matrix that participates in the analytical signal. In this sense, univariate calibration can be considered as a special case of multivariate, in which a single analyte is determined by measuring the analytical signal of a single specific variable, in an interference-free matrix, that is, an ideal situation. In chemical analysis it is often difficult to obtain situations close to ideality, there is always some noise in the measurement, the data is affected by chemical and physical interferences, and the instrument does not always respond linearly to changes in the concentration of the analyte. Non-linear responses can be attributed to instrumental causes, physical or chemical causes that can cause curvatures in the concentration-response function, shift in band position or changes in band width (Blanco and Cerdà, 2007). In many cases it may be impossible to do the physical separation in the previous treatment of the sample and in other cases it is necessary to quantify the analyte and to know the interfering substances, making the determination complicate. With multivariable calibration certain interference and non-linearity problems can be satisfactorily resolved, in addition to improving selectivity by signal splicing correcting the interferer signal mathematically. Simultaneous analyses with optodes have successfully been reported previously in the literature for the determination of Zn2+ and Cd2+ mixtures using 2-(5-bromo-2-pyridylazo)-5-(diethylamino) phenol immobilized onto XAD-4 using a single-wavelength kinetic approach coupled with a regression model (Kuswandi et al., 2001), for the simultaneous determination of Zn(II), Cd(II) and Hg(II) in water employing an optode based on the 2-(5-bromo-2-pyridylazo)-5-(diethylamino)phenol (Br-PADAP) complex immobilized on Amberlite XAD-4 resin using artificial neural networks (ANNs) (Raimundo and Narayanaswamy, 2003), and more recently, for the simultaneous detection of Fe(III) and Al(III) by fixing Alizarin Red S on an inert solid support (Colour Catcher®) using Partial Least Squares regression (PLS) (Biesuz et al., 2019), and for Co(II), Ni(II), and Zn(II) determination with 1-(2-pyridylazo)-2-naphthol (PAN), and Mg(II) and Ca(II) determinations with Eriochrome Black T (EBT) on the “Colour Catcher®” support using PLS (Alberti et al., 2020) as well.
As for Kuswandi et al. (2001), they found differences in the complete reflectance spectra of Zn2+ and Cd2+, but none of the wavelengths could be selected for any of the complexes, as the response at a particular wavelength was affected by more than one metal ion. So, a full-spectrum method was not used. Then by taking advantage of the differences in the kinetic behavior of the systems, it was possible to determine the metals using simple regression lines. This was done by fitting the slopes of the single-wavelength kinetic profiles as a function of metal ion concentration. Although its novelty, the main disadvantage of the approach is the necessity of evaluating the kinetic profiles before quantification. Raimundo and Narayanaswamy (Raimundo and Narayanaswamy, 2003) used also a non-full-spectrum method, measuring reflectance intensities at specific wavelengths to fit the ANN regression models for simultaneous determination of Zn(II), Cd(II) and Hg(II) in water. Although, different concentration ratios were employed in both referred works, the advantage of using experimental design (DoE) methodologies to ensure independent variations of the metal ions concentrations, a case of practical implications, was not explored. In contrast to the cited works, Biesuz et al. (2019) and Alberti et al. (2020) used DoE strategies and full-spectrum methodologies to fit PLS regression models to their target analytes, obtaining excellent results. Despite these PLS and ANN models, its current authors’ opinion that a comparison among different chemometrics algorithms using DoE strategies and full-spectrum methods is still missing in the literature of multivariate quantitative VIS sensor analysis.
Polymeric inclusion membranes (PIMs) are a kind of membranes which has been employed to recover numerous metal ions and some very small organic compounds. The nature of the PIMs depends on the components used in their preparation, which in turn depends on the analyte of interest to be determined. In general, they are composed of a base polymer, a carrier that can be an acid, a base, chelating agents, or macrocyclic compounds (depending on the application) and a plasticizer that together form a thin, stable, flexible, and very versatile film (Nghiem et al., 2006). And it is precisely its versatility that has made this type of membrane having different applications (Almeida et al., 2017), such as its use in sample pretreatment, passive samplers and as sensors, which is the application of special interest in the present work. Such application requires the incorporation of the appropriate chromophore according to the objective analyte. The use of PIMs has been reported in the determination of metals and as chromophores, for example, 4-hydroxysalofen (Ensafi et al., 2008) and 2-aminocyclopentene-1-dithiocarbozyl acid (Ensafi and Isfahani, 2011) for cadmium, derivatives of rhodamine (Thakur et al., 2015) for Mercury, or 1-(2-pyridylazo)-2-naphthol (PAN) for copper (Manori Jayawardane et al., 2013), as well as other synthetic organic compounds (Aksuner, 2011) with promising results. However, to the best of our knowledge, the simultaneous analysis of different metal ions in this type of optode material has not previously been reported.
Long time ago PAN has been known to have chelating properties with many metal ions making it suitable as an indicator in complexometric titrations (Cheng and Bray, 1955). It acts as a terdentate ligand, complexing with metals through the hydroxyl oxygen atom, pyridine nitrogen atom, and one of the azo group nitrogen atoms. Metal complexes are extractable with inert solvents, such as chloroform or benzene, permitting the extractive-spectrophotometric determination of Mn, Zn, Cd, Cu, Ni, Co., In, U, Ga and Pd, as the molar absorptivities of the PAN complexes lie within the range (2–6) x 104 and the absorption maxima (λmax) of the complexes are usually very different from that of the reagent (Marczenko and Balcerzak, 2000). Its applicability to metal determination in waters is favor because the alkali and alkaline earth metals do not form colored chelates with the dye (Cheng and Bray, 1955).
Wastewater, especially treated sewage effluents (TSE), are used for irrigation of agriculture fields in some regions because of the increasing constraint in the availability of fresh water for irrigation, particularly in urban and peri–urban centers (Sayo et al., 2020). The heavy metal ion content in such effluents varies in the low ppm range (Al-Musharafi et al., 2013; Sayo et al., 2020). Then, to ensure the safe use of TSE for irrigation, it is important to conduct continuous monitoring and pollution control in such samples in a practical, fast, and economical form. Considering this, the aim of this work is to develop and evaluate the performance of a PIM optomembrane dopped with PAN for the colorimetric identification and simultaneous quantification of three selected metal cations, Pb(II), Cu(II) and Zn(II), in aqueous phases using the MCR (multivariate curve resolution), ANNs, and PLS chemometric techniques. Principal component analysis (PCA) was used as well to explore common characteristics among the systems. The target metal ions were chosen so that a wide range of equilibrium constant values of the complexes with the chromophore reagent are expected (Cu(II) > Zn (II) > Pb(II)) (Qureshi and Cheema, 1974), along with slight differences in their absorption spectra (Cheng and Bray, 1955).
2 Experimental
2.1 Reagents and materials
Cellulose triacetate—CTA—(Fluka) was used as supporting polymers, tris(2-ethylhexyl) phosphate—TEHP—(97%, Aldrich) as plasticizers, and 1-(2-pyridylazo)-2-naphthol (Sigma Aldrich, indicator grade) as metallochromic agent to detect the metal cations in the polymer. In the preparation of the PIMs, ethanol (99%, Analytyka) and methylene chloride (99%, Alvi) were employed.
The solutions of Pb(II), Zn(II) and Cu(II) used in the different experiments were prepared by weighing the necessary amount of lead nitrate, copper chloride dihydrate, and zinc chloride. The aqueous solutions at pH between 5 and 6 were buffered with 2-(N-morpholine) ethane sulfonic acid—MES—(99.5%, Sigma) at a concentration of 0.01 M. For the experiments at pH between 7 and 9, the solutions were buffered with tris(hydroxymethyl) aminomethane—TRIS—(99.8%, Aldrich), preparing a 0.01 M solution. The adjustment of these buffered solutions was performed with 1 M HNO3 (65.4%, J. T. Baker) and 1 M NaOH (97%, Meyer).
Standards for atomic absorption spectroscopy of Pb 1,000 ± 4 mg L−1 (Fluka Analytical), Zn 1,000 ± 4 mg L−1 (Fluka Analytical), and Cu 1,000 ± 4 mg L−1 (Fluka Analytical) were employed in the preparation of the aqueous solutions.
To regenerate the optomembrane signal 0.01 M EDTA (99.8%, J. T. Baker), HNO3 (ACS reagent, 70%, Merck) and HCl (36.5–38.0%, Baker) were used.
2.2 Instrumentation
The pH readings were performed on a Cole-Parmer glass electrode coupled to a Metrohm 620 potentiometer. The UV - VIS spectra of the optomembranes were obtained from a 3 cm long by 1.5 cm wide sample of the polymer, specifically from the central part of the membrane, which was placed in the measurement cell of an UV-VIS spectrophotometer (double-beam Perkin Elmer brand Lambda 2 model controlled by UV WinLab 2.0 software). Each spectrum was scanned from 700 to 350 nm with a speed of 240 nm min−1, with a resolution of 1 nm. A colorless CTA-TEHP polymeric film with a composition of 33% w/w CTA and 67% w/w TEHP was used as blank. Infrared spectroscopy characterization was performed with a Perkin Elmer Spectrum GX Fourier transform infrared spectrometer. The quantification of the samples was performed with a Perkin Elmer model 3,100 atomic absorption spectrometer, with Perkin Elmer hollow cathode lamps for lead and copper and a Perkin Elmer electrode discharge lamp for zinc.
2.3 Software
The statistical analysis of the data was carried out with the Statgraphics Centurion XVI.I program, while the construction of the MCR and PLS models were performed using The Unscrambler X 10.4 software. The acquisition and treatment of the infrared spectra were performed with the 5.0.2 Spectrum program that controls the instrument, while the UV-Visible spectra with the 2.0 WinLab program. Editing of ultraviolet-visible spectra was performed with the 1.0.7 SpectraGryph spectroscopy software. The ANN models were performed using the Sequential, Dense, and Early stopping (Tensor flow) Python modules of Keras with the train test split, r2 score, and mean squared error modules of Sklearn in a home-built Python program.
2.4 Preparation of the optomembranes
1,600 mg of CTA, 3,200 mg of TEHP and 15 mg of PAN were weighed separately. These components were dissolved under continuous stirring with a magnetic bar for 120 min in a mixture of 40 ml of ethanol and 100 ml of dichloromethane. The mixture obtained is yellow-orange in color and translucent. It was poured into a 200 ml volumetric flask, calibrated with dichloromethane and homogenized. An aliquot of 10 ml was taken and poured into a Petri dish (Steriplan) with a diameter of 5 cm, covered, and the mixture was allowed to evaporate for at least 48 h, at room temperature and humidity. Finally, a translucent yellow polymeric film, homogeneous at the naked eye, was obtained.
2.5 Stirring of the system
The extraction of the metal cation with the CTA-TEHP-PAN PIM was carried out by placing it with 25 ml of aqueous solution at pH and defined concentration of the metal in a 250 ml beaker (KIMAX) under continuous stirring. Stirring was carried out on an KS 260 IKA orbital plate shaker at a speed of 1/100 min−1 for 60 min to simulate the operation of this detector on the surface and static water bodies.
2.6 Measurement of the thickness, diameter, and weight of the optomembrane
The thickness of the optomembrane was measured at nine equally spaced points (A—I) in the central part of the polymer for nine films from different batches with a IP54 Fowler electronic micrometer. Membrane diameter was measured with a CAL-6MP Truper vernier caliper for nine films from different batches. The average weight of the optomembrane was determined for 18 polymers from different batches with a AE240 Mettler analytical balance with an uncertainty of ±0.0001 g.
2.7 Evaluation of the formation of the M(II)-PAN complex with pH
For this experiment, two solutions were made at two different concentrations, 10–4 M and 10–5 M, adjusted to pH 5, 6, 7, 8, and nine for each metal cation. The buffering of the solutions at acidic pH, that is, 5 and 6, was carried out with MES at a concentration of 5 mM, while the solutions at pH 7, 8, and nine used the TRIS buffer at 5 mM, adjusting with 1 M NaOH or 1 M HNO3, as required. A volume of 25 ml of the above solutions was taken, each of which was put in contact with a CTA—TEHP—PAN PIM with a composition of 33.2–66.5–0.3% w/w, respectively, in the orbital plate over a period of 60 min. Once this period had elapsed, the VIS spectrum of the central part, E, was obtained. These experiments were carried out in duplicate. An RSD around 3% was observed.
2.8 Evaluation of the detection time
The evaluation of the detection time of the polymer was carried out at three different concentrations of the metal cation, 10–3 M, 10–4 M and 10–5 M in duplicate. A 4.5 cm2 rectangular section of the PIM was taken and placed in 6 ml of the metal cation solution at a defined molar concentration and buffered at pH 6 with 5 mM MES. The solutions of the M(II) cation and the optomembrane were placed on the orbital plate shaker at 1/100 min for a period of approximately 120 min, taking the VIS spectrum of the polymeric film at 0 s, 5 s, 15 s, 30 s, 60 s, 90 s, 120 s, 5 min, 10 min, 20 min, 40 min, and 60 min. The absorbances of the complex formed during the course of the experiment were determined at 560 nm for the experiments with Pb(II), at 561 nm for Cu(II) and at 555 nm for Zn(II).
2.9 Evaluation of the response of the membrane as a function of the concentration of the metal cation
The response of the polymeric sensor as a function of the metal cation concentration was performed in duplicate. For each of the metal cations studied, five solutions of the respective cation at 10–3 M, 10–4 M, 10–5 M, 10–6 M and 10–7 M adjusted to pH 6 with 5 mM MES were made. Five optomembranes were used, each one placed in 25 ml of the different solutions, in an orbital plate shaker at 1/100 min for 1 hour. After the detection time, a duplicate section was taken from the central part of the film and the VIS spectrum obtained. The parameter α that is plotted against the logarithm of the concentration of the metal cation log CM(II), is calculated with Eq. 1:
where A0 and A1 represent the absorbance for the fully complexed and uncomplexed chromoionophore, respectively. A change in the absorption band is essential for an adequate response of the sensor.
2.10 Evaluation of the effect of natural light on the stability of the M(II)-PAN complex
The two sets of membranes were taken and exposed to the 10–3 M, 10–4 M and 10–5 M solutions of the metal cations. Then one set was exposed for 15 days to natural light, and the other set stored in a drawer completely away from natural light for the same time. The VIS spectra of the films were measured at 24 h, 48 h, 72 h, 5 days, 8 days, 10 days and 15 days after the first measurement for both series. The calculation of the % relative A that appear in the graphs was carried out with Eq. 2:
where At is the absorbance at the wavelength of the metal cation obtained at time t, and At0 is the absorbance obtained at the same wavelength at initial time. Measurements of the absorbance of the complexes formed at 24 h, 48 h, 72 h, and 5, 8, 10 and 15 days were carried out.
2.11 Evaluation of the reversibility of the optomembrane
To evaluate the regeneration capacity of the optomembrane in the detection of the three metals, the three most common regenerators that have been reported in the literature were used, i.e., HNO3, HCl and EDTA at 0.01 M concentration each. The experiments consisted of taking 4.5 cm2 rectangular sections from the central part of three different optomembranes and putting them in contact with 6 ml of a 1 × 10⁻⁴ M solution of the studied metal cation on an orbital plate shaker at 1/100 min−1 for 60 min. After this period, the films show a color change corresponding to the metal complex formed and the VIS spectra of the PIMs were recorded. Each of the previous films was put in contact with 15 ml of any of the regenerators mentioned above and stirred at 1/100 min−1 for 60 min, then the spectrum of the polymer was obtained again. This detection-regeneration cycle was performed five times for each of the metal cations using the same film and the same regenerator initially used.
The percentage of relative absorbance % Arelative as a function of the cycles of detection—regeneration of the metal cations with the PAN optomembrane were calculated according to Eq. 3.
In the above equation, Acycle N represents the absorbance value obtained at wavelength of the M(II)-PAN complex on the film for a given detection cycle number N, while A0 represents the initial absorbance value.
2.12 Chemometric modeling
For the construction of the models, a central composite design for three experimental factors, the metal cations at five concentration levels, was used generating a total of 15 experiments. For each experiment, a volume of 25 ml in contact with a complete CTA—TEHP—PAN PIM for 60 min was employed, under constant agitation. Subsequently, the VIS spectrum of the optomembrane was obtained in duplicate, taking two different regions of the central part of the polymer. Seven replicates of this experimental design were made.
The chemometric analyses were performed with the raw data as a 105 × 351matrix, i.e., 105 rows comprising the different seven replicas of the experiments of the experimental design and 351 columns containing the information of the VIS spectrum in the range of 350–700 nm. A 105 × 1 matrix of the response or dependent variable containing the information of the different concentrations of the metal cations (ppm) was used. Preprocessing of the data based on baseline correction was applied before chemometric data analyses. As for ANNs modeling, the experimental matrix was split into a 75 × 351 matrix that was further split into an 80% training (60 × 351) and 20% validation (15 × 351) matrices. The remaining 30 samples were used as test matrix (30 × 351) for the determination of the model performance parameters in independent experiments, i.e., experiments not used for the developing of the model. As for the PLS models, they were randomly cross-validated by splitting the 75 × 351 matrix used for training into 20 segments with 5 samples per segment. As in the case of ANNs the remaining 30 samples were used as test matrix.
3. Results and discussion
3.1 Characterization of the CTA—TEHP—PAN PIMs
3.1.1 Colors, VIS spectra
PIMs were prepared according to a previously reported work (García-Beleño and Rodríguez de San Miguel, 2021) using cellulose triacetate as support, TEHP as plasticizer and PAN as chromophore. Figure 1 shows an image for one of the CTA—TEHP—PAN PIMs (yellow) whose composition is 33.2–66.5–0.3% w/w, respectively. The membrane showed acceptable flexibility and manageability. The VIS spectrum of the previous film is presented in Figure 1 (upper, left), as an average of five different uncomplexed PIMs. A maximum at 467 nm with an absorbance value of 2.04 ± 0.07 was observed. The Figure also shows the VIS spectrum for the Pb(II) containing PIM, where two bands are observed, one at 467 nm corresponding to the non-complexed PAN and one at 560 nm that is associated with the complex formed between PAN and Pb(II) (upper, right).
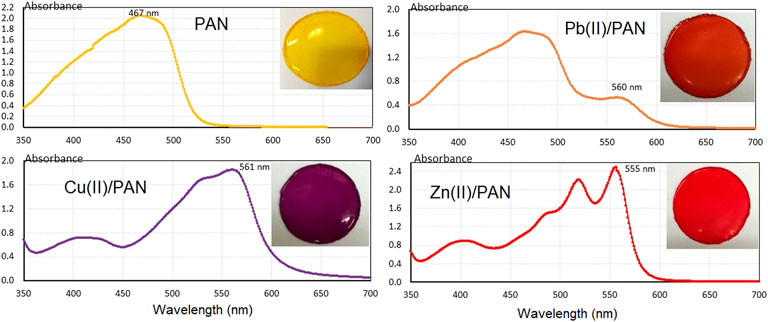
FIGURE 1. VIS spectrum of the CTA–TEHP—PAN PIMs in the absence and presence of metal ions.
The VIS spectrum of the Cu(II) containing PIM shows a maximum at 561 nm (lower, left), associated with the presence of the complex between PAN and Cu(II). The free PAN band that appears at 467 nm does not appear, suggesting that the PAN present in the polymer reacts completely. The spectrum of the Zn(II) containing PIM has two characteristic bands at 518 nm and 555 nm associated with the formation of two complexes between PAN and zinc (lower, right); the band at 467 nm associated with free PAN does not appear, as the chromophore reacts completely with Zn(II). Since in all three cases the PIMs did not present any physical modification and provided a flexible and homogeneous film acceptable to the naked eye, TEHP is an adequate plasticizer for the system. In different publications for sensors of the same type, a common composition of 33% w/w for the polymer and 66% w/w of the plasticizer is usually found. This composition allows both the molecules of the chromophore to freely diffuse within the optomembrane, favoring the extraction of the analyte of interest (Mahani et al., 2008; Ruckh et al., 2013; Shahabadi et al., 2009). So that this composition was taken as reference for the preparation of the sensors in this work. The composition of each polymer film consists of 80 mg of cellulose triacetate, 160 mg of TEHP and 0.75 mg of PAN. These results are consistent according to the equilibrium constant values of the M(II)-PAN complexes reported in the literature, where log Kf1 = 15.6 and log Kf2 = 8.4 for Cu(II), and log Kf1 = 11.2 and log Kf2 = 10.2 for Zn(II) in 50% dioxane/water mixtures (Dojindo product catalog, 2022), indicating quantitative extraction of these metal ion by PAN. As for Pb(II) minor extraction is expected as its equilibrium constant value is expected to be lower considering that the pH50% of this metal is about 7.2 in comparison to the respective values of the Cu(II) (pH50% ≈ 0) and Zn(II) (pH50% ≈ 6.0) complexes in chloroform (Qureshi and Cheema, 1974).
3.1.2 Thickness
The thickness of the polymer film plays a fundamental factor in the detection and quantification of the analytes because it is part of the optical path of the incident light beam that passes through the film. For ten different films obtained from different batches, the thickness of the membrane was measured in nine different zones, A—I, distributed regularly on its surface. The results of these measurements are shown in Supplementary Table S1.
As observed the thickness of the optomembranes are not completely uniform, as a proportional variation of 9 μm was found. Another aspect that can be noticed is that the measurement zones associated with the left (A—D—G) and right (C—F—I) ends of the membrane have greater thicknesses than the central part (B—E—H). An important point of the results shown in Supplementary Table S1 lies in the variation in the thickness of the optomembranes in zone E (the central part of the polymer). The standard deviation of the thicknesses measured in the central part of the different films is 3 μm, therefore, this area section of the optomembrane was used to carry out subsequent experiments. The physical characteristics of the final employed sensors are shown in Supplementary Table S2.
3.1.3 FTIR spectroscopy
The characterization was performed for three films of CTA—TEHP—PAN whose composition was 33.2–66.5–0.3% w/w (Supplementary Figure S1). According to the literature (Betteridge and John, 1973; Saji and Reddy, 2003; Arous et al., 2004; Kebiche—Sendhadji et al., 2008; National Institute of Advanced Industrial Science and Technology, 2012), characteristic bands associated with the PAN can be seen. For example, the signal present at 3,483 cm−1 is associated with a stretching vibration of the hydroxyl group. A signal defined at 2,931 cm−1 associated with stretching vibrations of the C-H bonds of the aromatic rings is also appreciated. The band presents at 1748 cm−1, is an intense band very characteristic of the carbonyl groups in the acetate groups of CTA. The next important signal is at 1,236 cm−1 which is an intense and wide band that can be associated with the vibration of the P = O, which is reported within the range 1,300–1,100 cm−1. A very intense band at 1,059 cm−1 appears which is reported in the literature associated with P–O–C (C of alkyl) groups in the plasticizer. Since the plasticizer is found in the highest proportion, it is evident that this signal is very wide and saturated. This signal is always accompanied by a confirmation signal reported in the literature at 1,190 cm−1; in this case, it is slightly shifted at 1,158 cm−1. A signal associated with the chromophore appears at 1,636 cm−1, associated with stretching vibrations of functional groups such as N = N, C = N and C = C in the aromatic ring. In addition, the signal at 1,464 cm−1, can also be related to characteristic groups of the PAN, such as the stretching vibrations of the C-O, to those present in the acetyl groups of the CTA, and to deformation vibrations of O-H and deformation vibrations of C-H present in the pyridine ring. Another important band that can be associated with the presence of C-H bonds of the CTA or the alkyl chains in the TEHP appears at 1,379 cm−1. These results indicate that there is no reaction between the PIM components that could be reflected in the formation of any covalent bond. Therefore, the retention of the indicator and the complexes is given by the hydrophobicity of these or van der Waals forces.
3.2 Optimization of the experimental factors for the detection process
The polymer sensor will be used to detect the metal cations Pb(II), Cu(II) and Zn(II) in a batch process. Under such circumstances, different variables can influence the detection process, such as: the pH of the aqueous solution, the concentration of the metal cation, the type of agitation, the weight of the membrane, the volume of the solution, the temperature, the surface area of contact of the sensor and the detection time.
Through a complete fractional design at two levels, the influence of four important variables in the detection of the sensor was estimated by the absorbance of the complex formed between the metal cation M(II) and PAN. These variables were the weight of the PIM, the volume of the sample, the concentration of the metal cation and the surface contact area of the sensor. The remaining variables mentioned above were not considered in this analysis, as they were analyzed more specifically in the subsequent sections, except for the type of agitation which was held constant (orbital type agitation), mimicking the use of the sensor in bodies of non-running water such as lagoons or ponds.
The experimental matrix of the 24 fractional design in the studied variables is shown in Supplementary Table S3. This experimental matrix was performed three times, using a different cation on each occasion, and obtaining the results in duplicate for each experiment. The response variable was the absorbance of the complex that is formed in the PIM, therefore, absorbances at 560, 561, and 555 nm for Pb(II), Cu(II) and Zn(II) were measured, respectively. The Pareto analyses plots of the different responses are shown in Supplementary Figure S2. From it, only two of the four experimental variables sems to be relevant in the detection process: the concentration of the metal cation and the area of membrane used, as well as the interaction between both factors. This information shows that, in the detection process, the experimental factors associated with the chemical reaction influence more significantly the response than the physical variables of the experiment. When the statistical analysis was focused on maximizing the responses, results shown in Supplementary Table S4 were obtained. From this, it has been decided to work with PIMs of 240 mg of CTA—TEHP—PAN in subsequent experiments, exposing the entire surface area of the polymeric film (19 cm2 for a membrane of 5 cm in diameter) to a volume of 25 ml of the dissolution of the metal cation.
3.3 Effect of pH on the detection
PAN is a metallochromic agent that exhibits acid-base properties from which their complex formation reactions depend on pH. For this reason, a relevant factor in the detection capacity of the optomembrane is the pH of the solution. As indicated before, the solutions of the lead, copper, and zinc cations at pH 5 and 6 were buffered with 5 × 10⁻³ M MES, while the solutions at pH 7, 8 and 9 were buffered with 5 × 10⁻³ M TRIS. To elaborate the fraction of species diagrams of these metals, the values of the global formation constants of the complexes Cu(II)—MES and Zn(II)—MES were considered according to reports in the literature (log ϐM/L of 4.80 and 3.90 for Cu(II) and Zn(II), respectively). TRIS has a strong tendency to form complexes with Cu(II) and a slight tendency to form complexes with Pb(II) and Zn(II). For the description of the aqueous phase chemistry of Cu(II) four different complexes with TRIS were then considered (log ϐ1 = 4.05, log ϐ2= 7.6, log ϐ3 = 11.1, log ϐ4 = 14.1).
The graph shown in Figure 2 (upper) shows the effect of the pH of the solution on the absorbance of the Pb(II)—PAN complex, for two different concentrations of Pb(II) (1 × 10⁻⁴ M and 1 × 10⁻⁵ M). In both curves the same bell shape is observed, and in both cases, a maximum of the absorbance of the Pb(II)—PAN complex is observed at pH 7. Considering that the pKa of the chromophore are 2.9 and 11.2 (Betteridge et al., 1963), it can be thought that the formation of the Pb(II)—PAN complex is not very favored at acidic pHs, because the indicator is protonated; of course as the pH increases the formation of the complex will be favored, so that at pH values seven it reaches a maximum, although in these conditions the formation of the species Pb(OH)+ is important (Supplementary Figure S3); being a cationic species it is very likely that it is also extracted in the optomembrane and the formation of a mixed complex of the PbOHPAN+ type is carried out.

FIGURE 2. Dependence of the formation of the M(II)—PAN complex on pH.
The effect of pH on the formation of the Cu(II) complex and the PAN is shown in Figure 2 (middle). As in the previous case, a bell-shape dependence is observed, where the formation of the Cu(II)—PAN complex is favored in a wider pH region, from 6 to 8. At the lower concentration, 1 × 10⁻⁵ M, the shape is no longer observed. The literature reports both the formation of a complex, CuPAN+ in solution (Ooi et al., 1967; Betteridge et al., 1973; Dean, 1985), and two complexes between PAN and the metal ion Cu(II), CuPAN+ and Cu(PAN)2 in a Nafion optomembrane®, although a notable decrease in stability for the 1:2 complex is discussed, attributed to the fact that the PAN molecule acts better as a bidentate ligand than a tridentate one. The formation of the 1:2 complex is occasionally reported, and its formation is attributed to an excess of PAN present in the study system (Ooi et al., 1967; Coo et al., 2001). Similar to the previous case, the formation of the Pb(II)—PAN complex, the formation of the complex of Cu—PAN is disadvantaged at acidic pH, however, as the pH increases the formation of the complex is favored and remains constant for the 6 < pH < 8 interval, which can be explained by the formation of the CuPAN+ complex from the CuMES+ complex, as the formation constants of the first are higher (log ϐ = 16 and log ϐ = 4.90 for CuPAN+ and CuMES+,respectively) (Supplementary Figure S3).
The dependence of complex formation between Zn(II) and PAN on pH is shown in Figure 2 (lower). As in the two previous cases, the graph presents a bell-shape for both concentrations 1 × 10⁻⁴ M and 1 × 10⁻⁵ M of Cu(II), where the most favorable conditions are in the range 6 < pH < 8. According to the fraction diagrams (Supplementary Figure S3), the predominant species of Zn(II) change along the entire pH range in the solution. From this information it is inferred that at pH less than 6 the formation of the complex is limited by the protonation of PAN, while in the range of 6 < pH < 8, the formation of the complex in the PIM remains almost constant and favorable mainly due to the formation of the ZnPAN+ and Zn(PAN)2 complexes from ZnMES+ complex and the free Zn(II) cation, the formation of the zinc(II) complex with PAN can be justified in the same way as in the previous case, taking into account the respective formation constants (log ϐ1 = 11.2, log ϐ2 = 21.7 and log ϐ = 3.80 for ZnPAN+ , Zn(PAN)2 and CuMES+ respectively).
The overall conclusion defines in this way the range 6 < pH < 8 as the one with the best performance with practically high constant absorbances of Cu(II) and Zn(II) at high concentrations (10–4 M) and acceptable values for Pb(II); at lower concentrations (10–5 M), all absorbances values diminish, as expected, but the range stays still useful.
3.4 Influence of detection time
An important analytical parameter in the detection performance is the response time. Response time is defined as the time required for the optomembrane signal to reach 95% of its final value, or where the signal becomes constant, at steady state. It is the time involved in the diffusion of the analyte from the solution to the membrane interface and the association with indicator (Absalan et al., 2010; Qazi et al., 2012; Pourbasheer et al., 2015). The temporal response of the optomembrane of CTA—TEHP—PAN was evaluated at three different concentrations of the metal cation, 1 × 10⁻³ M, 1 × 10⁻⁴ M and 1 × 10⁻⁵ M at pH 6. The results are shown in Figure 3.
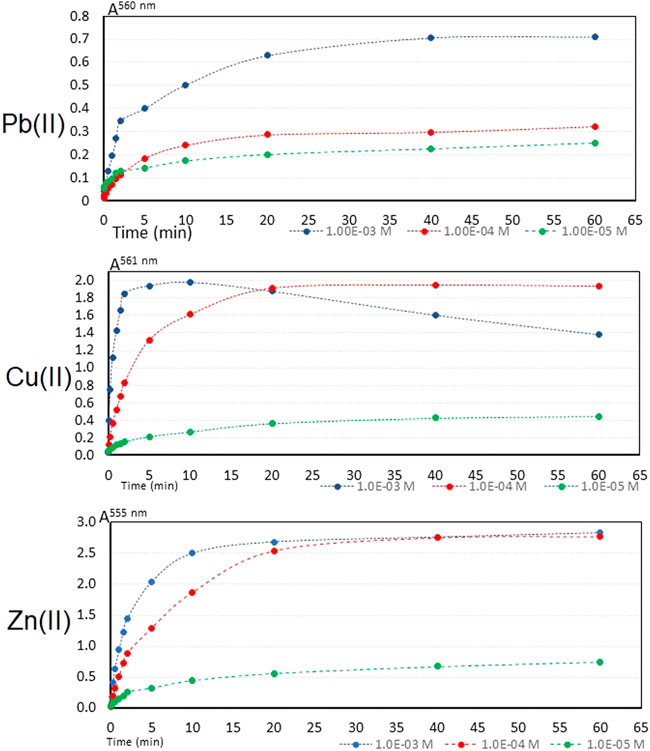
FIGURE 3. Temporal response of the PIM to M(II) in solution at three different initial concentrations.
The membrane reaches an equilibrium state of the optical signal in 20 min at the three concentration levels and for the three metal cations. However, when comparing the response time of this optomembrane with those reported in the literature, this membrane does not present detection times as short as other materials, which have detection times within the first 5 minutes of contact of the membrane with the aqueous phase. However, the temporary detection responses obtained in this work are comparable with another optomembrane with the same PAN metallochromic indicator reported in the literature (Alizadeh et al., 2002). Looking at the behavior of the graph for Cu(II), it can be seen that the optical signal for the curve at 1 × 10⁻³ M of Cu(II) falls from minute 20, which evidence the leaching of the CuPAN+ complex; the pink coloration of the aqueous phase evidenced this. The charged complex has more affinity to the aqueous phase than to the active sites of the optomembrane that could be in the dipoles of the acetate groups of the supporting polymer.
Considering that (Alizadeh et al., 2002):
where d and Dm are the thickness of the membrane and the diffusion coefficient of the species in the PIM phase respectively, it is possible to calculate the diffusion coefficient of the different metal cations, Pb(II), Zn(II) and Cu(II). From the previous equation and since the optomembranes have a thickness of 102 μm ± 9 μm (n = 90) and that the response time, t95%, for the different metal cations of the membrane is 20 min, the diffusion coefficient of the metal species in the membrane can be estimated using Eq. 4 as 98 × 10–9 cm2 s−1. This value corresponds well with the average of the diffusion coefficients of species present in solids (10–9 cm2 s−1). This coefficient does not depend on the type of metal ion, nor its concentration in aqueous medium, as already commented in the literature. However, a greater dependence of the diffusion coefficient has been established with the concentration and distribution of the membrane components in addition to the thickness of this material (Seiler and Simon, 1992).
3.5 Response of the optomembrane to the concentration of metal cations
The linear interval for which the response of the optomembrane can be properly measured is determined by the values of α (Eq. 1) that the polymer presents at different concentration levels. Traditionally, curves of sigmoidal shape are obtained when the value of the function α or 1—α are plotted against log CM(II), where the limit or extreme values of this function do not present any significant change with respect to the relative absorbance in the wavelength of measurement, since they are physically related to the state in which the chromoionophore is fully complexed, α = 1 or 1—α = 0. Conversely, for minimum values of α = 0 or 1—α = 1, the concentration of M(II) is insufficient to produce an appreciable color change in the polymer.
Figure 4 shows the curves of 1—α as a function of log CM(II) for the three metal cations. In the case of Zn(II) and Cu(II), very similar sigmoidal curves are observed, even overlapping. Both curves present a region where a linear dependence between the response of the polymer sensor and the log CM(II) is observed, in an approximate concentration range between 10–5 M and 10–4 M, or 0.64 ppm – 6.40 ppm for Cu(II) and 0.65 ppm – 6.54 ppm for Zn(II). It is evident that the polymer film is saturated when contacted with solutions of Cu(II) or Zn(II) at 10–3 M.
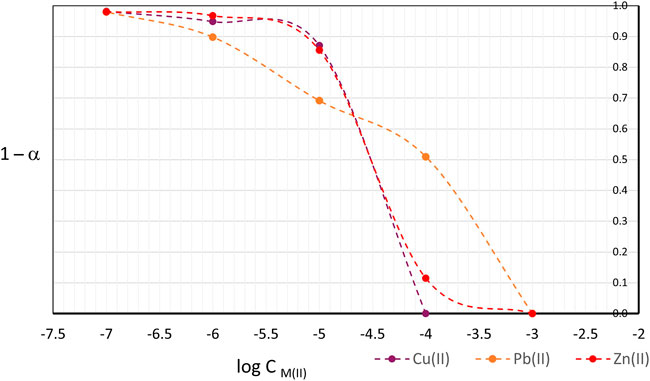
FIGURE 4. Evaluation of PIM response to different metal concentration levels at pH = 6.
The response curve of the optomembrane towards Pb(II) is different respect to the cases of Zn(II) and Cu(II). A linear response of the material cannot be appreciated. The interval of the graph that corresponds to the values of log CPb(II) ranging from -6 to -4, could be seen as a pair of curves of sigmoidal shape superimposed, in which two linear responses of the sensor material can be seen for the same curve. This particular response of the optomembrane may be a consequence of the extraction and complexation of two different species, the free cation and the first hydroxide complex, as observed in Supplementary Figure S3 where two predominant species are present in the solution, i.e., Pb(II) and Pb(OH)+ at 60 and 40% abundance, respectively. However, looking at the corresponding figures for Cu(II) and Zn(II), it is observed that in the case of copper, the free cation and the CuMES+ complex, in fractions of 8 and 91%, respectively, are present. In the case of zinc, at pH 6 the predominant species are the free cation and ZnMES+, in 52 and 48% percent, respectively. Considering the values of the complex formation constants for copper with MES and PAN (log ϐCu/MES = 4.90 and log ϐCu/PAN = 16; log ϐZn/MES = 3.80 and log ϐZn/PAN = 21.7), it is deduced that the complexes of Cu(II) and Zn(II) with MES, despite being predominant in their respective cases , can be considered as labile complexes, i.e., MES is a weaker ligand than PAN against any of the cations, so that the cations may form more stable complexes with the PAN present.
From the above, it is concluded that the optomembrane presents a linear response at a concentration range from 1 × 10⁻⁵ M to 1 × 10⁻⁴ M for Zn(II) and Cu(II), but not for Pb(II). This result will be used to subsequently define the concentration levels for each metal cation in the construction of the quantification models.
From the sigmoidal shape presented in Figure 4, it is important to note that the linear response of the polymer depends on the amount of mass that is extracted from the solution towards the membrane, up to the degree of saturation of the polymer. Therefore, it can be anticipated that in the construction of a simultaneous multivariate models for three metal cations, the linear response interval of the optomembrane will be diminished since the polymer will be exposed to an amount of mass three times greater than in the case of the individual experiments presented in this section.
3.6 Durability of the analytical signal
An important aspect of the PIM sensor is the temporal stability of the analytical signal, as not all compounds are photochemically stable. Therefore, the behavior of the absorbance of the complex in the polymer was evaluated over a period of 15 days, exposing the detector material to natural light or in the absence of it at the three different molar concentrations previously employed.
3.6.1 Analytical signal in the absence of natural light
The graph showing the variation of the absorbance of the Cu(II)—PAN complex in the polymer film over a period of 15 days in the absence of natural light is shown in Figure 5 (upper). As observed, the analytical signal remains constant during the complete period, as no significant loss of in its value was observed in the whole interval.
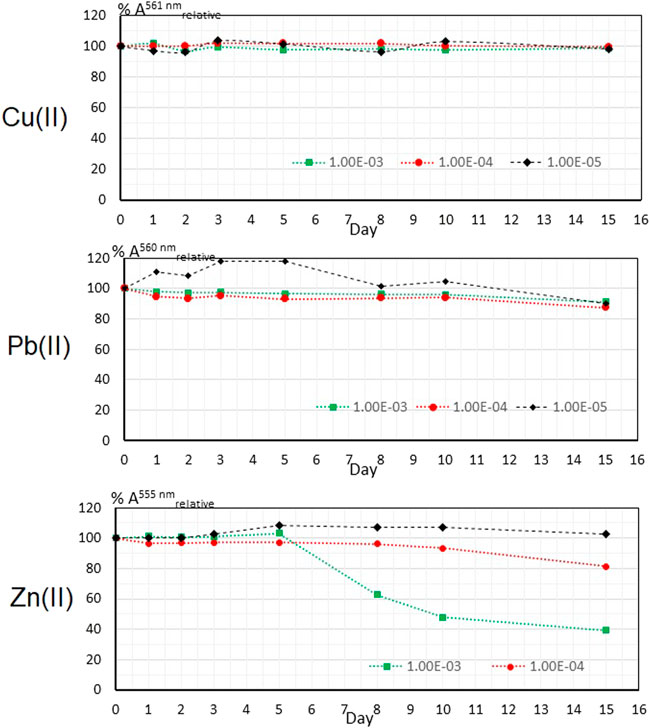
FIGURE 5. Stability of the analytical signal in the PIM for M(II) in the absence of natural light at three concentrations.
The corresponding graph for Pb(II) is shown in Figure 5 (middle). It is observed that the analytical signal for the polymeric sensors exposed to 1 × 10⁻³ and 1 × 10⁻⁴ M of Pb(II) behave very similar, from 24 h after the detection process a minimum loss of absorbance is observed, remaining constant until day 10; later on day 15 a loss of the signal of about 10% of its initial value is denoted. The PIM exposed to a solution of 1 × 10⁻⁵ M shows an anomalous or unexpected behavior as the signal of the Pb(II)—PAN complex increases, however, it also presents a drop in the analytical signal from day 10 on. This anomaly may have different causes, one of which may be attributed to a posterior formation of the complex between the Pb(II) cation and PAN due to a slow complexation reaction kinetics. In the literature it is reported that the Pb (II)—PAN complex is red, while the coloration associated with the formation of this same complex in the polymer matrix is orange, this orange coloration is considered as the result of the red color of the PAN complex and Pb(II) and the yellow color of the free PAN. Both bands can be seen in the VIS spectrum of film (Pourbasheer et al., 2015).
The durability of the analytical signal of the Zn(II)—PAN complex in all three cases show different behaviors (Figure 5 lower). In the case of Zn(II) 1 × 10⁻³ M, the signal remains constant with respect to that initially obtained during a period of 5 days; later the signal falls up to 40 percent of the initial value. The signal at 1 × 10⁻⁴ M presents a minimum loss of the initial value, decreasing slightly up about 20% in the last day. At 1 × 10⁻⁵ M a similar behavior respect to that observed with Pb(II) is attained, where an increase in absorbance is observed from day three; however, the signal remains the same with respect to the initial one at the end of the interval. Considering that the VIS spectrum showed two characteristic bands associated with the formation of two different complexes with PAN, i.e., 518 nm and 555 nm corresponding with ZnPAN+ and Zn(PAN)2 complexes, respectively, it is possible that the increase in relative % absorbance is due to a conversion of the ZnPAN+ into the Zn(PAN)2 complex, generating a greater absorbance at the employed signal (555 nm).
3.6.2 Analytical signal in the presence of natural light
The graph showing the variation of the absorbance of the Cu(II)—PAN complex in the PIM over a period of 15 days in the presence of natural light is shown in Figure 6 (upper). The absorbance of the Cu(II)—PAN complex at 1 × 10⁻³ M and 1 × 10⁻⁴ M at pH 6, remains perfectly constant for the whole period. However, in the case of 1 × 10⁻⁵ M an anomalous behavior is observed, where the percentage of the relative absorbance increases significantly, like the cases for lead and zinc in the previous section. This anomaly can be associated with a possible subsequent formation of the Cu(II)—PAN complex catalyzed by sunlight.
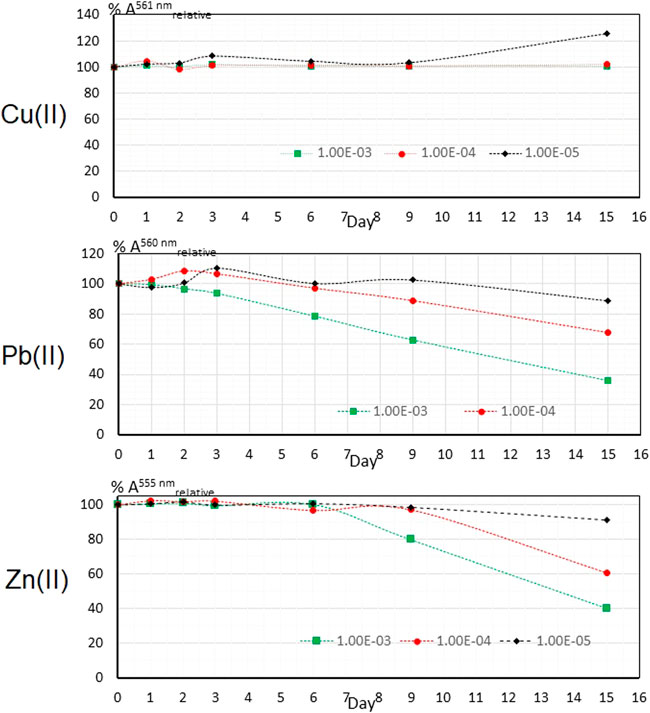
FIGURE 6. Stability of the analytical signal in the PIM for M(II) at three concentrations in the presence of natural light.
In the case of Pb(II) It can be clearly observed in Figure 6 (middle) that in none of the three studied cases a constant signal was observed, and in all cases the temporal stability of the Pb(II)—PAN complex decreases markedly when the film is exposed to natural light after 72 h. At 1 × 10⁻³ M the signal is affected the most by the degradation of the complex by sunlight, followed by the optomembrane exposed to 1 × 10⁻⁴ M and then that to 1 × 10⁻⁵ M, with a final recovery of 38, 78 and 88%, respectively.
As for Zn(II) in Figure 6 (lower), a loss of the analytical signal can be seen from the sixth day on. The analytical signal at 1 × 10⁻⁴ M and 1 × 10⁻⁵ M remains constant for 9 days. The final percentages were 40, 60 and 90% with the decrease in zinc concentration. The negative influence of sunlight on the stability of the Zn(II)—PAN and Pb(II)—PAN complexes is due to the photochemical destruction of them, especially for cases in which these are formed in a majority. This negative effect is possible accentuated by the exudation of the complex that initially present in the PIM. Considering that the color of the complexes formed are within the range of visible light, it is possible that the Zn(II) and Pb(II) complexes are more affected in their stability by the absorption of sunlight as they absorb radiation of the complementary color (violet or blue) to which they are observed (orange or red), so that the absorbed radiation is more energetic and may be able to alter the stability of the complex in a negative way, unlike the blue-violet complex of Cu(II), which absorbs radiation of the complementary color (towards the yellow or–orange) that corresponds to greater wavelengths of 580–600 nm, which are less energetic and would disturb less the bonds of the molecule of the complex between the Cu(II) and PAN.
3.7 Reversibility of the analytical signal
One condition that a sensor must fulfill to be recognized as such is the reversibility of its signal. In different research papers, a great variability of acidic, basic, complexing, or masking compounds have traditionally been used as regenerators of optomembranes. Such is the case of nitric acid, hydrochloric acid, sulfuric acid, sodium hydroxide, phosphoric acid, EDTA, sodium or potassium thiocyanate, thiourea, glycine, thioacetamide, ethylenediamine, thiosalicylic acid, acid 5—sulfosalicylic dihydrate or sodium fluoride (Tavallali et al., 2012; Tharakeswar et al., 2012; Pourbasheer et al., 2015). In the present work, nitric acid, hydrochloric acid and EDTA were employed at 0.01 M. Five regenerating cycles were performed, with detection and regeneration periods of 60 min.
The graph in Figure 7 (upper) shows the values of % Arelative for the five cycles of detection (points above) and regeneration (points below) with the three chemical regenerators for the case of Cu(II). As it can be seen, there is a drastic and gradual decrease in the percentage of the relative absorbance for the three different regenerators, which is attributed to the leaching of the CuPAN+ complex, rather than to the effectiveness of the regenerator, as deduced by the presence of a pink coloration in the aqueous phase in each of cycles. Finally, the yellow coloration of the PIM in lost after the fifth cycle.
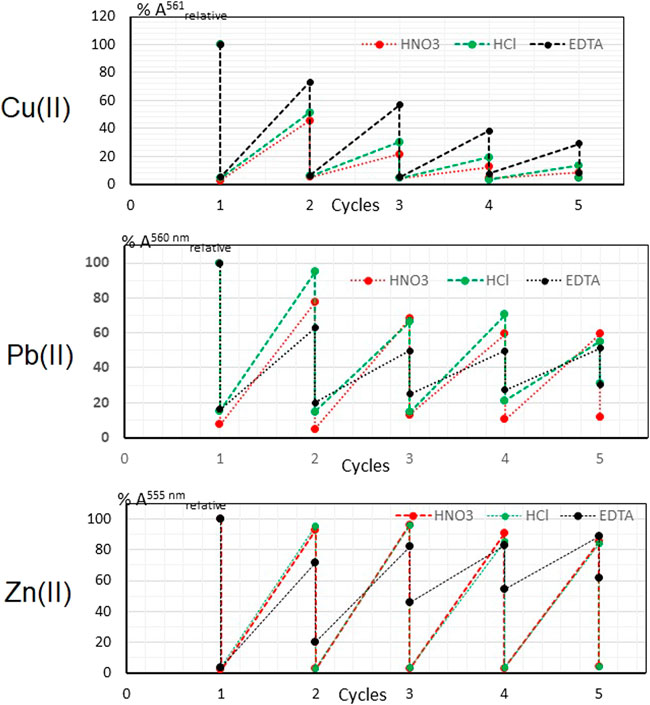
FIGURE 7. Reversibility of the analytical signal of the PIM for three different regenerators.
The graph in Figure 7 (middle) shows the relative % A values for the five cycles of detection (points above) and regeneration (points below) with the three chemical regenerators for the case of Pb(II). The signal attributed to the Pb(II)—PAN complex decreases significantly from the third cycle of action in the case of hydrochloric acid, while with the other regenerators the analytical signal is lost from the first cycle on. Observing the low relative absorbance points that correspond to the regenerated optode, an accumulation of the detected complex as the polymer operating cycles are performed is observed, which is accentuated more for EDTA and hydrochloric acid than for nitric acid.
The graph in Figure 7 (lower) shows the relative % absorbance values for the five detection (points above) and regeneration (points below) cycles with the three chemical regenerators for the case of Zn(II). A good performance of nitric acid and hydrochloric acid as regenerators until the fifth cycle of operation is observed. However, the analytical signal fails in being recovered from the third cycle on, where approximately ten percent of its value is subsequently lost compared to the initial one. EDTA is not an effective regenerator, since there is a lack of effectiveness to reverse the complexation reaction in the different operating cycles, and it is not possible to restore the initial state of the polymer. The logarithmic conditional constants of the complexes of Cu(II), Zn(II) and Pb(II) with EDTA at pH 6 are 14, 11.7 and 13.2 respectively. However, despite having favorable constants to reverse the formation of the respective complexes of metal cations with PAN, a good reversibility was not obtained for any of the metals.
Both the gradual loss of detection capacity, but especially the low capacity of regeneration of the initial state of the polymer shows that the optomembrane of CTA—TEHP—PAN does not function as a sensor for the metal cations Cu(II) and Pb(II). For Zn(II), the sensor functionality of the PIM is limited to three operating cycles. From these observations it is concluded that, in general, the film obtained in this work has a functionality more like a probe.
3.8 Chemometric modeling
To carry out the simultaneous detection and quantitative determination of the three metal cations, the experimental matrix consists of a central-composite experimental design with five levels for each metal cation, in a concentration range ranging from 1 × 10⁻⁶ M to 1 × 10⁻⁴ M, i.e., from 0.06 ppm to 6.40 ppm for Cu(II), from 0.21 ppm to 20.72 ppm for Pb(II), and from 0.06 ppm to 6.54 ppm for Zn(II) (Supplementary Table S5). The concentration levels were defined according to the linear response shown by the polymer in the corresponding previous section. In general, in each experiment a color change was observed which was monitored by VIS (Supplementary Table S6).
3.8.1 Principal component analysis, PCA
One of the objectives of the construction of the polymer sensor lies in the quantitative and simultaneous detection of different metal cations. Supplementary Figure S4 shows the percent of explained variance with the number of PCs. Clearly, a model with only two main components accounts for 99% of variability, with PC1 containing 93% of this variability and PC2 only 6%. With 3 PCs the explained variance reached 99.9%, both for calibration and validation data. From the scores plot shown in Figure 8, three groups can be roughly distinguished. The first group A cluster experiments 2, 4, 5, 13, and 15 (Supplementary Table S6), the second group B cluster experiments 8, 6, and 11 (Supplementary Table S6) and third group C cluster 1, 3, 7, 9, 10, 12 and 14 (Supplementary Table S6).
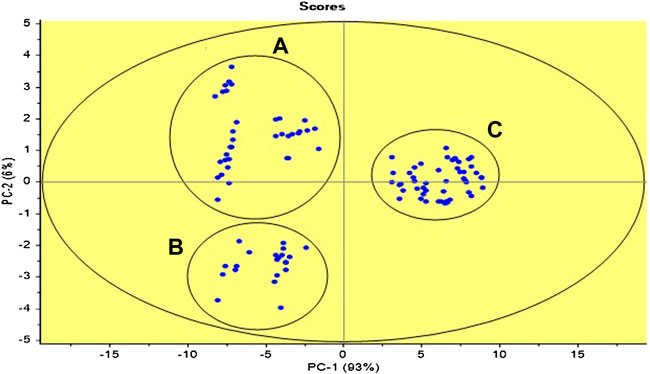
FIGURE 8. Scores plot for the PCA analysis for the central-composite design matrix. Three groups of data are observed comprising experiments 2, 4, 5, 13, and 15 (A), 8, 6, and 11 (B), and 1, 3, 7, 9, 10, 12, and 14 (C) in Supplementary Table S6.
The three groups shown by the graph of scores of the PCA, can be related to the change of color that presents the optomembrane. Specifically, the PIMs grouped in set A present a change of color from yellow to purple, as in most of these experiments the solutions present a higher Cu(II)concentration. For the optomembranes grouped in B, there was a change of color from yellow to red. This color is initially associated with the formation of the complex between Zn(II) and PAN. As in the previous case, in the aqueous solutions of these experiments Zn(II) is in higher concentration than Pb(II) and Cu(II). The rest of the experiments that conform group C present a common characteristic change in the coloration from yellow to strong orange. This time Pb(II) was in higher concentration. It is important to note that the formation of the complex between the Pb(II) cation and PAN does not seem to be very favored, as reflected in a change of coloration not as pronounced as in the previous cases.
The loadings values of the PCA analysis were compared with the VIS spectra of the complexes formed with PAN and copper, zinc, and lead, to analyze the contribution of the variables to the analysis (Figure 9).
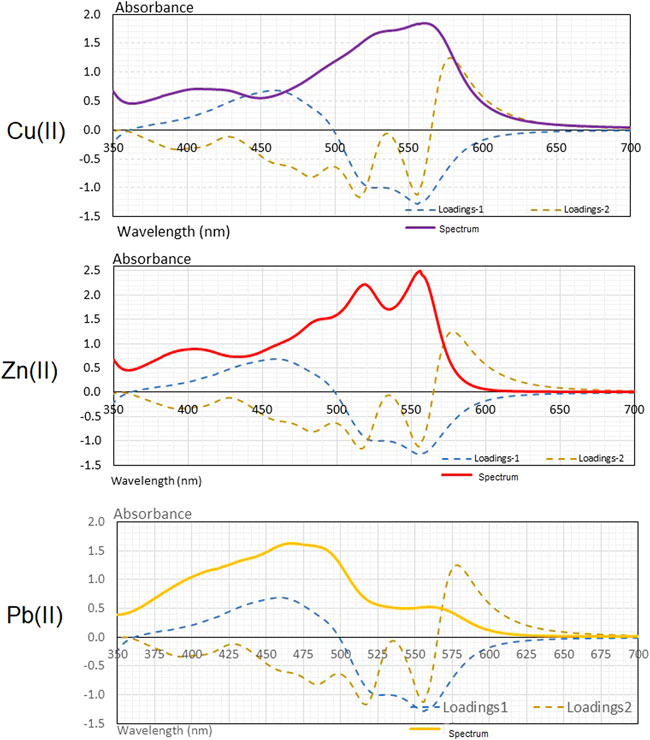
FIGURE 9. Comparison of the VIS spectrum of the M(II)-PAN complex with the PCA loadings.
The loadings in PC—1 are mainly defined by the wavelengths ranging from 425–475 nm in a positive form and by the wavelengths on the range 515–565 nm in a negative form. In the case of PC—2, this is mainly positive defined by wavelengths ranging from 565 to 650 nm and negative by those ranging from 505 to 525 nm and from 550 to 560 nm. In general, it is observed that almost the entire VIS spectrum is contained with useful information. It can be concluded that the spectral variables that characterize the PC—1 in the range of 515–565 nm may be associated with the band that is related to the PAN complex and the copper cation. For the same main component, there is an important influence of variables in the opposite direction ranging from 425 to 475 nm and which may be related to the fraction of free or uncomplexed PAN.
In the case of the information provided by the loadings of the PC—2, it is interesting to see how the zone where the most relevant wavelengths are presented (505–525 nm and from 550 to 560 nm) corresponds with the area of the VIS spectrum associated with the band of the zinc complex. Therefore, the variability associated with this PC—2, is due in a large extent to the formation of the PAN complex with zinc.
3.8.2 Multivariate curve resolution
Non-negative concentrations and spectra were imposed as constrains for the analysis. First, the concentration profiles of the training set were employed as model inputs to determine the spectral shapes of the components. As observed in Supplementary Figure S5, the MCR algorithm was able to predict the spectra of the pure components in a precise form as deduced from comparison of these profiles with those in Figure 1. This means that the experimental matrix can be satisfactorily modeled by addition of the of the spectra of the pure components, as expected from the Beer law. Then, these pure component spectra were employed to evaluate the concentrations of the samples in the test matrix. As the MCR algorithm calculates relative concentrations, it was found that a scale factor of 2.3 must be applied such that the calculated concentrations correspond with the reference ones. From this evaluation the model performance parameters were determined and reported in Table 1. Clearly, Cu(II) and Zn(II) concentrations profiles are determined in a satisfactorily form, which is not the case of Pb(II) where a very low R2 and a high RMSE values are obtained. This fact is confirmed by visual inspection of the parity plots (Supplementary Figure S6) and the values of the corresponding regression line (R2 = 0.96, 0.86, and 0.002 for Cu(II), Zn(II), and Pb(II), respectively). The results are also consistent with the expected equilibrium constant values (Section 3.1) and the 1—α as a function of log CM(II) plot for the three metal cations (Section 3.5), where the anomalous profile of Pb(II) was indicative of a different performance of the optode for this metal ion. As the three spectral profiles were corrected modeled but only two of the concentration ones, it is then probable that the extraction of Cu(II) and Zn(II) inhibits in some extend that of Pb(II), probably due to the competition for the active sites of the chomophore, leading to a not constant distribution coefficient of this metal ion in the optode under the employed experimental conditions. This effect should be magnified when high concentrations of the metal ions are present in solution as the metal : chromophore mol ratio used reach values between 0.008 and 0.839 for each metal ion in the experimental design matrix.
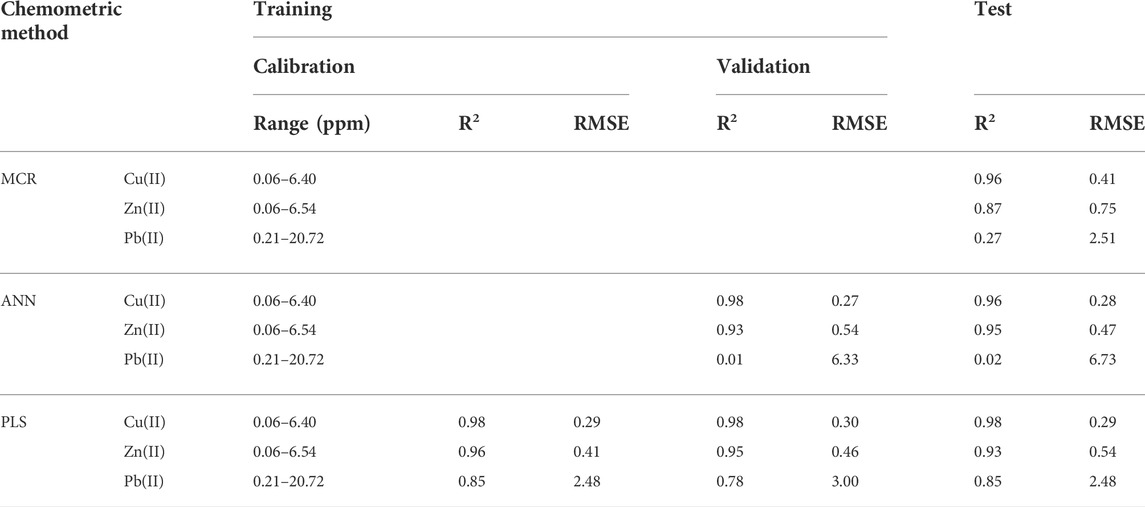
TABLE 1. Performance parameters of the different chemometric models for the simultaneous quantification of the analytes.
3.8.3 Artificial neural netwoks
After optimization a fully connected feed-forward with error back-propagation network was employed. It consisted of 351 inputs neurons (relu activation function), corresponding to the absorbance intensities, and an output consisting of one neuron (no activation function), corresponding to the metal ion concentrations. Between them, a hidden layer of 6 neurons for Cu(II) modeling, and 12 neurons for Zn(II) and Pb(II) modeling (relu activation function), was incorporated. Gradient-based learning was employed using the mean squared error (MSE) as loss function with the Adam optimizer. To prevent over fitting an early stop call-back was added with a patient of 3, training the model by monitoring the minimized loss during 50 epochs. Supplementary Figure S7 shows the MSE loss as a function of epochs for the training and validation sets. After calibration and validation, the model performance parameters were determined and reported in Table 1. Once again, good performance was observed for the cases of Cu(II) and Zn(II), but not for Pb(II), were it was not possible to have good predictions even by modification of the structure of the network. The parity plots of the test samples are shown in Supplementary Figure S8. Their corresponding values of the regression lines are R2 = 0.958, 0.954, and 0.017 for Cu(II), Zn(II), and Pb(II), respectively. It is deduced that the probable irregular distribution of Pb(II) in the optode at different metal ion concentrations, due to the competition for the active sites of PAN which favors the adsorption of Cu(II) and Zn(II), cannot be satisfactorily modeled, as previously indicated in the 1—α as a function of log CM(II) plot (Section 3.5).
3.8.4 Partial least squares regression
PLS was performed on the entire spectrum taking as response one of each M(II) concentrations in the aqueous phases. From Supplementary Figure S9, three latent variables allow to capture a satisfactory cross-validation variance of 97.68% for Cu(II), four latent variables allows 94.71% for Zn(II), and only 77.90% of the variance was accounted for seven latent variables for Pb(II). These numbers of variables were then selected for further data treatment. In Table 1 the model performance parameters are reported. Clearly, comparable values to ANN modeling are obtained for Cu(II), and Zn(II), but better values are attained for Pb(II). The plot of the regression coefficients versus wavelength clearly show spectral features where the range from 560 to 660 nm corresponds to an important fraction of the band associated with the copper (II) complex (Supplementary Figure S10). As for Zn(II), an analysis of the regression coefficients show that the selected range overlaps the bands associated with the zinc complex present in the PIM (Supplementary Figure S10). The results of this section are in fact expected considering the previous discussion where a linear response of the PIM was not observed in the 1—α as a function of log CM(II) curve for Pb(II) and where the loadings of the PCA analysis did not clearly reflect the contribution of its spectrum to the analysis. This means that the response curve of the optomembrane towards Pb(II) is different respect to the cases of Zn(II) and Cu(II). Even though, PLS modeling achieves to capture a significant fraction of variation due to Pb(II) concentration, being this method the most suitable for the simultaneous determination of all metal ions.
To evaluate the presence of systematic errors, i.e., bias effects, the slope and intercept values of the regression equations of the parity plots for the test samples were subject to significant testing using a joined F-test for both statistical parameters (González-Albarrán et al., 2020). Table 2 summarizes the obtained results. As observed no significant differences at the 95% confidence level between these values and the expected ones for the slope (=1) and intercept (= 0) were observed (p-values > 0.05). In spite of this, the inspection of the parity plots (Figure 10) clearly reveals that the uncertainty in Pb(II) concentrations is still very high.
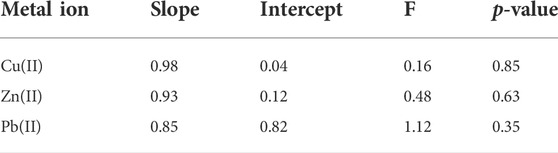
TABLE 2. Significant testing for the slope and intercept of the PLS parity plots for the test samples based on a joined F-test.
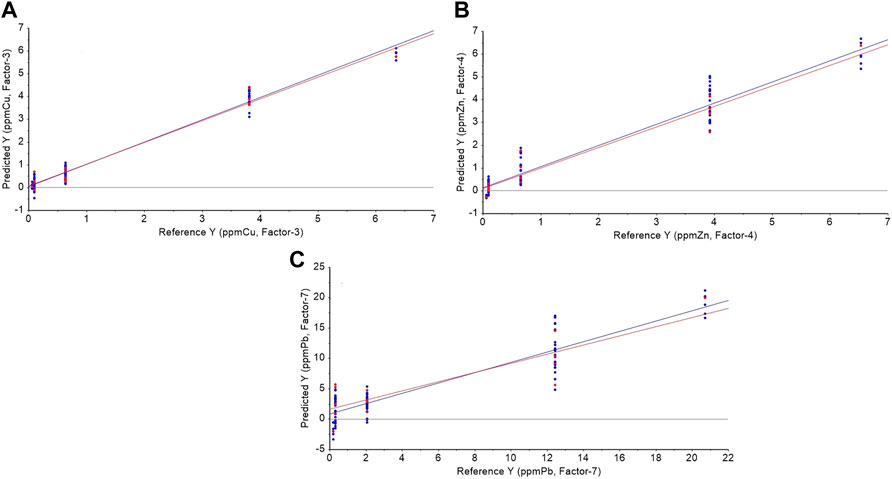
FIGURE 10. Parity plots for PLS modeling of the test samples: (A) Cu(II) with a 3-factor model, (B) Zn(II) with a 4-factor model, and (C) Pb(II) with a 7-factor model. The blue lines represent regression lines for calibration and the red lines for cross-validation.
4 Conclusion
A transparent, homogeneous, and manageable PIM was obtained using cellulose triacetate as polymeric support plasticized with TEHP and PAN as a colorimetric reagent and used to sensor Cu(II), Zn(II), and Pb(II) in aqueous medium. The most significant variables within the detection process in membrane sensors were those that are closely related to the chemical reaction of the detection, that is, the concentration of the metal cation and the number of active sites available in the optomembrane, being this conclusion limited to the variables considered at the levels of study of this work. The optomembrane reached 95% of the optical signal attributed to the process of formation of the different colorful complexes in 20 min, regardless of the metal cation. The durability of the analytical information present in the optomembrane was influenced by the stability of the complexes formed and it was negatively affected by the presence of natural light. The analytical signal remained constant for 9 days for the detection of Pb(II) and Zn(II), while for the case of Cu(II) for 15 days. The CTA—TEHP—PAN PIM was only satisfactorily reversible in the detection of Zn(II) during three continuous detection-regeneration operating cycles. In the case of Pb(II) and Cu(II) the polymer was not reversible; in any case the PIM can be considered as a probe (irreversible sensor, disposable). PCA analysis revealed patterns in the synthetized PIMs mainly associated with the characteristic color changes that they present when exposed to the aqueous solutions containing the metal ions in variable proportions. Three quantitative models were constructed from the VIS spectra information using a central composite design for the simultaneous detection of the cations based on the MCR, ANNs, and PLS chemometric methods. The best results were attained when the last method was employed. Cu(II) and Zn(II) PLS determinations were satisfactorily achieved but not Pb(II) ones, due to the competition for the active sites of the chromophore and the lower extractability of Pb(II) in comparison to the other metal ions at the employed experimental conditions. Although no systematic bias were observed in the evaluation of the parity plots for the test samples of the PLS models, the uncertainty in Pb(II) concentrations was still very high. According to these results, in competing conditions for the ligand, metal ion determinations are favor according to their extractability under the employed experimental conditions.
Data availability statement
The raw data supporting the conclusions of this article will be made available by the authors, without undue reservation.
Author contributions
Conceptualization, AM-R and ER; methodology, AM-R and ER; formal analysis, AM-R, and ER; investigation, AM-R; resources, ER; writing—original draft preparation, AM-R; writing—review and editing, ER; supervision, ER; project administration, ER; funding acquisition, ER.
Funding
This research was funded by CONACYT (project 2011CB167148) and DGAPA-UNAM (project PAPIITIN229219). AM-R acknowledges the CONACYT scholarship.
Acknowledgments
The authors thank Q. Nadia Marcela Munguía Acevedo and Q.F.B. María Guadalupe Espejel Maya for technical services.
Conflict of interest
The authors declare that the research was conducted in the absence of any commercial or financial relationships that could be construed as a potential conflict of interest.
Publisher’s note
All claims expressed in this article are solely those of the authors and do not necessarily represent those of their affiliated organizations, or those of the publisher, the editors and the reviewers. Any product that may be evaluated in this article, or claim that may be made by its manufacturer, is not guaranteed or endorsed by the publisher.
Supplementary material
The Supplementary Material for this article can be found online at: https://www.frontiersin.org/articles/10.3389/frans.2022.971352/full#supplementary-material
References
Absalan, G., Asadi, M., Kamran, S., Torabi, S., and Sheikhian, L. (2010). Design of a cyanide ion optode based on immobilization of a new Co(III) Schiff base complex on triacetylcellulose membrane using room temperature ionic liquids as modifiers. Sensors Actuators B Chem. 147, 31–36. doi:10.1016/j.snb.2010.03.013
Aksuner, N. (2011). Development of a new fluorescent sensor based on a triazolo-thiadiazin derivative immobilized in polyvinyl chloride membrane for sensitive detection of lead(II) ions. Sensors Actuators B Chem. 157, 162–168. doi:10.1016/j.snb.2011.03.044
Alberti, G., Zanoni, C., Magnaghi, L. R., and Biesuz, R. (2020). Low-cost, disposable colourimetric sensors for metal ions detection. J. Anal. Sci. Technol. 11, 30. doi:10.1186/s40543-020-00221-x
Alizadeh, N., Moemeni, A., and Shamsipur, M. (2002). Poly(vinyl chloride)-membrane ion-selective bulk optode based on 1, 10-dibenzyl-1, 10-diaza-18-crown-6 and 1-(2-pyridylazo)-2-naphthol for Cu2+ and Pb2+ ions. Anal. Chim. Acta 464, 187–196. doi:10.1016/s0003-2670(02)00477-4
Almeida, M. I. G. S., Cattrall, R. W., and Kolev, S. D. (2017). Polymer inclusion membranes (PIMs) in chemical analysis - a review. Anal. Chim. Acta 987, 1–14. doi:10.1016/j.aca.2017.07.032
Al-Musharafi, S. K., Mahmoud, I. Y., and Al-Bahry, S. N. (2013). Heavy metal pollution from treated sewage effluent. APCBEE Procedia 5, 344–348. doi:10.1016/j.apcbee.2013.05.059
Arous, O., Kerdjoudj, H., and Seta, P. (2004). Comparison of carrier – facilitated silver(I) and copper(II) ions transport mechanisms in a supported liquid membrane and in a plasticized cellulose triacetate membrane. J. Membr. Sci. 241 (2), 177–185. doi:10.1016/j.memsci.2004.04.024
Betteridge, D., and John, D. (1973). Pyridylazonaphthols (PANs) and pyridylazophenols (PAPs) as analytical reagents. Part I. Synthesis and spectroscopic examination of reagents and some chelates. Analyst 98 (1167), 377–389. doi:10.1039/an9739800377
Betteridge, D., Fernando, Q., and Freiser, H. (1963). Solvent extraction of certain transition metal ions with 1-(2-Pyridylazo)-2-naphthol. A study of complex formation and distribution equilibria. Anal. Chem. 35 (3), 294–298. doi:10.1021/ac60196a007
Betteridge, D., John, D., and Snape, F. (1973). Pyridylazonaphthols (PANs) and pyridylazophenols (PAPs) as analytical reagents. Part III. Formation of copper(II) complexes and their determination in alloys. Analyst 98, 512–519. doi:10.1039/an9739800512
Biesuz, R., Nurchi, V. M., Magnaghi, L. R., and Alberti, G. (2019). Inexpensive Alizarin Red S-based optical device for the simultaneous detection of Fe(III) and Al(III). Microchem. J. 149, 104036. doi:10.1016/j.microc.2019.104036
Blanco, M., and Cerdà, V. (2007). Temas avanzados de quimiometría. Barcelona, España: Intercanvi Científic.
Cheng, K. L., and Bray, R. H. (1955). 1-(2-Pyridylazo)-2-naphthol as possible analytical reagent. Anal. Chem. 27 (5), 782–785. doi:10.1021/ac60101a024
Coo, dlC. L., Cardwell, T. J., Cattrall, R. W., and Kolev, S. D. (2001). Study on the formation constant of the 1-(2´-pyridylazo)-2-naphtol-copper(II) complex in acidic aqueous solutions. C. R. Acad. Bulg. Sci. 4 (54), 53–56.
Dojindo product catalog. 2022 P002 PAN metal indicator. Available at: https://www.dojindo.co.jp/products_en/P002/(accessed April 8th, 2022).
Ensafi, A. A., and Isfahani, Z. N. (2011). A simple optical sensor for cadmium ions assay in water samples using spectrophotometry. J. Anal. Chem. 66, 151–157. doi:10.1134/s106193481102002x
Ensafi, A. A., Meghdadi, S., and Fooladgar, E. (2008). Development of a new selective optical sensor for Cd(II) ions based on 4-hydroxy salophen. IEEE Sens. J. 8 (11), 1794–1800. doi:10.1109/jsen.2008.2005227
García-Beleño, J., and Rodríguez de San Miguel, E. (2021). Integration of response surface methodology (RSM) and principal component analysis (PCA) as an optimization tool for polymer inclusion membrane based-optodes designed for Hg(II), Cd(II), and Pb(II). Membranes 11, 288. doi:10.3390/membranes11040288
González-Albarrán, R., de Gyves, J., and Rodríguez de San Miguel, E. (2020). Determination of cadmium (II) in aqueous solutions by in situ MID-FTIR-PLS analysis using a polymer inclusion membrane-based sensor: First considerations. Molecules 25, 3436. doi:10.3390/molecules25153436
Kebiche – Sendhadji, O., Mansouri, L., Tingry, S., Seta, P., and Benamor, M. (2008). Facilitated Cd(II) transport across CTA polymer inclusion membrane using anion (Aliquat 336) and cation (D2EHPA) metal carriers. J. Membr. Sci. 310 (1 – 2), 438–445. doi:10.1016/j.memsci.2007.11.015
Kuswandi, B., Vaughan, A. A., and Narayanaswamy, R. (2001). Simple regression model using an optode for the simultaneous determination of zinc and cadmium mixtures in aqueous samples. Anal. Sci. 17, 181–186. doi:10.2116/analsci.17.181
Mahani, M. K., Divsar, F., Chaloosi, M., Maragheh, M. G., Khanchi, A. R., and Rofouei, M. K. (2008). Simultaneous determination of thorium and uranyl ions by optode spectra and chemometric techniques. Sensors Actuators B Chem. 133, 632–637. doi:10.1016/j.snb.2008.03.030
Manori Jayawardane, B., dlC Coo, L., Cattrall, R. W., and Kolev, S. D. (2013). The use of a polymer inclusion membrane in a paper-based sensor for the selective determination of Cu(II). Anal. Chim. Acta 25 (803), 106–112. doi:10.1016/j.aca.2013.07.029
Marczenko, Z., and Balcerzak, M. (2000). Separation, preconcentration and spectrophotometry in inorganic analysis. Amsterdam, The Netherlands: Elsevier Science B. V.
National Institute of Advanced Industrial Science and Technology (2012). SDBS compounds and spectral search. Tokio, Japan: AIST. Available at: http://sdbs.db.aist.go.jp/sdbs/cgi-bin/direct_frame_top.cgi.
Nghiem, L. D., Mornane, P., Potter, I. D., Perera, J. M., Cattrall, R. W., and Kolev, S. D. (2006). Extraction and transport of metal ions and small organic compounds using polymer inclusion membranes (PIMs). J. Memb. Sci. 281, 7–41. doi:10.1016/j.memsci.2006.03.035
Oehme, I., and Wolfbeis, O. S. (1997). Optical sensors for determination of heavy metal ions. Mikrochim. Acta 126, 177–192. doi:10.1007/bf01242319
Ooi, S., Carter, D., and Fernando, Q. (1967). The structure of a chelate of copper(II) with 1-(2-pyridylazo)-2-naphthol. Chem. Commun. 24, 1301–1302. doi:10.1039/c19670001301
Pourbasheer, E., Morsali, S., Banaei, A., Aghabalazadeh, S., Reza, G. M., and Norouzi, P. (2015). Design of a novel optical sensor for determination of trace amounts of copper by UV/Vis spectrophotometry in the real samples. J. Industrial Eng. Chem. 26, 370–374. doi:10.1016/j.jiec.2014.12.011
Qazi, H. H., bin Mohammad, A. B., and Akram, M. (2012). Recent progress in optical chemical sensors. Sensors 12, 16522–16556. doi:10.3390/s121216522
Qureshi, I. H., and Cheema, M. N. (1974). Extraction studies of the group Ib, IIb and IIIa-Va elements using 1-(2-pyridylazo)-2-naphthol as chelating reagent. J. Radioanal. Chem. 22, 75–82. doi:10.1007/bf02518093
Raimundo, I. M., and Narayanaswamy, R. (2003). Simultaneous determination of Zn(II), Cd(II) and Hg(II) in water. Sensors Actuators B Chem. 90, 189–197. doi:10.1016/s0925-4005(03)00027-3
Ruckh, T. T., Mehta, A. A., Dubach, J. M., and Clark, H. A. (2013). Polymer-free optode nanosensors for dynamic, reversible, and ratiometric sodium imaging in the physiological range. Sci. Rep. 3, 3366–3371. doi:10.1038/srep03366
Saji, J., and Reddy, M. L. P. (2003). Selective extraction and separation of titanium(IV) from multivalent metal chloride solutions using 2-ethylhexyl phosphonic acid mono-2-ethylhexyl ester. Sep. Sci. Technol. 38 (2), 427–441. doi:10.1081/ss-120016583
Sayo, S., Kiratu, J. M., and Nyamato, G. S. (2020). Heavy metal concentrations in soil and vegetables irrigated with sewage effluent: A case study of embu sewage treatment plant, Kenya. Sci. Afr. 8, e00337. doi:10.1016/j.sciaf.2020.e00337
Seiler, K., and Simon, W. (1992). Theoretical aspects of bulk optode membranes. Anal. Chim. Acta 266, 73–87. doi:10.1016/0003-2670(92)85281-a
Shahabadi, V. Z., Akhond, M., Tashkhourian, J., and Abbasitabar, F. (2009). Characterization of a new uranyl selective bulk opotode; utilizing synergistic effect in optical sensor. Sensors Actuators B 141, 34–39.
Tavallali, H., Shaabanpur, E., and Vahdati, P. (2012). A highly selective optode for determination of Hg(II) by a modified immobilization of indigo carmine on a triacetylcellulose membrane. Spectrochim. Acta. A Mol. Biomol. Spectrosc. 89, 216–221. doi:10.1016/j.saa.2011.12.055
Thakur, N., Kumar, S. A., Ajish Kumar, K. S., Pandey, A. K., Kumar, S. D., and Reddy, A. V. R. (2015). Development of a visual optode sensor for onsite determination of Hg(II). Sensors Actuators B Chem. 211, 346–353. doi:10.1016/j.snb.2015.01.087
Tharakeswar, Y., Kalyan, Y., Gangadhar, B., Sujan, K. K., and Ramakrishna, N. G. (2012). Optical chemical sensor for screening Cadmium(II) in natural waters. J. Sens. Technol. 2, 68–74. doi:10.4236/jst.2012.22010
Keywords: polymer inclusion membrane (PIM), optode, metal ion, chemometrics, PAN
Citation: Mancilla-Rico AJ and Rodríguez de San Miguel E (2022) Simultaneous determination of Cu(II), Zn(II), and Pb(II) from aqueous solutions using a polymer inclusion membrane (PIM) based-sensor with 1-(2-pyridylazo)-2-naphthol (PAN) as chromophore and chemometric methods. Front. Anal. Sci. 2:971352. doi: 10.3389/frans.2022.971352
Received: 17 June 2022; Accepted: 24 August 2022;
Published: 12 September 2022.
Edited by:
Dmitry Kirsanov, Saint Petersburg State University, RussiaReviewed by:
Piyaluk Nurerk, Walailak University, ThailandAndrey Kalinichev, Saint Petersburg State University, Russia
Copyright © 2022 Mancilla-Rico and Rodríguez de San Miguel. This is an open-access article distributed under the terms of the Creative Commons Attribution License (CC BY). The use, distribution or reproduction in other forums is permitted, provided the original author(s) and the copyright owner(s) are credited and that the original publication in this journal is cited, in accordance with accepted academic practice. No use, distribution or reproduction is permitted which does not comply with these terms.
*Correspondence: Eduardo Rodríguez de San Miguel, ZXJkc21nQHVuYW0ubXg=