 Mariangela Raimondo
 Francesca Prestinaci
 Federica Aureli
 Giulia D’Ettorre
 Maria Cristina Gaudiano
- Chemical Medicines Unit, National Centre for the Control and Evaluation of Medicines, Istituto Superiore di Sanità, Rome, Italy
Introduction: The characterisation of active substances is an essential tool to ensure the traceability and authenticity of legal medicines. Metformin is a well-established biguanide derivative recommended in oral formulations as a first-line treatment for type 2 diabetes. With its increasing demand, metformin is likely to be an attractive target for falsification and substandard production, thus posing health risks to consumers. Methods that are able to identify even small differences in active pharmaceutical ingredients (APIs) are deemed necessary. The detection of fraudulent practices in APIs is not straightforward, and a single technique that can provide sufficient information to unambiguously address this issue is still not available.
Methods: This study investigated an integrated analytical platform based on NIR, 1H-NMR, 13C-NMR, and high-resolution LC-MS combined with chemometrics to profile 32 metformin hydrochloride samples originating from several global authorised manufacturers. The study's aim was to explore differences in the chemical characteristics of metformin hydrochloride APIs to identify or predict a possible classification for each manufacturer in view of prospective authenticity studies. Different pre-processing methods were applied; bucket tables for 1H- and 13C-NMR were obtained, while mass spectrometry data were processed in targeted and untargeted modes. Datasets were individually analysed and merged by a multivariate unsupervised method and performing principal component analysis (PCA).
Results and Discussion: The results evidenced differences in cluster behaviour, depending on manufacturers. Each technique has shown a specific clustering tendency, highlighting how different analytical approaches are able to characterise metformin APIs. Some manufacturers’ samples, however, showed similar behaviour independently of the techniques. NIR and 1H-NMR were confirmed as the more predictive techniques if taken individually; 1H-NMR, in particular, achieved good separation between the samples of the two most representative manufacturers. For LC-MS, the targeted approach resulted in a separation in groups clearer than that of the untargeted approach. Nevertheless, the untargeted LC-MS approaches presented in this paper could be a possible alternative to obtaining different information for drug substances, with several different and complex synthetic pathways leading to several unknown impurities. Further grouping of manufacturers emerged by data fusion, highlighting its potential in the traceability of metformin.
1 Introduction
Diabetes mellitus is a chronic metabolic disorder of multiple aetiologies characterized by hyperglycaemia; it affects over 400 million people worldwide (World Health Organization, 2022). Type 2 diabetes (adult-onset or non-insulin-dependent diabetes) accounts for 90% of diagnosed cases of diabetes and represents an increasing threat to public health, with significant mortality and co-morbidities. Metformin is a well-established biguanide derivative (Figure 1) recommended in oral formulations as a first-line treatment for type 2 diabetes due to its: i) efficacy in controlling blood glucose levels with a low risk of hypoglycaemia, ii) potential use in monotherapy or in combination with other glucose-lowering agents, and iii) low costs of production (Viollet et al., 2012; Rojas and Gomes, 2013; Buse et al., 2020; Giaccari et al., 2021). WHO reported metformin in the model list of oral hypoglycaemic agents considered to be essential medicines, that is, medicines that satisfy the priority healthcare needs of a population selected with due regard to disease prevalence and public health relevance, evidence of efficacy and safety, and comparative cost-effectiveness (World Health Organization, 2021).
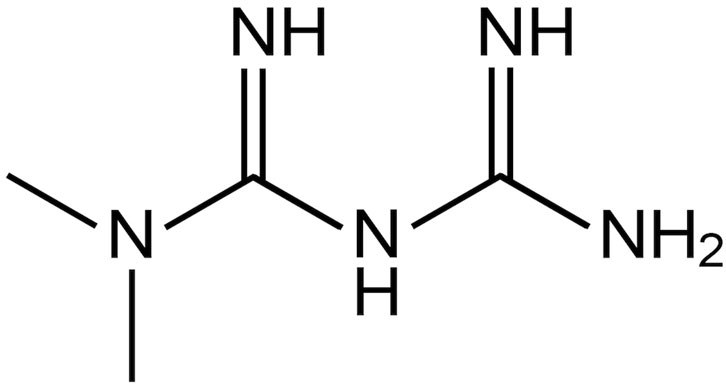
FIGURE 1. Metformin molecular structure.
With increasing demand, metformin is likely to be an attractive target for falsification and substandard production. This may pose health risks to consumers, considering the high dosage in adults (up to 3 g/day), use in the children (Khokhar et al., 2017), and use in long-term therapy.
This risk could be due to low-quality drugs with unknown impurities or residual solvents sourced from the manufacturing process. Moreover, in 2019, the possible presence of the carcinogenic impurity N-nitrosodimethylamine (NDMA) in metformin products resulted in the introduction of new appropriate control strategies as additional quality requirements for the manufacturers (Keire et al., 2022). On the other hand, the branching of the supply chain increases the risk of the falsification of active pharmaceutical ingredients (APIs); therefore, the traceability of active substances represents an essential albeit demanding necessity (Raimondo et al., 2022).
The fraudulent use of metformin API, as well as other drug substances from different unauthorised manufacturers, cannot be excluded. This kind of fraud is proscribed as pharmaceutical falsification under European Directive 2011/62/UE (European Parliament and the Council of the European Union, 2011). The risks related to this kind of falsification arise from the use of low-cost APIs manufactured under different, uncontrolled, or unapproved processes.
Nevertheless, in many cases an API produced by unapproved manufacturers complies with the official quality controls (e.g., the controls prescribed by the European Pharmacopoeia specific monograph and general chapters). For this reason, methods able to detect even small differences in APIs originating from different manufacturers are deemed necessary.
In recent years, studies of fingerprinting analysis to discover possible falsifications of medicinal products or APIs have been performed (Anzanello et al., 2014; Custers et al., 2014; Acevska et al., 2015; Custers et al., 2016a; Raimondo et al., 2020; Deconinck et al., 2022). The European Official Medicines Control Laboratories (OMCLs) network performed fingerprinting studies on APIs of different manufacturers/origins to develop a tool to detect falsification of the origin of active ingredients (Raimondo et al., 2020; Rebiere et al., 2022).
The detection of fraudulent practices in APIs is not straightforward, and a single technique that can provide sufficient information to unambiguously address this issue is still not available. Recent articles have reported the fingerprinting of APIs of different origins by using a combination of different analytical techniques (Deconinck et al., 2022; Rebiere et al., 2022). Spectroscopy techniques combined with chemometrics are most commonly used for authentication and traceability (Biancolillo and Marini, 2018; Mees et al., 2018).
NIR spectroscopy, based on chemical composition and physical properties, is a rapid and non-destructive technique that is considered a fingerprint technique when associated with chemometric methods (Roggo et al., 2007; de Peinder et al., 2008; Storme-Paris et al., 2010; Been et al., 2011; de Silva Fernandes et al., 2012; Custers et al., 2016b; Rodionova et al., 2018; Rodionova et al., 2019).
NMR spectra provide several kinds of information on the structure of the main molecule and its impurities (Winning et al., 2008; Pacholczyk-Sienicka et al., 2021). Indeed, the number of chemometric studies applied to NMR spectra is rapidly increasing due to the significant results that this analytical technique has demonstrated in the field of pharmaceuticals, food, and plants (Deconinck et al., 2022).
The combination of NMR spectroscopy and multivariate classification approaches has recently been used to identify the fingerprints of pharmaceutical chemical substances (Raimondo et al., 2020; Deconinck et al., 2022; Raimondo et al., 2022) and to detect the origin of biological molecules such as heparin (Colombo et al., 2022).
LC-MS is considered another analytical technique that, combined with chemometric analysis, offers significant information that can detect even slight differences among active substances (Nicolas and Scholz, 1998; Acevska et al., 2015). In this regard, LC-MS quadrupole-time-of-flight (Q-TOF) relies on the chromatographic signal of the ion current or a specific region of chromatograms of trace organic impurities (Deconinck et al., 2008). This technique has usually been applied to identify specific compounds that can be linked to side reactions of the synthetic process of the active substance (Schneider and Wessjohann, 2010; Chen et al., 2022).
This study investigated an innovative integrated analytical platform based on NIR, 1H-NMR, 13C-NMR, and LC-MS Q-TOF (with targeted and untargeted approaches in data processing) combined with chemometric tools to profile 32 metformin hydrochloride samples originating from several authorised manufacturers distributed worldwide. The aim of the present study was to explore differences in the chemical characteristics of metformin hydrochloride APIs to identify or predict a possible classification for each manufacturer in view of perspective authenticity studies.
2 Materials and methods
2.1 Sample collection
Metformin API samples were collected from Marketing Authorization Holders of medicinal products, upon request of the Italian Medicines Agency during post-marketing surveillance activities on the legal supply chain. Some 32 samples from 11 worldwide manufacturers were collected by the National Authority and sent to the Italian OMCL for analysis, along with the release certificate from the manufacturer. Each sample was identified with a chemometric code (Xn) (see Table 1. Samples of one manufacturer were produced in sites located in two different countries so that the chemometric code was different for each site. Multiple lots were made available from eight different metformin producers. Aliquots of samples were used for NIR, NMR, and LC-MS analyses.
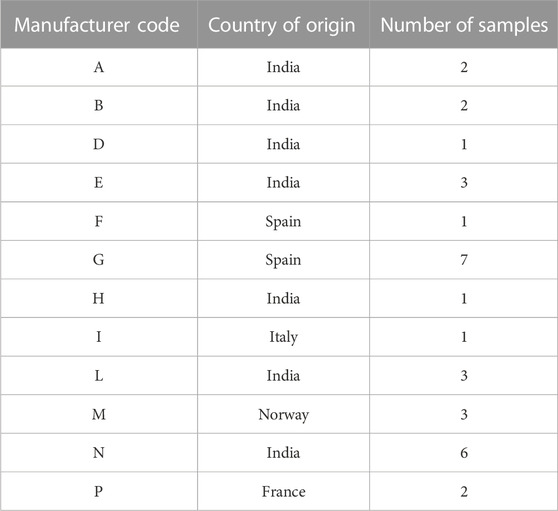
TABLE 1. List of metformin API samples included in the study.
2.2 Analytical detection
NIR, NMR, and LC-MS were selected in this study to provide information not only on the molecular structure of metformin hydrochloride but also on its impurity profile.
2.2.1 NIR spectroscopy
NIR spectra were acquired using an Agilent Cary 660 spectrometer (Agilent Technologies Inc., Santa Clara, California, United States) equipped with a NIR integrating sphere (PIKE NIR INTEGRATIR™) under the following analytical conditions: wavenumbers ranging from 4,000 cm−1 to 10,000 cm−1, resolution 4.0 cm−1, and 32 scans. The powder was transferred into a flat bottom NIR transparent glass vial and analysed at 20°C–25°C with no sample pre-treatment. Agilent Resolution Pro® Software version 5.2.0 was used to check the instrument performance and to process the spectra acquired in the absorbance scan type (Figure 2). Data extracted were exported and arranged in a dataset (32 samples and 3,113 wavelengths) efore processing by chemometric analysis.
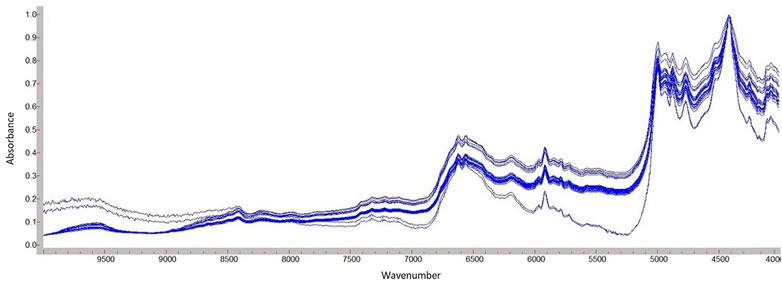
FIGURE 2. NIR spectra of metformin hydrochloride API samples.
2.2.2 NMR spectroscopy
Dimethyl sulfoxide (DMSO-d6) at 99.9% deuteration degree with 0.03% (v/v) TMS (Cambridge Isotope Laboratories, CIL) was used. An amount of 10 ± 0.06 mg of the metformin hydrochloride active substance was dissolved in 3 mL of DMSO-d6 to obtain a solution of 0.02 M. DMSO-d6 was selected on the basis of Gadape and Parikh (2011). A rational consideration of the use of deuterium solvent was performed, considering also the solubility of metformin in D2O and DMSO-d6. Deuterated DMSO was intentionally used to obtain metformin hydrochloride and its impurities’ overall spectra to check the correct assignment of all 1H-NMR protons; if D2O is used, all exchangeable NH protons disappear from the spectrum. The sample solution was heated at about 35°C under stirring and then vortexed for 1 min. The solution (0.7 mL) was transferred to an NMR tube.
NMR experiments were carried out on a Bruker Avance NEO spectrometer (Bruker BioSpin Gmbh, Billerica, Massachusetts, United States) operating at a frequency of 600 MHz (14.1 T), equipped with SMART PROBE iProbe 5 mm with Z-gradient.
Acquisitions and processing were automatically performed using IconNMR® software (Bruker BioSpin Gmbh, Billerica, Massachusetts, United States) after TopSpin® version 4.1.3 (Bruker BioSpin Gmbh, Billerica, Massachusetts, United States) configuration for the matching and tuning, lock on DMSO-d6, shimming, and acquisition parameters.
The acquisition parameters for monodimensional 1H-NMR experiments were optimized at a temperature of 298.0 K, pulprog zg, 32 scans, delay time of 5 s, 90° pulse (10 µs, pldB −12.30 dB), and spectral window of 20 ppm.
For 13C-NMR, the acquisition parameters were set as follows: temperature 298.0 K, pulprog zgpg30, 512 scans, delay time 2 s, 90° pulse (12 µs, pldB −12.30 dB), and spectral window 240 ppm.
A blank acquisition for 1H-NMR and 13C-NMR with only DMSO-d6 solvent was carried out.
The spectra were processed manually using the data analysis software package Bruker TopSpin® version 4.1.3, applying 0.3 Hz line broadening, 0th and 1st order correction phase, and automatic baseline correction by polynomial and chemical shift calibration to the DMSO-d6 signal at 2.50 ppm.
The spectra of the 32 samples were aligned using AssureNMR® (Bruker Corporation, Billerica, Massachusetts, United States); starting from this processing, 1H- and 13C-bucketed tables were generated.
The 1H-NMR table was set considering the spectrum from 8.00 ppm to 0.0 ppm. Specific regions of chemical shift with a bucketing width of 0.05 ppm represent the bucket. Signal regions of either DMSO-d6 (2.64–2.36 ppm) or H2O (3.43–3.30 ppm) were excluded from the table. The integration mode was set on the sum of the intensities; the scaling mode applies the scaling factor to compare the NMR spectra uniformly. The chosen option was scaled to the total integral of all buckets, which divides individual bucket intensities by the total spectral intensity (Bruker Corporation, 2019). To reduce noise, a smoothing of spectra was performed using the Savitzky–Golay filter of 10.0 Hz. The data matrix of the 1H-NMR was composed of 160 variables.
The 13C-NMR buckets were created, defining the region at 160–35 ppm and a bucketing width of 1 ppm. From the estimation of intensities, the region of DMSO-d6 was excluded (40.4–39.6 ppm). Any spectra manipulation was applied considering that the carbon spectrum of metformin is represented only by four signals. The data matrix of the 13C-NMR was composed of 125 variables.
2.2.3 LC-MS analyses
All reagents and solvents were of LC-MS grade. An amount of 10 ± 0.5 mg of each sample was weighed and dissolved in a 10 mL mixture acetonitrile/water 1:1 (v/v) containing 0.1% (v/v) formic acid. Samples were vortexed until dissolution was visually observed and then filtered through Nylon 0.22-µm filters. Each sample was analysed on the day of preparation. Procedural blanks were prepared with the same solvents used for samples and run in parallel; specifically, blank samples were injected in triplicate at the beginning of the analytical session and after each sample run.
MS analyses were performed on a Fast LC Mod.1290 Infinity system coupled to a Q-TOF mass spectrometer detector Mod. G6520B (Agilent Technologies) equipped with a Dual ESI source working in the positive ion mode. Mass parameters were set as follows: the source’s nitrogen temperature was 300°C, the drying gas flow rate was 10 L/min, the nebulizer was set at 40 psig, Vcap = 4,000 V, the fragmentor was 100 V, and the skimmer was 65 V. The MS acquisition range was 100–1,200 Da with a rate of 2 spectra/s. The system was calibrated with a mixture of reference masses at the beginning of each working day. The chromatographic analysis consisted of a 15 min linear gradient elution at a flow rate of 0.4 mL/min from 100% of mobile phase A containing 0.1% (v/v) of formic acid in 95:5 (v/v) water/acetonitrile to 100% of mobile phase B containing 0.1% (v/v) of formic acid in 5:95 (v/v) water/acetonitrile. The system was then returned to the initial conditions which were kept for 5 min. The chromatographic column (1.8 µm Zorbax Extend-C18, 2.1 × 50 mm) was thermostated at 35°C. The injection volume was 1 µL, and the autosampler was thermostated at 15°C.
Raw chromatographic and spectral data were extracted and processed using MassHunter Qualitative Analysis® version B.07.00 software and MassHunter Profinder® version 10.0 (Agilent Technologies).
From each sample data file, raw data in the form of total ion chromatograms (TIC), i.e., total ion intensity vs. retention time (R.T.) from 0 to 15 min were extracted by MassHunter Qualitative Analysis®. A shift of 3 m was observed in the R.T. due to the electronic characteristic of the instrument; therefore, data were aligned a posteriori.
A second set of data was obtained for each API sample in targeted mode by the extracted ion chromatograms (EIC) (intensity of the targeted ion vs. R.T.) of the known impurities reported in the EP Metformin Monograph (European Pharmacopoeia, 2022) and of other possible molecules. The extracted chromatogram of each calculated m/z values [(M + H)+ ions] was evaluated with a “yes/no” approach. Peak presence (signal/noise >3) was encoded by 1 and peak absence by 0.
A third processing approach in “untargeted mode” was tentatively assessed. MassHunter Profinder® software (Agilent Technologies, 2017) was used for molecular feature extraction (MFE), followed by retention time and mass alignment across the sample dataset. MFE aims to remove chemical background and rapidly find feature peaks in total ion chromatograms by taking isotope distribution into account (Benito et al., 2018). Features were extracted with an algorithm (polynomial interpolation) for common organic molecules with the following filters: m/z range (100–1,200 m/z), peak height (>50 counts), ion species (protonated ion, sodium adduct, potassium adduct, and neutral loss of water), charge state (set to a maximum of 2), maximum exact mass (<1,000 Da), peak spacing tolerance (0.0025 m/z, plus 7 ppm), MFE score (70%), R.T. alignment (0.1%, plus 0.3 min), and mass alignment (5 ppm, plus 2 mDa). Finally, all the features were checked to remove those containing atypical peak shapes or unusual isotopic distributions. Of the extracted features, only those not present in all samples were regarded as possibly discriminating and considered. Peak presence was encoded by 1 and peak absence by 0. A list of 104 grouped multiple peak entities (named extracted compound chromatograms or ECCs), defined by their mass-to-charge ion ratios, retention time, and peak intensity, was created and then exported to an Excel datasheet for further analysis.
2.3 Chemometric methods
Analytical data were collected as numeric data for NIR, 1H-NMR, 13C-NMR, and for LC-MS Q-TOF (TIC, EIC, and ECC data). Each dataset, obtained as previously described, was analysed individually by a multivariate unsupervised method, performing a principal component analysis (PCA). The low- and mid-level fusions were performed, combining two or three techniques and carrying out a PCA on these new datasets.
The Statistics and Machine Learning Toolbox (The MathWorks, Natick, MA, United States) and PCA_toolbox for MATLAB-version 1.4 (Milano Chemometrics and QSAR Research Group) (Ballabio, 2015) were used with MATLAB R2022b® software (The MathWorks, Natick, MA, United States).
3 Results
3.1 NIR spectroscopy
Several pre-processing methods were applied, before the application of PCA, in this order: multiplicative scatter correction (MSC), first and second derivative, standard normal variate (SNV), smooth processing, mean-centering, autoscaling, and a combination of these methods.
From the evaluation of different pre-treatments, the combination of SNV, first derivative, and mean-centering was used for the PCA.
The cross-validation PCA models demonstrated that PC1 explained 92.38% of variability. The score plot (Figure 3) of the NIR data showed the trend as clustering in four groups.
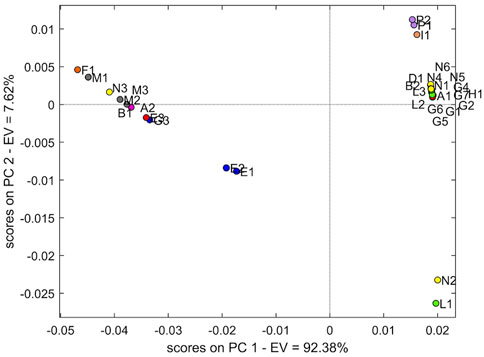
FIGURE 3. Score plot of PCA with two principal components using the NIR dataset.
The largest group with a positive PC1 and PC2 is mostly represented by samples from manufacturers N and G with several contaminations: two samples from manufacturer L (L2 and L3), B2, A1 and H1, while a second group composed of more samples is placed at negative PC1 and positive PC2. Specifically, the three samples M (Norwegian manufacturer) occur in this last group. The samples P1 and P2 (French manufacturer) constitute a small group together with sample I1. Finally, samples E1 and E2 account for the fourth individual group, with the sample E3 slightly distant.
The T2 value was calculated on the complete dataset (32 samples) to evaluate whether N2 and L1 could be regarded as outliers. The T2 value of N2 and L1 confirms the higher distance with respect to the two principal groups (9.8434 and 12.4503, respectively). Moreover, considering independently the datasets of manufacturers N and G, the T2 value > 1 of N3 and G3 confirmed the behaviour as outliers of these specific manufacturer groups (Table 2). Also in this specific evaluation, the N2 sample is confirmed as an outlier for manufacturer N. The PCA without the four outliers confirms the separation into the four groups described previously. It was not possible to define a clear wavelength area of the spectrum that would result in this grouping.
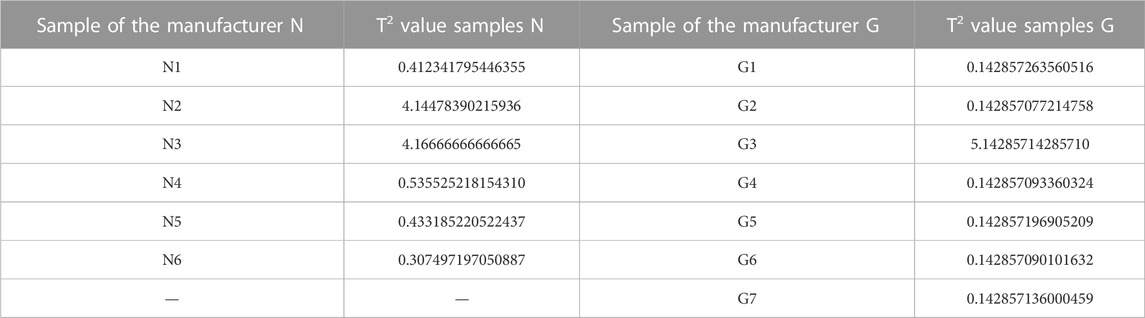
TABLE 2. T-square values of the manufacturers N and G for NIR spectroscopy data.
3.2 NMR spectroscopy
Figure 4 shows the monodimensional 1H-NMR overlapped and aligned spectra of the 32 samples of metformin hydrochloride. The singlet of the two equivalent methyl groups at 2.92 was observed. The proton signal of the single -NH group is present at 7.20 ppm; the proton of the two = NH groups and the protons of the -NH2 group are assigned to 6.64 ppm (Gadape and Parikh, 2011).
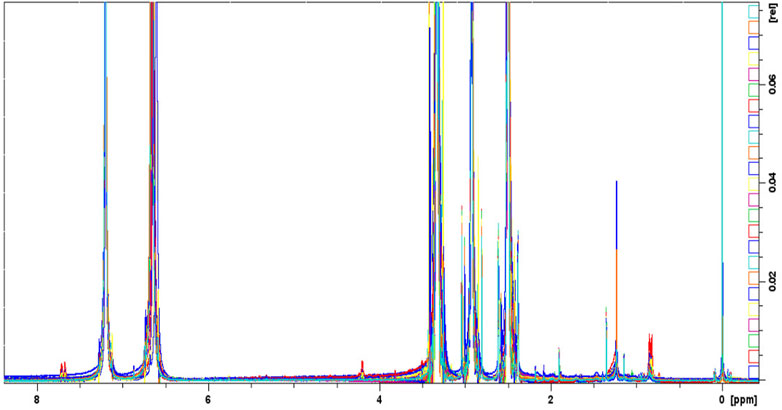
FIGURE 4. Overlapped aligned mono-dimensional 1H-NMR spectra of metformin hydrochloride samples.
The monodimensional 13C-NMR spectra show the four signals of metformin hydrochloride carbons at the following chemical shifts δ: 159.68 (-CH), 158.80 (-CH), 40.52, and 37.90 (2 C of the –CH3).
The data in the bucketed table were pre-treated before PCA using the autoscaling approach.
The PCA model with two PCs explained 77.3% of the variability. Figure 5A shows the PCA of the 1H-NMR dataset. An overall separation into two groups representing 93.7% of the sample population is evident. The remaining samples (n = 2, 6.3%) are distant from the two groups.
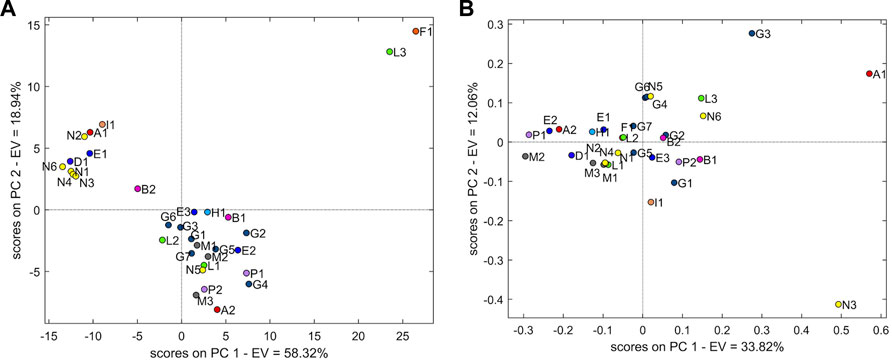
FIGURE 5. (A) Score plot of PCA with two principal components using the 1H-NMR dataset. (B) Score plot of PCA with two principal components using the 13C-NMR dataset.
The first group (n = 21 samples, accounting for 65.6% of the sample population) is represented mainly by samples G (G1–G7) from the Spanish manufacturer, samples M (M1–3) from the Norwegian manufacturer, and samples P (P1–2) from the French manufacturer. In addition, some more samples from manufacturers E (E2–E3), B (B1–B2), N (N5), H (H1), A (A2), and L (L1–L2) belong to this group. The evaluation of loading showed the chemical shift regions (ppm) at 6.50–6.45, 6.45–6.40, 6.40–6.35, 6.35–6.30, 6.30–6.25, 6.25–6.20, 6.20–6.15, 6.15–6.10, 6.10–6.05, 6.05–6.00, 6.00–5.95, 5.95–5.90, 5.90–5.85, 5.85–5.80, 5.70–5.65, 3.35–3.30, 2.80–2.75, 2.75–2.70, 1.90–1.85, 1.25–1.20, and 0.85–0.80.
In the second group (n = 9 samples, accounting for 28.1% of the sample population), samples N are predominant, notwithstanding N5 being placed in the first group. Other samples of different manufacturers are present: E1, A1, I1, and D1. All samples of this group, excluding I1, originated from India. The loadings associated with this group are in the chemical shift regions (ppm) at 8.00–7.95, 7.95–7.90, 7.90–7.85, 7.85–7.80, 7.80–7.75, 7.65–7.60, 7.60–7.55, 7.55–7.500, 7.50–7.45, 7.45–7.40, 7.40–7.35, 7.00–6.95, 6.95–6.90, 6.90–6.85, 6.85–6.80, 6.80–6.75, 6.75–6.70, 6.70–6.65, and 4.25–4.20.
Sample F1 is the only one from manufacturer F, originating from Spain. Adjacent to F1 is the sample L3, which is farther from L1 and L2.
For the 13C-NMR, the PCA was performed using mean-centring pre-treatment and three components (68.0% explained variability). All samples were clustered together in one cloud, although grouping tendency was represented as well as the samples of manufacturer M (M1–M3) (Figure 5B).
3.3 LC-MS Q-TOF spectrometry
The evaluated data on LC-MS encompassed TIC data (total ion intensity vs. R.T.), EIC (extracted ion chromatograms), and ECC (extracted compound chromatograms). Only the EIC can be considered a targeted approach (Verzele et al., 2007), while both total ion intensity and molecular feature extraction (ECC data) are seen overall as untargeted analyses (Erny et al., 2016; Martínez-Bueno et al., 2019; Erny and Santos, 2021; Xue et al., 2022). Figure 6 shows an example of ECC of an unknown molecule in metformin samples with average mass = 326.0007 Da and R.T. at 7.3 min.
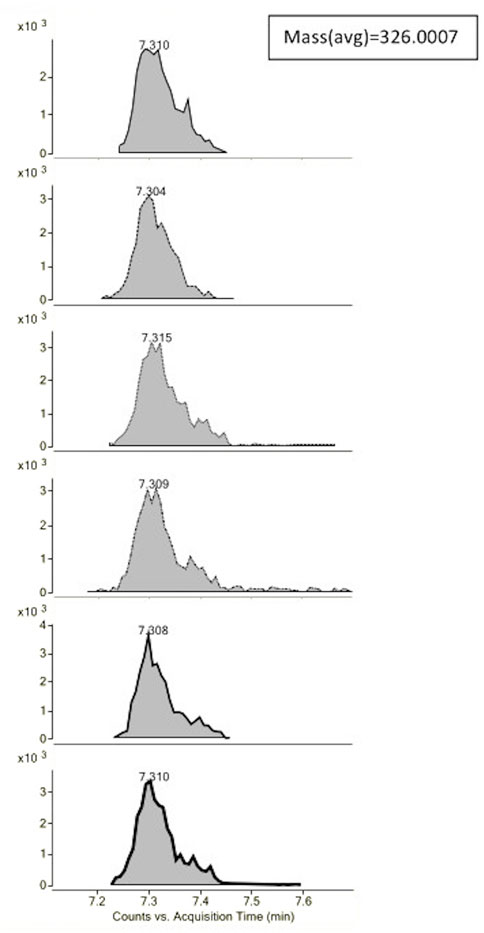
FIGURE 6. Example of the extracted compound chromatograms (ECCs) obtained by MassHunter Profinder® for six samples for an unknown compound found by the software application at R.T. = 7.3 min with average mass = 326.0007 Da.
The TIC dataset, comprising 1801 variables, was pre-treated with smooth and mean-centering. The PCA models with two PCs explained 91.75% of the variability. Figure 7A shows that the TIC data do not provide a clear separation of the samples. A major cloud is influenced by PC2, and it is represented by all M samples (M1–3), samples G (G1, G2, G5, and G6), N (N3, N4, N5, and N6), E (E1 and E3), P2, H1, I1, B1, and L2; the second group samples are more scattered: N (N1 and N2), G (G4 and G7), L (L3 and L1), F1, P1, E2, D1, and A1. Interestingly, L1 and N2 are closer than observed in PCA obtained by NIR data.
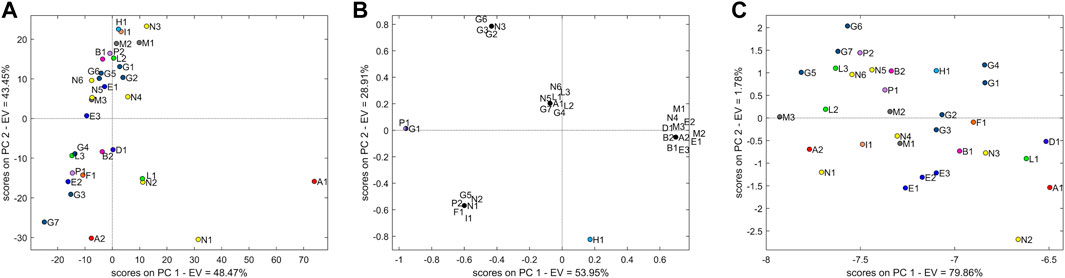
FIGURE 7. (A) Score plot of PCA with two principal components using the untargeted LC-MS TIC dataset. (B) Score plot of PCA with two principal components using the targeted LC-MS EIC dataset. (C) Score plot of PCA with two principal components using the untargeted LC-MS ECC dataset.
The EIC dataset included 14 identified variables. Only 3 m/z signals corresponding to the known Eur. Ph. impurities E (1-methylbiguanide), C (N2,N2-dimethyl-1,3,5-triazine-2,4,6-triamine (N,N-dimethylmelamine)), and B [(4,6-diamino-1,3,5-triazin-2-yl)guanidine] were not systematically present/absent in all samples and were therefore considered analytically distinctive.
The PCA (Figure 7B) shows a separation of the samples into groups (explained variance 82.86%). The most abundant group influenced by PC1 is represented by all samples from producer M (M1–3) and E (E1–3), along with B (B1, B2), D, and a single contamination by A. Samples G and N are not clearly explained by different clusters and are fairly scattered along the plot. Sample H stands for an individual point, well separated from all the others. All L samples are grouped together. The loading more associated with this group is represented by the m/z signals at 155.1040 (impurity C of the Eur. Ph. monograph).
As with EIC, the ECC dataset (104 variables) was not pre-treated, and two principal components explained 81.6% of variability. All samples were grouped together in one cloud without an evident clustering, although grouping tendency was observed in samples from manufacturer E (E1–3) (Figure 7C).
3.4 Fusion of the analytical datasets
Fusion was performed by sequentially combining two or three analytical approaches among NIR, 1H-NMR, 13C-NMR, TIC, EIC, and ECC. The PCA obtained by low-level fusion did not evidence new clusters with respect to the PCA carried out with a single technique (data not shown).
The scenario changes using the mid-level fusion. The combination of two techniques improved the results of the LC-MS Q-TOF and 13C-NMR techniques. A good separation was reported by combining the NIR and EIC databases. The separation of samples M and E is evident in the PCA. Moreover, a significant combination was reported by 13C-NMR and EIC data that allow the identification of a group with the samples B, E, and M and another group containing the three samples L—confirming the results observed by EIC. Finally, the combinations with 1H-NMR did not show results different than the use of a single technique, represented by the separation of groups N and G. The combination of TIC and 1H-NMR data was performed, but no significant improvement on clustering was observed (data not shown).
The mid-level fusion combining three analytical techniques demonstrated that the NIR-13C-NMR-EIC fusion led the best separation: the samples L were grouped together, and the samples B, E, and M formed another group. The sample of manufacturer H (H1) showed characteristic behaviour; this sample is isolated from the other groups (Figure 8).
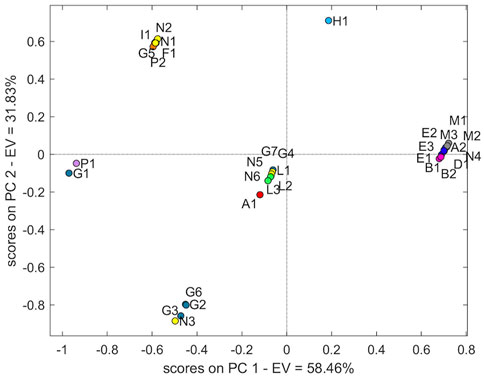
FIGURE 8. Score plot of PCA with two principal components using the NIR-13C-NMR-EIC fusion dataset.
4 Discussion
This manuscript investigated the characterisation of the metformin drug substances of different manufacturers with NIR, 1H-NMR, 13C-NMR, and high-resolution LC-MS combined with multivariate analysis to determine a possible classification for each manufacturer in view of prospective authenticity studies.
The PCA presented in this study was able to separate different batches of metformin from the same manufacturer. Specifically, M samples are generally close in a cluster, as shown by the PCAs of NIR, 1H-NMR, 13C-NMR, and LC-MS EIC data, and E samples are mainly grouped in LC-MS (in targeted EIC and in untargeted ECC data) and partially in NIR and 13C-NMR.
Among all the investigated analytical techniques, NIR and 1H-NMR data provide the most suitable separation in groups of the samples. In the NIR data, the largest cluster is represented by the G and N samples. The 1H-NMR represents the only technique that distinguished samples N from samples G and associated specific chemical shift regions at these clusters. Both NIR and 1H-NMR showed the proximity of samples P (P1 and P2) in the plots. A more dispersed behaviour was observed for other manufacturers—L1 and N2 in NIR; 13C-NMR, LC-MS TIC, and partially in LC-MS ECC; P2 and I1 in NIR; 13C-NMR, LC-MS TIC, and LC-MS EIC. These are positioned close to one another and show similar behaviour in the PCAs.
PCA on mid-level data fusion was able to separate in a cluster the B, E, and M samples and another in the L samples. The single H sample is well-separated from all other samples.
13C-NMR and NMR data processing with bucket tables in combination with multivariate analysis was applied. The PCA of 13C-NMR indicated a tendency of some samples to gather, although a clear separation of clusters could not be defined. The combination of 13C-NMR and chemometric methods has been mainly used to obtain a fingerprint in metabolomic studies, whereas the pharmaceutical studies are limited (Silvestre et al., 2009; Ohmenhaeuser et al., 2013; Erich et al., 2015; Lia et al., 2020).
The bucket tables allowed the characterization of batches by assessing the normalised intensity differences in specific chemical shift regions. The bucketing method could be used to reduce the minor NMR peak misalignment influence due to different pH, salt, and even temperature issues (Emwas et al., 2018; Wang et al., 2020).
Overall, the 1H-NMR combined with PCA is confirmed as a good approach to identify small differences in pharmaceutically active substances (Krakowska et al., 2016; Raimondo et al., 2020; Deconinck et al., 2022; Raimondo et al., 2022; Rebiere et al., 2022).
To the best of our knowledge, this is the first time a triplex approach to elaborate LC-MS data for chemometric analysis has been followed. The chromatographic signals TIC and ECC were considered untargeted approaches, while EIC, calculated on known impurities, was considered a targeted approach. The results obtained are evidence that raw data processing is not trivial and can disclose different grouping tendencies. It should be noted that, in the present case, the targeted approach performed a separation into groups more clearly than those of the untargeted approaches. Moreover, for untargeted ECC data processing, the results could be influenced by the filtering levels (cut-off on peak height, peak spacing tolerance, MFE score, R.T. alignment, and mass alignment), so a more in-depth study is needed to clarify the contribution of each filter parameter to the results.
In conclusion, most of the metformin manufactures selected for this study were characterised. The results specifically showed that M samples are clusterized by NIR, 1H-NMR, LC-MS Q-TOF (EIC), and in data fusion with NIR-13C-NMR-EIC; P samples are clusterized in NIR and 1H-NMR; E samples are clusterized in LC-MS Q-TOF (EIC and ECC) and in data fusion NIR-13C-NMR-EIC; L samples are clusterized in EIC and in data fusion NIR-13C-NMR-EIC; B samples are clusterized in EIC and in data fusion NIR-13C-NMR-EIC. N samples are mainly clusterized in 1H-NMR except for N5. The most abundant G group is clusterized in NIR, with the exception of G3 and in 1H-NMR. The two samples A are not clusterized in all techniques.
The results obtained in this study highlight the capability of an integrated analytical platform combined with chemometric analysis to make a positive contribution to authenticity studies on drug substances.
Different manufacturing processes have been linked to different groups obtained by PCA and correlated with the origin of drugs (Deconinck et al., 2008). Structurally complex drugs manufactured by multiple possible synthetic pathways, multi-step synthetic processes, and with many known and unknown impurities are more prone to exhibiting differences in spectroscopic and spectrometric data and in chemometrics models (Remaud et al., 2013). Metformin is a relatively simple molecule manufactured by a facile synthetic route encompassing only a single-step reaction of dicyandiamide and dimethylamine with a relatively well-established impurity pattern (Shalmashi, 2008; Yendapally et al., 2020). In addition, the limited number of samples per manufacturer may also explain the observed trend since the influence and impact of batch-to-batch variability cannot be completely excluded, especially if it results in small differences such as low-intensity signals that potentially characterize chemometric separation.
These results underline the need to address the potential effects of the limited variability of the manufacturing process and the consequent low probability of the presence of multiple unknown impurities. Nonetheless, different techniques or their fusion allow the clusterization of some metformin API samples.
The authors’ previous results obtained for ibuprofen and carvedilol drug substances (Raimondo et al., 2020; Raimondo et al., 2022) evidenced a chemometric separation in PCA and cluster analyses based on API origin (EU and non-EU) related to specific signals in 1H-NMR and in LC or LC-MS Q-TOF. This paper reports the results obtained with more techniques and different data analysis approaches. For metformin API, a separation based on EU or non-EU origin was not found; however, a clusterization for some manufacturers was observed. The comparison of results between these APIs highlights that the separation seems to strictly depend on the manufacturing process, which is in line with previous studies (Deconinck et al., 2008). In absence of complex multi-step processes and of many known impurities, a separation based on manufacturers or on origin (geographical area) was not clearly obtained. Nevertheless, as observed for metformin, most of the samples form clusters in one or more techniques or in their fusion. On the other hand, as reported in Li et al. (2020), no single technique can provide complete profiling. As a general strategy, we believe that a multi-technique approach and the knowledge of the manufacturing process are important pre-requisites to analysis.
This study is part of the efforts of the European Official Medicines Control Laboratories to develop methods to identify possible falsifications of the origin/manufacturer of active drug substances. The application of chemometrics to the study of the fingerprinting of active drug substances is being increasingly developed, and the detection of more discriminant and predictive analytical techniques could depend on the specific drug substance and its manufacturing processes (Deconinck et al., 2022; Rebiere et al., 2022).
Current challenges are aimed at discriminating among different manufacturers of active substances to detect changes in manufacturing processes and cases of pharmaceutical falsification.
Data availability statement
The raw data supporting the conclusion of this article will be made available by the authors, without undue reservation.
Author contributions
MR: formulation and evolution of research goals and aims; application of the chemometric approach to analyse study data; performing the NMR experiments and data processing; and preparation, creation, and presentation of the published work. FP: formulation and development of research goals and aims; performing the NIR experiments and data collection; and preparation, creation, and presentation of the published work. FA: formulation and evolution of research goals and aims; performing the LC-MS experiments and data processing; and preparation, creation, and presentation of the published work. GD: supporting NIR experiments; chemometric analysis; and preparation, creation, and presentation of the published work. MG: formulation and development of research goals and aims; performing the LC-MS experiments and data processing; preparation, creation, and presentation of the published work; and oversight and leadership responsibility for research activity planning and execution.
Acknowledgments
This study was supported by the Italian Medicines Agency (AIFA) using the samples collected during the national post-marketing surveillance program of medicines. This research did not receive any specific grant from funding agencies in the public, commercial, or not-for-profit sectors.
Conflict of interest
The authors declare that the research was conducted in the absence of any commercial or financial relationships that could be construed as a potential conflict of interest.
Publisher’s note
All claims expressed in this article are solely those of the authors and do not necessarily represent those of their affiliated organizations, or those of the publisher, the editors, and the reviewers. Any product that may be evaluated in this article, or claim that may be made by its manufacturer, is not guaranteed or endorsed by the publisher.
References
Acevska, J., Stefkov, G., Cvetkovikj, I., Petkovska, R., Kulevanova, S., Cho, J., et al. Fingerprinting of morphine using chromatographic purity profiling and multivariate data analysis. J. Pharm. Biomed. analysis (2015) 109:18–27. doi:10.1016/j.jpba.2015.02.016
Agilent Technologies. MassHunter profinder software (2017). Available at: https://www.agilent.com/cs/library/usermanuals/public/G3835-90034_Profinder_QuickStart.pdf.
Anzanello, M. J., Ortiz, R. S., Limberger, R., and Mariotti, K., A framework for selecting analytical techniques in profiling authentic and counterfeit Viagra and Cialis. Forensic Sci. Int. (2014) 235:1–7. doi:10.1016/j.forsciint.2013.12.005
Ballabio, D., A MATLAB toolbox for Principal Component Analysis and unsupervised exploration of data structure. Chemom. intelligent laboratory Syst. (2015) 149:1–9. doi:10.1016/j.chemolab.2015.10.003
Been, F., Roggo, Y., Degardin, K., Esseiva, P., and Margot, P., Profiling of counterfeit medicines by vibrational spectroscopy. Forensic Sci. Int. (2011) 211(1-3):83–100. doi:10.1016/j.forsciint.2011.04.023
Benito, S., Sánchez-Ortega, A., Unceta, N., Andrade, F., Aldámiz-Echevarria, L., Goicolea, M. A., et al. Untargeted metabolomics for plasma biomarker discovery for early chronic kidney disease diagnosis in pediatric patients using LC-QTOF-MS. Analyst (2018) 143:4448–4458. doi:10.1039/c8an00864g
Biancolillo, A., and Marini, F., Chemometric methods for spectroscopy-based pharmaceutical analysis. Front. Chem. (2018) 6:576. doi:10.3389/fchem.2018.00576
Bruker Corporation, AssureNMR screening software user manual version 001 bruker corporation (2019). Available at: https://www.bruker.com/es/products-and-solutions/mr/nmr-software/AssureNMR.html.
Buse, J. B., Wexler, D. J., Tsapas, A., Rossing, P., Mingrone, G., Mathieu, C., et al. 2019 update to: Management of hyperglycemia in type 2 diabetes, 2018. A consensus report by the American diabetes association (ada) and the European association for the study of diabetes (easd). Diabetes care (2020) 43(2):487–493. doi:10.2337/dci19-0066
Chen, Z. F., Lin, Q. B., Dong, B., Zhong, H. N., and Wang, Z. W., Comparison of the ability of UV-Vis and UPLC-Q-TOF-MS combined with chemometrics to discriminate recycled and virgin polyethylene. J. Hazard. Mater. (2022) 423:127165. doi:10.1016/j.jhazmat.2021.127165
Colombo, E., Mauri, L., Marinozzi, M., Rudd, T. R., Yates, E. A., Ballabio, D., et al. NMR spectroscopy and chemometric models to detect a specific non-porcine ruminant contaminant in pharmaceutical heparin. J. Pharm. Biomed. analysis (2022) 214:114724. doi:10.1016/j.jpba.2022.114724
Custers, D., Canfyn, M., Courselle, P., De Beer, J. O., Apers, S., and Deconinck, E., Headspace-gas chromatographic fingerprints to discriminate and classify counterfeit medicines. Talanta (2014) 123:78–88. doi:10.1016/j.talanta.2014.01.020
Custers, D., Courselle, P., Apers, S., and Deconinck, E., Chemometrical analysis of fingerprints for the detection of counterfeit and falsified medicines. Rev. Anal. Chem. (2016a) 35(4):145–168. doi:10.1515/revac-2016-0013
Custers, D., Vandemoortele, S., Bothy, J. L., De Beer, J. O., Courselle, P., Apers, S., et al. Physical profiling and IR spectroscopy: Simple and effective methods to discriminate between genuine and counterfeit samples of Viagra® and cialis. Drug Test. analysis (2016b) 8(3-4):378–387. doi:10.1002/dta.1813
da Silva Fernandes, R., da Costa, F. S., Valderrama, P., Março, P. H., and de Lima, K. M., Non-destructive detection of adulterated tablets of glibenclamide using NIR and solid-phase fluorescence spectroscopy and chemometric methods. J. Pharm. Biomed. analysis (2012) 66:85–90. doi:10.1016/j.jpba.2012.03.004
de Peinder, P., Vredenbregt, M. J., Visser, T., and de Kaste, D., Detection of lipitor counterfeits: A comparison of NIR and Raman spectroscopy in combination with chemometrics. J. Pharm. Biomed. analysis (2008) 47(4-5):688–694. doi:10.1016/j.jpba.2008.02.016
Deconinck, E., Courselle, P., Raimondo, M., Grange, Y., Rebière, H., Mihailova, A., et al. GEONs API fingerprint project: Selection of analytical techniques for clustering of sildenafil citrate API samples. Talanta (2022) 239:123123. doi:10.1016/j.talanta.2021.123123
Deconinck, E., van Nederkassel, A. M., Stanimirova, I., Daszykowski, M., Bensaid, F., Lees, M., et al. Isotopic ratios to detect infringements of patents or proprietary processes of pharmaceuticals: Two case studies. J. Pharm. Biomed. analysis (2008) 48(1):27–41. doi:10.1016/j.jpba.2008.04.023
Emwas, A. H., Saccenti, E., Gao, X., McKay, R. T., Dos Santos, V., Roy, R., et al. Recommended strategies for spectral processing and post-processing of 1D 1H-NMR data of biofluids with a particular focus on urine. Metabolomics Official J. Metabolomic Soc. (2018) 14(3):31. doi:10.1007/s11306-018-1321-4
Erich, S., Schill, S., Annweiler, E., Waiblinger, H. U., Kuballa, T., Lachenmeier, D. W., et al. Combined chemometric analysis of (1)H NMR, (13)C NMR and stable isotope data to differentiate organic and conventional milk. Food Chem. (2015) 188:1–7. doi:10.1016/j.foodchem.2015.04.118
Erny, G. L., Acunha, T., Simó, C., Cifuentes, A., and Alves, A., Algorithm for comprehensive analysis of datasets from hyphenated high resolution mass spectrometric techniques using single ion profiles and cluster analysis. J. Chromatogr. A (2016) 1429:134–141. doi:10.1016/j.chroma.2015.12.005
Erny, G. L., and Santos, M. S., Computerized assisted tools to extract the information from datasets obtained by analytical separation techniques hyphenated with mass spectrometry. J. Compr. Foodomics (2021) 385–395. doi:10.1016/B978-0-08-100596-5.22913-2
European Pharmacopoeia. Monograph 04/2020:0931 metformin hydrochloride, 4448-4450. Strasbourg: EDQM (2022).
Gadape, H. H., and Parikh, K. S., Quantitative determination and validation of metformin hydrochloride in pharmaceutical using quantitative nuclear magnetic resonance spectroscopy. J. Chem. (2011) 8(2):767–781. doi:10.1155/2011/461898
Giaccari, A., Solini, A., Frontoni, S., and Del Prato, S., Metformin benefits: Another example for alternative energy substrate mechanism? Diabetes Care (2021) 44(3):647–654. doi:10.2337/dc20-1964
Keire, D. A., Bream, R., Wollein, U., Schmaler-Ripcke, J., Burchardt, A., Conti, M., et al. International regulatory collaboration on the analysis of nitrosamines in metformin-containing medicines. AAPS J. (2022) 24(3):56–59. doi:10.1208/s12248-022-00702-4
Khokhar, A., Umpaichitra, V., Chin, V. L., and Perez-Colon, S., Metformin use in children and adolescents with prediabetes. Pediatr. Clin. (2017) 64(6):1341–1353. doi:10.1016/j.pcl.2017.08.010
Krakowska, B., Custers, D., Deconinck, E., and Daszykowski, M., Chemometrics and the identification of counterfeit medicines-A review. J. Pharm. Biomed. analysis (2016) 127:112–122. doi:10.1016/j.jpba.2016.04.016
Li, Y., Shen, Y., Yao, C. L., and Guo, D. A., Quality assessment of herbal medicines based on chemical fingerprints combined with chemometrics approach: A review. J. Pharm. Biomed. analysis (2020) 185:113215. doi:10.1016/j.jpba.2020.113215
Lia, F., Vella, B., Mangion, M. Z., and Farrugia, C., Application of 1H and 13C NMR fingerprinting as a tool for the authentication of Maltese extra virgin olive oil. Foods (Basel, Switz. (2020) 9(6):689. doi:10.3390/foods9060689
Martínez-Bueno, M. J., Ramos, M. G., Bauer, A., and Fernández-Alba, A. R., An overview of non-targeted screening strategies based on high resolution accurate mass spectrometry for the identification of migrants coming from plastic food packaging materials. TrAC Trends Anal. Chem. (2019) 110:191–203. doi:10.1016/j.trac.2018.10.035
Mees, C., Souard, F., Delporte, C., Deconinck, E., Stoffelen, P., Stévigny, C., et al. Identification of coffee leaves using FT-NIR spectroscopy and SIMCA. Talanta (2018) 177:4–11. doi:10.1016/j.talanta.2017.09.056
Nicolas, E. C., and Scholz, T. H., Active drug substance impurity profiling: Part II. LC/MS/MS fingerprinting. J. Pharm. Biomed. analysis (1998) 16(5):825–836. doi:10.1016/S0731-7085(97)00132-5
Ohmenhaeuser, M., Monakhova, Y. B., Kuballa, T., and Lachenmeier, D. W., Qualitative and quantitative control of honeys using NMR spectroscopy and chemometrics. Int. Sch. Res. Notices (2013) 2013:1–9. doi:10.1155/2013/825318
Pacholczyk-Sienicka, B., Ciepielowski, G., and Albrecht, Ł., The application of NMR spectroscopy and chemometrics in authentication of spices. Mol. (Basel, Switz. (2021) 26(2):382. doi:10.3390/molecules26020382
Raimondo, M., Borioni, A., Bartolomei, M., Mosca, A., and Gostoli, G., Classification of the ibuprofen active pharmaceutical ingredients by chemical patterns combining HPLC, 1H-NMR spectroscopy and chemometrics: Traceability of legal medicines. Ann. dell'Istituto Super. sanita (2020) 56(4):403–408. doi:10.4415/ANN_20_04_01
Raimondo, M., Borioni, A., Prestinaci, F., Sestili, I., and Gaudiano, M. C., A NIR, 1 H-NMR, LC-MS and chemometrics pilot study on the origin of carvedilol drug substances: A tool for discovering falsified active pharmaceutical ingredients. Anal. Methods (2022) 14(14):1396–1405. doi:10.1039/d1ay02035h
Rebiere, H., Grange, Y., Deconinck, E., Courselle, P., Acevska, J., Brezovska, K., et al. European fingerprint study on omeprazole drug substances using a multi analytical approach and chemometrics as a tool for the discrimination of manufacturing sources. J. Pharm. Biomed. analysis (2022) 208:114444. doi:10.1016/j.jpba.2021.114444
Remaud, G. S., Bussy, U., Lees, M., Thomas, F., Desmurs, J. R., Jamin, E., et al. NMR spectrometry isotopic fingerprinting: A tool for the manufacturer for tracking active pharmaceutical ingredients from starting materials to final medicines. Eur. J. Pharm. Sci. official J. Eur. Fed. Pharm. Sci. (2013) 48(3):464–473. doi:10.1016/j.ejps.2012.12.009
Rodionova, O. Y., Balyklova, K. S., Titova, A. V., and Pomerantsev, A. L., Application of NIR spectroscopy and chemometrics for revealing of the ‘high quality fakes’ among the medicines. Forensic Chem. (2018) 8:82–89. doi:10.1016/j.forc.2018.02.004
Rodionova, O. Y., Titova, A. V., Demkin, N. A., Balyklova, K. S., and Pomerantsev, A. L., Qualitative and quantitative analysis of counterfeit fluconazole capsules: A non-invasive approach using NIR spectroscopy and chemometrics. Talanta (2019) 195:662–667. doi:10.1016/j.talanta.2018.11.088
Roggo, Y., Chalus, P., Maurer, L., Lema-Martinez, C., Edmond, A., and Jent, N., A review of near infrared spectroscopy and chemometrics in pharmaceutical technologies. J. Pharm. Biomed. analysis (2007) 44(3):683–700. doi:10.1016/j.jpba.2007.03.023
Rojas, L. B. A., and Gomes, M. B., Metformin: An old but still the best treatment for type 2 diabetes. Diabetology metabolic syndrome (2013) 5(1):6–15. doi:10.1186/1758-5996-5-6
Schneider, A., and Wessjohann, L. A., Comparison of impurity profiles of Orlistat pharmaceutical products using HPLC tandem mass spectrometry. J. Pharm. Biomed. analysis (2010) 53(3):767–772. doi:10.1016/j.jpba.2010.05.010
Shalmashi, A., New route to metformin hydrochloride (N, N-dimethylimidodicarbonimidic diamide hydrochloride) synthesis. Molbank (2008) 2008(1):M564. doi:10.3390/M564
Silvestre, V., Mboula, V. M., Jouitteau, C., Akoka, S., Robins, R. J., and Remaud, G. S., Isotopic 13C NMR spectrometry to assess counterfeiting of active pharmaceutical ingredients: Site-specific 13C content of aspirin and paracetamol. J. Pharm. Biomed. analysis (2009) 50(3):336–341. doi:10.1016/j.jpba.2009.04.030
Storme-Paris, I., Rebiere, H., Matoga, M., Civade, C., Bonnet, P. A., Tissier, M. H., et al. Challenging near infrared spectroscopy discriminating ability for counterfeit pharmaceuticals detection. Anal. Chim. acta (2010) 658(2):163–174. doi:10.1016/j.aca.2009.11.005
The European Parliament and the Council of the European Union. Directive 2011/62/EU of the European parliament and of the Council of 8 june 2011. Official J. Eur. Union (2011) 174:74–87. Avaialble at: https://ec.europa.eu/health/sites/health/files/files/eudralex/vol-1/dir_2011_62/dir_2011_62_en.pdf.
Verzele, D., Goeman, J., and Madder, A., LC-(TIC/EIC)-MS as tool in the analysis of diastereomeric 3,12-aza-analogues of deoxycholic acid. ARKIVOC (2007) 2007(10):325–336. doi:10.3998/ark.5550190.0008.a21
Viollet, B., Guigas, B., Garcia, N. S., Leclerc, J., Foretz, M., and Andreelli, F., Cellular and molecular mechanisms of metformin: An overview. Clin. Sci. (2012) 122(6):253–270. doi:10.1042/cs20110386
Wang, B., Maldonado-Devincci, A. M., and Jiang, L., Evaluating line-broadening factors on a reference spectrum as a bucketing method for NMR based metabolomics. Anal. Biochem. (2020) 606:113872. doi:10.1016/j.ab.2020.113872
Winning, H., Larsen, F. H., Bro, R., and Engelsen, S. B., Quantitative analysis of NMR spectra with chemometrics. J. magnetic Reson. (San Diego, Calif (2008) 190(1):26–32. doi:10.1016/j.jmr.2007.10.005
World Health Organization. Diabetes (2022). Available at: http://www.who.int/news-room/fact-sheets/detail/diabetes (Accessed October 16, 2022).
World Health Organization. World health organization model list of essential medicines: 22nd list (2021) (No. WHO/MHP/HPS/EML/2021.02). Switzerland: World Health Organization (2021).
Xue, J., Liu, P., Guo, G., Wang, W., Zhang, J., Wang, W., et al. Profiling of dynamic changes in non-volatile metabolites of shaken black tea during the manufacturing process using targeted and non-targeted metabolomics analysis. LWT (2022) 156:113010. doi:10.1016/j.lwt.2021.113010
Keywords: APIs, chemometrics, nuclear magnetic resonance, near infrared, liquid chromatography–mass spectrometry, falsification
Citation: Raimondo M, Prestinaci F, Aureli F, D’Ettorre G and Gaudiano MC (2023) Investigating metformin-active substances from different manufacturing sources by NIR, NMR, high-resolution LC-MS, and chemometric analysis for the prospective classification of legal medicines. Front. Anal. Sci. 3:1091764. doi: 10.3389/frans.2023.1091764
Received: 07 November 2022; Accepted: 14 February 2023;
Published: 07 March 2023.
Edited by:
Eric Deconinck, Sciensano (Belgium), BelgiumReviewed by:
Pierre-Yves Sacré, University of Liège, BelgiumMyriam Malet-Martino, Université Toulouse III Paul Sabatier, France
Copyright © 2023 Raimondo, Prestinaci, Aureli, D’Ettorre and Gaudiano. This is an open-access article distributed under the terms of the Creative Commons Attribution License (CC BY). The use, distribution or reproduction in other forums is permitted, provided the original author(s) and the copyright owner(s) are credited and that the original publication in this journal is cited, in accordance with accepted academic practice. No use, distribution or reproduction is permitted which does not comply with these terms.
*Correspondence: Maria Cristina Gaudiano, bWFyaWFjcmlzdGluYS5nYXVkaWFub0Bpc3MuaXQ=