 Tao Zhang
 Glenn Marsman2
 Diego A. Pereira-Martins
 Manfred Wuhrer
 Valerie R. Wiersma
- 1Center for Proteomics and Metabolomics, Leiden University Medical Center, Leiden, Netherlands
- 2Department of Hematology, University Medical Center Groningen, University of Groningen, Groningen, Netherlands
Acute myeloid leukemia (AML) is a cancer of the myeloid lineage of blood cells, with an overall 5-year survival rate of 25%, mainly due to therapy-resistant relapses in > 50% of patients. The standard treatment for AML comprises cytarabine (AraC) with anthracyclines. Biomarkers to determine AraC sensitivity are currently lacking, thus hampering the rational choice of optimal treatment protocols, which would be especially warranted in the case of primary refractory disease. In the current study, we hypothesized that AraC-resistant AML cells harbor a different “sugar decoration”, i.e., glycosylation profile, compared with sensitive cells, which could be used as biomarker for AraC sensitivity. Therefore, we analyzed the expression of glycosylation-related genes in publicly available AML datasets, whereby the high expression of mannosylation-related genes (6 out of 13) was significantly associated with a worse survival in patients treated with AraC-based intensive chemotherapy protocols. In line with these data, the AraC-resistant AML cells expressed higher levels of high mannose N-glycans, as detected by mass spectrometry-based glycomics. Concanavalin A (ConA), a lectin that specifically recognizes α-mannoses in N-glycans, bound more strongly to AraC-resistant cells, and the extent of the ConA binding was correlated with AraC sensitivity in a panel of AML cell lines. Furthermore, the ConA staining could discriminate AraC sensitivity in vitro between two patient-derived AML samples taken at diagnosis. Therefore, the ConA staining may be a potential novel biomarker to predict AraC sensitivity in AML.
Introduction
Acute myeloid leukemia (AML) is a hematologic malignancy characterized by clonal expansion of immature blast cells in the blood and bone marrow. It is one of the most common forms of leukemia with 756 new diagnoses in the Netherlands in 2022 (1). The standard treatment regimen of AML comprises the nucleoside analog cytarabine (AraC) combined with an anthracycline, such as daunorubicin or idarubicin. Even though the survival of AML patients has increased over the past decades, the overall prognosis remains poor (2). The main cause of mortality in AML is therapy resistance causing relapse and refractory disease.
Besides standard AraC-based therapy, there are other treatments options for AML patients, among which azacytidine, etoposide, and venetoclax, which are used as second-line treatments or when a high-dose chemotherapeutic regimen cannot be tolerated by the patient. It would be of clinical use to assess AraC sensitivity prior to treatment, which would enable the possibility to choose alternative treatment options in the case of preexisting AraC resistance. However, there is no predictive biomarker to determine AraC sensitivity to date. AraC sensitivity has among others been linked to certain gene and intracellular protein expression signatures (3–5). However, to be implemented into routine diagnostics a surface marker that can be assessed by flow cytometry has the preference, as it can be performed using already established equipment without the necessity of additional sample preparation.
In the current study we hypothesized that a novel biomarker for AraC-resistant AML cells can be found in their “sugar coat” or so-called glycosylation profile. Glycosylation is a non-template driven posttranslational modification that takes place in the Golgi and endoplasmic reticulum by glycosyltransferases and glycosidases that respectively add and remove sugars from glycans that are attached to proteins or lipids (6). At least 50% of all human proteins are glycosylated and almost all the key molecules involved in immune responses are glycoproteins (7). As AML cells arise from immune precursors, their extent of glycosylation is likely high and diverse. Indeed, we previously identified the glycosylation profile of 21 widely used AML cell lines, revealing distinct glycan profiles between AML subtypes (8). The clinical use of differential glycosylation profiles has already been implemented for decades, among which the discrimination between the various blood groups using the Lewis antigen system is a prominent example (6). Furthermore, several glycosylation-related biomarkers are being used for cancer diagnostics and prognostics, among which are cancer antigen 19-9 (CA19-9) for pancreatic cancer, alpha-fetoprotein LC3 for liver cancer, the carcinoembryonic antigen for colon cancer, and CA-125 for ovarian cancer (9). Therefore, we focused on glycosylation patterns in this study, with the aim to discover a biomarker for AraC sensitivity in AML.
Materials and methods
Patients and gene expression profiling
Publicly available clinical and transcriptomic data of three adult AML cohorts whose patients were treated with intensive chemotherapy were included in this study: TCGA-AML (n = 121; Illumina HiSeq 2000) (10), Beat AML (n = 219; Illumina HiSeq 2500) (11), and HOVON-GSE6891 (n = 405; Affymetrix Human Genome U133 Plus 2.0 Array) (12, 13). The normalized gene expression and clinical data for the TCGA cohort were retrieved from the FireBrowse data portal (www.firebrowse.org), whereas for the Beat AML cohort we used the Beat AML Vizome data portal (www.vizome.org) and the cBioPortal for Cancer Genomics (www.cbioportal.org). The normalized gene expression data were retrieved from the Gene Expression Omnibus database (www.ncbi.nlm.nih.gov/geo/) for the HOVON cohort.
N-glycosylation analysis using porous graphitized carbon nano-liquid chromatography-MS/MS
Chemicals and reagents for the MS analysis
Ammonium bicarbonate, trifluoroacetic acid, cation exchange resin beads (AG50W-X8), potassium hydroxide, and sodium borohydride were obtained from Sigma-Aldrich (Steinheim, Germany). The 8 M guanidine hydrochloride (GuHCl) was obtained from Thermo Fisher Scientific (Waltham, MA, USA). HPLC SupraGradient acetonitrile and dithiothreitol (DTT) were obtained from Biosolve (Valkenswaard, the Netherlands), and other reagents and solvents such as methanol, 2-propanol, and glacial acetic acid were obtained from Merck (Darmstadt, Germany). The MultiScreen® HTS 96 multiwell plates (with a pore size of 0.45 μm) with a high protein-binding hydrophobic Immobilon-P Polyvinylidene difluoride (PVDF) membrane were purchased from Millipore (Amsterdam, The Netherlands), and the conical 96-well Nunc plates from Thermo Fisher Scientific. The peptide N-glycosidase F (PNGase F, lyophilized, and glycerol free) was purchased from Roche Diagnostics (Mannheim, Germany). Ultrapure water generated from a Q-Gard 2 system (Millipore, Amsterdam, The Netherlands) was used for all preparations and washes.
PGC nano-LC-MS/MS N-glycosylation analysis
N-glycan alditols were prepared from 5 × 10⁵ cells, as previously described by Zhang et al. (14). Maltoheptaose (DP7, 5 ng) was added as internal standard to support the absolute quantification of N-glycans. In brief, 25 µL of the cell lysate was applied to a hydrophobic Immobilon-P PVDF membrane in a 96-well plate format. The proteins were denatured by applying 75 µL of the denaturation mix [72.5 µL of 8 M GuHCl and 2.5 µL of 200 mM dithiothreitol (DTT)] in each well. After shaking (for 15 min) and incubation in a moisture box (for 30 min at 60°C) the unbound material was removed by centrifugation. The N-glycans were released by adding PNGase F (2 U in 15 µL of H2O) and incubating overnight at 37°C. The released N-glycans were collected from the PVDF plate by centrifugation, and the glycosylamine versions of the released N-glycans were hydrolyzed by adding 20 µL of 100 mM ammonium acetate (pH 5). The samples were incubated (at room temperature for 1 h) and dried in a SpeedVac concentrator 5301 (Eppendorf, Hamburg, Germany) at 35˚C. The collected N-glycans were subsequently reduced and desalted followed by PGC-cleanup using a 96-well plate-based protocol (14). The glycan alditols were dissolved in 10 μL of H2O prior to PGC nano-LC-ESI-MS/MS analysis. To this end, a home-packed PGC trap column (5 μm Hypercarb™, 320 μm × 30 mm) and a PGC nano-column (3 μm Hypercarb, 100 μm × 100 mm) were connected to an amaZon ETD speed ion trap for glycan detection (Bruker Daltonics, Bremen, Germany). The separation was achieved with a linear gradient (9%–50%) mobile phase B over 90 min at a 0.5 μL/min flow rate. The column was held at a constant temperature of 35°C. Ionization was achieved using the CaptiveSpray nanoBooster source (Bruker), with isopropanol-enriched dopant nitrogen gas and a capillary voltage of 1,000 V applied in negative ion mode. MS-spectra were acquired within an m/z range of 500–1,850, and the smart parameter setting was set to m/z 1,200. MS/MS spectra were generated using collision-induced dissociation for the top three most abundant precursors per MS spectrum covering an m/z range from 100 to 2,500. The glycan structures were assigned using GlycoWorkbench (15) and GlycoMod (16) software based on the known MS/MS fragmentation patterns in the negative ion mode (17), elution order, and general glycobiological knowledge.
Relative quantification of the individual glycans was performed by normalizing the total peak area of all glycans within one sample to 100%. To estimate the glycan amount per cell, the glycan intensity was normalized to the intensity of the internal standard DP7. The structures are depicted according to the Consortium for Functional Glycomics (CFG).
Cell lines and patient-derived AML samples
The AML (HL-60, MOLM-13, U-937, THP-1, OCI-AML-2, OCI-AML-3, and NB-4) and stromal (MS5) cell lines were originally obtained from the American Type Culture Collection (ATCC) and cultured in, respectively, Roswell Park Memorial Institute (RPMI) medium (Lonza 12–115F; Basel, Switzerland) and alpha minimum essential medium (α-MEM) (Lonza) supplemented with 10% fetal bovine serum (FBS; F7524; Sigma Aldrich, St. Louis, MO, USA), in a humidified 5% CO2 atmosphere at 37°C. AraC-resistant AML cell lines were generated previously (18).
Patient-derived AML samples taken at time of diagnosis (Supplementary Table 3 for clinical characteristics) were thawed from our cryobank [stored after informed consent and following approval by the Medical ethics committee of the University Medical Center Groningen (MCG) in accordance with the Declaration of Helsinki protocol; code NL43844.042.13, 6 January 2014] and cultured, as previously described, in Gartner’s medium on top of a MS5 support layer (19). After 2–3 days of acclimatization, only the AML samples with a cell viability above 80% were used for further experiments.
Fluorescent concanavalin A staining
To determine the extent of mannosylation, AML cells (5 × 10⁴ in 100 µL of RPMI plus 10% FBS) were incubated with 25 µg/mL of ConA-488 or ConA-647 (C11252/C21421; Thermo Fisher Scientific) for 1 h at 4°C. After washing with phosphate-buffered saline (PBS), the ConA-488/ConA-647 fluorescent intensity was determined using flow cytometry and accessory software (CytoFLEX; Beckman Coulter, Brea, CA, USA/BD, Accuri Franklin Lakes, NJ, USA). The same protocol was used for the lens culinaris agglutinin (LCA) staining using 125 µg/mL of LCA-fluorescein isothiocyanate (FITC; L32475; Thermo Fisher Scientific). For the patient-derived samples the cells were counter stained for CD45 (catalog number 21810456; ImmunoTools GmbH, Friesoythe, Germany) to enable gating on myeloblasts (see Supplementary Figure 2A).
For the fluorescent images, a similar protocol as for flow cytometry was used. After washing, cells were spotted on a microscope slide using a cytocentrifuge (CytoSpin 3; Shandon, UK) and analyzed using the EVOS™ Cell Imaging System (EVOS-FL; Thermo Scientific).
Cytarabine sensitivity assays
To determine cytarabine (AraC) sensitivity, the AML cells were plated in a 48-wells plate (5 × 10⁴ in 200 µL of RPMI plus 10% FBS) and treated with 500nM AraC (hospital pharmacy, UMCG; Cytarabine Accord solution (100 mg/mL); RVG 112666) and incubated for 72 h at 37°C. Subsequently, cell viability was assessed using the MTS assay (CellTiter 96® AQueous One Solution Cell Proliferation, G3580; Promega, Madison, WI, USA). In brief, MTS was added [7.5% v/v (volume to volume)] to each well and incubated at 37°C. After sufficient color development a read-out was performed at OD490 nm (MultiSkan Sky of Thermo Fisher Scientific). The cell viability was calculated by subtracting OD490 nm of the dead control of each value (7.5% dead mix, consisting of 10% Triton X in 70% ethanol) and calculating the viability as a percentage of the untreated control (treated/untreated x 100%). It is noteworthy that the ConA binding toward the AML cell lines was determined at the time of plating for the MTS assays to ensure the correct correlation analysis. For the tunicamycin experiments (T7765; Sigma Aldrich, Steinheim, Germany), the cells were pre-incubated with 50ng/mL of tunicamycin for 72 h prior to treatment with AraC. For the patient-derived samples, the cells were harvested after 72 h of incubation (same protocol as cell lines) and stained with anti-CD45-allophycocyanin (APC) and annexin-V-FITC (catalog number 31490013; ImmunoTools) in binding buffer (10 x annexin V-binding buffer; BD Biosciences, San Jose, CA, USA).
To determine whether AML cells with high levels of ConA binding survived AraC treatment, cells were prestained with ConA-647 using a low non-toxic dose following the protocol as used for fluorescent imaging. Subsequently the cells were plated, as described above, and after 72 h of incubation, fluorescent intensity of the surviving cells was measured using flow cytometry.
Statistical analysis
Gene expression profiling
The cohorts were dichotomized into groups with high and low levels of gene expression (n = 271 genes; Supplementary Table 1) after calculating the optimal cut-point value using the receiver operating characteristic curve for censored overall survival data. Then, univariate and multivariate Cox proportional hazard regression was computed. According to data availability, we adjusted prognosis prediction for confounders as follows: age (continuous variable), sex (male vs. female), white blood cell counts (continuous), transplantation status (allo- or auto-HSCT vs. none), and European LeukemiaNet risk categorization (ELN2010 for TCGA and HOVON; ELN2017 for Beat AML). A proportional hazards (PHs) assumption for each continuous variable of interest was tested. A linearity assumption for all continuous variables was examined in logistic and PH models using restricted cubic spline estimates of the relationship between the continuous variable and log-relative hazard/risk. Additionally, we considered only genes that generated an area under the curve > 0.5, with sensitivity and specificity > 0.5. These analyses were performed for each gene of the transcriptome in each cohort. Then, genes consistently associated with prognosis were further investigated after merging the results of the three cohorts. The descriptive analyses were performed for patient baseline features. A Fisher’s exact test or a chi-squared test, as appropriate, was used to compare categorical variables. A Mann–Whitney or Kruskal–Wallis test was used to compare the continuous variables. The details of the statistical analysis and clinical end points were described elsewhere (20). All statistical analyses were performed using the statistical package for the social sciences 19.0 and R 3.3.2 (The CRAN project, www.r-project.org) software, generating two-sided p-values with a significance level of 0.05.
Correlation analysis and gene set enrichment analysis using the CCLE dataset for the AML cell lines
A correlation analysis between ConA binding (assessed via flow cytometry) and the transcriptome data from the AML cell lines [Cancer Cell Line Encyclopedia (CCLE) consortium (21)] was performed. A ranked list of positively and negatively correlated genes was prepared and used for Gene Set Enrichment Analysis (GSEA) using Broad Institute software (22). The Gene Ontology (GO), Kyoto Encyclopedia of Genes and Genomes (KEGG), Hallmarks of Cancer, and Reactome databases for the GSEA terms were used. The enrichment scores, determined by Kolmogorov–Smirnov statistics with 1,000 permutations, were assessed for significance. A Spearman correlation served as the ranking metric for the genes, requiring a minimum gene set size of 10. The strong correlations were identified based on Spearman rho coefficients > 0.7 or < −0.7, with a significance threshold p-value of < 0.05
MS analysis and ConA staining
All the data were tested for a normal distribution using the Shapiro–Wilk test (which all datasets passed with a p-value > 0.05). Subsequently, the significance between parental and AraC-resistant cells was tested using a paired t-test. The correlation was tested using simple linear regression analysis (GraphPad Prism, version 9.1.0, 2021; GraphPad Software Inc., CA, USA). All the data in the bar graphs are depicted as the average plus the standard deviation.
Results
High expression levels of genes that regulate mannosylation are associated with worse survival in AML patients
To identify which glycosylation signatures of AML cells could possibly be associated with AraC sensitivity, glycosylation-related genes (n = 271; Supplementary Table 1) were analyzed for their prognostic role regarding the overall survival of AML patients that were intensively treated with AraC. Here, high expression of 21 glycosylation-related genes was significantly associated with poor overall survival in AML patients, independently of confounders (Supplementary Table 2). After excluding genes without a direct role in the addition or removal of specific carbohydrates (n = 7), 13 genes were left, among which six genes were directly involved in mannosylation, i.e., MPI, POMT2, RPN1, ALG2, ALG1L2, and ALG12 (Figure 1A), predominantly of N-glycans (five out of six; Figure 1B). Notably, MAN1A2, MAN2A1, and EDEM3, three mannosidases that remove mannoses from N-glycans, were borderline significant after the correction for confounders (with a p-value of, respectively, 0.05, 0.08, and 0.09) among the genes that were associated with better overall survival (data not shown). Together, these data suggest that high levels of mannosylation are associated with worse clinical outcome in AML patients that are treated with AraC-based protocols.
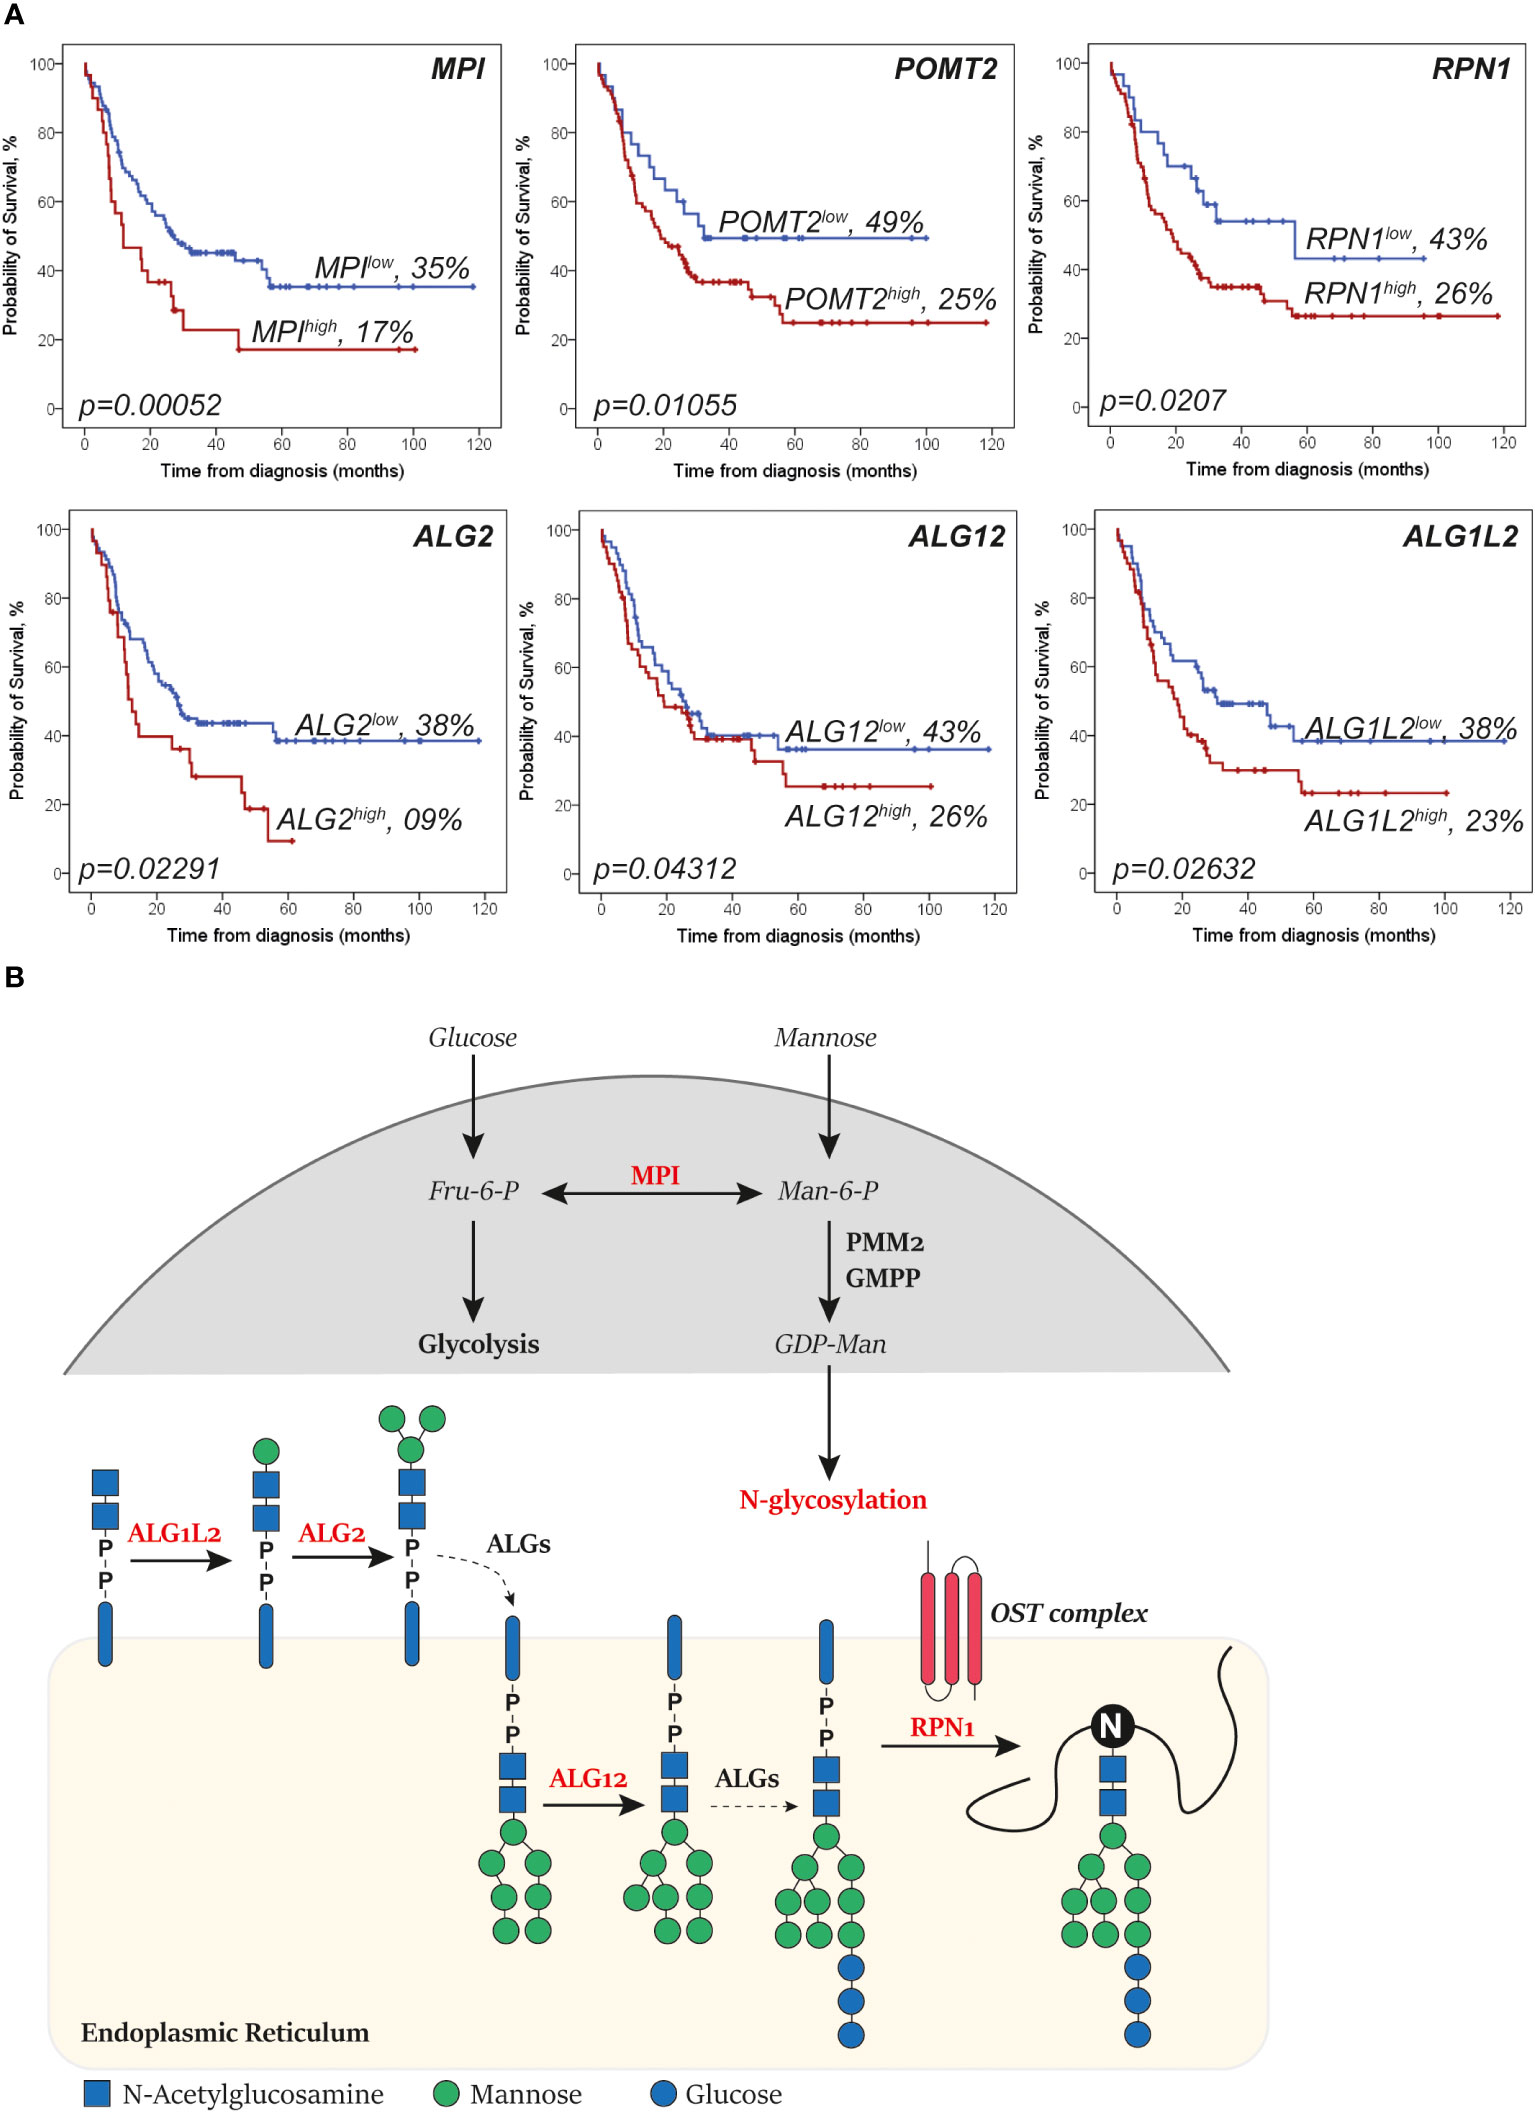
Figure 1 Genes that increase levels of N-glycan mannosylation are associated with a worse survival in acute myeloid leukemia (AML). (A) Kaplan–Meier curves showing the overall survival of AML patients (representative of the The Cancer Genome Atlas (TCGA)-AML dataset) of the depicted mannosylation genes. The log-rank test was used to compare the curves. (B) Simplified overview of the N-glycan mannosylation genes that are significantly associated with survival (in red). Mannose-6 phosphate isomerase (MPI) determines whether sugars are driven into glycolysis or N-glycosylation. ALG1L2 and asparagine-linked glycosylation (ALG) attach mannoses to the forming N-glycan at the cytosol site of the endoplasmic reticulum (ER). ALG12 attaches mannoses to the forming N-glycan after it has been flipped to the lumen site of the ER. Dolichyl-diphosphooligosaccharide—protein glycosyltransferase subunit 1 (RPN1) is part of the N-oligosaccharyl transferase (OST) complex that links high mannose oligosaccharides to asparagine residues (N) of nascent polypeptide chains. Importantly, only relevant processes are depicted (dashed lines depict shortcuts).
AraC-resistant AML cell lines express higher levels of α-mannose-terminating N-glycans
We hypothesized that the worse survival of patients that express higher levels of glycosyltransferases that couple mannoses is caused by a reduced sensitivity to AraC. To confirm this association, we used PGC nano-LC-MS/MS to determine the levels of mannosylated N-glycans in parental compared to AraC-reistant cell line pairs of THP-1 and MOLM-13 cells.
In both THP-1par and THP-1Arac-Res cell lines, 22 N-glycans could be identified, whereby oligomannose accounted for 6 of the 22 assigned N-glycans that contain α-mannose (Figure 2A). Furthermore, two out of three hybrid N-glycans with composition of N3H6 and N3H6S1 were detected. In addition, there were three paucimannose and 10 complex N-glycans detected in the PGC LC-MS/MS analysis. Also quantitatively, the most prevalent structures were oligomannose glycans, varying from 69% to 75%, whereby the relative abundance was slightly but significantly higher in the resistant cells (Figure 2B), as overall glycosylation seemed to be increased in the resistant cells. To estimate the absolute abundance, the intensity of N-glycans carrying α-mannose was normalized to the intensity of the spiked internal standard DP7, revealing a two times higher expression level of α-mannose-containing N-glycans in THP-1Arac-Res (~ 3 × 10⁷ per cell) compared to THP-1par cells (~ 1.5 × 10⁷ per cell) (Figure 2C).
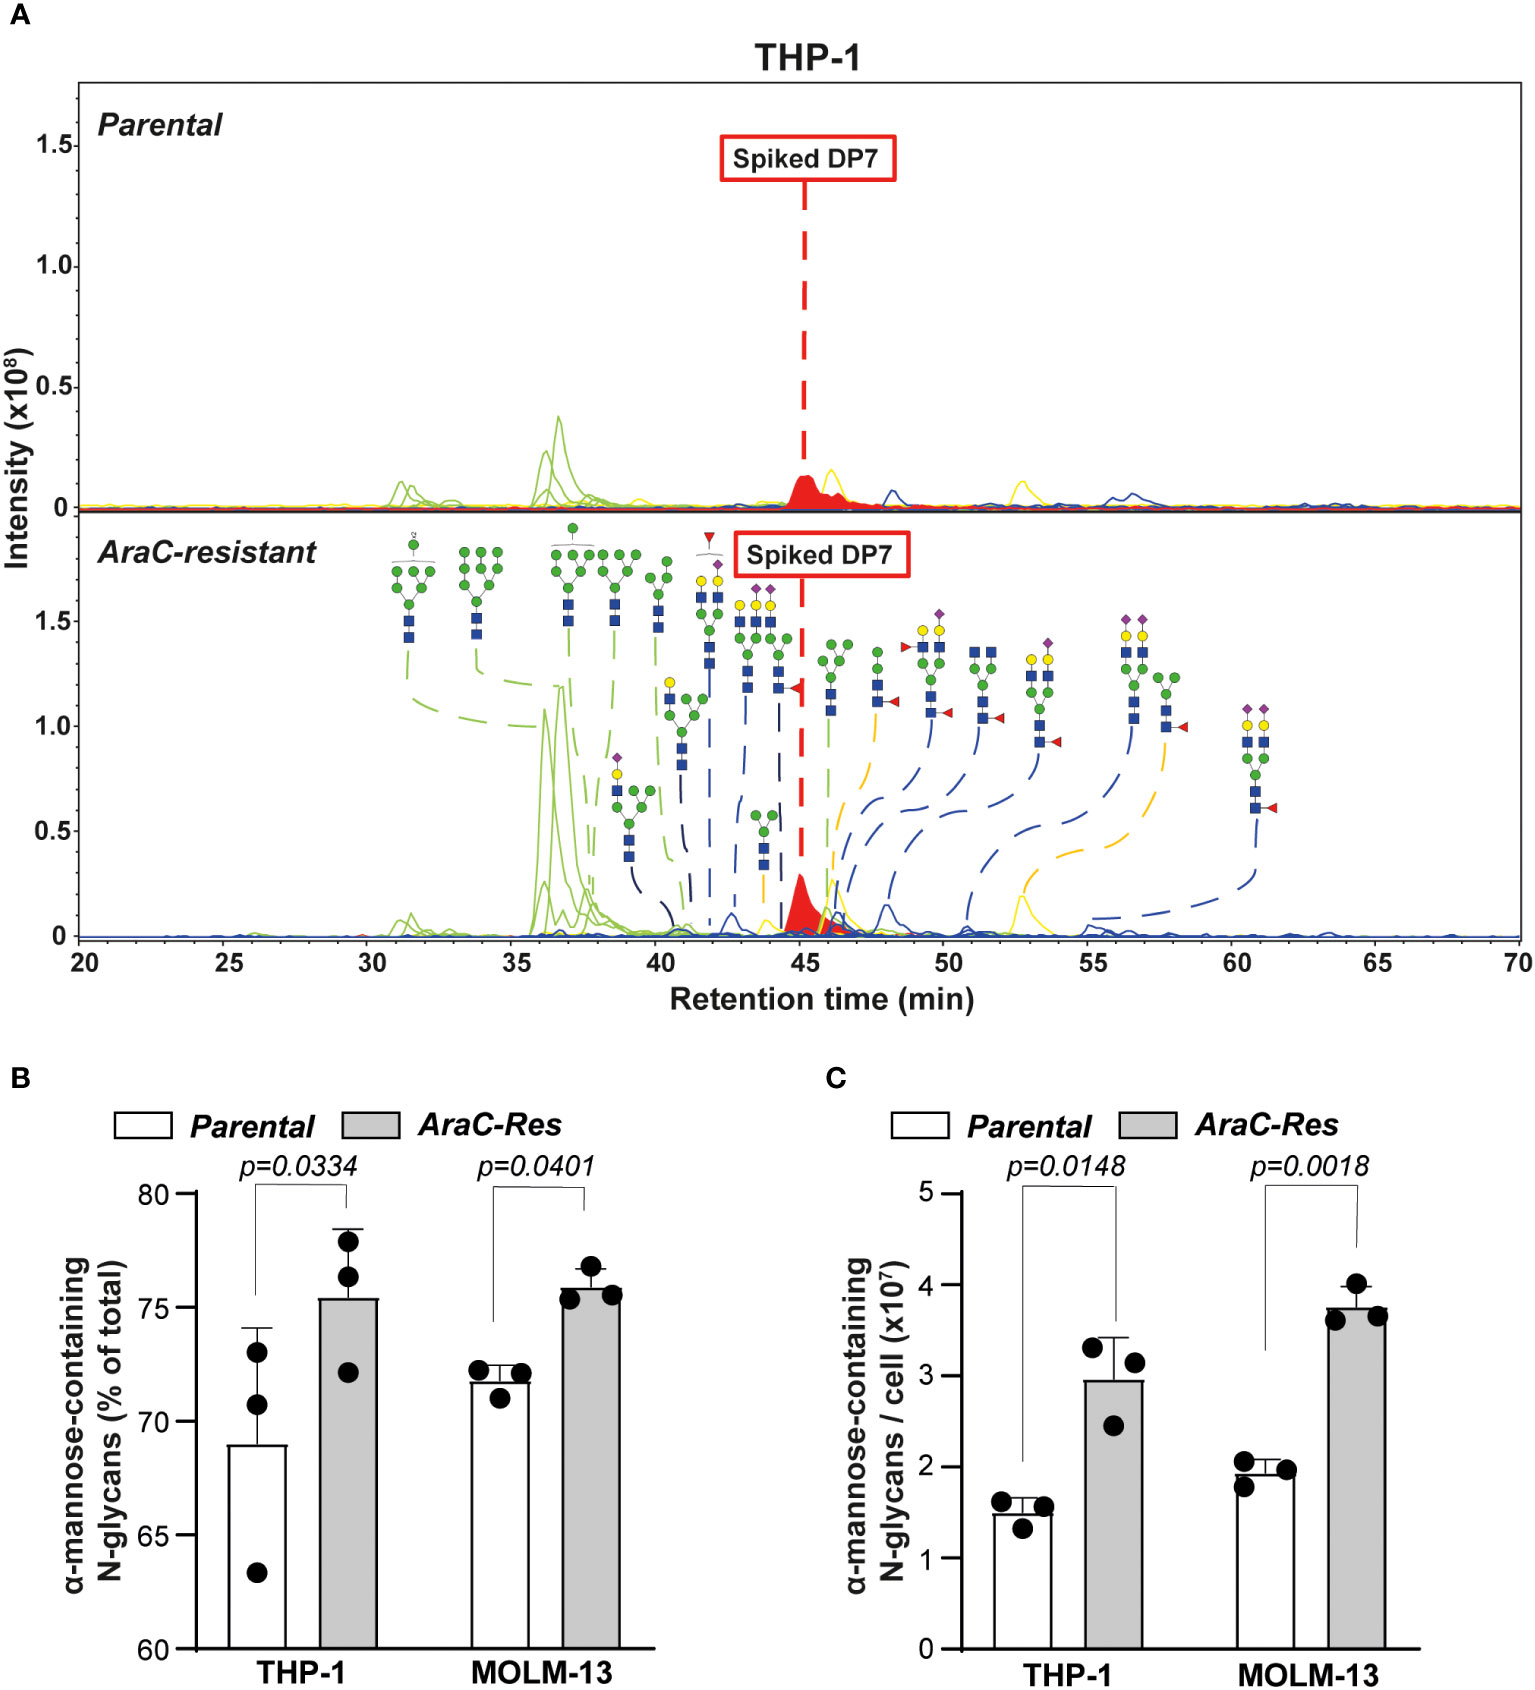
Figure 2 Cytarabine-resistant acute myeloid leukemia (AML) cells express more oligomannoses. (A) Spectra of N-glycans of parental vs. cytarabine (AraC)-resistant THP-1 cells, as determined by PGC nano-LC-MS/MS. The samples were spiked with DP7 to allow quantification of the α-mannose-containing glycans. The blue square is N-acetylglucosamine; the yellow square is N-acetylgalactosamine; the blue circle is glucose; the yellow circle is galactose, and the purple diamond is N-acetylneuraminic acid. (B) The relative abundance of α-mannose-containing glycans in parental vs. AraC-resistant cells (n = 3 independent measurements). (C) The amount of α-mannose-containing glycans per cell, as estimated based on the Maltoheptaose (DP7) control (n = 3 independent measurements). If applicable, the data are depicted as the average plus the standard deviation.
A similar glycan profile was observed for the MOLM-13 cell line pair (Supplementary Figures 1A, B), which showed a 1.9 times higher expression level of α-mannose-containing glycans in MOLM-13Arac-Res (~ 3.8 × 10⁷ per cell) compared to in MOLM-13par cells (~ 1.9 × 10⁷ per cell) (Figure 2C). Together, these results demonstrate a significant increase in the expression of α-mannose-containing N-glycans in AraC-resistant cell lines compared to parental cell lines, which is in line with the hypothesis that AML cells that do not respond to therapy are more strongly mannosylated.
Concanavalin A binds more strongly to AraC-resistant AML cell lines
To use the increased expression of mannoses to predict AraC sensitivity, fluorescently labeled concanavalin A (ConA) was selected, a lectin that predominantly recognizes high mannose N-glycans (23, 24). As expected, ConA-binding was increased toward AraC-resistant cells, both on the cell membrane and in intracellular compartments (Figures 3A, B). It is noteworthy that ConA binding was increased in AraC-resistant cells on the cell membrane, as well as intracellular compartments (Figure 3C). In addition, lens culinaris agglutinin (LCA), a lectin that also recognizes α-mannoses, also bound more strongly to THP-1AraC-Res cells (Supplementary Figure 1B). To determine if increased N-glycan mannosylation directly impacts the chemosensitivity, both MOLM-13par and MOLM-13Arac-Res cells were treated with the N-glycan inhibitor tunicamycin prior to AraC treatment. This increased the sensitivity for both cell lines toward AraC, with re-sensitizing MOLM-13Arac-Res to AraC, with the same level of cell death as induced by AraC in parental cells (Figure 3D). Taken together, AraC-resistant AML cells express more mannosylated N-glycans that can be determined by the α-mannose-binding lectin ConA.
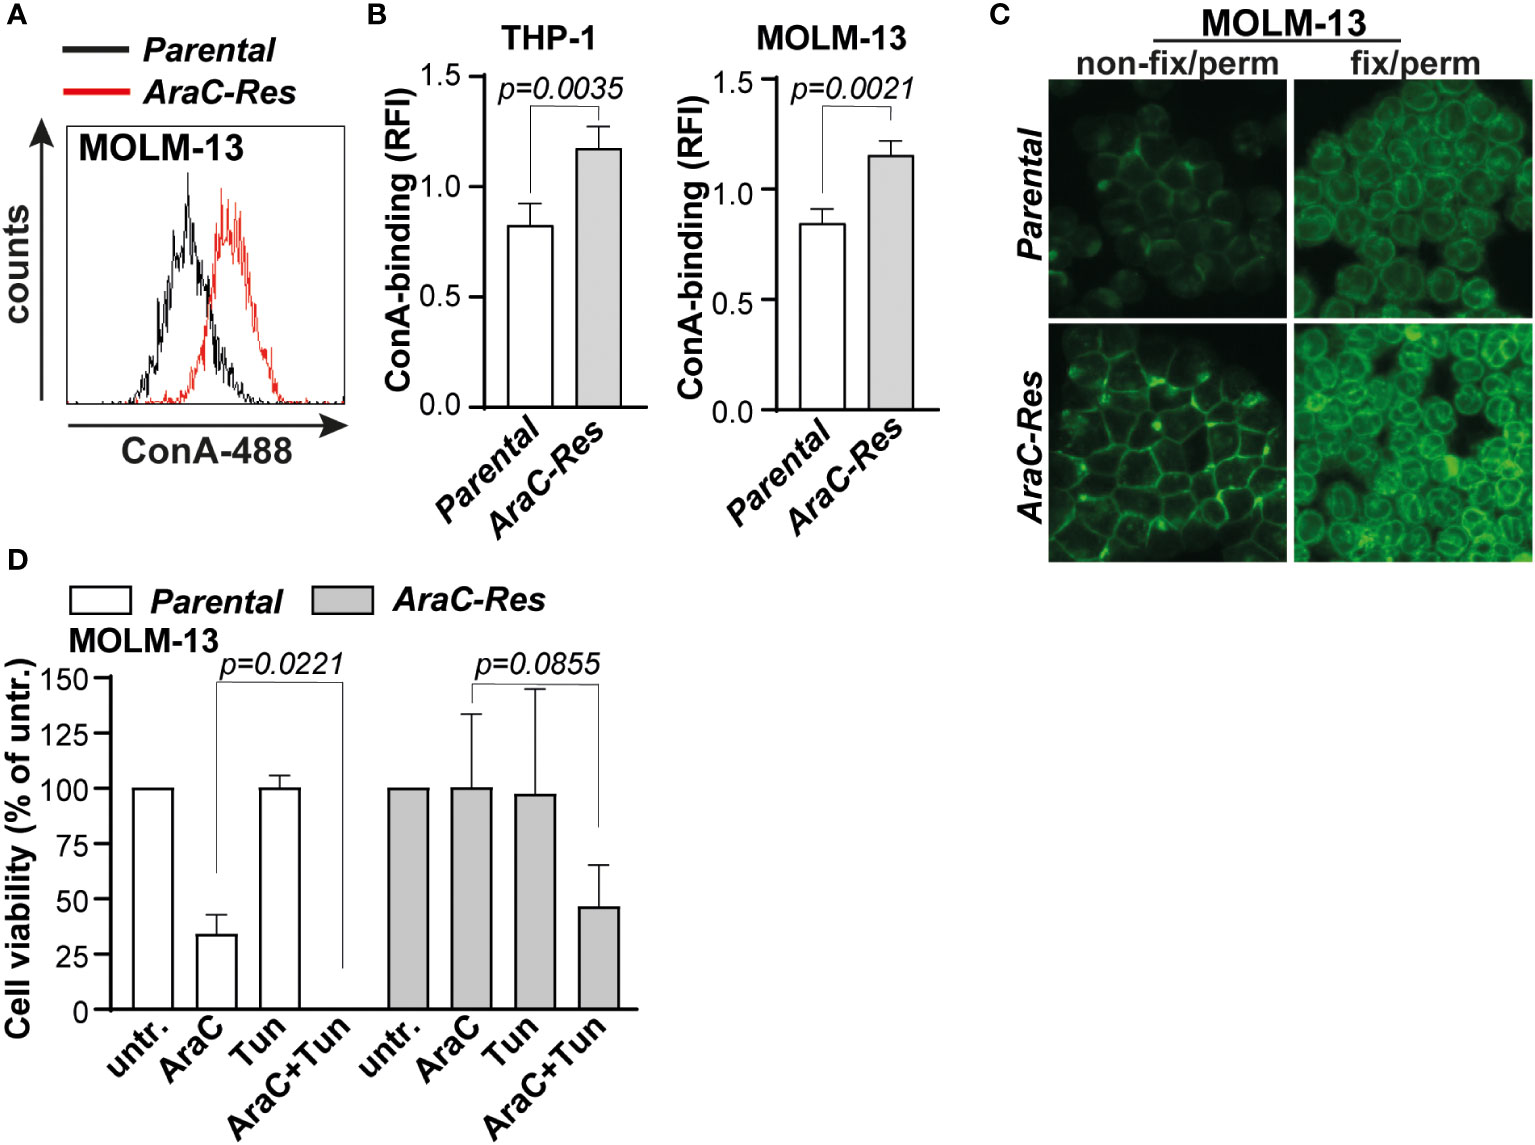
Figure 3 Cytarabine-resistant acute myeloid leukemia (AML) cells are more strongly bound by the mannose-binding lectin concanavalin A (ConA). (A) Histogram of the flow cytometric assay of parental vs. AraC-resistant MOLM-13 cells after ConA staining. (B) Quantified ConA binding based on flow cytometric data (THP-1, n = 7 replicates; and MOLM-13, n = 6 replicates). (C) ConA staining as visualized by fluorescent microscopy in both non-fix/perm cells (staining the plasma membrane) and fix/perm cells (staining also intracellular targets). (D) cytarabine (AraC) (2000 nM) sensitivity after pre-incubation with tunicamycin (Tun) (50 ng/mL for 72 h), measured by the 3-(4,5-dimethylthiazol-2-yl)-5-(3-carboxymethoxyphenyl)-2-(4-sulfophenyl)-2H-tetrazolium (MTS) assay (n = 3 replicates). If applicable, the data are depicted as the average plus the standard deviation.
Concanavalin A binding predicts AraC sensitivity in AML cell lines
To determine whether ConA staining also predicts AraC sensitivity in non-resistant AML, a panel of cell lines (n = 7) was stained with ConA and treated with AraC. Both the extent of ConA staining (Figure 4A) as well as the AraC sensitivity (Figure 4B) differed between the cell lines. As expected, the extent of ConA binding significantly correlated with AraC sensitivity, whereby cells with higher levels of ConA binding were less sensitive toward AraC treatment (Figure 4C). Furthermore, the cell lines clustered together in “low”, “intermediate”, and “high” binders (Figure 4C). It is noteworthy that highly mannosylated cells within one and the same cell line were also less sensitive toward AraC than the cells with fewer mannoses. This was demonstrated by a dose-dependent increase in the fluorescent signal of AraC treated AML cells that were prestained with ConA, reflecting that only the strong binders survived the treatment (Supplementary Figure 1C). A correlation analysis between ConA binding and gene expression of the cell lines in the CCLE dataset revealed that ConA binding positively correlated with the expression of genes associated with adverse-risk AMLs, i.e., CD109 and EGR1 (Figure 4D) (25, 26). Furthermore, GSEA analysis demonstrated a correlation between ConA binding and cholesterol-related pathways, TP53 mutations, and SREBF/SREBP biology (Figure 4D), which are processes usually enriched in AML patients with a poor response to intensive chemotherapy, as demonstrated by us and others (27–29). Thus, ConA staining can predict AraC sensitivity in AML cell lines and is associated with gene expression patterns associated with adverse-risk and chemoresistant AML.
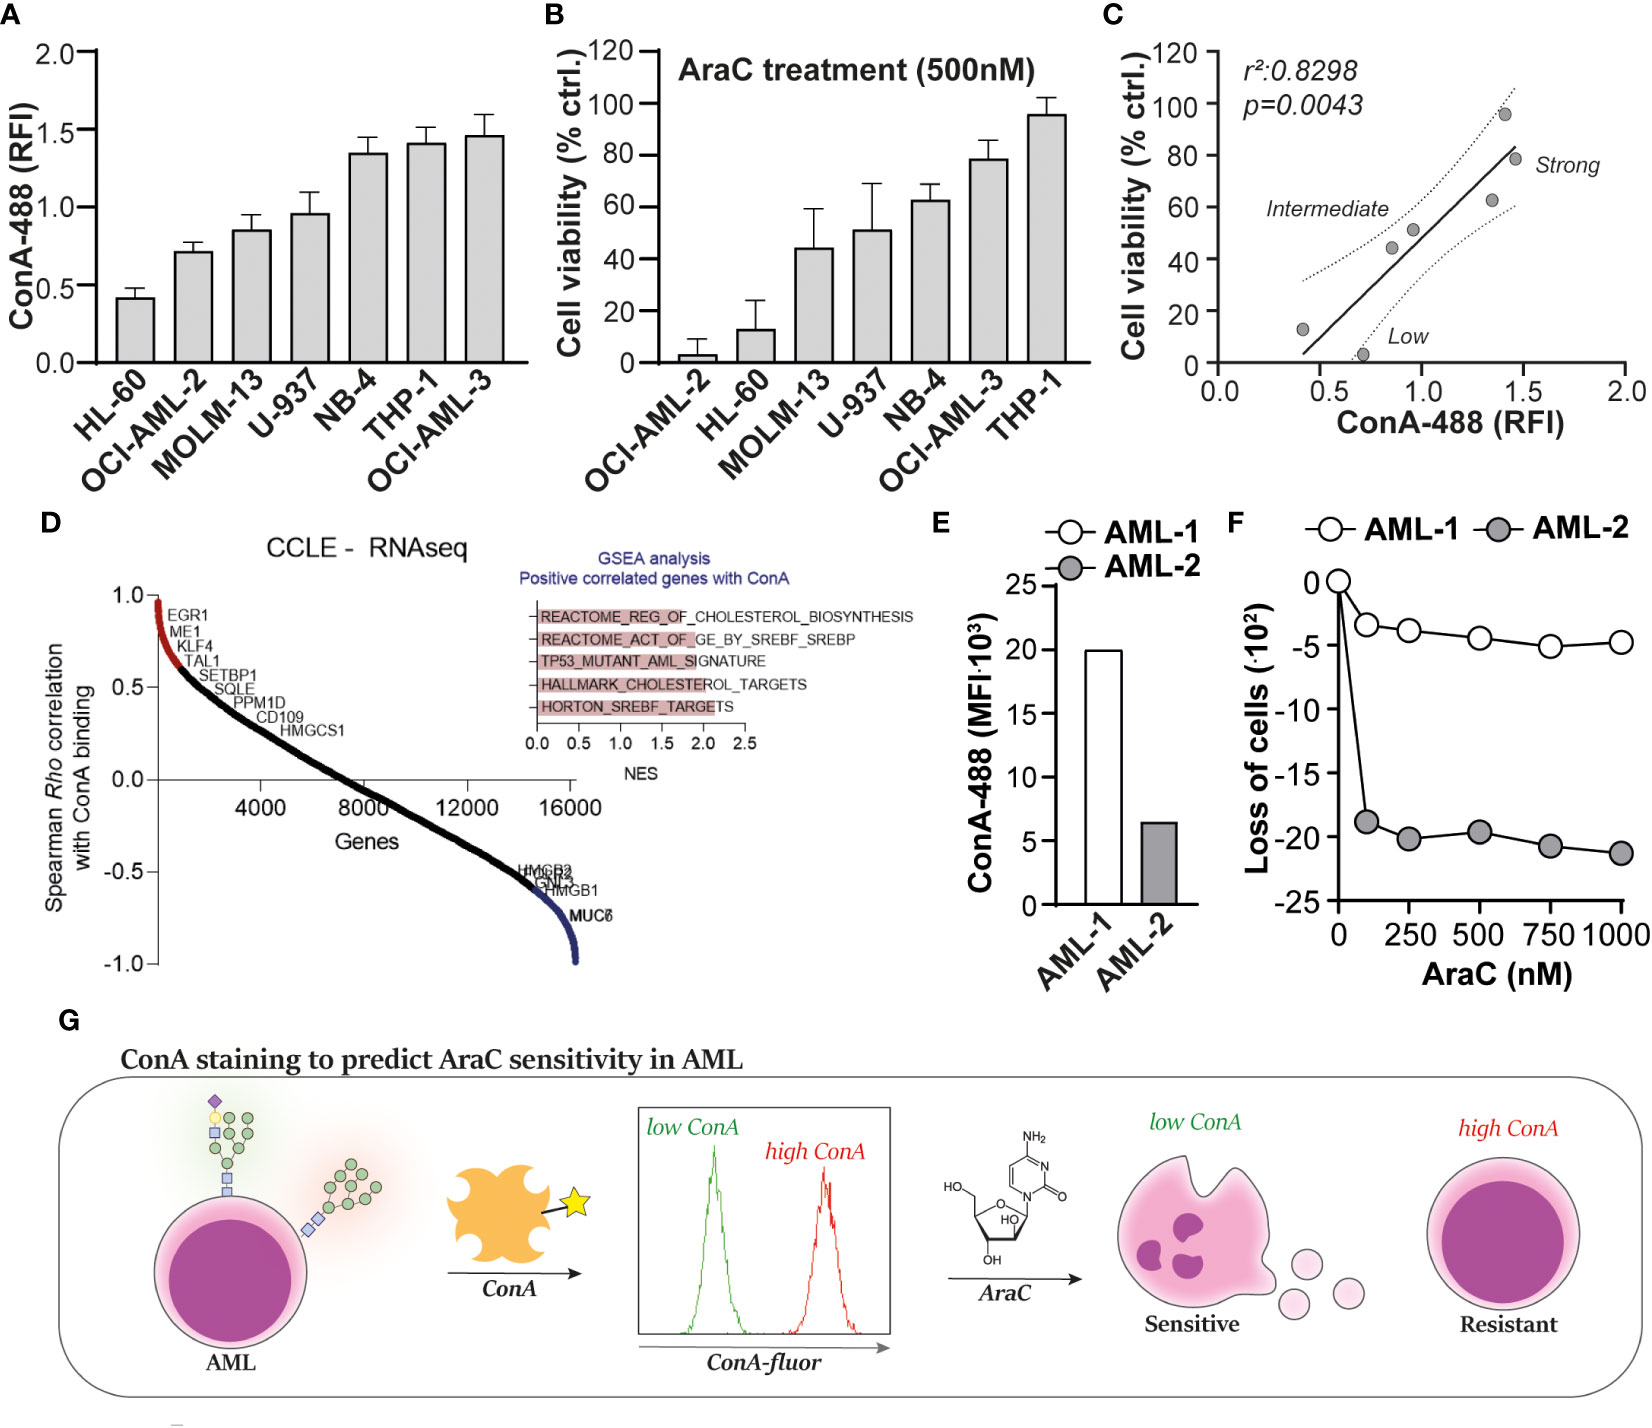
Figure 4 Concanavalin A (ConA) staining predicts cytarabine sensitivity in acute myeloid leukemia (AML). (A) Quantified ConA binding based on flow cytometric data in a panel of seven AML cell lines (n = 5 replicates). (B) Cell viability of the AML cell line panel, upon treatment with 500 nM cytarabine (AraC), as determined by the 3-(4,5-dimethylthiazol-2-yl)-5-(3-carboxymethoxyphenyl)-2-(4-sulfophenyl)-2H-tetrazolium (MTS) assay (n = 5 replicates). (C) Linear regression analysis to determine the correlation between ConA staining and AraC sensitivity in AML, demonstrating the clustering of “low”, “intermediate” and “high” binders. (D) Correlation analysis between ConA binding and gene expression profiles in the AML cell panel. (E) ConA binding in two AML patient samples collected at time of diagnosis, as determined by flow cytometry. (F) Loss of AML blasts in the “viable gate” (Supplementary Figure 2A) upon treatment with AraC. (G) Graphical presentation of the ConA staining to predict AraC sensitivity in AML. If applicable, the data are depicted as the average plus the standard deviation.
Concanavalin A staining predicts AraC sensitivity in patient-derived AML samples
To make a first step toward clinical translation, two patient-derived AML samples, which were obtained upon diagnosis, were defrosted from our cryodatabase. The ConA staining revealed that AML-1 expressed more α-mannose-containing N-glycans than AML-2 (Figure 4E), which would mean, based on our previous findings, that AML-1 would be less sensitive toward AraC treatment than sample AML-2. Indeed, AML-1 hardly responded to AraC treatment, whereas AML-2 was sensitive (Figure 4F). Furthermore, within the viable cells, AML-2 had a 2.8-fold higher percentage in annexin-V-positive cells than AML-1 (33 vs. 12%) upon treatment with 1,000 nM AraC (Supplementary Figure 2B).
Together, we propose that ConA may be used as biomarker to predict AraC sensitivity in AML, whereby AML cells that strongly bind ConA, and thus express high levels of α-mannose-containing N-glycans, are less sensitive or resistant toward AraC treatment (Figure 4G).
Discussion
In this study we identified that high expression levels of α-mannose-containing N-glycans are associated with AraC resistance in AML, which can be visualized using the α-mannose-binding lectin ConA. The ConA preferably binds to terminal mannoses, Man3–Man9, but it also interacts with biantennary N-glycans with most extensions (except for a proximal α-fucose), although with a much lower affinity (24). Interestingly, high levels of mannosylation seems to be a hallmark of cancer (30), and have been associated with enhanced tumor progression and chemoresistance in among others breast cancer, colon cancer, and non-small cell lung cancer (31–33). The increased mannose levels on N-glycans may be driven by the increased expression of mannosyltransferases, such as the asparagine-linked glycosylation (ALG) family, of which ALG2, ALG1L2, and ALG12 are associated with a worse survival in our analysis. Furthermore, the overexpression of ALG3 and ALG10 have been linked to therapy resistance in breast (34) and colon (35) cancer. In lung cancer, high levels of mannosylation were caused by the reduced expression of the mannosidase MAN1A1 in chemoresistant cells (33). Also, when comparing healthy and malignant tissues, the mRNA levels of MAN1A1 and MAN1A2 are commonly downregulated in cancer lesions with oligomannosylation (30). It is noteworthy that the increased level of expression of MAN1B1 and MAN2B1 were associated with better overall survival in our current study, although this result just lost its significance after correction for confounders (with p-values of 0.05 and 0.08, respectively). Both of the genes were also within the top 20 genes that predicted AraC sensitivity in AML when being mutated, among which MAN1B1 was the top hit (3). Although not formally proven yet, it is tempting to speculate that these mutations lead to a loss of function of the genes, resulting in lower mannosidase activity, and hence increased expression of high mannose glycans. Additionally, the expression of POMT2 was also associated with a worse survival in the current study, a gene that is responsible for mannosylation of O-glycans. Therefore, although we focused on N-glycans in the current study, the investigation of O-glycan mannosylation is also of interest.
Mannose is an important sugar for glycosylation, but also fuels metabolic processes, especially the glycolysis pathway. Specifically, the precursor sugar Man-6-P is either converted to the N-glycosylation mannose-donor GDP-Man via phosphomannomutase 2 (PMM2) and GDP-mannose pyrophosphorylase (GMPP) or steered into the glycolysis pathway by mannose-6 phosphate isomerase (MPI), which converts it into Fru-6-P and vice versa (Figure 1B) (36). Notably, the level of expression of MPI was significantly associated with a worse survival in our analysis, which is in line with a recent study that demonstrated that the inhibition of MPI sensitizes AML cells to AraC (37). Therefore, an increase in the level of mannose expression on AraC-resistant AML cells may be caused by a higher activity of the mannose pathway, and hence may reflect the more active metabolic state of these cells. Indeed, a high metabolic state, both via the glycolysis or oxidative phosphorylation pathway, has been linked to AraC resistance in AML (38, 39). Furthermore, ConA binding toward the AML cell lines associated with cholesterol-related pathways, TP53 mutations, and SREBF/SREBP biology, which are processes usually enriched in AML patients with a poor response to chemotherapy (27–29). ConA binding was also positively correlated with the expression of genes associated with adverse-risk AMLs, i.e., CD109 and EGR1 (25, 26). Both analyses strengthen the relationship between high levels of mannosylation and therapy resistance or worse clinical outcome. The treatment with the N-glycosylation inhibitor tunicamycin (re)sensitized AML cells for AraC. Therefore, our study supports the use of inhibitors of the mannose pathway, such as 2-deoxy-D-glucose or MLS0315771, to treat AraC-resistant (and potentially certain adverse-risk) AML.
Higher levels of mannosylation of proteins may also impact on their functioning. In this respect, proteins that are commonly associated with AraC resistance are the equilibrative nucleoside transporters (ENT1 and ENT2) and p-glycoprotein/multidrug resistance mutation 1 (MDR1), which are important for the uptake and efflux of AraC, respectively. Indeed, MDR1 is a highly glycosylated receptor, and its glycosylation is important for proper cell surface expression (40). Furthermore, MDR1 glycosylation has been associated with chemoresistance in both AML (41) and breast cancer (42), whereby silencing of the dolichyl-diphosphooligosaccharide–protein glycosyltransferase subunit 2 (RPN2), a protein that links high mannose oligosaccharides, reduces MDR1 glycosylation and the concomitant expression on the cell membrane, thus increasing sensitivity of breast cancer cells to docetaxel (42). The expression of the closely related RPN1 gene was also significantly associated with a worse survival in our analysis. Similarly, the correct N-linked glycosylation of ENT1 is required to retain its function (43).
Although ConA could predict AraC sensitivity in two patient-derived AML samples, we are aware that the ConA staining should be validated on a larger set of patient samples. This analysis should also determine the optimal cut-off point for considering a patient as “AraC sensitive” or “AraC resistant”. Especially, since the ConA staining is not an “on vs. off” staining, and always stains cells to a certain extent, which may be a limitation of the assay. Therefore, we are currently staining incoming patient AML samples, in collaboration with our routine diagnostic laboratory, to correlate ConA staining levels to clinical treatment responses.
In conclusion, AraC resistance is associated with increased levels of mannosylation that can be determined using ConA. Therefore, we propose ConA staining as a potential novel tool to predict AraC sensitivity in AML that can be incorporated into established protocols using already existing equipment.
Data availability statement
The original contributions presented in the study are included in the article/Supplementary Materials. Further inquiries can be directed to the corresponding author/s.
Ethics statement
The studies involving humans were approved by Medical Ethical committee of the UMCG code NL43844.042.13, January 6th 2014. The studies were conducted in accordance with the local legislation and institutional requirements. The participants provided their written informed consent to participate in this study.
Author contributions
TZ: Data curation, Formal analysis, Investigation, Methodology, Visualization, Writing – review & editing. GM: Formal analysis, Investigation, Visualization, Writing – review & editing. DP-M: Data curation, Formal analysis, Investigation, Software, Writing – review & editing. MW: Resources, Supervision, Writing – review & editing. GH: Funding acquisition, Resources, Writing – review & editing. VW: Conceptualization, Formal analysis, Funding acquisition, Investigation, Methodology, Project administration, Supervision, Visualization, Writing – original draft, Writing – review & editing.
Funding
The author(s) declare financial support was received for the research, authorship, and/or publication of this article. This research was funded by the Dutch Cancer Society (KWF 2016-2/ 10709).
Conflict of interest
The authors declare that the research was conducted in the absence of any commercial or financial relationships that could be construed as a potential conflict of interest.
Publisher’s note
All claims expressed in this article are solely those of the authors and do not necessarily represent those of their affiliated organizations, or those of the publisher, the editors and the reviewers. Any product that may be evaluated in this article, or claim that may be made by its manufacturer, is not guaranteed or endorsed by the publisher.
Supplementary material
The Supplementary Material for this article can be found online at: https://www.frontiersin.org/articles/10.3389/frhem.2023.1302328/full#supplementary-material
References
1. Available at: https://www.kanker.nl/kankersoorten/acute-myeloide-leukemie/algemeen/wat-is-acute-myeloide-leukemie-aml.
2. Abuelgasim KA, Albuhayri B, Munshi R, Mugairi A, Alahmari B, Gmati G, et al. Impact of age and induction therapy on outcome of 180 adult patients with acute myeloid leukemia; retrospective analysis and literature review. Leuk Res Rep (2020) 14:100206. doi: 10.1016/j.lrr.2020.100206
3. Xu H, Muise ES, Javaid S, Chen L, Cristescu R, Mansueto MS, et al. Identification of predictive genetic signatures of Cytarabine responsiveness using a 3D acute myeloid leukaemia model. J Cell Mol Med (2019) 23(10):7063–77. doi: 10.1111/jcmm.14608
4. Schneider C, Oellerich T, Baldauf HM, Schwarz SM, Thomas D, Flick R, et al. SAMHD1 is a biomarker for cytarabine response and a therapeutic target in acute myeloid leukemia. Nat Med (2017) 23(2):250–5. doi: 10.1038/nm.4255
5. Bargal SA, Rafiee R, Crews KR, Wu H, Cao X, Rubnitz JE, et al. Genome-wide association analysis identifies SNPs predictive of in vitro leukemic cell sensitivity to cytarabine in pediatric AML. Oncotarget (2018) 9(79):34859–75. doi: 10.18632/oncotarget.26163
6. Reily C, Stewart TJ, Renfrow MB, Novak J. Glycosylation in health and disease. Nat Rev Nephrol (2019) 15(6):346–66. doi: 10.1038/s41581-019-0129-4
7. Apweiler R, Hermjakob H, Sharon N. On the frequency of protein glycosylation, as deduced from analysis of the SWISS-PROT database. Biochim Biophys Acta (1999) 1473(1):4–8. doi: 10.1016/s0304-4165(99)00165-8
8. Blöchl C, Wang D, Madunić K, Lageveen-Kammeijer GSM, Huber CG, Wuhrer M, et al. Integrated N- and O-glycomics of acute myeloid leukemia (AML) cell lines. Cells (2021) 10(11):3058. doi: 10.3390/cells10113058
9. Wang M, Zhu J, Lubman DM, Gao C. Aberrant glycosylation and cancer biomarker discovery: a promising and thorny journey. Clin Chem Lab Med (2019) 57(4):407–16. doi: 10.1515/cclm-2018-0379
10. Cancer Genome Atlas Research Network, Ley TJ, Miller C, Ding L, Raphael BJ, Mungall AJ, et al. Genomic and epigenomic landscapes of adult de novo acute myeloid leukemia. N Engl J Med (2013) 368(22):2059–74. doi: 10.1056/NEJMoa1301689
11. Tyner JW, Tognon CE, Bottomly D, Wilmot B, Kurtz SE, Savage SL, et al. Functional genomic landscape of acute myeloid leukaemia. Nature (2018) 562(7728):526–31. doi: 10.1038/s41586-018-0623-z
12. de Jonge HJM, Valk PJM, Veeger NJGM, ter Elst A, den Boer ML, Cloos J, et al. High VEGFC expression is associated with unique gene expression profiles and predicts adverse prognosis in pediatric and adult acute myeloid leukemia. Blood (2010) 116(10):1747–54. doi: 10.1182/blood-2010-03-270991
13. Verhaak RGW, Wouters BJ, Erpelinck CAJ, Abbas S, Beverloo HB, Lugthart S, et al. Prediction of molecular subtypes in acute myeloid leukemia based on gene expression profiling. Haematologica (2009) 94(1):131–4. doi: 10.3324/haematol.13299
14. Zhang T, Madunić K, Holst S, Zhang J, Jin C, Ten Dijke P, et al. Development of a 96-well plate sample preparation method for integrated N- and O-glycomics using porous graphitized carbon liquid chromatography-mass spectrometry. Mol Omics (2020) 16(4):355–63. doi: 10.1039/c9mo00180h
15. Ceroni A, Maass K, Geyer H, Geyer R, Dell A, Haslam SM. GlycoWorkbench: a tool for the computer-assisted annotation of mass spectra of glycans. J Proteome Res (2008) 7(4):1650–9. doi: 10.1021/pr7008252
16. Cooper CA, Gasteiger E, Packer NH. GlycoMod–a software tool for determining glycosylation compositions from mass spectrometric data. Proteomics (2001) 1(2):340–9. doi: 10.1002/1615-9861(200102)1:2<340::AID-PROT340>3.0.CO;2-B
17. Karlsson NG, Wilson NL, Wirth HJ, Dawes P, Joshi H, Packer NH. Negative ion graphitised carbon nano-liquid chromatography/mass spectrometry increases sensitivity for glycoprotein oligosaccharide analysis. Rapid Commun Mass Spectrom (2004) 18(19):2282–92. doi: 10.1002/rcm.1626
18. Visser N, Lourens HJ, Huls G, Bremer E, Wiersma VR. Inhibition of autophagy does not re-sensitize acute myeloid leukemia cells resistant to cytarabine. Int J Mol Sci (2021) 22(5):2337. doi: 10.3390/ijms22052337
19. Choukrani G, Visser N, Ustyanovska Avtenyuk N, Olthuis M, Marsman G, Ammatuna E, et al. Galectin-9 has non-apoptotic cytotoxic activity toward acute myeloid leukemia independent of cytarabine resistance. Cell Death Discovery (2023) 9(1):228. doi: 10.1038/s41420-023-01515-w
20. Lucena-Araujo AR, Coelho-Silva JL, Pereira-Martins DA, Silveira DR, Koury LC, Melo RAM, et al. Combining gene mutation with gene expression analysis improves outcome prediction in acute promyelocytic leukemia. Blood (2019) 134(12):951–9. doi: 10.1182/blood.2019000239
21. Ghandi M, Huang FW, Jané-Valbuena J, Kryukov GV, Lo CC, McDonald ER, et al. Next-generation characterization of the cancer cell line encyclopedia. Nature (2019) 569(7757):503–8. doi: 10.1038/s41586-019-1186-3
22. Subramanian A, Tamayo P, Mootha VK, Mukherjee S, Ebert BL, Gillette MA, et al. Gene set enrichment analysis: a knowledge-based approach for interpreting genome-wide expression profiles. Proc Natl Acad Sci USA (2005) 102(43):15545–50. doi: 10.1073/pnas.0506580102
23. Wiersma VR. Lectins as modulators of autophagy in cancer immunotherapy. In: Autophagy in immune response: impact on cancer immunotherapy, vol. p. Elsevier (2020). p. 53–74. Available at: https://www.sciencedirect.com/science/article/abs/pii/B9780128196090000043.
24. Bojar D, Meche L, Meng G, Eng W, Smith DF, Cummings RD, et al. A useful guide to lectin binding: machine-learning directed annotation of 57 unique lectin specificities. ACS Chem Biol (2022) 17(11):2993–3012. doi: 10.1021/acschembio.1c00689
25. Wagner S, Vadakekolathu J, Tasian SK, Altmann H, Bornhäuser M, Pockley AG, et al. A parsimonious 3-gene signature predicts clinical outcomes in an acute myeloid leukemia multicohort study. Blood Adv (2019) 3(8):1330–46. doi: 10.1182/bloodadvances.2018030726
26. Silveira DR, Chatzikyriakou P, Casares Aláez P, Mackie S, Hulks R, Siejka-Zielińska P, et al. Dysregulation of chromatin via H3K27 methylation underpins differentiation arrest in Isocitrate dehydrogenase-mutant Acute Myeloid Leukaemia. BiorXiv (2023). doi: 10.1101/2023.08.24.554641v1.full
27. Subedi A, Liu Q, Ayyathan DM, Sharon D, Cathelin S, Hosseini M, et al. Nicotinamide phosphoribosyltransferase inhibitors selectively induce apoptosis of AML stem cells by disrupting lipid homeostasis. Cell Stem Cell (2021) 28(10):1851–1867.e8. doi: 10.1016/j.stem.2021.06.004
28. Griessinger E, Pereira-Martins D, Nebout M, Bosc C, Saland E, Boet E, et al. Oxidative phosphorylation fueled by fatty acid oxidation sensitizes leukemic stem cells to cold. Cancer Res (2023) 83(15):2461–70. doi: 10.1158/0008-5472.CAN-23-1006
29. Ortiz Rojas CA, Costa-Neto A, Pereira-Martins DA, Le DM, Sternadt D, Weinhäuser I, et al. High ME1 expression is a molecular predictor of post-transplant survival of patients with acute myeloid leukemia. Cancers (Basel) (2022) 15(1):296. doi: 10.3390/cancers15010296
30. Chatterjee S, Ugonotti J, Lee LY, Everest-Dass A, Kawahara R, Thaysen-Andersen M. Trends in oligomannosylation and α1,2-mannosidase expression in human cancers. Oncotarget (2021) 12(21):2188–205. doi: 10.18632/oncotarget.28064
31. Ščupáková K, Adelaja OT, Balluff B, Ayyappan V, Tressler CM, Jenkinson NM, et al. Clinical importance of high-mannose, fucosylated, and complex N-glycans in breast cancer metastasis. JCI Insight (2021) 6(24):e146945. doi: 10.1172/jci.insight.146945
32. Boyaval F, Dalebout H, Van Zeijl R, Wang W, Fariña-Sarasqueta A, Lageveen-Kammeijer GSM, et al. High-mannose N-Glycans as malignant progression markers in early-stage colorectal cancer. Cancers (2022) 14(6):1552. doi: 10.3390/cancers14061552
33. Zeng W, Zheng S, Mao Y, Wang S, Zhong Y, Cao W, et al. Elevated N-glycosylation contributes to the cisplatin resistance of non-small cell lung cancer cells revealed by membrane proteomic and glycoproteomic analysis. Front Pharmacol (2021) 12:805499. doi: 10.3389/fphar.2021.805499
34. Sun X, He Z, Guo L, Wang C, Lin C, Ye L, et al. ALG3 contributes to stemness and radioresistance through regulating glycosylation of TGF-β receptor II in breast cancer. J Exp Clin Cancer Res (2021) 40(1):149. doi: 10.1186/s13046-021-01932-8
35. Xu X, Wang H, Li X, Duan X, Wang Y. A novel ALG10/TGF-β positive regulatory loop contributes to the stemness of colorectal cancer. Aging (2022) 14(11):4858–73. doi: 10.18632/aging.204116
36. Sharma V, Ichikawa M, Freeze HH. Mannose metabolism: more than meets the eye. Biochem Biophys Res Commun (2014) 453(2):220–8. doi: 10.1016/j.bbrc.2014.06.021
37. Woodley K, Dillingh LS, Giotopoulos G, Madrigal P, Rattigan KM, Philippe C, et al. Mannose metabolism inhibition sensitizes acute myeloid leukaemia cells to therapy by driving ferroptotic cell death. Nat Commun (2023) 14(1):2132. doi: 10.1038/s41467-023-37652-0
38. Farge T, Saland E, de Toni F, Aroua N, Hosseini M, Perry R, et al. Chemotherapy-resistant human acute myeloid leukemia cells are not enriched for leukemic stem cells but require oxidative metabolism. Cancer Discovery (2017) 7(7):716–35. doi: 10.1158/2159-8290.CD-16-0441
39. Chen WL, Wang JH, Zhao AH, Xu X, Wang YH, Chen TL, et al. A distinct glucose metabolism signature of acute myeloid leukemia with prognostic value. Blood (2014) 124(10):1645–54. doi: 10.1182/blood-2014-02-554204
40. Gribar JJ, Ramachandra M, Hrycyna CA, Dey S, Ambudkar SV. Functional characterization of glycosylation-deficient human P-glycoprotein using a vaccinia virus expression system. J Membr Biol (2000) 173(3):203–14. doi: 10.1007/s002320001020
41. Ma H, Zhou H, Song X, Shi S, Zhang J, Jia L. Modification of sialylation is associated with multidrug resistance in human acute myeloid leukemia. Oncogene (2015) 34(6):726–40. doi: 10.1038/onc.2014.7
42. Honma K, Iwao-Koizumi K, Takeshita F, Yamamoto Y, Yoshida T, Nishio K, et al. RPN2 gene confers docetaxel resistance in breast cancer. Nat Med (2008) 14(9):939–48. doi: 10.1038/nm.1858
Keywords: acute myeloid leukemia (AML), cytarabine (AraC), chemoresistance, mannosylation, Conconavalin A (ConA), biomarker
Citation: Zhang T, Marsman G, Pereira-Martins DA, Wuhrer M, Huls GA and Wiersma VR (2024) Concanavalin A staining: a potential biomarker to predict cytarabine sensitivity in acute myeloid leukemia. Front. Hematol. 2:1302328. doi: 10.3389/frhem.2023.1302328
Received: 26 September 2023; Accepted: 26 December 2023;
Published: 25 January 2024.
Edited by:
Francesco Di Raimondo, University of Catania, ItalyReviewed by:
Ya Zhang, Shandong Provincial Hospital Affiliated to Shandong First Medical University, ChinaCalogero Vetro, Gaspare Rodolico Ospedale, Italy
Copyright © 2024 Zhang, Marsman, Pereira-Martins, Wuhrer, Huls and Wiersma. This is an open-access article distributed under the terms of the Creative Commons Attribution License (CC BY). The use, distribution or reproduction in other forums is permitted, provided the original author(s) and the copyright owner(s) are credited and that the original publication in this journal is cited, in accordance with accepted academic practice. No use, distribution or reproduction is permitted which does not comply with these terms.
*Correspondence: Valerie R. Wiersma, di53aWVyc21hQHVtY2cubmw=