 Alexei Lyapustin
 Sujung Go
 Sergey Korkin
 Yujie Wang
 Omar Torres1
- 1National Aeronautics and Space Administration Goddard Space Flight Center, Greenbelt, MD, United States
- 2Joint Center for Earth Systems Technology, University of Maryland Baltimore County, Baltimore, MD, United States
- 3Goddard Earth Sciences Technology and Research, Universities Space Research Association, Columbia, MD, United States
A new algorithm is described for joint retrievals of the aerosol optical depth and spectral absorption from EPIC observations in the UV—Vis spectral range. The retrievals are illustrated on examples of the wildfire smoke events over North America, and dust storms over greater Sahara region in 2018. An initial evaluation of single scattering albedo (SSA) at 443 nm over these regions shows a good agreement with AERONET data, generally within the uncertainty of AERONET SSA of ± 0.03. A particularly good agreement is achieved for dust with R~0.62, rmse~0.02, negligible bias, and 85% points within the expected error. This new capability is part of version 2 MAIAC EPIC algorithm. The v2 algorithm has recently completed reprocessing of the EPIC record covering the period of 2015–2020.
Introduction
Absorption is an important aerosol property determining, along with its total loading, aerosol-radiation and aerosol-cloud interactions (Boucher et al., 2013). High natural variability and lack of detailed knowledge of aerosol absorption make it one of the largest sources of uncertainty in assessments of aerosol direct radiative effects (DRE) (Samset et al., 2018; Thorsen et al., 2020) and in current climate projections (IPCC: Climate Change, 2013). Information on spectral dependence of aerosol absorption provides a pathway to the speciation of absorbing aerosol components and chemical composition analysis (e.g., Schuster et al., 2016; Li et al., 2020b). The latest climate multi-model analysis showed that uncertainties in the mineral dust iron content give rise to ~85% uncertainty of dust DRE estimates by the models (Li et al., 2020a). Composition analysis of aerosol particles and investigation of toxicity and adverse health effects of different components is a central goal of the future NASA MAIA (Multi-Angle Imager for Aerosols) mission (Diner et al., 2018).
Historically, the Total Ozone Monitoring Sensor (TOMS) and Ozone Mapping Instrument (OMI) were the first spaceborne instruments providing initially qualitative, in form of UV Aerosol Index (UVAI) (Herman et al., 1997; Torres et al., 1998), and later quantitative information on aerosol absorption for cloud-free conditions (Torres et al., 1998, 2002, 2007, 2013, 2018; Ahn et al., 2014; Jethva et al., 2014), and most recently for the characterization of aerosol above clouds (Torres et al., 2012; Jethva et al., 2018). The UV channels of these sensors were the key for two main reasons: (i) the surface is significantly darker than in the visible range, which reduces the respective uncertainty, and (ii) higher Rayleigh and aerosol optical depth in the UV increases sensitivity to absorption via increase in the multiple scattering of light. On the other hand, the UV range adds the uncertainty due to the aerosol layer height sensitivity (Torres et al., 1998, 2013) which plays only a minor role at longer wavelengths in the visible and near-IR.
The present OMAERUV algorithm of Aura/OMI retrieves aerosol optical depth (AOD) and single scattering albedo (SSA) using two channels, i.e., 354 and 388 nm. The algorithm relies on an ancillary data on spectral dependence of absorption compiled from different sources, including lab measurements (Jethva and Torres, 2011) and seasonal/regional climatological aerosol height from CALIOP CALIPSO observations (Torres et al., 2013). Because of the aerosol height sensitivity, the product is reported for several effective heights (0, 1.5, 3, 6, and 10 km). OMAERUV is currently the baseline algorithm used to process data from several instruments having UV capability, including DSCOVR/EPIC, OMPS on SNPP platform, as well as S5p/TropOMI (Torres et al., 2020), and GEMS (Kim et al., 2020) imaging spectrometers.
The near-simultaneous multi-angle imagery (e.g., MISR) extends the range of measurements and provides an additional information on aerosol particle size, shape and absorption (Kahn et al., 2010; Kahn and Gaitley, 2015). Finally, with adding the polarization dimension, the multi-angle spectro-polarimetric missions in development, such as MAIA (Diner et al., 2018), multi-angle polarimeters on PACE (Remer et al., 2019), or EUMETSAT EPS-SG/3MI (e.g., Fougnie et al., 2020), are expected to provide the most advanced global aerosol characterization including spectral refractive index, AOD and size distribution, as demonstrated by the processing of POLDER/PARASOL observations (Chen et al., 2020) with the Generalized Retrieval of Atmosphere and Surface Properties (GRASP) (Dubovik et al., 2011) algorithm.
In this work, we present a new approach to derive AOD and spectral aerosol absorption from observations of the Earth Polychromatic Imaging Camera (EPIC) onboard the Deep Space Climate Observatory (DSCOVR) satellite located at Lagrange-1 (L1) point. Due to DSCOVR's unique orbit, EPIC continuously observes the entire sunlit side of the Earth in 10 narrowband channels (317, 325, 340, 388, 443, 551, 680, 688, 764, and 779 nm) and provides 10–12 observations for the same surface area from dawn to dusk in summer, and 6–7 images in winter (Marshak et al., 2018). Given a reliable characterization of spectral surface reflectance by MAIAC, a well-calibrated set of EPIC's visible (443 and 680 nm) and UV channels (340 and 388 nm) offers a unique opportunity to simultaneously retrieve both optical depth (AOD) and spectral absorption of aerosols.
Below, the new approach to derive AOD and spectral aerosol absorption from EPIC is presented in section MAIAC EPIC Processing Algorithm. Analysis of the global EPIC dataset for 2018 is provided for both biomass burning smoke and mineral dust in sections Retrieval Examples From EPIC and AERONET Validation. AERONET (Holben et al., 1998) validation of single scattering albedo at 443 nm (SSA443) shows a good correlation and retrieval accuracy comparable with AERONET product uncertainty. This approach is a part of the v2 MAIAC EPIC atmospheric correction algorithm described in detail in a companion paper (Lyapustin et al., submitted).
Maiac Epic Processing Algorithm
The current development takes advantage of the baseline EPIC MAIAC algorithm over land, which includes cloud detection, characterization of spectral regression coefficients (SRC), aerosol retrievals with regional background aerosol models, and atmospheric correction resulting in surface reflectance and parameters of spectral bidirectional reflectance distribution function (BRDF) model. Below, we provide a brief outline of the standard MAIAC algorithm relevant to sections AOD - Spectral Absorption Algorithm to Detection of Smoke and Dust that introduce the new flexible inversion algorithm.
Outline of MAIAC Algorithm
MAIAC relies on a dynamic time series analysis, which helps separate relatively static surface properties from aerosols and clouds that are changing rapidly over time. Observing the same surface area over time requires resampling data on a regular spatial grid. In v2 MAIAC, we introduced a rotated Sinusoidal projection that minimizes spatial distortions (for detail, see Lyapustin et al., submitted). The original nadir spatial resolution of EPIC is 8 km in the Blue band (443 nm) and 16 km in other bands due to 2 × 2 onboard aggregation. To raise the probability of cloud detection and capture maximal aerosol variability, we grid EPIC data to 10 km resolution. This results in oversampling in all bands except 443 nm, but the overhead in processing is minor given current computing resources. For simplicity, the fixed grid cells are called “pixels” further on.
MAIAC cloud detection includes several steps. It starts with traditional pixel-level spectral tests, including (1) the bright cloud test based on fixed thresholds; (2) 3 × 3 standard deviation test using pixel-specific thresholds, and (3) oxygen A and B-band test for high clouds. The next level of cloud detection follows aerosol retrievals: it filters high AOD values in 25 × 25 pixels window using threshold being a function of the cloud fraction in the spatial window. The final detection of residual clouds takes place during the atmospheric correction, and is based on the known spectral BRDF for each land pixel. For instance, it filters pixels when the derived reflectance at 443 nm exceeds the BRDF model prediction by more than 0.05. The last two steps provide a significant enhancement to the cloud mask. As a result, despite the coarse spatial resolution and lack of thermal channels, the overall achieved quality of MAIAC EPIC cloud detection is satisfactory for aerosol retrieval and atmospheric correction.
Retrieving spectral regression coefficient (SRC) is a central part of MAIAC that ensures separation of the surface and atmospheric signals in the top of atmosphere (TOA) measurements, and is required for aerosol retrievals over different land surface types globally. SRC is retrieved for cloud-free pixels as a minimum value for the ratios ρ443/ρ680, ρ388/ρ680, and ρ340/ρ388, where surface reflectance (SR) ρ is a result of Rayleigh atmospheric correction (for detail, see Lyapustin et al., 2018). To account for the angular dependence, the ratios are characterized in 4 bins of the cosine of solar zenith angle between 0.3 and 1, for the morning and afternoon observations separately. Because of higher uncertainties of atmospheric correction at 340 nm, and large difference in reflectance at 340 and 680 nm, we use the ratio 340/388 nm which is derived from observations near the local noon. Through these three ratios, we have an assessment of SR at 340, 388, and 443 nm from the measured 680 nm for each 10 km grid cell. Figure 1 gives an example of SRC for the North American continent for August 2018.
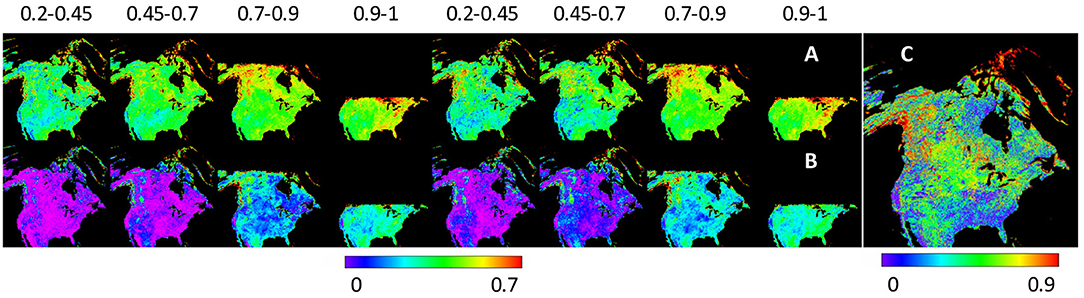
Figure 1. SRC of the MAIAC EPIC algorithm for August 2018 for North America and Greenland (surface reflectance ratios): (A) 443/680; (B) 388/680; (C) 340/388. Ratios (A,B) are shown for four cSZA bins labeled on the top from the morning on the left till the evening on the right. Ratio (C) is built from cloud-free measurements within ± 2 h from the local noon.
Following the MAIAC MODIS algorithm (Lyapustin et al., 2018), EPIC aerosol retrievals use eight prescribed regional aerosol models to represent global variability of aerosol properties over land. For cloud-free pixels, the surface reflectance at 443 nm is estimated from the red band, as described above, and AOD443 is derived by matching the measured TOA reflectance. Finally, for low to moderate atmospheric opacity (AOD443 < 1.2), MAIAC performs atmospheric correction and derives BRDF from the accumulated set of up to 80 previous observations at different angles.
AOD - Spectral Absorption Algorithm
With the knowledge of surface reflectance, we can use the Blue and UV channels to retrieve both AOD and spectral aerosol absorption. As mentioned before, spectral dependence of absorption carries information on particles chemical composition, including black-brown carbon partitioning for smoke, or hematite/goethite content for the mineral dust. In this work, spectral absorption is represented by a conventional power-law expression (e.g., Bond, 2001; Kirchstetter et al., 2004),
where k is an imaginary refractive index. In the limit of small (fine mode) particles, the spectral absorption exponent (SAE) b is related to the conventional Absorption Angstrom Exponent (AAE) that defines spectral dependence of the aerosol absorption optical depth (AAOD) as b ~ AAE-1. Below, the term SAE will be used to denote exponent b for convenience.
We are using Levenberg-Marquardt optimal fit algorithm (Marquardt, 1963) to derive the unknowns (AOD443, k0, b) by matching EPIC TOA reflectance at 340, 388, 443, and minimizing:
where and are measured and theoretical values. The retrievals are based on the look-up table (LUT) computed with combination of vector code IPOL (Emde et al., 2015; Korkin and Lyapustin, 2019) computing path reflectance and scalar code SHARM (Lyapustin and Knyazikhin, 2002; Lyapustin, 2005) generating atmospheric Green's function, transmittance, and spherical albedo.
The real refractive index (m) and size distribution for both smoke and dust models are fixed. Specifically, the smoke model uses m = 1.48 and a bimodal lognormal size distribution with rvf = 0.14, σvf = 0.4, rvc = 2.8, σvc = 0.6, and Cvf/Cvc = 2.5. Here, rv, σv are the volumetric radius and standard deviation, and Cv is the volumetric concentration for the fine (f) and coarse (c) modes, respectively. The dust LUT uses model of randomly oriented spheroids (Dubovik et al., 2006) with m=1.56, following the dynamic model of Dubovik et al. (2002) for the Solar Village site where the relative concentration of the coarse mode dust grows rapidly with AOD.
The LUTs are generated on a 4 × 4 matrix of b = {0.1, 1.5, 3, 4} and k0 = {0.001, 0.006, 0.011, 0.016} for smoke and k0 = {0.0006, 0.0014, 0.0022, 0.003} for dust. For each combination of (k0, b), the standard sub-LUT is computed for 8 AOD443 nodes {0.2, 0.5, 0.8, 1.2, 1.8, 2.8, 4.2, 6.}, 18 values of cosine of solar and view zenith angle from 0.15 to 1 with step 0.05, and 5 azimuths for the range 160–180° with step 5°. The sub-LUT is computed for 2 relative pressure levels, P = 1 and 0.7, for the surface height interpolation.
Calculation of TOA reflectance for each nodal combination (k0, i, bj, AODn) involves 4D-interpolation in view geometry and surface pressure/height. Generating output for an arbitrary set of parameters (k0, b, AOD) involves further tri-linear interpolation over the respective nodes. The partial derivatives over these parameters are also estimated using the neighbor nodes. Despite this rather crude estimation of partial derivatives, the algorithm generally features fast convergence on average within ~1–3% of the measurements. Overall, the developed LUT-based approach is numerically optimized and very efficient, resulting only in a fractional increase of the processing time compared to the standard MAIAC EPIC algorithm.
Finally, to account for the dependence on the aerosol plume height, we generated 2 smoke LUTs with an effective height at 1 and 4 km, generally representing the boundary layer aerosol and the long-range transport. We make separate retrievals for 2 heights and report them for the biomass burning smoke. In the v2 algorithm, the dust is represented by the boundary layer aerosol only.
The described flexible inversion algorithm is applied when AOD443 retrieved with the background aerosol model exceeds 0.6 or absorbing smoke or dust were detected (see section Detection of Smoke and Dust). This cut-off was introduced based on observation that our EPIC SSA443 retrievals are systematically biased low at lower AOD compared to those for higher AOD for the same events. A similar pattern is often observed in AERONET inversion dataset, which points to a generic nature of this artifact when, at lower AOD with higher role of uncertainties, a better fit to the measurements is often achieved at higher absorption. In certain cases, such pattern may, at least partially, be explained by aerosol humidification at high relative humidity accompanied by the increase of both AOD and SSA [e.g., Schafer et al. (2014), Figure 12].
The described approach was developed for regions with pure biomass burning or dust. A proper handling of cases with mixed dust and biomass burning, prevalent, for instance, in sub-Saharan Africa, will require further development.
Detection of Smoke and Dust
The OMI OMAERUV algorithm uses the UVAI to detect absorbing aerosols, along with the ancillary AIRS (Atmospheric Infrared Sounder) carbon monoxide (CO) serving as a tracer of carbonaceous aerosols to separate from dust. MAIAC uses a different, perhaps less flexible, approach developed for MODIS, where dust is limited to known dust source regions (see Lyapustin et al., 2018), and the smoke model is used globally elsewhere. Because cloud edges and certain types of thin clouds often show spectral signatures similar to those of dust, such an approach was chosen in MAIAC to limit omission errors of cloud detection globally.
In v2 MAIAC EPIC algorithm, flexible inversion is performed after cloud detection and standard aerosol retrieval with associated residual cloud filtering. Designed to ensure high quality of its main product—atmospheric correction—MAIAC cloud filtering is rather conservative and often masks optically thick smoke and dust. To avoid such filtering, v2 algorithm uses AI > 4.5 for the initial identification of absorbing smoke. This AI is generated internally, while the official UVAI EPIC product is reported by the EPIC aerosol algorithm [Marshak et al., 2018; Ahn et al., in review]. While generally robust at moderate-to-high values AI > 4.5–6, AI is often low for the weakly absorbing smoke, e.g., from the Boreal forest fires or peat fires (e.g., Eck et al., 2009, 2019) with AI~1–2 where it cannot be used for reliable separation from clouds. AI can also take high values over some bright surfaces or over clouds, in particular at high sun/view zenith angles.
To overcome these issues, we developed a separate, more generic test for smoke detection. It relies on understanding that due to progressively increasing multiple scattering toward UV, aerosol absorption reduces atmospheric reflectance much stronger at 340 nm compared to 443 nm. Thus, we make three independent retrievals of AOD443 with the weakly absorbing background aerosol model using observed reflectance at 443 nm (), 388 nm (), and 340 nm (). The surface reflectance at each wavelength, required for AOD retrieval, is evaluated from 680 nm using MAIAC spectral ratios (SRC) (section Outline of MAIAC Algorithm). Note that AOD is always reported at the Blue band (443 nm, lower index) while the upper index indicates the wavelength used to derive AOD443 from the measurements. Spectrally increasing absorption caused by aerosol manifests in the ratios / and / notably below 1, while over non-absorbing clouds they are close to 1. Analysis of different smoke events shows that threshold 0.8 for both ratios detects the majority of smoke events even when the AI is low, and ensures robust separation from clouds, thus complementing the AI-based smoke detection.
We apply the described approach for dust detection in the dust regions as well, but only when the surface is sufficiently dark, or when the associated parameter AOD uncertainty (for definition, see Lyapustin et al., 2018) is low (<0.1). Because most world deserts are bright and a single-band, single-angle AOD retrieval is unstable, we use the test AI > 3.5 as the baseline for dust detection.
Below, we provide examples and AERONET validation analysis for the wildfire smoke and mineral dust based on processed EPIC 2018 data over North America and Sahara/Middle East regions, respectively.
Retrieval Examples From Epic
Biomass Burning
With an overall increase in the wildfires over the last decades, 2018 witnessed a number of significant fire events, with the largest in August on the West Coast and central USA and in September in Alaska. In the first case, the smoke was injected above the boundary layer and was transported across the USA, reaching the East Coast.
Figure 2 shows an example of consecutive EPIC RGB images and MAIAC products from flexible retrievals, including AOD443, k0, b, and resulting single scattering albedo SSA443. One can see that except extreme angles, the results are rather stable with variation of the viewing geometry. At high zenith angles, parameters b and k0 often change in the opposite directions, b decreases and k0 increases while keeping SSA443 approximately constant. The reported absorption values are typical and agree well with the range of values reported in AERONET climatological analyses (e.g., Giles et al., 2012).
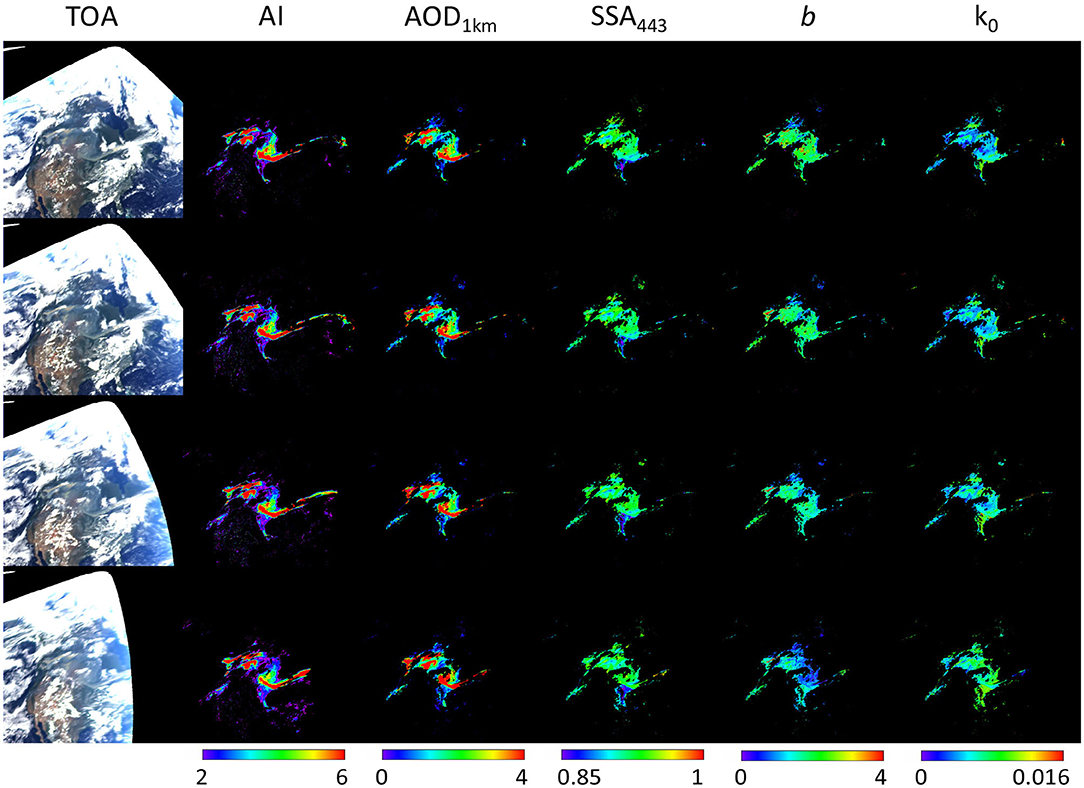
Figure 2. Illustration of flexible MAIAC EPIC retrievals for August 17, 2018. Shown are EPIC TOA RGB image, Aerosol Index (AI), and results of flexible retrievals for smoke at 1 km effective height.
The result in Figure 2 corresponds to aerosol in the boundary layer (mean height of 1 km). Figure 3 compares retrievals for smoke at 1 km and 4 km. The difference is significant. The higher single scattering albedo at 4 km reflects an obvious fact that it takes less absorption for the elevated smoke (with less Rayleigh atmosphere above) to create the same reduction in the reflected intensity as compared to the smoke near the surface. This is supported by a notably lower baseline absorption k0 for smoke at 4 km, which is a proxy of spectrally neutral component of absorption, or a black carbon (e.g., Schuster et al., 2016). The observed spectral dependence (SAE, or b) for the elevated smoke may be smaller, similar, or larger than that at 1 km. For instance, b4km is lower for August 13, but it is slightly higher for the August 16 and 17. Analysis of all large wildfires in 2018 observed by EPIC shows that SSA443 is always higher for the lofted smoke, inverse being true for k0.
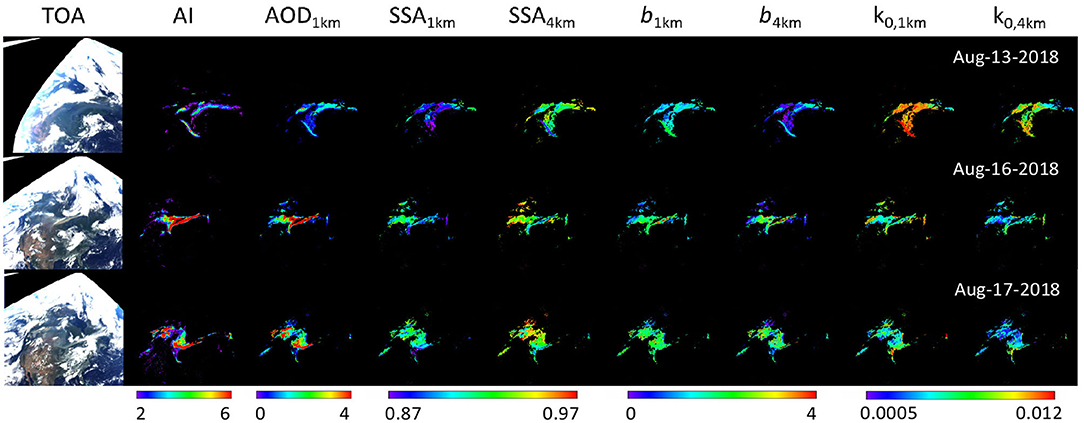
Figure 3. Effect of assumed smoke height (1 or 4 km) on retrieved spectral absorption.
Thus, the role of aerosol height cannot be overestimated: not only it changes the total aerosol absorption, by up to 0.02–0.05 for SSA443 in cases considered, but it also affects the interpretation of the results regarding aerosol chemical composition. For instance, the lower baseline absorption (k0) and higher SAE for the lofted smoke would be interpreted as less black and more brown carbon as compared to the boundary layer smoke.
Mineral Dust
North Africa is a very active part of the world responsible for about 60% of the total global dust emissions (Tanaka and Chiba, 2006). We selected three episodes shown in Figure 4. The top row shows dust originating from the Bodélé depression on January 1, 2018. Bodélé represents a dry salt lake bed with very low hematite content or lack of thereof. It shows a very low absorption (b, k0) and high SSA443~0.94–0.96. It is interesting to note that a separate dust source is located right south of Bodélé with dust blown at a small angle (~15°) to the main Bodélé source in the South-West direction. The visual analysis shows that it has a yellow color in contrast to Bodélé's white dust. Figure 4 shows that EPIC resolves higher absorption and lower single scattering albedo (by ~0.03–0.05) from this satellite source. Such difference in absorption is distinct in the plume right at the source as well as in the “dust cloud” several hundred km downwind, which was emitted earlier.
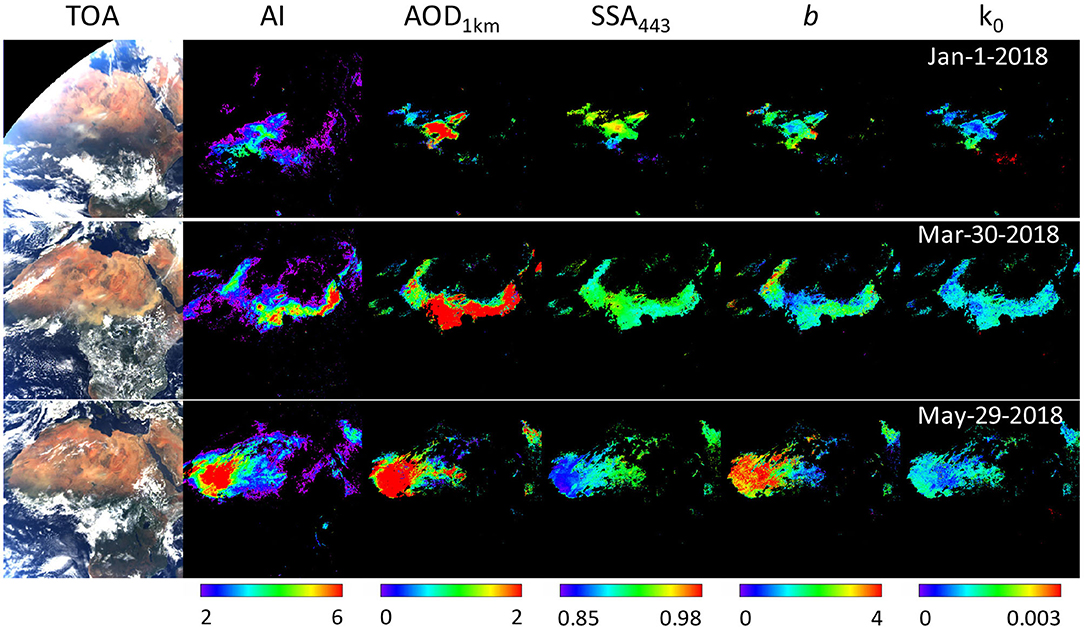
Figure 4. Examples of flexible MAIAC EPIC retrievals for three different dust storms over Sahara region. The columns are the same as in Figure 2.
The middle Figure 4 shows a dust mega-storm from Arabian Peninsula covering nearly the entire Sahel region for several days in late March–early May 2018. It features a moderate absorption typical for most dust emission sources in Sahara. On March 30 shown here, the Bodélé source was also active. Mixing of the respective white dust with the main dust plume shows as a well-resolved reduction in the total absorption, especially visible in lower SAE (b) and increased SSA.
Finally, the bottom row shows results for May 29 for the dust storm in West Africa. It is characterized by the highest spectral dependence of absorption (SAE) and lowest SSA in the Blue-UV range, indicating enhanced hematite content.
These examples show that v2 MAIAC EPIC provides a new information on spectral absorption with sufficient resolution and accuracy to differentiate sources and a change of absorption properties from the downwind mixing.
Aeronet Validation
To assess accuracy of the flexible retrieval algorithm, we performed validation analysis using AERONET version 3 (Giles et al., 2019) level 1.5 AOD data with improved cloud screening. MAIAC EPIC AOD443 data were limited to cosines of view and solar zenith angles above 0.45. We used average MAIAC AOD collocated in space and time within ± 20 km and ± 30 min for all AERONET stations, respectively.
Biomass Burning
AOD validation for North America in 2018 shows correlation coefficient R > 0.8 for most sites. An exception is the Rocky Mountain region and south-west USA, where the low background AOD and its low variability, exacerbated by a bright surface, result in lower R-values and a bias of ~0.15. This is typical for all sensors, including MODIS [e.g., see validation study by Jethva et al. (2019)]. It should be mentioned that such conditions are particularly challenging for EPIC making observations 4–16° from the retro-scattering direction where surface brightness is near its peak due to reduced shadowing. Figure 5 shows the summary validation of MAIAC EPIC AOD443 over North America in 2018. The first scatterplot (a) shows validation of standard MAIAC AOD (background model) for all 114 sites. The middle plot shows the same result for the reduced number of 103 sites where 11 sites with bright surface were excluded (Bakersfield; Goldstone; KeyBiscayne; Neon_ONAQ; Railroad Valley; Sandila_NM_PSEL; TableMountain_CA; Tucson; UACJ_UNAM_ORS; White_Sands_HELSTF; Yuma). Located in arid regions with generally low cloudiness, these 11 sites contribute disproportionate ~19% of the total matching points. With this exclusion, plot (b) shows improvement in all parameters of validation statistics. Finally, the last plot (c) shows validation of MAIAC AOD from flexible retrievals for 103 sites. In this case, we used results for the 1 km aerosol height, which are not generally representative. Nevertheless, flexible retrievals generally correct the low bias at high AOD values and raise R to 0.85 from 0.81.
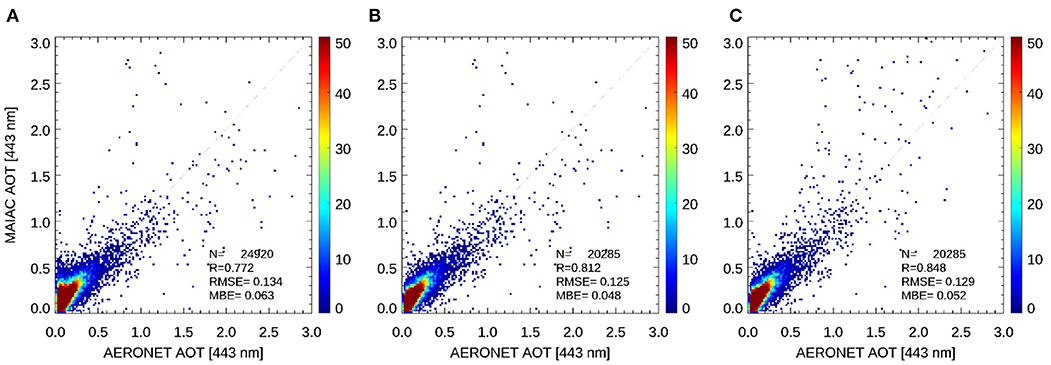
Figure 5. AERONET validation of MAIAC EPIC AOD443 over North America in 2018. (A) standard MAIAC AOD (background model) for all 114 sites; (B) is equivalent to (A) but for 103 sites with 11 bright sites excluded; (C) MAIAC AOD from flexible retrievals for 103 sites.
Validation of the single scattering albedo is shown in Figures 6, 7 for 17 AERONET/NEON sites with more or less significant statistics of at least 5 points. To enhance matchups, we extended the spatio-temporal range to ± 30 km and ± 3 h, and require at least 50% valid MAIAC retrievals in the spatial window. The results are shown in two groups, for aerosol at 1 km (Figure 6) and 4 km (Figure 7). Except Rexburg_Idaho and Waskesiu representing the boundary-layer aerosol, all other sites show a much better agreement with AERONET at 4 km, thus representing lofted smoke. While most sites indicate a general agreement with AERONET within stated uncertainty of ± 0.03, several sites, such as Missoula, Table_Mountain, Neon_Cvalla, Waskesiu (at 1 km) show a meaningful correlation.
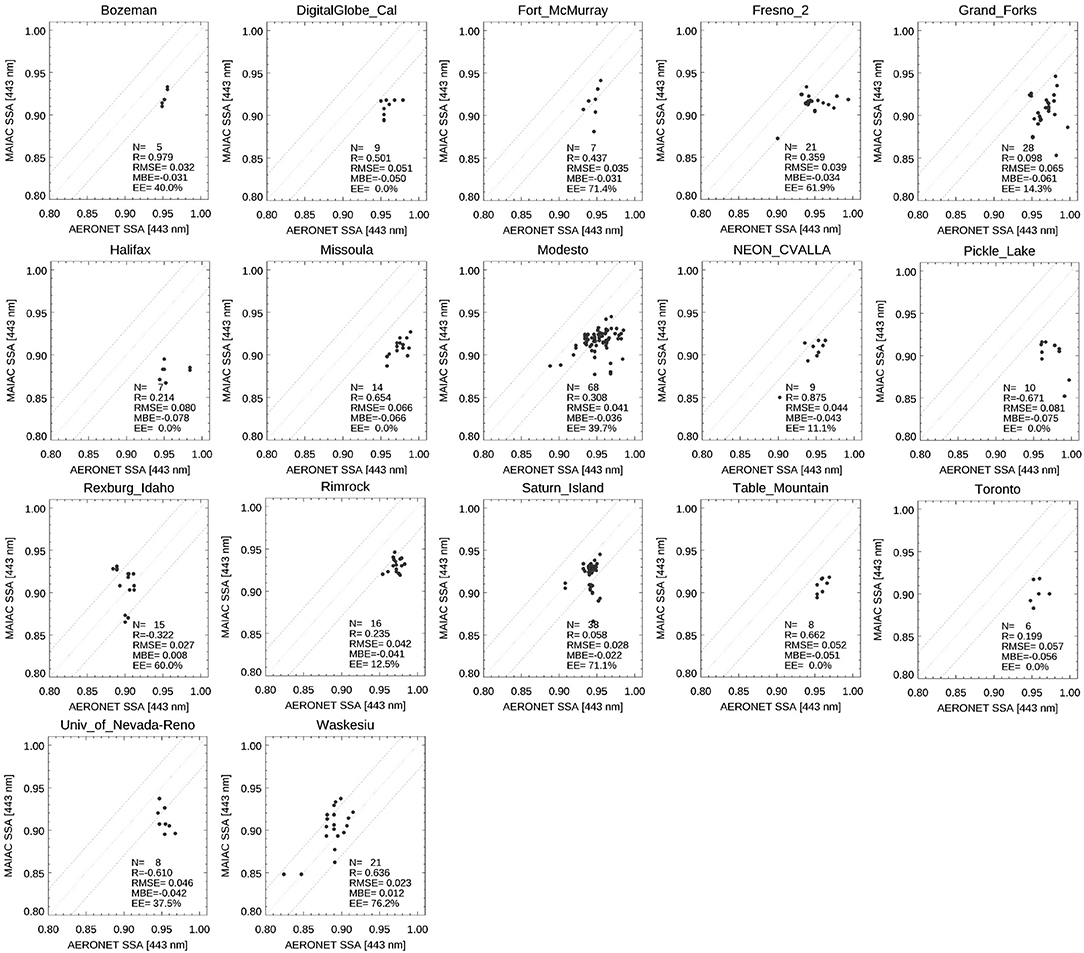
Figure 6. Site-level AERONET validation of MAIAC EPIC SSA443 over North America in 2018 for the effective aerosol height of 1 km.
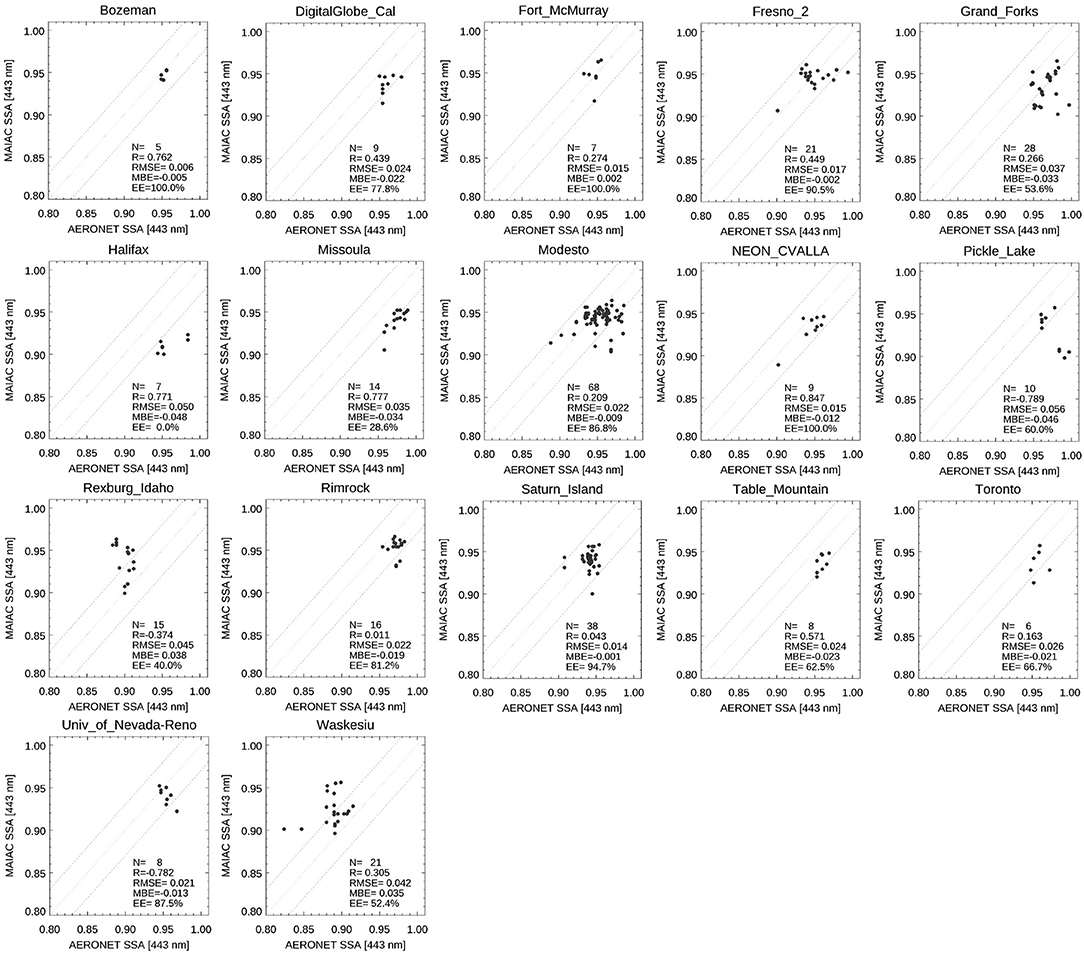
Figure 7. The same as Figure 6 but for the effective aerosol height of 4 km.
A summary validation (Figure 8), representing points with AOD443 > 0.6, once again confirms that for the most part, the smoke was lofted. 73.6% of results at 4 km fall within the expected error (EE) of ± 0.03.
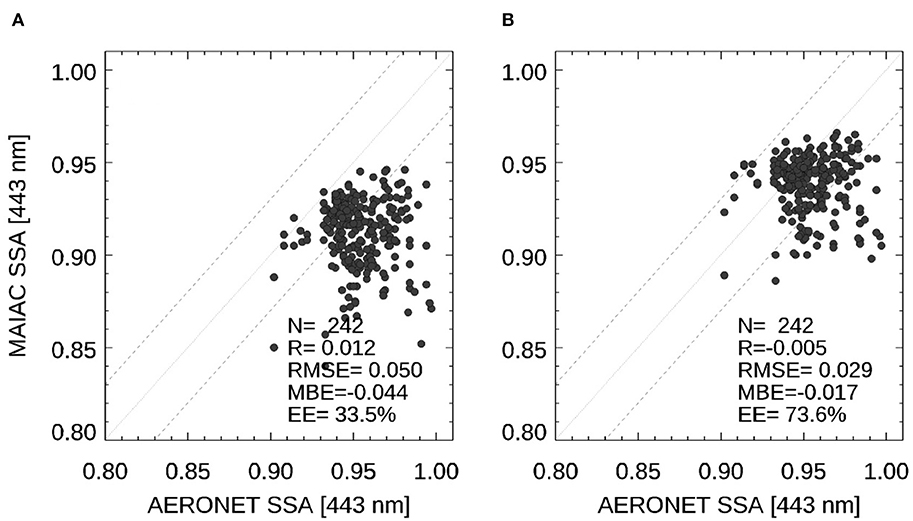
Figure 8. A summary AERONET validation of MAIAC EPIC SSA443 over North America in 2018 for the effective aerosol height of 1 km (A) and 4 km (B).
Mineral Dust
Validation of SSA443 over desert dust sites from North Africa and partly, the Middle East, is shown in Figure 9. The collocation criteria were similar to the smoke case but with AERONET AOD0.44 > 0.4. Contrary to the analysis for smoke, the dust sites show a significantly better correlation with AERONET. More than half of 17 sites show a good correlation, whereas a good general agreement within EE is seen for the majority of sites. Among exceptions are Ilorin representing mixture of dust and biomass burning, to some extent, Mongu which has mostly biomass burning aerosol with some dust contribution, and Cairo_EMA_2, where EPIC may have an issue of unresolved sub-pixel water contribution combined with a few AERONET values anomalously low for the pure dust. As v2 MAIAC has dust at 1 km effective height only, the good overall agreement with AERONET indicates that the boundary layer dust provides a significant contribution to the measured TOA radiance, complementing that from the elevated dust layers playing an important role in the dust transport across Atlantic. We plan to optimize reporting layers for smoke and dust in the next version of algorithm based on extended EPIC data analysis.
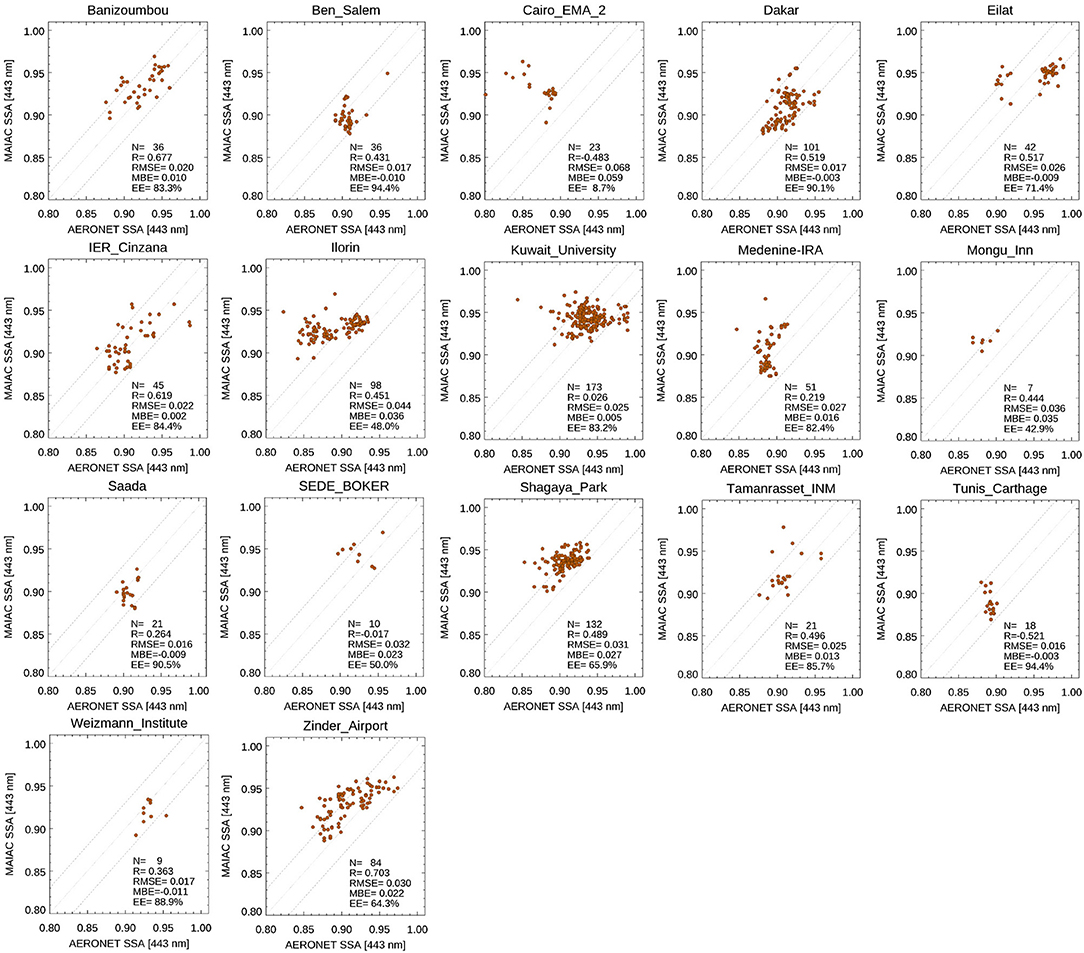
Figure 9. Site-level AERONET validation of MAIAC EPIC SSA443 over north Africa/Middle East in 2018.
Figure 10 displays the summary results. Plots (a) and (b) show comparison with AERONET SSA using thresholds AERONET AOD0.44 > 0.4 and > 0.6, respectively. Regarding SSA, Jethva et al. (2014) suggested using the term “comparison” rather than validation “because both inversion techniques involve assumptions.” Using higher AERONET AOD cutoff filters a number of low outliers in AERONET retrievals. This becomes obvious when we exclude 2 sites with a poorer agreement, Cairo_EMA_2 and Ilorin. The resulting plot (c) shows an excellent agreement for SSA443 with R = 0.62, rmse = 0.021, negligible bias, and EE = 85%.
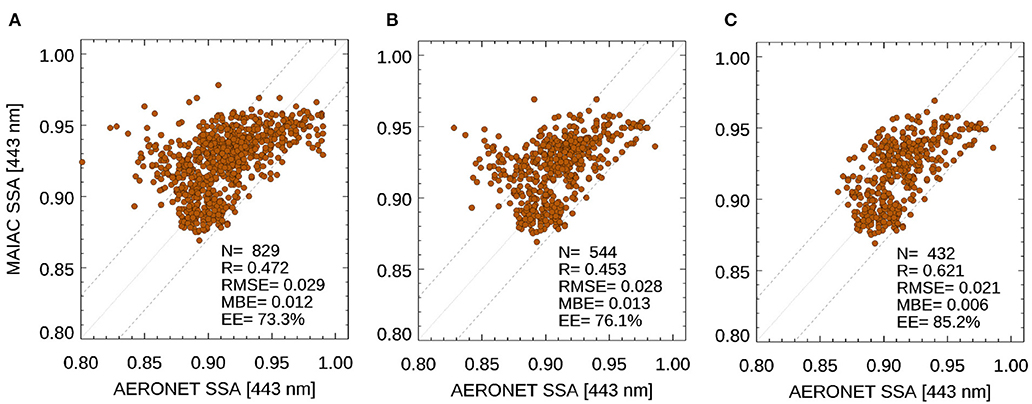
Figure 10. A summary AERONET validation of MAIAC EPIC SSA443 over North Africa/Middle East in 2018. Plots (A,B) represent all 17 sites with AERONET AOD440 > 0.4 and > 0.6, respectively. Plot (C) is equivalent to (B) but for 15 sites, with Cairo_ENM_2 and Ilorin excluded.
Spectral Dependence of Absorption
Unlike the described validation of SSA443, a direct comparison of spectral dependence of absorption against AERONET is associated with much higher uncertainties. First, an assessment of the AERONET inversion products (Dubovik and King, 2000) states a 30–50% accuracy for the imaginary refractive index at AOD440 > 0.4, with uncertainties being higher for the coarse mode dust and optically thin aerosols. Second, v2 MAIAC derives SAE (parameter b) from the 340–443 nm range, whereas AERONET provides refractive index for the non-overlapping range of wavelength range 440–1,020 nm. Both, Extinction and Absorption Angstrom Exponents depend on selected pair of wavelengths or spectral interval of evaluation (e.g., Moosmüller and Chakrabarty, 2011), which should hold true for the imaginary refractive index as well. Besides all that, the curvature of absorption is higher in the UV for hematite (e.g., Sokolik and Toon, 1999; Wagner et al., 2012) and in particular for brown carbon (e.g., Kirchstetter et al., 2004; Chen and Bond, 2010) as compared to the vis-NIR spectral range. For this reason, we provide only a qualitative assessment of spectral dependence of v2 MAIAC EPIC vs. AERONET. Following the idea of Figure 4 in Schuster et al. (2016), Figure 11 shows k440-k670 plots for the North America smoke (top) and north Africa dust (bottom). For AERONET, parameter b was computed with Eq. (1) from the imaginary refractive index at 440 and 670 nm. In turn, EPIC values k440, k670 were computed from (k0, b). In both cases, the value of parameter b+1 is indicated by the color.
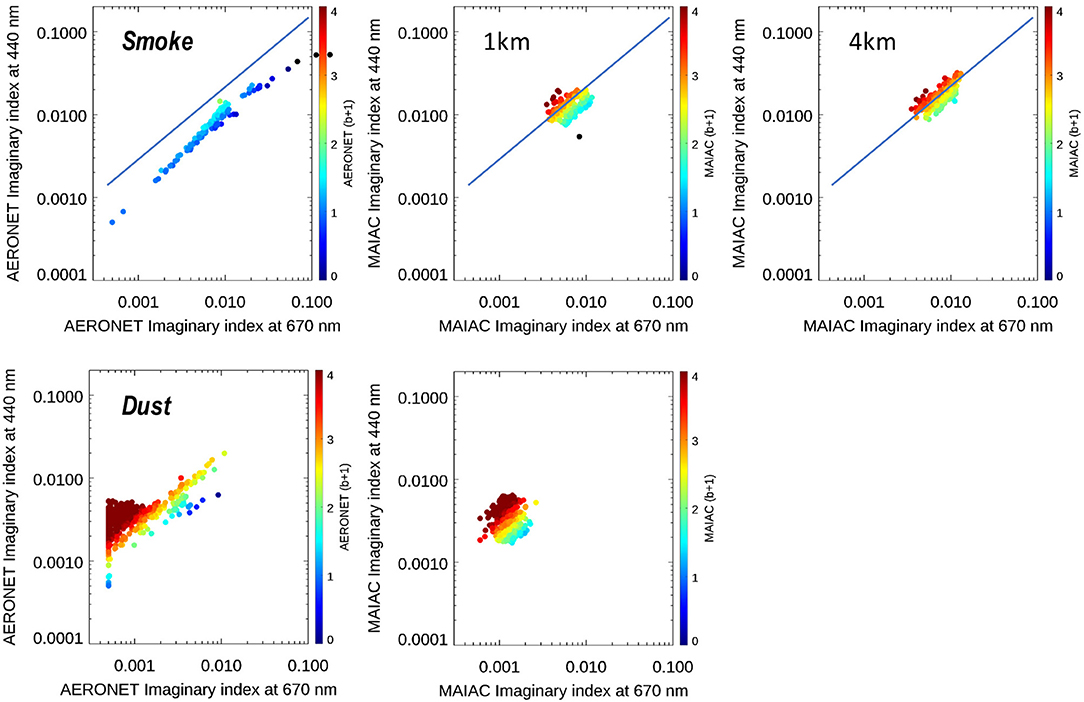
Figure 11. A comparison of spectral dependence of absorption between AERONET and v2 MAIAC EPIC for smoke (top) and dust (bottom). The AERONET results correspond to AOD440 > 0.4. The blue line on top, approximating MAIAC EPIC results, serves to illustrate the difference in absorption at 440 nm with AERONET.
For both smoke and dust cases, EPIC data occupy a much smaller range of values. The results for dust are quite similar with AERONET. EPIC shows more variation at 440 nm in comparison to 670 nm than AERONET. On the other hand, AERONET has data at k670 > 0.003 where EPIC has none. According to Schuster et al. (2016), data points with high absorption in the Red-NIR should represent a mixture of dust with carbonaceous aerosols.
In case of smoke, EPIC displays much higher values of SAE (b) than AERONET, which is expected from the properties of brown carbon where EPIC' sensitivity to parameter b mainly comes from the two UV channels. This is indicated by both the color of points and the offset along the y-axis, as illustrated by the blue line. Despite these expected differences, this comparison indicates an overall robust performance of the developed algorithm.
Conclusions
This paper described a new algorithm for joint retrievals of the aerosol optical depth and spectral absorption from EPIC observations in the UV–Vis spectral range. The retrievals were illustrated on examples of the wildfire smoke events in North America, and dust storms over the greater Sahara region in 2018. An initial validation of SSA443 over these regions shows a good agreement with AERONET data, generally within the uncertainty of the AERONET product of ± 0.03. For many AERONET sites, in particular those influenced by dust, retrieved SSA shows a good site-level regression with R~0.5–0.8. This fact is important given that it is easier to demonstrate good correlation at continental or global scales due to a significant variation of aerosol types and absorbing properties. Despite the near-backscattering EPIC view geometry, generally unfavorable for aerosol retrievals because of high surface reflectance, EPIC's high rate of observations providing good surface characterization and a well-selected combination of UV-Vis bands allowed us to achieve an overall good quality of aerosol characterization. The global validation of v2 MAIAC flexible retrieval products based on full EPIC record and comparison with other satellite datasets will be provided elsewhere.
The described flexible inversion algorithm is part of the v2 MAIAC EPIC algorithm. The v2 re-processing of the full EPIC's record 2015–2020 has recently been completed and the products will be released soon. The v2 dataset includes AOD443, SSA443, SAE (or b), and k0 as part of MAIAC's standard output provided in HDF5 format. The results of flexible retrievals are reported for two aerosol effective heights (1, 4 km) for smoke and for one height (1 km) for dust. The full list of MAIAC EPIC products is given in the companion paper of this Special Issue.
Current work points to two directions of high practical value, which we plan to explore in our future research. The first one is a simultaneous evaluation of the aerosol layer height from EPIC's A and B oxygen absorption bands. Although Xu et al. (2017) developed aerosol height algorithm over the dark ocean and Xu et al. (2019) demonstrated a possibility of the wildfire smoke height retrieval over the vegetated land, systematic and reliable aerosol layer height retrieval from EPIC over land remains challenging. Such retrieval requires a good cloud detection and knowledge of both surface reflectance and optical properties of aerosol. This information is currently provided by the v2 MAIAC algorithm. The second direction relates to the aerosol speciation of the airborne smoke and dust, based on spectral absorption. Such information would complement current datasets from the AERONET inversion products (Schuster et al., 2016) and from POLDER/PARASOL measurement record processed by the GRASP Components algorithm (Li et al., 2019).
Data Availability Statement
The raw data supporting the conclusions of this article will be made available by the authors, without undue reservation.
Author Contributions
AL and OT developed the concept. AL developed the algorithm. SK generated the look-up tables. YW performed MAIAC v2 re-processing of the EPIC data. SG conducted validation analysis. AL, OT, HJ, SG, and AM wrote the paper. All authors contributed to the article and approved the submitted version.
Funding
The work of AL, SG, YW, and SK was funded by the NASA DSCOVR program (manager Dr. R. Eckman) and in part by the NASA PACE program (19-PACESAT19-0039).
Conflict of Interest
The authors declare that the research was conducted in the absence of any commercial or financial relationships that could be construed as a potential conflict of interest.
Acknowledgments
We are grateful to the AERONET team for providing validation data and to the NASA Center for Climate Simulations providing resources for the EPIC data processing.
References
Ahn, C., Torres, O., and Jethva, H. (2014). Assessment of OMI near-UV aerosol optical depth over land. J. Geophys. Res. Atmos. 119, 2457–2473. doi: 10.1002/2013JD020188
Bond, T. C. (2001). Spectral dependence of visible light absorption by carbonaceous particles emitted from coal combustion. Geophys. Res. Let. 28, 4075–4078. doi: 10.1029/2001GL013652
Boucher, O., Randall, D., Artaxo, P., Bretherton, C., Feingold, G., Forster, P., et al. (2013). “Clouds and aerosols,” in: Climate Change 2013: The Physical Science Basis. Contribution of Working Group I to the Fifth Assessment Report of the Intergovernmental Panel on Climate Change. eds T. F. Stocker, D. Qin, G.-K. Plattner, M. Tignor, S. K. Allen, J. Boschung (Cambridge; New York, NY: Cambridge University Press).
Chen, C., Dubovik, O., Fuertes, D., Litvinov, P., Lapyonok, T., Lopatin, A., et al. (2020). Validation of GRASP algorithm product from POLDER/PARASOL data and assessment of multi-angular polarimetry potential for aerosol monitoring. Earth Syst. Sci. Data 12, 3573–3620. doi: 10.5194/essd-12-3573-2020
Chen, Y., and Bond, T. C. (2010). Light absorption by organic carbon from wood combustion. Atmos. Chem. Phys. 10, 1773–1787. doi: 10.5194/acp-10-1773-2010
Diner, D. J., Boland, S. W., Brauer, M., Bruegge, C., Burke, K. A., Chipman, R., et al. (2018). Advances in multiangle satellite remote sensing of speciated airborne particulate matter and association with adverse health effects: from MISR to MAIA. J. Appl. Remote Sens. 12:042603. doi: 10.1117/1.JRS.12.042603
Dubovik, O., Herman, M., Holdak, A., Lapyonok, T., Tanré, D., Deuzé, J. L., et al. (2011). Statistically optimized inversion algorithm for enhanced retrieval of aerosol properties from spectral multi-angle polarimetric satellite observations. Atmos. Meas. Tech. 4, 975–1018. doi: 10.5194/amt-4-975-2011
Dubovik, O., Holben, B., Eck, T. F., Smirnov, A., Kaufman, Y. J., King, M. D., et al. (2002). Variability of absorption and optical properties of key aerosol types observed in worldwide locations. J. Atmos. Sci. 59, 590–608. doi: 10.1175/1520-0469(2002)059<0590:VOAAOP>2.0.CO;2
Dubovik, O., and King, M. D. (2000). A flexible inversion algorithm for retrieval of aerosol optical properties from Sun and sky radiance measurements. J. Geophys. Res. Atmos. 105, 20673–20696. doi: 10.1029/2000JD900282
Dubovik, O., Sinyuk, A., Lapyonok, T., Holben, B. N., Mishchenko, M., Yang, P., et al. (2006). Application of spheroid models to account for aerosol particle nonsphericity in remote sensing of desert dust. J. Geophys. Res. Atmos. 111:D11208. doi: 10.1029/2005JD006619
Eck, T. F., Holben, B. N., Giles, D. M., Slutsker, I., Sinyuk, A., Schafer, J. S., et al. (2019). AERONET remotely sensed measurements and retrievals of biomass burning aerosol optical properties during the 2015 Indonesian burning season. J. Geophys. Res. Atmos. 124, 4722–4740. doi: 10.1029/2018JD030182
Eck, T. F., Holben, B. N., Reid, J., Sinyuk, A., Hyer, E. J., O'Neill, N. T., et al. (2009). Optical properties of boreal region biomass burning aerosols in central Alaska and seasonal variation of aerosol optical depth at an Arctic coastal site. J. Geophys. Res. Atmos. 114:D11201. doi: 10.1029/2008JD010870
Emde, C., Barlakas, V., Cornet, C., Evans, F., Korkin, S., Ota, Y., et al. (2015). IPRT polarized radiative transfer model intercomparison project – phase A. J. Quant. Spectrosc. Rad. Transfer 164, 8–36. doi: 10.1016/j.jqsrt.2015.05.007
Fougnie, B., Chimot, J., Vázquez-Navarro, M., Marbach, T., and Bojkov, B. (2020). Aerosol retrieval from space – how does geometry of acquisition impact our ability to characterize aerosol properties. J. Quant. Spectrosc. Rad. Transfer 256:107304. doi: 10.1016/j.jqsrt.2020.107304
Giles, D. M., Holben, B. N., Eck, T. F., Sinyuk, A., Smirnov, A., Slutsker, I., et al. (2012). Analysis of AERONET aerosol absorption properties and characteristics from representative aerosol source locations. J. Geophys. Res. Atmos. 117:17203. doi: 10.1029/2012JD018127
Giles, D. M., Sinyuk, A., Sorokin, M. G., Schafer, J. S., Smirnov, A., Slutsker, I., et al. (2019). Advancements in the Aerosol Robotic Network (AERONET) Version 3 database – automated near-real-time quality control algorithm with improved cloud screening for Sun photometer aerosol optical depth (AOD) measurements. Atmos. Meas. Tech. 12, 169–209. doi: 10.5194/amt-12-169-2019
Herman, J. R., Bhartia, P. K., Torres, O., Hsu, C., Seftor, C., and Celarier, E. (1997). Global distribution of UV-absorbing aerosols from Nimbus 7/TOMS data. J. Geophys. Res. Atmos. 102, 16911–16922. doi: 10.1029/96JD03680
Holben, B. N., Eck, T. F., Slutsker, I., Tanr,é, D, Buis, J. P., Setzer, A., et al. (1998). AERONET - A federated instrument network and data archive for aerosol characterization. Rem. Sens. Environ. 66, 1–16. doi: 10.1016/S0034-4257(98)00031-5
IPCC: Climate Change (2013). “The physical science basis,” Contribution of Working Group I to the Fifth Assessment Report of the Intergovernmental Panel on Climate Change. eds T. F. Stocker, D. Qin, G. K. Plattner, M. Tignor, S. K. Allen, J. Boschung (Cambridge; New York, NY: Cambridge University Press).
Jethva, H., and Torres, O. (2011). Satellite-based evidence of wavelength-dependent aerosol absorption in biomass burning smoke inferred from ozone monitoring instrument. Atmos. Chem. Phys. 11, 10541–10551. doi: 10.5194/acp-11-10541-2011
Jethva, H., Torres, O., and Ahn, C. (2014). Global assessment of OMI aerosol single-scattering albedo using ground-based AERONET inversion. J. Geophys. Res. Atmos. 119, 9020–9040. doi: 10.1002/2014JD021672
Jethva, H., Torres, O., and Ahn, C. (2018). A 12-year long global record of optical depth of absorbing aerosols above the clouds derived from the OMI/OMACA algorithm. Atmos. Meas. Tech. 11, 5837–5864. doi: 10.5194/amt-11-5837-2018
Jethva, H., Torres, O., and Yoshida, Y. (2019). Accuracy assessment of MODIS land aerosol optical thickness algorithms using AERONET measurements over North America. Atmos. Meas. Tech. 12, 4291–4307. doi: 10.5194/amt-12-4291-2019
Kahn, R. A., and Gaitley, B. J. (2015). An analysis of global aerosol type as retrieved by MISR. J. Geophys. Res. Atmos. 120, 4248–4281. doi: 10.1002/2015JD023322
Kahn, R. A., Gaitley, B. J., Garay, M. J., Diner, D. J., Eck, T. F., Smirnov, A., et al. (2010). Multiangle imaging spectroradiometer global aerosol product assessment by comparison with the aerosol robotic network. J. Geophys. Res. Atmos. 115:D23. doi: 10.1029/2010JD014601
Kim, J., Jeong, U., Ahn, M.-H., Kim, J. H., Park, R. J., Lee, H., et al. (2020). New era of air quality monitoring from space: Geostationary Environment Monitoring Spectrometer (GEMS). Bull. Am. Meteorol. Soc. 101, E1–E22. doi: 10.1175/BAMS-D-18-0013.1
Kirchstetter, T., Novakov, T., and Hobbs, P. (2004). Evidence that spectral dependence of light absorption by aerosols is affected by organic carbon. J. Geophys. Res. Atmos. 109:D21208. doi: 10.1029/2004JD004999
Korkin, S., and Lyapustin, A. (2019). Matrix exponential in C/C++ version of vector radiative transfer code IPOL. J. Quant. Spectrosc. Radiat. Transfer 227, 106–110. doi: 10.1016/j.jqsrt.2019.02.009
Li, L., Che, H., Derimian, Y., Dubovik, O., Schuster, G. L., Chen, C., et al. (2020b). Retrievals of fine mode light-absorbing carbonaceous aerosols from POLDER/PARASOL observations over East and South Asia. Remote Sensing Environ. 247:111913. doi: 10.1016/j.rse.2020.111913
Li, L., Dubovik, O., Derimian, Y., Schuster, G. L., Lapyonok, T., Litvinov, P., et al. (2019). Retrieval of aerosol components directly from satellite and ground-based measurements. Atmos. Chem. Phys. 19, 13409–13443. doi: 10.5194/acp-19-13409-2019
Li, L., Mahowald, N. M., Miller, R. L., Pérez García-Pando, C., Klose, M., Hamilton, D. S., et al. (2020a). Quantifying the range of the dust direct radiative effect due to source mineralogy uncertainty. Atmos. Chem. Phys. Discuss. doi: 10.5194/acp-2020-547
Lyapustin, A., and Knyazikhin, Y. (2002). Green's function method in the radiative transfer problem. II: spatially heterogeneous anisotropic surface. Appl. Optics. 41, 5600–5606. doi: 10.1364/AO.41.005600
Lyapustin, A., Wang, Y., Korkin, S., and Huang, D. (2018). MODIS collection 6 MAIAC algorithm. Atmos. Meas. Tech. 11, 5741–5765. doi: 10.5194/amt-11-5741-2018
Lyapustin, A. I. (2005). Radiative transfer code SHARM for atmospheric and terrestrial applications. Appl. Optics. 44, 7764–7772. doi: 10.1364/AO.44.007764
Marquardt, D. R. (1963). An algorithm for the least-squares estimation of nonlinear parameters. SIAM J. Appl. Math. 11, 431–441. doi: 10.1137/0111030
Marshak, A., Herman, J., Szabo, A., Blank, K., Carn, S., Cede, A., et al. (2018). Earth observations from DSCOVR/EPIC instrument. Bull. Amer. Meteor. Soc. 99, 1829–1850. doi: 10.1175/BAMS-D-17-0223.1
Moosmüller, H., and Chakrabarty, R. K. (2011). Technical note: simple analytical relationships between Ångström coefficients of aerosol extinction, scattering, absorption, and single scattering albedo. Atmos. Chem. Phys. 11, 10677–10680. doi: 10.5194/acp-11-10677-2011
Remer, L. A., Knobelspiesse, K., Zhai, P.-W., Xu, F., Kalashnikova, O. V., Chowdhary, J., et al. (2019). Retrieving aerosol characteristics from the PACE mission, part 2: multi-angle and polarimetry. Front. Earth Sci. 7:94. doi: 10.3389/fenvs.2019.00094
Samset, B., Sand, M., Smith, C. J., Bauer, S. E., Forster, P. M., Fuglestvedt, J. S., et al. (2018). Climate impacts from a removal of anthropogenic aerosol emissions. Geophys. Res. Lett. 45, 1020–1029. doi: 10.1002/2017GL076079
Schafer, J., Eck, T., Holben, B., Thornhill, K., Anderson, B., Sinyuk, A., et al. (2014). Intercomparison of aerosol single-scattering albedo derived from AERONET surface radiometers and LARGE in situ aircraft profiles during the 2011 DRAGON-MD and DISCOVER-AQ experiments. J. Geophys. Res. Atmos. 119, 7439–7452. doi: 10.1002/2013JD021166
Schuster, G., Dubovik, O., and Arola, A. (2016). Remote sensing of soot carbon – part 1: distinguishing different absorbing aerosol species. Atmos. Chem. Phys. 16, 1565–1585. doi: 10.5194/acp-16-1565-2016
Sokolik, I., and Toon, O. (1999). Incorporation of mineralogical composition into models of the radiative properties of mineral aerosol from UV to IR wavelengths. J. Geophys. Res. Atmos. 104, 9423–9444. doi: 10.1029/1998JD200048
Tanaka, T. Y., and Chiba, M. (2006). A numerical study of the contributions of dust source regions to the global dust budget. Glob. Planet. Change 52, 88–104. doi: 10.1016/j.gloplacha.2006.02.002
Thorsen, T. J., Winker, D. M., and Ferrare, R. A. (2020). Uncertainty in observational estimates of the aerosol direct radiative effect and forcing. J. Climate. 34, 195–214. doi: 10.1175/JCLI-D-19-1009.1
Torres, O., Ahn, C., and Chen, Z. (2013). Improvements to the OMI near-UV aerosol algorithm using A-train CALIOP and AIRS observations. Atmos. Meas. Tech. 6, 3257–3270. doi: 10.5194/amt-6-3257-2013
Torres, O., Bhartia, P. K., Herman, J. R., Ahmad, Z., and Gleason, J. (1998). Derivation of aerosol properties from satellite measurements of backscattered ultraviolet radiation: theoretical basis. J. Geophys. Res. Atmos. 103, 17099–17110. doi: 10.1029/98JD00900
Torres, O., Bhartia, P. K., Jethva, H., and Ahn, C. (2018). Impact of the ozone monitoring instrument row anomaly on the long-term record of aerosol products. Atmos. Meas. Tech. 11, 2701–2715. doi: 10.5194/amt-11-2701-2018
Torres, O., Herman, J. R., Bhartia, P. K., and Sinyuk, A. (2002). Aerosol properties from EP-TOMS near UV observations. Adv. Space Res. 29, 1771–1780. doi: 10.1016/S0273-1177(02)00109-6
Torres, O., Jethva, H., Ahn, C., Jaross, G., and Loyola, D. G. (2020). TROPOMI aerosol products: evaluation and observations of synoptic-scale carbonaceous aerosol plumes during 2018–2020. Atmos. Meas. Tech. 13, 6789–6806. doi: 10.5194/amt-13-6789-2020
Torres, O., Jethva, H., and Bhartia, P. K. (2012). Retrieval of aerosol optical depth above clouds from OMI observations: sensitivity analysis and case studies. Journal. Atm. Sci. 69, 1037–1053. doi: 10.1175/JAS-D-11-0130.1
Torres, O., Tanskanen, A., Veihelman, B., Ahn, C., Braak, R., Bhartia, P. K., et al. (2007). Aerosols and surface UV products from OMI Observations: an overview. J. Geophys. Res. Atmos. 112:D24S47. doi: 10.1029/2007JD008809
Wagner, R., Ajtai, T., Kandler, K., Lieke, K., Linke, C., Müller, T., et al. (2012). Complex refractive indices of Saharan dust samples at visible and near UV wavelengths: a laboratory study. Atmos. Chem. Phys. 12, 2491–2512. doi: 10.5194/acp-12-2491-2012
Xu, X., Wang, J., Wang, Y., Zeng, J., Torres, O., Reid, J. S., et al. (2019). Detecting layer height of smoke aerosols over vegetated land and water surfaces via oxygen absorption bands: hourly results from EPIC/DSCOVR in deep space. Atmos. Meas. Tech. 12, 3269–3288. doi: 10.5194/amt-12-3269-2019
Keywords: EPIC, MAIAC, aerosol, biomass burning, mineral dust, spectral absorption
Citation: Lyapustin A, Go S, Korkin S, Wang Y, Torres O, Jethva H and Marshak A (2021) Retrievals of Aerosol Optical Depth and Spectral Absorption From DSCOVR EPIC. Front. Remote Sens. 2:645794. doi: 10.3389/frsen.2021.645794
Received: 24 December 2020; Accepted: 01 March 2021;
Published: 30 March 2021.
Edited by:
Yingying Ma, Wuhan University, ChinaReviewed by:
Lei Li, Chinese Academy of Meteorological Sciences, ChinaXiangao Xia, Institute of Atmospheric Physics (CAS), China
Weizhen Hou, Chinese Academy of Sciences, China
Copyright © 2021 Lyapustin, Go, Korkin, Wang, Torres, Jethva and Marshak. This is an open-access article distributed under the terms of the Creative Commons Attribution License (CC BY). The use, distribution or reproduction in other forums is permitted, provided the original author(s) and the copyright owner(s) are credited and that the original publication in this journal is cited, in accordance with accepted academic practice. No use, distribution or reproduction is permitted which does not comply with these terms.
*Correspondence: Alexei Lyapustin, YWxleGVpLmkubHlhcHVzdGluQG5hc2EuZ292