 Jan Pisek1*
 Stefan K. Arndt2
 Angela Erb3
 Elise Pendall4
 Crystal Schaaf3Timothy J. Wardlaw5William Woodgate6,7
 Yuri Knyazikhin8
- 1Tartu Observatory, University of Tartu, Tartu, Estonia
- 2School of Ecosystem and Forest Science, University of Melbourne, Richmond, VIC, Australia
- 3School for the Environment, University of Massachusetts Boston, Boston, MA, United States
- 4Hawkesbury Institute for the Environment, Western Sydney University, Penrith, NSW, Australia
- 5School of Plant Science, University of Tasmania, Hobart, TAS, Australia
- 6School of Earth and Environmental Sciences, University of Queensland, Brisbane, QLD, Australia
- 7Land & Water, The Commonwealth Scientific and Industrial Research Organisation (CSIRO), Brisbane, QLD, Australia
- 8Earth and Environment Department, Boston University, Boston, MA, United States
Vegetation foliage clumping significantly alters the radiation environment and affects vegetation growth as well as water, carbon cycles. The clumping index (CI) is useful in ecological and meteorological models because it provides new structural information in addition to the effective leaf area index. Previously generated CI maps using a diverse set of Earth Observation multi-angle datasets across a wide range of scales have all relied on the single approach of using the normalized difference hotspot and darkspot (NDHD) method. We explore an alternative approach to estimate CI from space using the unique observing configuration of the Deep Space Climate Observatory Earth Polychromatic Imaging Camera (DSCOVR EPIC) and associated products at 10 km resolution. The performance was evaluated with in situ measurements in five sites of the Australian Terrestrial Ecosystem Research Network comprising a diverse range of canopy structure from short and sparse to dense and tall forest. The DSCOVR EPIC data can provide meaningful CI retrievals at the given spatial resolution. Independent but comparable CI retrievals obtained with a completely different sensor and new approach were encouraging for the general validity and compatibility of the foliage clumping information retrievals from space. We also assessed the spatial representativeness of the five TERN sites with respect to a particular point in time (field campaigns) for satellite retrieval validation. Our results improve our understanding of product uncertainty both in terms of the representativeness of the field data collected over the TERN sites and its relationship to Earth Observation data at different spatial resolutions.
Introduction
The clumping index (CI) quantifies the level of foliage grouping within distinct canopy structures relative to a random distribution (Nilson, 1971; Chen and Black, 1992). It provides best agreement between transmittance through clumped canopy and Beer's exponential transmission law (Nilson, 1971; Kuusk, 2018). CI equals unity with leaves completely randomly distributed. Canopy foliage is usually clumped into various sub-canopy structures such as crowns, branches, and twigs, thus clumping is defined as a situation where CI < 1. Regularly distributed foliage results in CI greater than unity. Clumping affects the interception and distribution of solar radiation within a canopy (Chen et al., 2003, 2005; Hill et al., 2011; Wei et al., 2019). In addition, the distribution of foliar nutrients and canopy evapotranspiration (ET) were found to be significantly influenced by CI (Thomas et al., 2011). Both ground and satellite ET estimates are greatly underestimated if CI is not considered (Chen et al., 2016). CI is also an important parameter for accurate canopy-level gross primary production (GPP) modeling (Ryu et al., 2011; Chen et al., 2012).
Global and regional scale CI maps have been generated from a diverse set of Earth Observation multi-angle datasets: POLarization and Directionality of the Earth's Reflectances (POLDER) data at ~6 km resolution (Chen et al., 2005); the Bidirectional Reflectance Distribution Function (BRDF) product from Moderate Resolution Imaging Spectroradiometer (MODIS) at 500 m resolution (He et al., 2012; Wei and Fang, 2016; Jiao et al., 2018), and Multi-angle Imaging SpectroRadiometer (MISR) data at 275 m resolution (Pisek et al., 2013).
All the products listed above share the common feature of estimating CI through a single approach—its empirical relationship with the normalized difference between the hotspot and darkspot (NDHD) (Chen et al., 2005; Leblanc et al., 2005a):
where A and B are coefficients determined by the linear regression, based on a set of model simulations made with the 4-Scale model in Chen et al. (2005). The coefficients vary with assumed crown shape and solar zenith angle [see Table 2 in Chen et al. (2005)]. The NDHD index is defined as:
where HS and DS mark the canopy reflectance at the hotspot and darkspot, respectively (Leblanc et al., 2001). The hotspot corresponds to the backscatter peak when the solar radiation and view directions coincide, leading to minimum shading in that view direction. The darkspot exists in the direction opposite to that of the hotspot, where the maximum shadow area can be seen leading to minimum reflectance.
This brief research report explores a new, alternative approach to NDHD how to estimate CI from Earth Observation data. The approach exploits unique observation data and products from a new satellite that is quite different from traditional polar-orbiting or geostationary satellites. The Deep Space Climate Observatory (DSCOVR) is a satellite positioned near the first Lagrange point (or L1). It offers the continuous observations of full, sunlit side of the Earth. The DSCOVR satellite carries on-board a spectroradiometer—the Earth Polychromatic Imaging Camera (EPIC). EPIC can provide spectral images of the entire sunlit face of the Earth with 10 narrow channels (from 317 to 780 nm) (Marshak et al., 2018) every 1–2 h in summer and winter, respectively.
The CI retrievals with DSCOVR/EPIC product data are validated in this study using available in situ measurements obtained with digital hemispherical photography (DHP), carried over select sites belonging to the Australian Terrestrial Ecosystem Research Network (TERN; Lowe et al., 2016) comprising a diverse range of canopy structure from short and sparse to dense and tall forest.
Method
DSCOVR EPIC Vegetation Earth System Data Record (VESDR) Product
The DSCOVR EPIC version 1 Vegetation Earth System Data Record (VESDR) provides Leaf Area Index (LAI) as well as diurnal courses of Sunlit Leaf Area Index (SLAI), Normalized Difference Vegetation Index (NDVI), Fraction of incident Photosynthetically Active Radiation (FPAR) absorbed by the vegetation and Directional Area Scattering Function (DASF). The product at 10 km sinusoidal grid with 65–110 min temporal frequency is generated from the upstream DSCOVR EPIC L2 MAIAC surface reflectance product (Lyapustin et al., 2018). With the exception of LAI, all VESDR parameters vary with the sun-sensor geometry. The VESDR files also include Solar Zenith Angle (SZA), Solar Azimuthal Angle (SAA), View Zenith (VZA), and Azimuthal (VAA) angles at the same temporal and spatial resolutions. A quality assessment variable (QA_VESDR) is also provided. For this analysis, only the EPIC observations with best quality flags (QA_VESDR = 0) were used for the CI retrieval. It is noted that the DSCOVR EPIC VESDR product is currently released at a provisional quality level. The EPIC level 2 VESDR product and accompanying documentation are available from the NASA Langley Atmospheric Science Data Center (https://asdc.larc.nasa.gov/project/DSCOVR). The VESDR product data were downloaded through NASA's Open-source Project for a Network Data Access Protocol (OPeNDAP; https://opendap.larc.nasa.gov/opendap/).
Foliage Clumping Retrieval With DSCOVR EPIC Data
Available DSCOVR/EPIC VESDR products of sunlit leaf area index (SLAI) and leaf area index (LAI) allow to estimate sunlit fraction of leaf area (Knyazikhin et al., 2017):
CI provides best agreement between directional uncollated transmittance through clumped canopy, t0(θ), and Beer's exponential transmission law, exp(−τ), which is applicable for completely randomly distributed leaves. Here
where G is the geometry factor as a function of viewing direction θ. We approximate SF based on Beer's law (Warren Wilson, 1967, Yang et al., 2017), i.e.,
Using SF from Equation (3) allows us to solve Equation (5) for τ. Finally, CI can be then estimated from Equation (4) as:
The geometry factor may not be always precisely known, but G approaches a value of 0.5 around 57 degrees irrespective of orientation of canopy elements (Ross, 1981; Jupp et al., 2009; Woodgate et al., 2015). We adopt the G value of 0.5 in the CI retrieval while using VESDR products collected with the suitable sun-sensor geometry—observations with view zenith angle around 57 degrees—as an input.
Study Sites and Data for Validation
Australia's Terrestrial Ecosystem Research Network (TERN) is a distributed research infrastructure providing intensive monitoring of the physical and chemical environmental and biological components of ecosystems (Karan et al., 2016). In-situ measurements of CI at different heights using towers were collected at five of the TERN's SuperSites, which together offer a diverse range of canopy structure from short and sparse to dense and tall forest. Their locations and vegetation characteristics are summarized in Table 1.
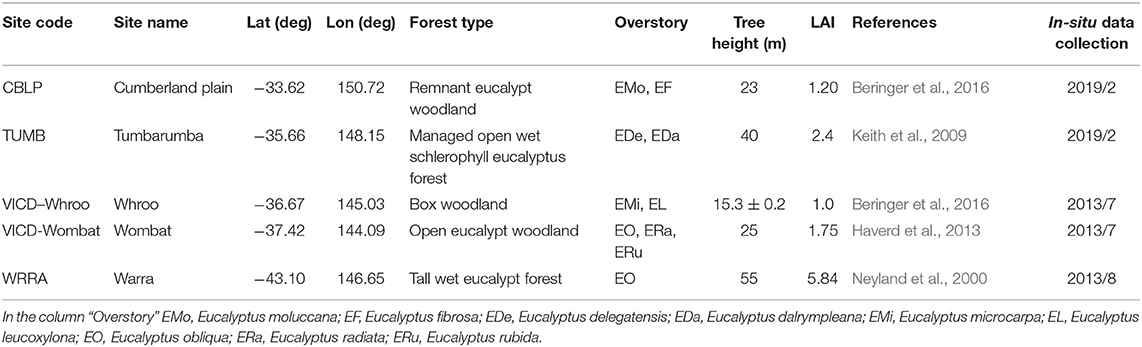
Table 1. Study site characteristics.
The Cumberland Plain flux station is located in a dry sclerophyll forest in the Hawkesbury Valley in central New South Wales (site coordinates: 33.6152S, 150.7236E). The canopy is dominated by Eucalyptus moluccana and Eucalyptus fibrosa, which host an expanding population of mistletoe. Average canopy height is 23 m. The Wombat forest research site (37.42S, 144.09E) is located in the Wombat State Forest, Victoria, SE Australia. The site is a secondary regrowth Eucalypt forest that was last harvested in 1980. Dominant tree species are Messmate Stringybark (Eucalyptus obliqua), Narrow Leaf Peppermint (Eucalyptus radiata) and Candlebark (Eucalyptus rubida) with an average canopy height of 25 m. The understory consists mainly of patchy grasses. The second dry sclerophyll site at Whroo (36.67 S, 145.03E) in Victoria, Australia is box ironbark woodland with lower tree height and canopy cover. The vegetation was dominated by two main Eucalypt species: Gray Box (Eucalyptus microcarpa) and Yellow Gum (Eucalyptus leucoxylon). The mean tree height at Whroo was 15.3 ± 0.2 m. The Tumbarumba flux station is located in the Bago State forest in south eastern New South Wales (35.6566S, 148.1517E). The forest is classified as wet sclerophyll, the dominant species is Eucalyptus delegatensis, and average tree height is 40 m. The Bago State Forest is adjacent to the south west slopes of southern New South Wales and the 48,400 ha of native forest have been managed for wood production for over 100 years. Warra Long Term Ecological Research (LTER) site (43.09S, 146.66E; Neyland et al., 2000) is located in SW Tasmania, Australia. It represented a tall E. obliqua wet forest with rainforest understory and a dense man-fern (Dicksonia antarctica) ground-layer. The forests around the Warra site had mature heights in excess of 55 m: the tallest E. obliqua within the LTER reaches a height of 90 m. Both Tumbarumba and Warra sites experienced bushfires in the last 2 years. Our site descriptions, in situ validation data, as well as the retrievals with DSCOVR EPIC data correspond to the pre-fire period.
The vertical profiles of CI (i.e., Cl for all vegetation above the given height) were obtained by climbing scaffolding/flux towers and taking leveled digital hemispherical photos (DHPs) along the climbed height. At each profile, usually several series of DHPs were acquired using a Nikon CoolPix 4500 digital camera with a Nikon FC-E8 fisheye lens under diffuse illumination conditions, following the protocol of Zhang et al. (2005). No leaves were present directly above the camera to obscure its field of view. The towers were masked from the photos before the analysis. The reference DHPs were obtained above the top of the tree canopy. Gap fraction profiles were extracted from the blue channel at view zenith angle 57° with the DHP software (v4.5; Canada Center for Remote Sensing, Ottawa, Canada). Various methods exist to estimate CI (see Gonsamo and Pellikka, 2009; Woodgate et al., 2015; Chianucci et al., 2019). The method of Leblanc et al. (2005b) was previously shown to provide reliable clumping estimates in both simulated and real canopies (Pisek et al., 2011; Leblanc and Fournier, 2014; Woodgate et al., 2017; Yan et al., 2019):
where CICLX(θ) is CI determined with the method of Leblanc et al. (2005b), CICCk(θ) is the CI of segment k using the corrected Chen and Cihlar (1995) method by Leblanc (2002), Pk(θ) is the gap fraction of segment k, n is the total number of segments (segment size = 15°), is the mean gap fraction, and θ is the view zenith angle. The segment size was set to 15° as it produced the smallest error out of three segment sizes tested (15, 45, and 90°) in the mimicked virtual Eucalypt stand by Woodgate et al. (2017). Equation (7) is used to estimate CI at each climbed height.
Spatial Representativeness Assessment
An analysis of the surface heterogeneity representativeness (Román et al., 2009; Wang et al., 2017) was used in this study to determine whether direct “point-to-pixel” comparisons were appropriate for all validation sites. The method employs variograms calculated using surface albedos obtained using shortwave near nadir surface reflectances (0.25–5.0 um) generated from cloud free 30 m Landsat/Operational Land Imager (OLI) data (Román et al., 2009). To facilitate the 10 km subset, the Landsat imagery was resampled to 90 m spatial resolution. The OLI data were collected as close to the sampling date as possible. Where valid imagery was not available within a reasonable window of the sampling date, imagery from the corresponding season of a different year was used. As such, the analysis was done to illustrate the representativeness of the tower site with respect to a particular point in time.
When a measurement site is spatially representative, the overall variability between the internal (1.0 km) components (here Landsat pixel reflectances) of the measurement site and its adjacent landscape corresponding to the satellite pixel footprint should be similar in magnitude. The variogram estimator (variance of the albedo values obtained from the resampled 90 m spatial resolution Landsat imagery at the given distance) usually levels off upon reaching the variogram range indicating the distance where they are no longer spatially correlated (e.g., Figure 1B, points). The site can be simply judged to be spatially representative with respect to the given footprint when the sill value (i.e., the ordinate value of the range at which the variogram levels off to an asymptote) is <5.0e-04 (Román et al., 2009; Wang et al., 2017).
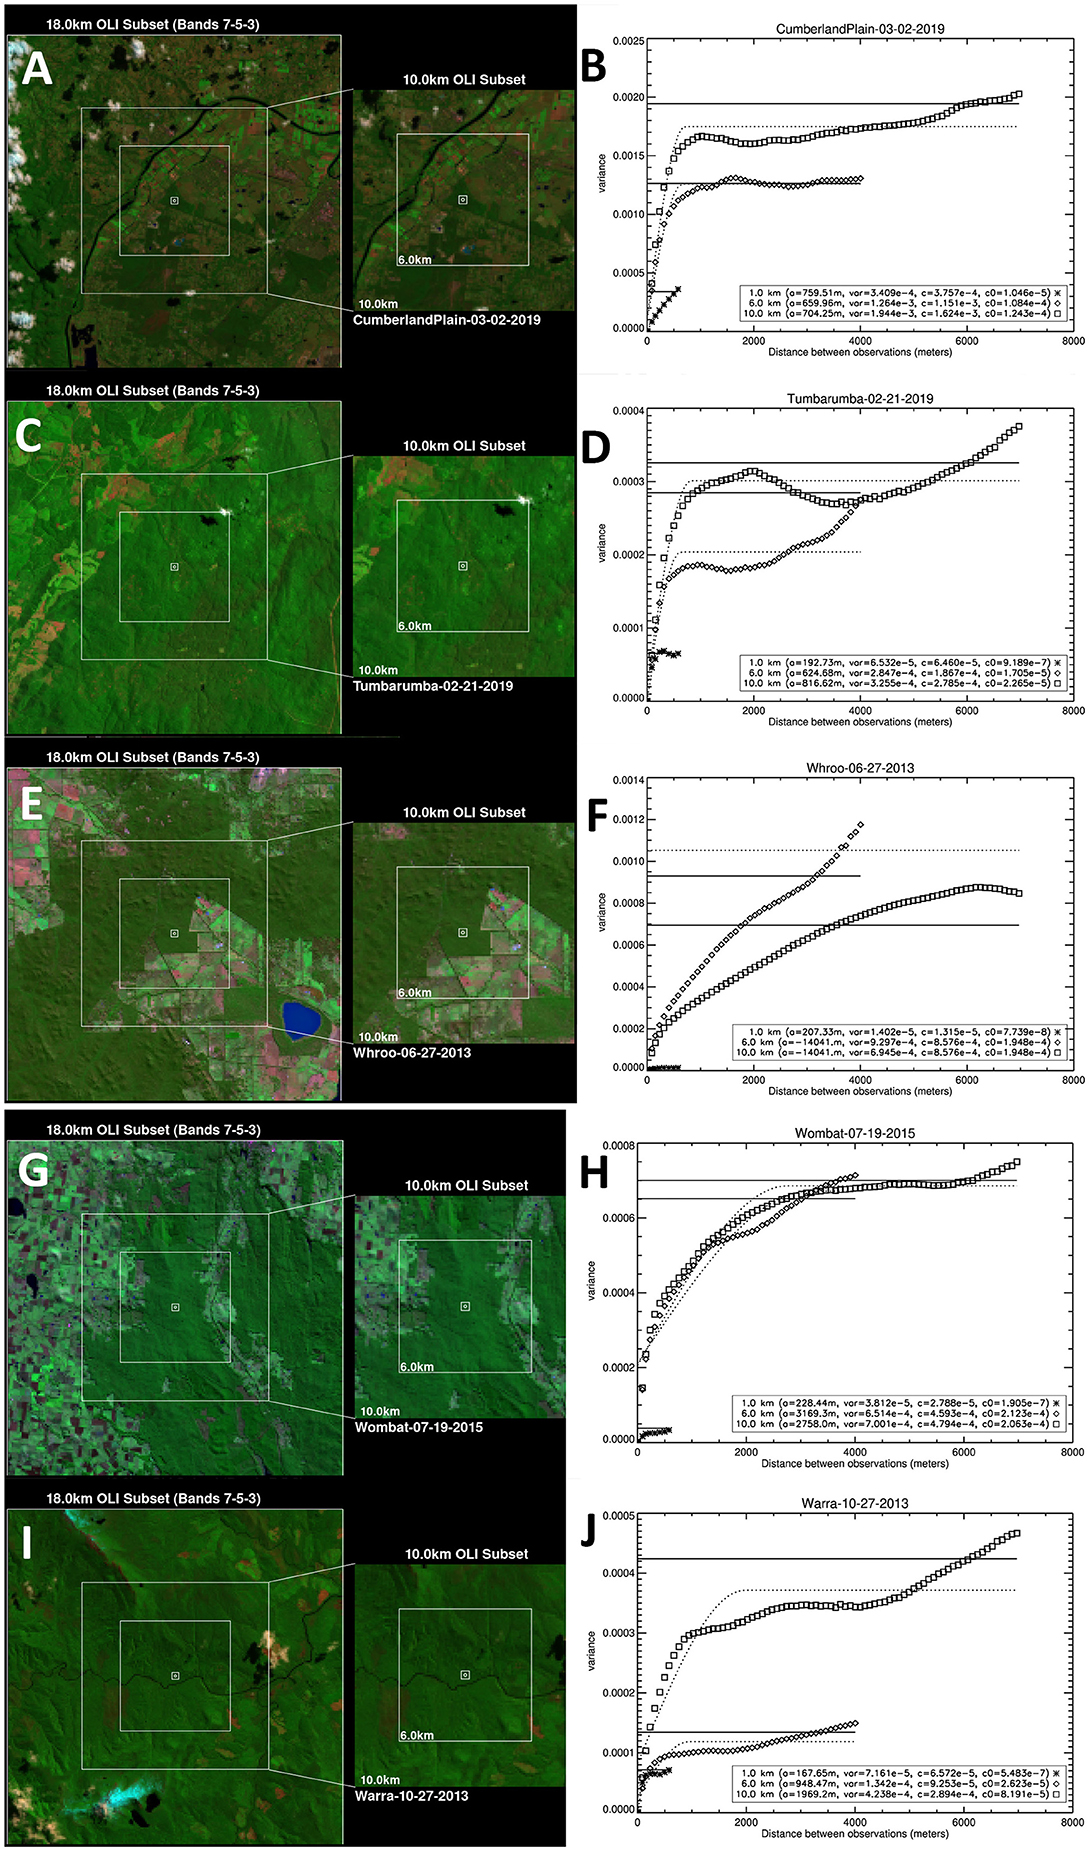
Figure 1. (A–J) Shortwave BRF composites centered at TERN sudy sites. Variogram estimators (points), spherical model results (dotted curves), and sample variances (solid straight lines) obtained over the sites with OLI subsets and spatial elements of 1, 6, and 10 km as a function of distance between observations. Variogram legend explanations: a–variogram range; var–sample variance; c–variogram sill; c0–nugget variance.
Results
The spatial representativeness was evaluated at three different footprint sizes: 1, 6, and 10 km (Figure 1). All five sites may be considered spatially representative at the smallest 1 km pixel footprint around the time of in situ measurements, although the variogram curve did not reach clear asymptote at Cumberland Plain (Figure 1B). The spatial heterogeneity increased with the footprint for all sites (here indicated with an increase in sill value). Only two sites (Tumbarumba and Warra) preserved the spatial representativeness all the way to the nominal pixel resolution of 10 km for the DSCOVR EPIC VESDR product (sill value < 5.0e-04).
The landscape heterogeneity within the DSCOVR EPIC VESDR product pixel resolution also manifested itself in the agreement with the in situ measured values of CI over the different sites. Good agreement between the EPIC CI-derived value and in situ measurements (i.e., EPIC CI retrievals intersecting with the vertical profiles collected with DHP) was observed over the most homogeneous sites, Tumbarumba (Figure 2B) and Warra (Figure 2E). The EPIC CI values did not show agreement with the vertical profiles of CI at Whroo (Figure 2C) and Wombat (Figure 2D). The EPIC CI value was found to intersect the range of CI variation with height at Cumberland Plain site (Figure 2A).
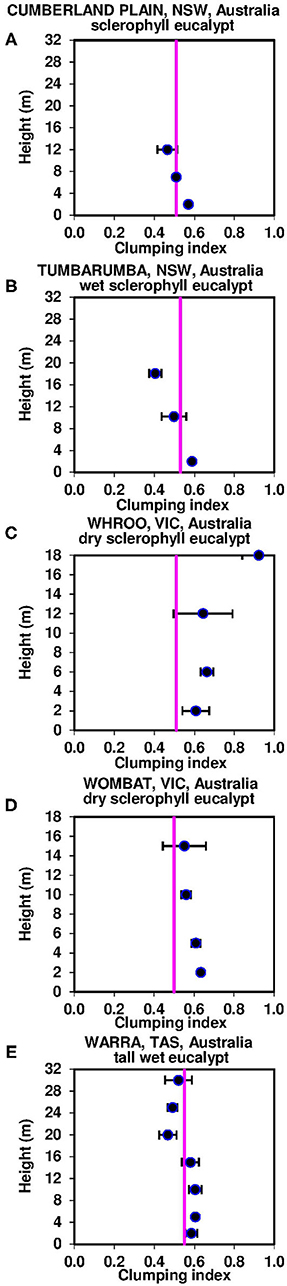
Figure 2. Vertical profiles of foliage clumping from in-situ measurements with ±1 standard deviation bars. (A) Cumberland Plain, (B) Tumbarumba, (C) Whroo, (D) Wombat, and (E) Warra. Clumping index values from DSCOVR EPIC data obtained around the same time of the year are marked with vertical purple line (For interpretation of the references to color in this figure legend, the reader is referred to the web version of this article).
Discussion
This study explored the potential of using an alternative approach, along with unique observations and products from the Earth Polychromatic Imaging Camera (EPIC) onboard the Deep Space Climate Observatory (DSCOVR) satellite, to estimate the clumping index (CI).
First, it must be acknowledged that our measurements are limited to single location (tower) and moment in time for a vertical profile at each site. Any factors that cause an increase in the variance of gap fraction (e.g., canopy type and size, density, disturbances) would imply that a higher number of samples is needed (Nilson et al., 2011). The relatively coarse nominal resolution of the EPIC sensor at 10 km makes the product validation with in situ data a particularly challenging exercise. Out of five TERN sites with available in situ CI measurements included in this study, only Tumbarumba and Warra may be deemed to be spatially representative of the relatively coarse EPIC nominal pixel footprint. It is encouraging that CI values obtained with EPIC data provided good agreement with the in situ measurements over these two sites (Figures 2B,E). It shall be noted that the spatial representativeness approach used in this study does not include land cover or vegetation type information. Many modeling studies using flux tower data will use classification layer and assess the various proportions of classes to determine whether a site is representative. Using Landsat OLI data and variograms as originally proposed by Román et al. (2009) and applied in this study may provide more detail and catch possible variation that may not be assessed with the land cover or vegetation type based evaluation. It shall be noted that our spatial representativeness evaluations may be valid only for the indicated moments in time. Although all five sites are classified as broadleaf evergreen vegetation dominated by Eucalypts, they may still experience seasonal dynamics of vegetation growth and decay (Duursma et al., 2016). The spatial representativeness of individual sites may change accordingly throughout seasons as well. Additionally, Tumbarumba and Warra sites experienced intensive bushfires in 2019 and 2020, which may have affected their current spatial representativeness as well. We recommend that future studies would follow our example and carry the spatial representativeness assessments to match the moment in time when the in situ measurements are collected.
The best agreement was usually not observed with the in situ measurements acquired close to the ground (h =2 m), but rather with those taken at a distance higher up in the canopy. Similar behavior was previously observed in case of CI estimates obtained with other EO sensors as well (Pisek et al., 2013, 2015), as satellite measurements respond primarily to the structural effects in upper levels of canopies (Pisek et al., 2015). This feature will be further exacerbated if the observations are made under oblique angles (Biriukova et al., 2020), like in our study. Ground measurements may be also biased by any lower vegetation/understory layers that would make the foliage distribution more random. Indeed there was an understory layer present at Tumbarumba and Warra when the in situ measurements were taken and the comparison with DSCOVR EPIC data was done (i.e., pre-2019/2020 fire period). Lower shrubs are also present around Cumberland Plain, another site where the EPIC CI retrievals intersected with the vertical profile of CI measured along the tower height (Figure 2A). This agreement might be purely coincidental and treated with caution, since the Cumberland Plain site was the least spatially representative site at the EPIC nominal resolution. The actual EPIC measurements used in this study may in fact come even from an area twice as large due to the large oblique angles around the hinge region (Delgado-Bonal et al., 2020). The two sites from Victoria, Whroo and Wombat, were found to be spatially non-representative at the EPIC nominal resolution. EPIC CI estimates correspondingly did not match with the available in situ measurements (Figures 2C,D), presumably because they did not capture the variability within the greater area within the EPIC pixel footprint. The general range of the in situ measured CI reported in this study agreed with values reported from other Eucalyptus-dominated sites in Australia (Macfarlane et al., 2007; Woodgate et al., 2017).
Our exploratory study is very pertinent to the on-going efforts to map and incorporate clumping information in ecosystem modeling at different scales (Ryu et al., 2012; He et al., 2018). It is very encouraging we showed it is possible to obtain such good quality results using a different approach and different EO data that are very much comparable to previous efforts of mapping CI from space (Chen et al., 2005; Pisek et al., 2013; Wei and Fang, 2016; Jiao et al., 2018). This general agreement between different retrieval strategies and input data sources is important for increasing overall confidence, justification, and general validity of clumping information retrieval from space in the future.
As a part of the analysis, we also assessed the spatial representativeness of the five TERN forest ecosystem sites for validation of satellite retrievals using a different approach and extending the analysis all the way to the spatial resolution of EPIC sensor compared to Griebel et al. (2020). Our results improve our understanding of product uncertainty both in terms of the representativeness of the field data collected over the TERN sites and its relationship to Earth Observation data at different spatial resolutions.
Data Availability Statement
The raw data supporting the conclusions of this article will be made available by the authors, without undue reservation.
Author Contributions
JP conceived the project, collected data, ran data analysis and interpretation, and led the writing of manuscript. AE carried the spatial representativeness analysis. WW helped with the field collection at Tumbarumba. SA, AE, EP, CS, TW, WW, and YK discussed the results and contributed to writing the manuscript. All authors contributed to the article and approved the submitted version.
Funding
This study was supported from Estonian Research Council Grants PUT232, PUT1355, and Mobilitas Pluss MOBERC11. WW was supported by an Australian Research Council DECRA Fellowship (DE190101182). The OzFlux and SuperSite network was supported by the National Collaborative Infrastructure Strategy (NCRIS) through the Terrestrial Ecosystem Research Network (TERN). YK was supported by the NASA DSCOVR project under grant 80NSSC19K0762.
Conflict of Interest
The authors declare that the research was conducted in the absence of any commercial or financial relationships that could be construed as a potential conflict of interest.
Acknowledgments
We thank two reviewers for the constructive comments that helped to improve the paper. We thank Marja-Liisa Plats for her assistance with figure editing.
References
Beringer, J., Hutley, L. B., McHugh, I., Arndt, S. K., Campbell, D., Cleugh, H. A., et al. (2016). An introduction to the Australian and New Zealand flux tower network – OzFlux. Biogeosciences 13, 5895–5916. doi: 10.5194/bg-13-5895-2016
Biriukova, K., Celesti, M., Evdokimov, A., Pacheco-Labrador, J., et al. (2020). Effects of varying solar-view geometry and canopy structure on solar-induced chlorophyll fluorescence and PRI. Int. J. Appl. Earth Observ. Geoinform. 89:102069. doi: 10.1016/j.jag.2020.102069
Chen, B., Liu, J., Chen, J. M., Croft, H., Gonsamo, A., He, L., et al. (2016). Assessment of foliage clumping effects on evapotranspiration estimates in forested ecosystems. Agric. For. Meteorol. 216, 82–92. doi: 10.1016/j.agrformet.2015.09.017
Chen, J., Menges, C., and Leblanc, S. (2005). Global mapping of foliage clumping index using multi-angular satellite data. Remote Sens. Environ. 97, 447–457. doi: 10.1016/j.rse.2005.05.003
Chen, J. M., and Black, T. A. (1992). Defining leaf area index for non-flat leaves. Plant Cell Environ. 15, 421–429. doi: 10.1111/j.1365-3040.1992.tb00992.x
Chen, J. M., and Cihlar, J. (1995). Plant canopy gap-size analysis theory for improving optical measurements of leaf-area index. Appl. Opt. 34, 6211–6222. doi: 10.1364/AO.34.006211
Chen, J. M., Ju, W. M., Cihlar, J., Price, D., Liu, J., Chen, W. J., et al. (2003). Spatial distribution of carbon sources and sinks in Canada's forests. Tellus Series B-Chem. Phys. Meteorol. 55, 622–641. doi: 10.3402/tellusb.v55i2.16711
Chen, J. M., Mo, G., Pisek, J., Liu, J., Deng, F., Ishizawa, M., et al. (2012). Effects of foliage clumping on the estimation of global terrestrial gross primary productivity. Global Biogeochem. Cycles 26:GB1019. doi: 10.1029/2010GB003996
Chianucci, F., Zou, J., Leng, P., Zhuang, Y., and Ferrara, C. (2019). A new method to estimate clumping index integrating gap fraction averaging with the analysis of gap size distribution. Can. J. For. Res. 49, 471–479. doi: 10.1139/cjfr-2018-0213
Delgado-Bonal, A., Marshak, A., Yang, Y., and Oreopoulos, L. (2020). Daytime variability of cloud fraction from DSCOVR/EPIC observations. J. Geophys. Res. Atmosph. 125:e2019JD031488. doi: 10.1029/2019JD031488
Duursma, R. A., Gimeno, T. E., Boer, M. M., Crous, K. Y., Tjoelker, M. G., and Ellsworth, D. S. (2016). Canopy leaf area of a mature evergreen Eucalyptus woodland does not respond to elevated atmospheric [CO2] but tracks water availability. Glob. Chang. Biol. 22, 1666–1676. doi: 10.1111/gcb.13151
Gonsamo, A., and Pellikka, P. (2009). The computation of foliage clumping index using hemispherical photography. Agricult. Forest Meteorol. 149, 1781–1787. doi: 10.1016/j.agrformet.2009.06.001
Griebel, A., Metzen, D., Pendall, E., Burba, G., and Metzger, S. (2020). Generating Spatially Robust Carbon Budgets From Flux Tower Observations. 47(3), e2019GL085942. doi: 10.1029/2019gl085942
Haverd, V., Raupach, M. R., Briggs, P. R., Canadell, J. G., Isaac, P., Pickett-Heaps, C., et al. (2013). Multiple observation types reduce uncertainty in Australia's terrestrial carbon and water cycles. Biogeosciences 10, 2011–2040. doi: 10.5194/bg-10-2011-2013
He, L., Chen, J. M., Gonsamo, A., Luo, X., Wang, R., Liu, Y., et al. (2018). Changes in the shadow: the shifting role of shaded leaves in global carbon and water cycles under climate change. Geophys. Res. Lett. 45, 5052–5061. doi: 10.1029/2018GL077560
He, L., Chen, J. M., Pisek, J., Schaaf, C. B., and Strahler, A. H. (2012). Global clumping index map derived from the MODIS BRDF product. Remote Sens. Environ. 119, 118–130. doi: 10.1016/j.rse.2011.12.008
Hill, M., Román, M. O., Schaaf, C. B., Hutley, L., and Brannstrom, C. (2011). Characterizing vegetation cover in global savannas with an annual foliage clumping index derived from the MODIS BRDF product. Remote Sens. Environ. 115, 2008–2024. doi: 10.1016/j.rse.2011.04.003
Jiao, Z., Dong, Y., Schaaf, C. B., Chen, J. M., Román, M., Wang, Z., et al. (2018). An algorithm for the retrieval of the clumping index (CI) from the MODIS BRDF product using an adjusted version of the kernel-driven BRDF model. Remote Sens. Environ. 209, 594–611. doi: 10.1016/j.rse.2018.02.041
Jupp, D. L. B., Culvenor, D. S., Lovell, J. L., Newnham, G. J., Strahler, A. H., and Woodcock, C. E. (2009). Estimating forest lai profiles and structural parameters using a ground-based laser called ‘echidna. Tree Physiol. 29, 171–181. doi: 10.1093/treephys/tpn022
Karan, M., Liddell, M., Prober, S. M., Arndt, S., Beringer, J., Boer, M., et al. (2016). The Australian supersite network: a continental, long-term terrestrial ecosystem observatory. Sci. Total Environ. 568, 1263–1274. doi: 10.1016/j.scitotenv.2016.05.170
Keith, H., Mackey, B. G., and Lindenmayer, D. B. (2009). Re-evaluation of forest biomass carbon stocks and lessons from the world's most carbon-dense forests. Proc. Natl. Acad. Sci. U.S.A. 106, 11635–11640. doi: 10.1073/pnas.0901970106
Knyazikhin, Y., Song, W., Yang, B., Park, T., and Myneni, R. B. (2017). DSCOVR EPIC Vegetation Earth System Data Record. Science Data Product Guide.
Kuusk, A. (2018). “Canopy radiative transfer modeling,” in Comprehensive Remote Sensing. V. 3, Terrestrial Ecosystems, ed S. Liang (Elsevier), 9–22. doi: 10.1016/B978-0-12-409548-9.10534-2
Leblanc, S. C., and Fournier, R. A. (2014). Hemispherical photography simulations with an architectural model to assess retrieval of leaf area index. Agricult. Forest Meteorol. 194, 64–76. doi: 10.1016/j.agrformet.2014.03.016
Leblanc, S. G. (2002). Correction to the plant canopy gap-size analysis theory used by the Tracing Radiation and Architecture of Canopies instrument. Appl. Opt. 41, 7667–7670. doi: 10.1364/AO.41.007667
Leblanc, S. G., Chen, J. M., Fernandes, R., Deering, D. W., and Conley, A. (2005b). Methodology comparison for canopy structure parameters extraction from digital hemispherical photography in boreal forests. Agric. For. Meteorol. 129, 187–207. doi: 10.1016/j.agrformet.2004.09.006
Leblanc, S. G., Chen, J. M., White, H. P., Latifovic, R., Lacaze, R., and Roujean, J. L. (2005a). Canada-wide foliage clumping index mapping from multiangular POLDER measurements. Can. J. Remote Sens. 31, 364–376. doi: 10.5589/m05-020
Leblanc, S. G., Chen, J. M., White, P. H., Cihlar, J., Roujean, J.-L., and Lacaze, R. (2001). “Mapping vegetation clumping index from directional satellite measurements,” in Proceedings of the Symposium on Physical Signatures and Measurements in Remote Sensing, Aussois (Toulouse: CNES), 450–459.
Lowe, A. J., Phinn, S., Thurgate, N., Liddell, M., Lindenmayer, D., Byrne, M., et al. (2016). Building a New Continental, Hierarchically-Scaled Ecosystem Monitoring Network in Australia. Terrestrial Ecosystem Research Infrastructures: Challenges, New Developments and Perspectives. Boca Raton, FL: CRC Press | Taylor & Francis Group.
Lyapustin, A., Wang, Y., Korkin, S., and Huang, D. (2018). MODIS Collection 6 MAIAC algorithm. Atmos. Meas. Tech. 11, 5741–5765. doi: 10.5194/amt-11-5741-2018
Macfarlane, C., Hoffman, M., Eamus, D., Kerp, N., Higginson, S., McMurtrie, R., et al. (2007). Estimation of leaf area index in eucalypt forest using digital photography. Agricult. Forest Meteorol. 143, 176–188. doi: 10.1016/j.agrformet.2006.10.013
Marshak, A., Herman, J., Adam, S., Karin, B., Carn, S., Cede, A., et al. (2018). Earth observations from DSCOVR EPIC instrument. Bull. Am. Meteorol. Soc. 99, 1829–1850. doi: 10.1175/BAMS-D-17-0223.1
Neyland, M. G., Brown, M. J., and Su, W. (2000). Assessing the representativeness of longterm ecological research sites: a case study at Warra in Tasmania. Aust. Forest. 63, 194–198. doi: 10.1080/00049158.2000.10674831
Nilson, T. (1971). A theoretical analysis of the frequency of gaps in plant stands. Agric. Meteorol. 8, 25–38. doi: 10.1016/0002-1571(71)90092-6
Nilson, T., Kuusk, A., Lang, M., Pisek, J., and Kodar, A. (2011). Simulation of statistical characteristics of gap distribution in forest stands. Agric. For. Meteorol. 151, 895–905. doi: 10.1016/j.agrformet.2011.02.009
Pisek, J., Govind, A., Arndt, S. K., Hocking, D., Wardlaw, T. J., Fang, H., et al. (2015). Intercomparison of clumping index estimates from POLDER, MODIS, and MISR satellite data over reference sites. ISPRS J. Photogram. Remote Sens. 101, 47–56. doi: 10.1016/j.isprsjprs.2014.11.004
Pisek, J., Lang, M., Nilson, T., Korhonen, L., and Karu, H. (2011). Comparison of methods for measuring gap size distribution and canopy nonrandomness at Järvselja RAMI (RAdiation transfer Model Intercomparison) test sites. Agric. For. Meteorol. 151, 365–377. doi: 10.1016/j.agrformet.2010.11.009
Pisek, J., Ryu, Y., Sprintsin, M., He, L., Oliphant, A. J., Korhonen, L., et al. (2013). Retrieving vegetation clumping index from Multiangle Imaging SpectroRadiometer (MISR) data at 275m resolution. Remote Sens. Environ. 138, 126–133. doi: 10.1016/j.rse.2013.07.014
Román, M. O., Schaaf, C. B., Woodcock, C. E., Strahler, A. H., Yang, X., Braswell, R. H., et al. (2009). The MODIS (CollectionV005) BRDF/albedo product: assessment of spatial representativeness overforested landscapes. Remote Sens. Environ. 113, 2476–2498. doi: 10.1016/j.rse.2009.07.009
Ross, J. (1981). The Radiation Regime and Architecture of Plant Stands. The Hague: Junk Publishers, 391. doi: 10.1007/978-94-009-8647-3
Ryu, Y., Baldocchi, D. D., Black, T. A., Detto, M., Law, B. E., Leuning, R., et al. (2012). On the temporal upscaling of evapotranspiration from instantaneous remote sensing measurements to 8-day mean daily-sums. Agricult. Forest Meteorol. 152, 212–222. doi: 10.1016/j.agrformet.2011.09.010
Ryu, Y., Baldocchi, D. D., Kobayashi, H., van Ingen, C., Li, J., Black, T. A., et al. (2011). Integration of MODIS land and atmosphere products with a coupled-process model to estimate gross primary productivity and evapotranspiration from 1 km to global scales. Global Biogeochem. Cycles 25. doi: 10.1029/2011GB004053
Thomas, V., Noland, T., Treitz, P., and McCaughey, J. H. (2011). Leaf area and clumping indices for a boreal mixed-wood forest: lidar, hyperspectral, and Landsat models. Int. J. Remote Sens. 32, 8271–8297. doi: 10.1080/01431161.2010.533211
Wang, Z., Schaaf, C. B., Sun, Q., Kim, J., Erb, A. M., Gao, F., et al. (2017). Monitoring land surface albedo and vegetation dynamics using high spatial and temporal resolution synthetic time series from Landsat and the MODIS BRDF/NBAR/albedo product. Int. J. Appl. Earth Obs. Geoinf. 59, 104–117. doi: 10.1016/j.jag.2017.03.008
Warren Wilson, J. (1967). Stand structure and light penetration. III. Sunlit foliage area. J. Appl. Ecol. 4, 159–165. doi: 10.2307/2401415
Wei, S., and Fang, H. (2016). Estimation of canopy clumping index from MISR and MODIS sensors using the normalized difference hotspot and darkspot (NDHD) method: the influence of BRDF models and solar zenith angle. Remote Sens. Environ. 187, 476–491. doi: 10.1016/j.rse.2016.10.039
Wei, S., Fang, H., Schaaf, C. B., He, L., and Chen, J. M. (2019). Global 500 m clumping index product derived from MODIS BRDF data (2001–2017). Remote Sens. Environ. 232:111296. doi: 10.1016/j.rse.2019.111296
Woodgate, W., Armston, J. D., Disney, M., Suarez, L., Jones, S. D., Hill, M. J., et al. (2017). Validating canopy clumping retrieval methods using hemispherical photography in a simulated Eucalypt forest. Agricult. Forest Meteorol. 247, 181–193. doi: 10.1016/j.agrformet.2017.07.027
Woodgate, W., Jones, S. D., Suarez, L., Hill, M. J., Armston, J. D., Wilkes, P., et al. (2015). Understanding the variability in ground-based methods for retrieving canopy openness, gap fraction, and leaf area index in diverse forest systems. Agric. For. Meteorol. 205, 83–95. doi: 10.1016/j.agrformet.2015.02.012
Yan, G., Hu, R., Luo, J., Weiss, M., Jiang, H., Mu, X., et al. (2019). Review of indirect optical measurements of leaf area index: recent advances, challenges, and perspectives. Agricult. Forest Meteorol. 265, 390–411. doi: 10.1016/j.agrformet.2018.11.033
Yang, B., Knyazikhin, Y., Mõttus, M., Rautiainen, M., Stenberg, P., Yan, L., et al. (2017). Estimation of leaf area index and its sunlit portion from DSCOVR EPIC data: Theoretical basis. Remote Sens. Environ, 198, 69–84. doi: 10.1016/j.rse.2017.05.033
Keywords: clumping index, DSCOVR EPIC, TERN, validation, spatial analysis
Citation: Pisek J, Arndt SK, Erb A, Pendall E, Schaaf C, Wardlaw TJ, Woodgate W and Knyazikhin Y (2021) Exploring the Potential of DSCOVR EPIC Data to Retrieve Clumping Index in Australian Terrestrial Ecosystem Research Network Observing Sites. Front. Remote Sens. 2:652436. doi: 10.3389/frsen.2021.652436
Received: 12 January 2021; Accepted: 22 February 2021;
Published: 16 March 2021.
Edited by:
Alexei Lyapustin, National Aeronautics and Space Administration, United StatesReviewed by:
Matti Mõttus, VTT Technical Research Centre of Finland Ltd., FinlandMiguel Roman, Universities Space Research Association (USRA), United States
Copyright © 2021 Pisek, Arndt, Erb, Pendall, Schaaf, Wardlaw, Woodgate and Knyazikhin. This is an open-access article distributed under the terms of the Creative Commons Attribution License (CC BY). The use, distribution or reproduction in other forums is permitted, provided the original author(s) and the copyright owner(s) are credited and that the original publication in this journal is cited, in accordance with accepted academic practice. No use, distribution or reproduction is permitted which does not comply with these terms.
*Correspondence: Jan Pisek, amFucGlzZWtAZ21haWwuY29t