 Viktor Kaufmann
 Andreas Kellerer-Pirklbauer2
 Gernot Seier
- 1Institute of Geodesy, Remote Sensing and Photogrammetry Working Group, Graz University of Technology, Graz, Austria
- 2Institute of Geography and Regional Science, Cascade – The Mountain Processes and Mountain Hazards Group, University of Graz, Graz, Austria
- 3Institute of Geography and Regional Science, Geospatial Technologies Working Group, University of Graz, Graz, Austria
Rock glaciers are creep phenomena of mountain permafrost. Speed-up has been observed on several rock glaciers in recent years and attributed to climate change. Although rare, related long-term studies are nevertheless essential to bring a climate perspective to creep velocity changes. In the present study, we focused on changes both in the surface creep velocity and volume of the Leibnitzkopf rock glacier (Hohe Tauern Range, Austria) in the period 1954–2020. We applied 3D change detection using aerial images of both conventional (12 epochs between 1954 and 2018) and unmanned aerial vehicle (UAV)-based aerial surveys (2 epochs, 2019 and 2020), and combined this with ground and air temperature data. Photogrammetric processing (structure-from-motion, multi-view stereo) of the multi-temporal dataset resulted in high-resolution digital orthophotos/DOPs (5–50 cm spatial resolution) and digital elevation models/DEMs (10–50 cm grid spacing). Georeferencing was supported by five externally triangulated images from 2018, bi-temporal aerial triangulation of the image data relying on stable ground around the rock glacier, measured ground control points (2019 and 2020), and measured camera locations (PPK-GNSS) of the UAV flight in 2020. 2D displacement vectors based on the multi-temporal DOPs and/or DEMs were computed. Accuracy analyses were conducted based on geodetic measurements (2010–2020) and airborne laser scanning data (2009). Our analyses show high multi-annual and inter-annual creep velocity variabilities with maxima between 12 (1974–1981) and 576 cm/year (2019–2020), always detected in the same area of the rock glacier where surface disintegration was first observed in 2018. Our volume change analyses of the entire landform for the period 1954–2018 do not indicate any significant changes. This suggests little permafrost ice melt and/or general low ice content of the rock glacier. Analyses of the temperature data reveal a close relationship between higher temperatures and rock glacier acceleration despite the high probability of low ice content. This suggests that hydrogeological changes play an important role in the rock glacier system. The paper concludes with a summary of technical improvements and recommendations useful for rock glacier monitoring and a general view on the kinematic state of the Leibnitzkopf rock glacier.
Introduction
Rock glaciers are periglacial landforms in high mountain environments indicating permafrost conditions during their initial formation and entire evolution. In this context, permafrost is defined as ground material (soil or rock unrelated to the amount of ice and organic material) that remains at or below 0°C for at least two consecutive years (van Everdingen, 1998). Active rock glaciers contain permafrost and creep slowly down-valley by force of gravity, commonly forming flow structures with ridges and furrows like lava flows as a result of compressional forces (Barsch, 1996).
During active times, annual movement rates may vary considerably in response to climate-driven forces. Active rock glaciers affected by permafrost degradation might turn firstly to inactive rock glaciers (no movement, widespread permafrost ice), secondly to pseudo-relict rock glaciers (no movement, sporadic permafrost ice), and then thirdly to relict rock glaciers (no movement, no ice) (Barsch, 1996; Kellerer-Pirklbauer, 2019). Where movement data is missing, inactive and active rock glaciers are both considered to be intact rock glaciers (Barsch, 1996). Superficially, relict and pseudo-relict rock glaciers appear indistinguishable, and only ground temperature data or geophysical data allow a differentiation. Therefore, it is normally that only relict and intact rock glaciers are distinguished in remote sensing-based rock glacier inventories.
Rock glacier surface movement depends on the overall vertical deformation profile at a given point. Müller et al. (2016) pointed out that the primary deformation of rock glaciers is controlled by gravity-related creep of its ice-bonded body. In the case of ice supersaturation, the deformable ice leads to a cohesive surface creep pattern with typical ridges and furrows (Amschwand et al., 2021). Down-valley movement of a rock glacier body occurs in the ice-containing core, where creep takes place, and in the basal shear layer, where shearing occurs (e.g., Haeberli et al., 2006). Both processes, creep and shearing, are strongly influenced by the impact of climate on ground thermal (i.e., higher permafrost temperature causes higher deformation rates) and subsurface water conditions (i.e., water as lubricant). As well as process understanding (Cicoira et al., 2020), additional supplementary data, e.g., climate or hydrological data, is needed for the advanced interpretation of the geometric changes detected.
Geometry-based indicators of a rock glacier, such as creep velocity changes or volumetric changes, are intended to serve as a proxy for climate change. There are many different methods to quantify the geometry of a rock glacier and its change. Terrestrial, airborne and spaceborne observation techniques have been applied so far (e.g., Kääb, 2005; Strozzi et al., 2020; Kääb et al., 2021). Data collection may be point- or area-based. In-situ measurements inherently require direct contact with the rock glacier’s surface, whereas remote sensing techniques (near-range, far-range) do not require such direct contact. The latter offers the advantage of not needing to walk on what might be an unstable and hence dangerous rock glacier to collect data. Change detection studies on rock glaciers mostly focus on creep velocity or surface height changes, whereas volume change studies are rather rare (e.g., Kellerer-Pirklbauer and Kaufmann, 2018; Vivero and Lambiel, 2019; Halla et al., 2021; Vivero et al., 2021). Detailed long-term studies on rock glacier movement, kinematic and volumetric changes covering more than 50 years are seldom (e.g., Schneider and Schneider, 2001). However, such studies provide a deeper understanding on decadal-scale rock glacier behavior and rock glacier-climate relationships (Kellerer-Pirklbauer and Kaufmann, 2012) and are therefore essential in periglacial landscape-evolution studies.
In this paper, we focus on the multi-annual and inter-annual changes in the surface of the Leibnitzkopf rock glacier in the Schober Mountains, in central Austria. Three decades ago, Buchenauer (1990) considered that this rock glacier was probably inactive. First creep velocity measurements at this rock glacier were carried out by Kaufmann (2010), by analyzing orthophotos/screenshots of virtual globes, i.e., Google Maps and Bing Maps. His results showed that the Leibnitzkopf rock glacier was not at all inactive. Indeed, he identified this rock glacier as one of the fastest moving rock glaciers in the Schober Mountains. The results were later confirmed by Kaufmann et al. (2012) and Kaufmann and Kellerer-Pirklbauer, (2015) using original image data instead of screenshots.
In this study, we used different types of aerial images, both 1) conventional government archival data (aircraft-based) and 2) on-demand data (UAV-based). The Federal Office of Metrology and Surveying (BEV) in Vienna conducts regular aerial surveys of the Austrian territory at multi-annual intervals, currently every 3 years (BEV, 2021). The data base consists of images taken by analog and digital survey-grade cameras (metric cameras). Flying heights above ground are generally between 2,000 and 5,000 m. This governmental data can be supplemented by additional overflights on demand to support specific research aims. As conventional aerial surveys using survey-grade cameras are cost-intensive, nowadays UAV-based aerial surveys using consumer-grade cameras are widely used to obtain high-resolution images (de Jong, 2020). Right up until the end of the 20th century, photogrammetric mapping was the exclusive preserve of the educated specialist. Since then, computer vision (software) and powerful computers (CPUs, graphics cards) have democratized photogrammetry (Walker and Petrie, 1996). Software (commercial and open source) is now available for streamlined semi-automatic processing of both governmental (metric) and most recent (non-metric) image data.
This study has two general goals. First, we elaborate on data processing and related problems of conventional and UAV-based aerial surveys which cover a 66-year period (1954–2020) focusing on a highly active rock glacier in Austria. Second, we use the generated digital orthophotos (DOPs) and digital elevation models (DEMs) to quantify geometric and morphological changes which are put into a climate change-related context using additional data. In detail, the aims of this study were 1) to combine both types of remote sensing data sources for the Leibnitzkopf rock glacier – conventional (12 epochs between 1954 and 2018) and UAV-based aerial surveys (2 epochs, 2019 and 2020) – into a common processing scheme computing DOPs and DEMs for each data set; 2) to elaborate on data processing aspects and related problems; 3) to carry out change detection analysis focussing on rock glacier kinematics and volumetric changes; 4) to estimate permafrost degradation-related ice losses of the rock glacier during the observation period; and 5) to combine the calculated rock glacier velocity and volume values with climate and ground climate data using in-situ ground temperature and nearby meteorological data.
Study Area
The Leibnitzkopf rock glacier is located at the valley head of the Leibnitz Valley (Schober Mountains, East Tyrol, Austria; see Figure 1). The Schober Mountains are part of the Hohe Tauern Range and reach a maximum elevation of 3,283 m a.s.l. (Mt. Petzeck). At present there are no glaciers in the valley head of the Leibnitz Valley. During the Little Ice Age (LIA), only one small glacier existed in the south-eastern part of the catchment (Reitner et al., 2016). Figure 1A shows the distribution of permafrost based on an Alpine-wide permafrost model (Boeckli et al., 2012). According to the permafrost model, the valley bottom and the higher lying areas around the Hochschober refuge are free of permafrost (Figure 1A). Currently, only the upper slopes at the valley head and the mountain summits are presumably underlain by permafrost. Furthermore, Figure 1A shows the spatial distribution of all existing rock glaciers, indicating whether they are relict or intact. Only a few rock glaciers in the Leibnitz Valley are classified as intact, one of which is the Leibnitzkopf rock glacier of this study (is210b in the inventory of Kellerer-Pirklbauer et al., 2012; 7RG005 in the inventory of Wagner et al., 2020; Figure 1B). The relict rock glaciers in the area started to form during the Lateglacial period (Linner et al., 2013; Reitner et al., 2016) and were presumably active until the early phase of the Holocene.
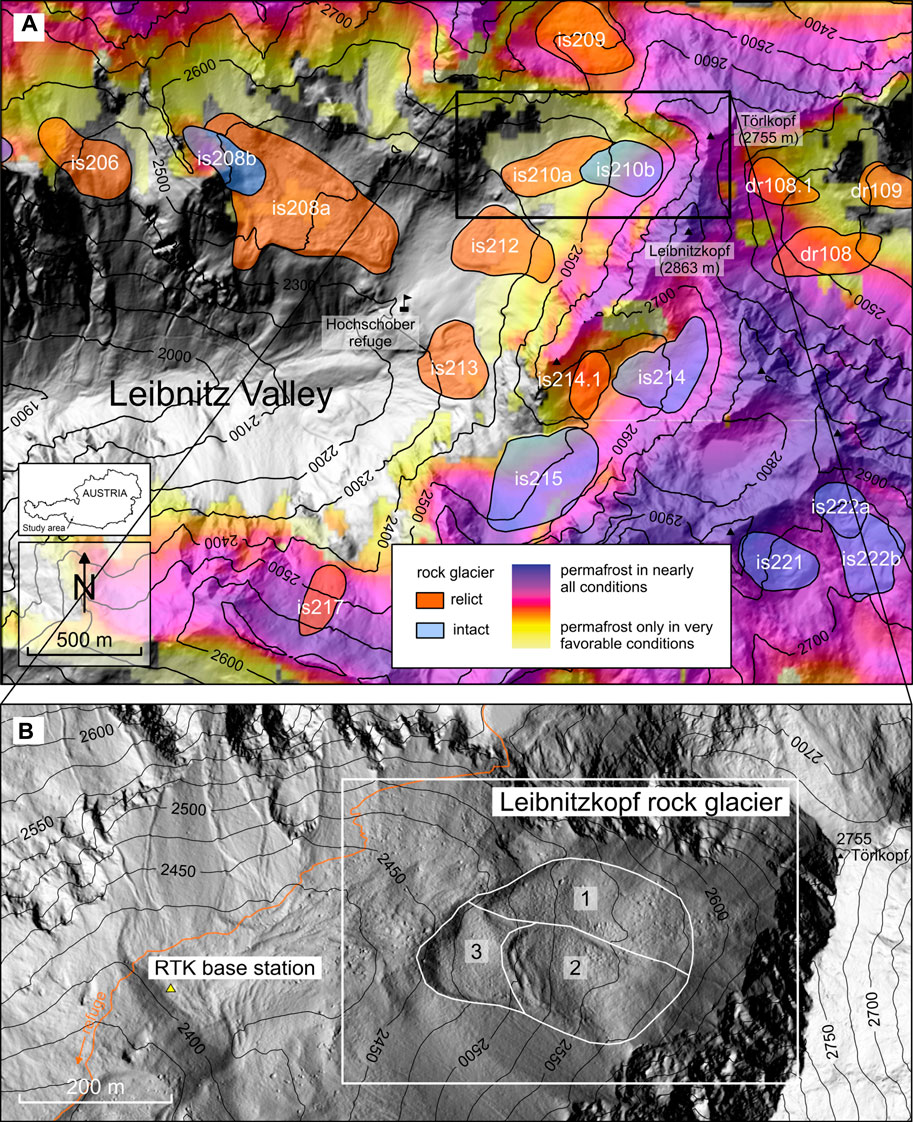
FIGURE 1. (A) Location map: Shaded relief based on ALS data (September 08, 2009) showing the study area (Leibnitzkopf rock glacier, WGS 1984: 46°55′51.5″ N, 12°42′42.9″ E) and its surroundings. ALS data © Office of the Tyrolean Regional Government. (B) Close-up of the study area. The white rectangle shows the map sections depicted in Figures 3, 4, 5A. The different rock glacier units 1–3 discussed in the text are outlined.
The Leibnitzkopf rock glacier is a tongue-shaped and talus-derived rock glacier with a length of about 360 m, a maximum width of 240 m, an area of 0.062 km2, and a terminus at 2,445 m a.s.l. Geomorphologically, the rock glacier consists of three different units: a northern, rather stable looking unit (unit 1: 37% of the landform); a southern, morphologically more active looking (unit 2: 42%); and finally a lower-elevated, active and western unit (unit 3: 21%) which appears to be overridden or at least pushed by the second unit (Figure 1B). The rock glacier is west-facing and overlooked by up to 2,863 m a.s.l. high mountains, yielding a total altitude difference of 418 m. Debris is supplied to the rock glacier from a cirque headwall with two major debris supply areas at the steep slopes of the Törlkopf (2,755 m a.s.l.) and Leibnitzkopf (2,863 m a.s.l.) peaks. The confining frontal and marginal slopes are well developed and steep, in some places even exceeding 50° (Figure 2).
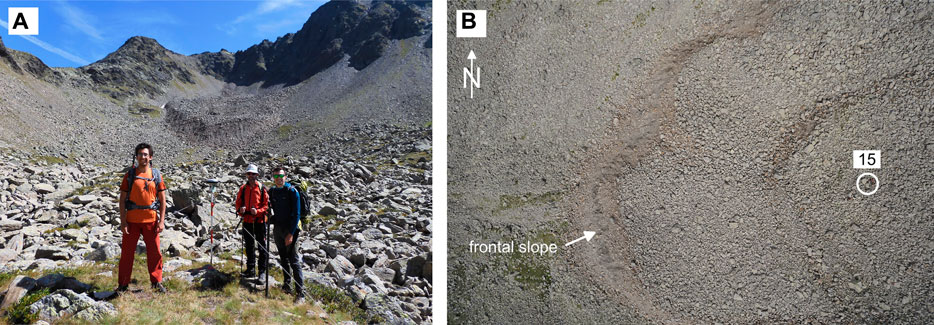
FIGURE 2. (A) Terrestrial photograph (August 26, 2020) showing the RTK-GNSS base station and the Leibnitzkopf rock glacier in the background. Viewing direction to the East. (B) Selected image of the UAV-based aerial survey of 2020 showing the lower part of the rock glacier tongue. The location of the geodetic observation point no. 15 is indicated by a white circle. For geolocation of point 15 see Figure 3.
Data
Conventional Aerial Surveys
Archival data was provided by the Federal Office of Metrology and Surveying (BEV) in Vienna. The dataset comprises 12 epochs between 1954 and 2018. Technical parameters of the aerial surveys and the data provided are given in Table 1. Camera calibration certificates were made available for all overflights except for 1954. Analog image data were digitized using a high-grade photogrammetric scanner. Aerial surveys for mapping alpine regions in Austria are generally scheduled between late August and the beginning of October for stable weather (clear skies) and best snow free conditions, especially for glacier mapping. However, due to both the high relief and low sun angle, long shadows prevail in the image data, hampering good surface recognition (Figure 4). Recent aerial surveys of BEV were conducted at a 3-year interval. Traditional aerial surveys typically use metric/calibrated cameras, providing large image formats. The latter enables monolithic coverage of smaller study sites (Ladstädter et al., 2010). The present study area is always fully covered by at least two frames, which means that the minimum set of images is two. For processing, we selected images that were acquired in the same flight strip. Images taken with analog cameras have an endlap of ∼60%, and with digital cameras ∼80%.
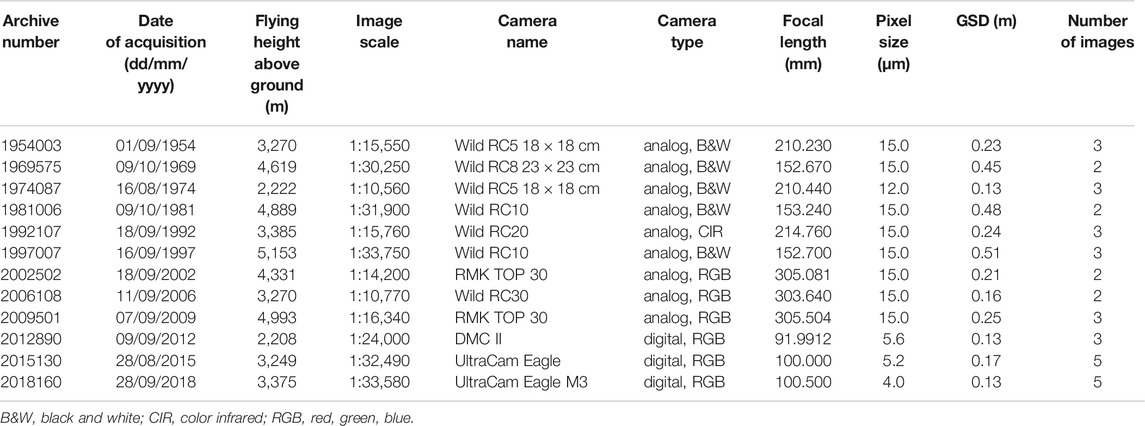
TABLE 1. Technical parameters of the conventional aerial surveys 1954–2018.
UAV-Based Aerial Surveys
The 2019 and 2020 aerial images were acquired using two different multirotor UAVs. Their survey-specific characteristics are listed in Table 2. Due to aviation regulations, e.g., maximum flying height above ground and the required visual line of sight, the area surveyed was limited to the main active part of the rock glacier. In August 2019, images were acquired using a quadcopter with a planned image overlap of 80%, both along and across the flight path. In August 2020, the survey was repeated using a hexacopter with 80% endlap and 70% sidelap. In both cases, it was possible to cover the area of interest in a single flight. However, due to the acquisition characteristics (camera used, flight altitude etc.) the hexacopter flight was conducted in cross-grid mode, which means that the area was covered by two, perpendicular-oriented regular flight patterns (three paths each) which is beneficial in terms of intersecting geometry. Based on the lower resolution of the camera and considering the intended ground sampling distance (GSD) of only a few centimeters, the quadcopter flight was implemented using only seven parallel flight paths. Irrespective of the UAV used, the acquired images had a vertical orientation. However, while the quadcopter paused at so-called waypoints, the hexacopter took images while slowly (∼4 m/s) moving forward. During the 2020 survey, we had almost perfect illumination conditions, whereas in the 2019 survey clouds cast some shadows which were problematic in the subsequent data processing (see Georeferencing, DOPs and DEMs Section). In 2020, the Sony camera was used in shutter priority mode with a fixed shutter speed of 1/800 s (resulting in aperture values of f/7.1–f/9.0) and with fixed manual focus set at infinity. The quadcopter camera (2019 survey) was used in auto-focus mode as it was not easily adjustable. Irrespective of the terrain slope gradient, at nadir points the average heights above ground of ∼153 m (2019) and ∼150 m (2020) resulted in GSDs of ∼0.066 and ∼0.038 m, respectively (Table 2).
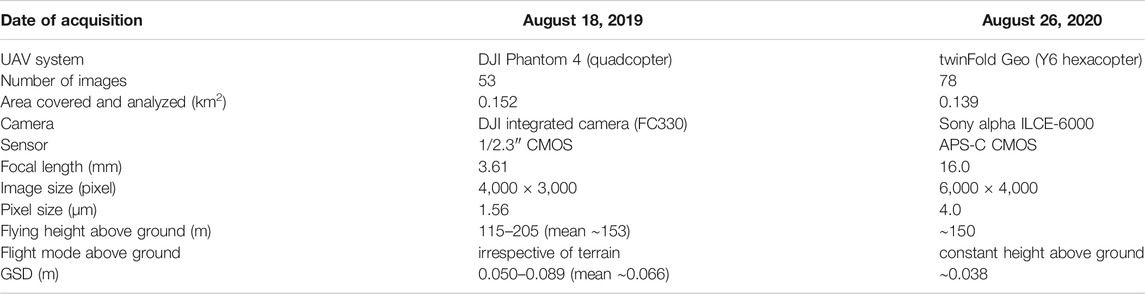
TABLE 2. Technical parameters of the UAV-based aerial surveys 2019 and 2020.
In terms of georeferencing, signalized ground control points (GCPs) were installed and deployed using targets (checkerboard pattern) prior to the overflights: 2019 (14 targets) and 2020 (8); see Figure 3. These GCPs were measured using the Real-Time Kinematic Global Navigation Satellite System (RTK-GNSS) technique with a local base station (see below). Additionally, in 2020, survey-grade GNSS measurements of the camera positions were made and processed in Post-Processed Kinematic (PPK) mode. The PPK solution is based on two dual-frequency GNSS modules, a u-blox F9 receiver used as a rover on the UAV, and an Emlid Reach RS2 receiver for the base station. These receivers recorded positional information in Receiver Independent Exchange Format (RINEX), which was subsequently used to precisely determine the antenna positions during image capture (signals based on flash triggering) with a postprocessing software (REDToolbox). The overall internal, i.e., not independently determined, positional measurement precision was 0.016 m. Both UAV campaigns were conducted on the same day as the regular annual geodetic measurements performed at this rock glacier.
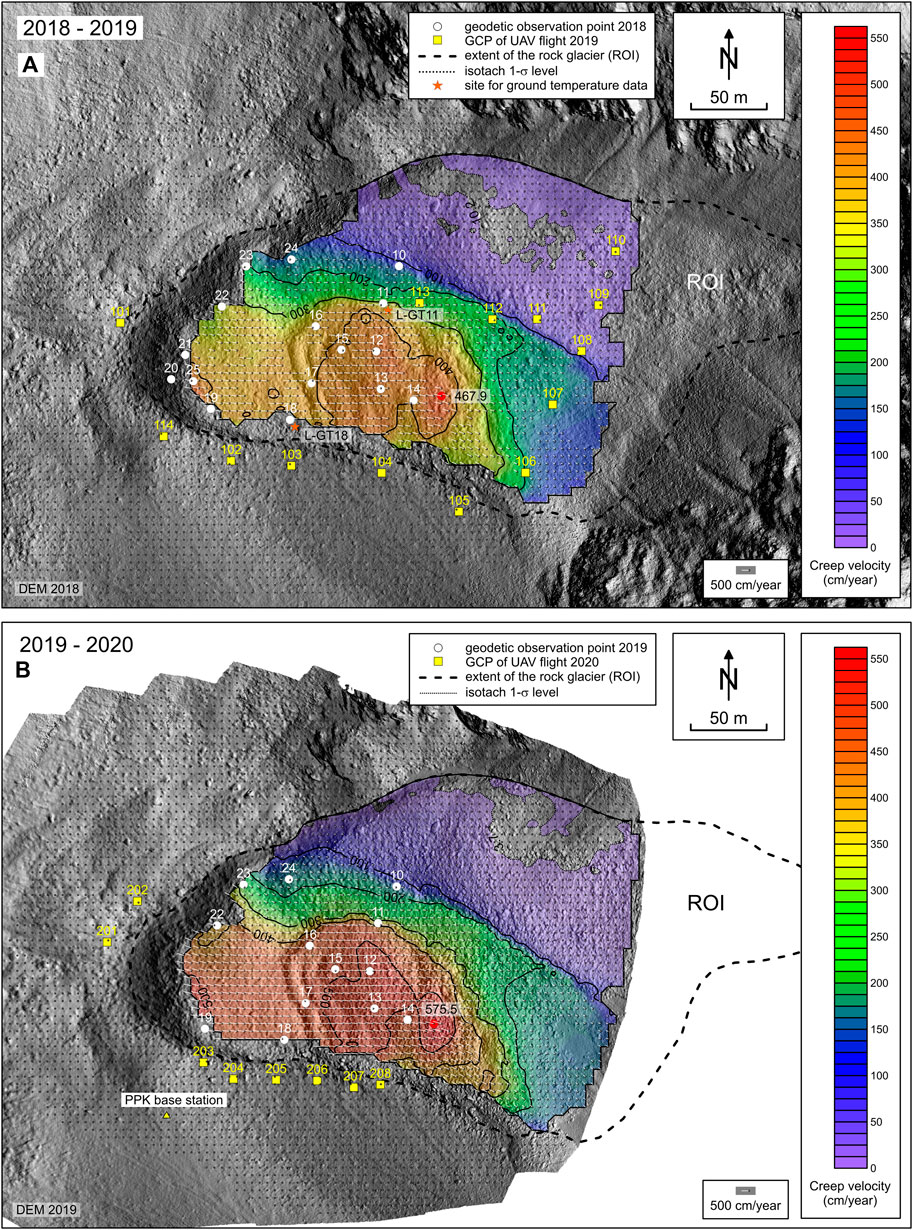
FIGURE 3. Thematic maps showing the kinematics of the Leibnitzkopf rock glacier for the time periods 2018–2019 (A) and 2019–2020 (B). The position of the maximum surface creep velocities during both years (467.9 and 575.5 cm/year) is indicated by a red dot.
Geodetic Measurements
Regular annual geodetic measurements at the Leibnitzkopf rock glacier started in 2010. The observation network consists of a stable point (which serves as a base point for RTK-GNSS measurement) located in the vicinity of the rock glacier (Figures 1B, 2A), and 13 (2020) permanently marked observation points on the rock glacier (Figure 3). The map coordinate system used is EPSG: 31255 (MGI/Austria GK Central, orthometric heights). As a result, mean annual 3D displacement vectors can be computed for each observation period, allowing horizontal surface velocities to be derived. The obtained velocities are accurate up to 3–5 cm/year, based on the measurements of stable points. An average value can be computed from the 13 observation points at the rock glacier surface, which represents the mean creep velocity of the rock glacier for the observation period in question. In this study we used the geodetic measurements mainly to independently cross-check the photogrammetrically derived velocities.
Photogrammetric Reference Data
BEV provided us with exterior orientation (EO) data (EPSG: 31255, ellipsoidal heights) of the aerial images for 2015 and 2018. This data was directly used for georeferencing in Agisoft Metashape. The photogrammetric block of images from 2018 was selected as a geometric reference for further georeferencing other previously unreferenced aerial images (1954–2012) and for general accuracy assessment. For reasons of quality control, we measured the 3D coordinates of 42 locations, predominantly clearly defined corners of large rocks, using the multi-photo dataset from 2018. The measurements were first carried out monoscopically within Agisoft Metashape, but at a later stage of the study we repeated the measurements stereoscopically, using the digital photogrammetric workstation ImageStation of Intergraph in order to obtain a better height accuracy. The later data were then used in the study.
Airborne Laser Scanning (ALS) Data
An ALS-derived DEM dating from September 08, 2009 was also used. This model has a grid spacing of 1 m and provides orthometric heights (Figure 1). We used this model to define the vertical datum. The height difference between ALS and photogrammetric data resembles the local geoid undulation, which can be assumed to be constant for the small study area.
Ground and Air Temperature Data
Data related to climatic conditions and recent changes help lend results about rock glacier geometry changes a climate-relevant perspective. Data on ground thermal as well as atmospheric conditions are particularly valuable for better understanding the relationship between rock glacier kinematics and climate. We used ground temperature data compiled at two sites located near the surface at the coarse-blocky layer of the rock glacier (Figure 3A). Air temperature data from a nearby automatic weather station (8 km NE, Hinteres Langtalkar cirque/HLC, 2,644 m) and from a long-standing, high-alpine meteorological observatory (23 km NE, Sonnblick/SON, 3,105 m) were also included in the subsequent analyses.
Methods
Georeferencing of the Aerial Images
One basic intention of this study was to georeference all available aerial images of the studied rock glacier applying structure-from-motion (SfM) photogrammetry, and at the same time keeping the number of geodetically and/or photogrammetrically measured GCPs needed for georeferencing to a minimum. In this study we used Agisoft Metashape (Agisoft Metashape, 2021; up to release 1.6.5). The general workflow consisted of 1) data import, 2) bundle block adjustment (providing a sparse point cloud), 3) computation of the dense point cloud applying a multiple-view stereo algorithm, 4) meshing (2D), 5) DOP generation, 6) DEM generation, 7) export of results, and 8) reporting (cf. Westoby et al., 2012; Jiménez-Jiménez et al., 2021). Workflows for registration/georegistration of multi-temporal UAV-based image data avoiding GCPs and supporting surface change detection have already been proposed by different authors (Dall’Asta et al., 2017; Feurer and Vinatier, 2018; Chudley et al., 2019; Cook and Dietze, 2019; de Haas et al., 2021; Śledź et al., 2021; Vivero et al., 2021).
Georeferencing the Conventional Aerial Images
A block of five aerial images from 2018 served as a control (directly or indirectly) for all other epochs. The epoch of 2015 could have been used interchangeably. We decided to carry out all photogrammetric processing in a local (3D Cartesian) coordinate system following traditional photogrammetric mapping. The set-up of the pre-triangulated digital images from 2018 in Agisoft Metashape was straightforward, except for the essential “earth curvature correction”. Because of the structure of the formula (McGlone, 2013, p. 346–348), earth curvature correction can be easily implemented as a virtual lens distortion (for 2018 up to 6.5 μm/1.6 pixel in the image corners) using parameter K1. Due to the mathematical model implemented in Agisoft Metashape, the computation of parameter K1 must be carried out with F (focal length) equals 1. The correct sign is always negative, which means that “flat earth” image points are shifted radially toward the image center, correcting for the effect of earth curvature. The correct implementation of the earth curvature correction in Agisoft Metashape can be checked quantitatively by plotting the radial distortion. Atmospheric refraction correction was intentionally omitted.
The final quality check of the photogrammetric set-up of the 2018 dataset in Agisoft Metashape is a constrained bundle block adjustment (BBA) with appropriate accuracy settings, e.g., 10–6, of the elements of the EO. The EO given will not change significantly after BBA. Thus, we were able to check the correct intersection of homologous rays in object space. By using the overall reprojection error provided by the software as a general quality parameter of the imported/recovered bundle block, we obtained a value of 0.132 pixel for 2018, and 0.148 pixel for 2015.
Subsequently, we tried to co-register all other aerial images, including those acquired with UAVs, to the 2018 photo block. Bi-temporal bundle adjustment, i.e., co-registration, was carried out in Agisoft Metashape by adding all images of a new, unreferenced epoch into a copy of the base project, i.e., 2018 (cf. de Haas et al., 2021). Unstable areas, e.g., the studied or other moving rock glaciers, had to be masked in the 2018 reference epoch prior to co-registration. If the areal extent of the unstable areas is rather small in comparison to the area surveyed, masking can be omitted. Outliers, i.e., points with large residuals, were removed within the BBA. Co-registration was accomplished using the manifold of detected tie points connecting the bi-temporal images within the BBA: EO of 2018 was fixed, EO of the second epoch was estimated. This approach assumes that earth curvature and (known) lens distortion are appropriately modeled within Agisoft Metashape.
One problem arises when dealing with images taken by analog cameras with significant lens distortion. Camera calibration certificates normally include a tabular description of the radial-symmetric distortion. However, current versions of Agisoft Metashape cannot directly handle radial distortion in a tabular format. Thus, equivalent parameters K1-K3 are needed to properly model the effect of radial distortion as given in the camera calibration certificate. We propose two solutions:
1) Self-calibration of the (analog) camera including the parameters K1-K3 (radial distortion) and optionally also F (focal length). The latter is needed because of projective coupling enabling a zero crossing (see below).
2) Stringent modeling using parameters K1-K3 and F. The required formulas are well-known from “balancing of radial distortion” (McGlone, 2013, p. 697). Thus, we get radial distortion parameters K1-K3 and a new focal length for the camera concerned. This procedure gives us the certainty that we can retrieve the original photogrammetric bundle after “de-balancing”. We used Grapher (Golden Software) to interpolate a polynomial of degree 7 (k0*r + k1*r3 + k2*r5 + k3*r7) modeling the radial distortion. Appropriate scaling is needed to address the unit camera (F = 1). Parameter k0 defines the correct scale factor due to projective coupling (McGlone, 2013, p. 697). Thus K1-K3 and a new modified F are derived. The correct computation can be checked by comparing the slope angles in both the original and modified imaging geometry for any given radial distance.
We applied the second method only for those cameras for the epochs 2009, 1992, 1974, and 1969, which showed a distinct radial distortion including one single zero crossing. For cameras with small and irregular radial distortion we used K1-K3 as free parameters and kept the focal length F fixed. In addition, the earth curvature correction was considered and compensated for. It was not actually possible to directly co-register all epochs to 2018: the aerial images from 1981 to 1997, both of small scale, had to be co-registered to the stereo-triplet of 1974.
Georeferencing the UAV-Based Aerial Images
The procedure noted above did not apply directly to the as yet non-registered image data for 2019 and 2020. Agisoft Metashape did not find any valid tie points between bi-temporal image datasets. Geometric transformation of the 2018 data, such as data clipping and adjusting the ground sampling distance, did not solve the problem at all. Thus, it was necessary to conduct the georeferencing using available ground control (GCPs surveyed in 2019 and 2020) and measured camera positions (2020).
Photogrammetric mapping is prone to systematic errors. This is known from stereopairs and image blocks. Systematic errors can only be mitigated using the appropriate functional and stochastic modeling and respective geometric control, either using highly accurate GCPs or additional images to strengthen the photogrammetric block (Luhmann et al., 2014).
Initially, the aerial images from 2019 were georeferenced using 14 GCPs (Figure 3A). Self-calibration of the consumer-grade camera included F (focal length), Cx, Cy (principal point coordinates), K1-K4 (radial distortion coefficients), B1, and B2 (affinity and skew). Statistics (sub-pixel reprojection error) obtained suggested the derived 3D model was of good quality. However, the area-based inter-comparison of the bi-temporal DOPs and DEMs for 2018 and 2019 showed significant systematic distortions in planimetry (up to 60 cm) and height in the stable areas where almost no GCPs were available. Since the northern part of the rock glacier was not sufficiently covered by GCPs, we had to expect systematic errors. The use of additional natural points measured in 2018 were of little help, as the overall accuracy of the bundle block adjustment degraded, mainly due to vague point definition. In a next step, georeferencing the 2019 image data was discontinued, in order to bring forward the georeferencing of the 2020 data, with the intention of finally georeferencing the image data for 2019 with support of the georeferenced image data from 2020.
The georeferencing of the 2020 UAV dataset was supported by PPK-GNSS-measured camera positions and additional eight control points located outside but close to the rock glacier (Figure 3B). PPK-GNSS-supported BBA using only pre-calibrated parameters (camera calibration, camera offset) did not provide the anticipated sub-pixel accuracy compared with the ground control (GCPs and additional geodetic observation points). Subsequently, an integrated sensor orientation was conducted using all GNSS-based measurements on the ground and in the air. The camera model included F, Cx, Cy, K1-K4, P1, P2 (tangential distortion coefficients), B1, and B2, as well as rolling shutter compensation. The camera offset was estimated in 3D. All eight control points were used in the object space. In order to get a good result, the equally accurate GNSS-based measurements on the ground and in the air need to be weighted accordingly, to obtain equal strength in the BBA. Accuracy levels were set to 3 cm for camera positions and 1 cm for ground control points. After having checked the resulting DOP and DEM against the reference data of 2018, we were able to introduce this epoch as a reference for better georeferencing the UAV data for 2019.
Subsequently, georeferencing of the 2019 image data followed the same strategy as outlined in the section above. We carried out an integrated sensor orientation including the reference image data for 2020. This required us to mask further unstable areas, i.e., the moving rock glacier, in all aerial images from 2020. Masking can be a tedious process if the project comprises many images. However, this process can be automated (e.g., Python scripting within Agisoft Metashape) by projecting the known 3D polygon of the mask into each image, presuming good estimates of EO are available. Independent quality control of the final 3D model was carried out, comparing both DOP and DEM with the reference data for 2018.
Computation of DOPs and DEMs
For each epoch we computed a high resolution DOP and a DEM. GSD of the orthophotos and grid spacing of the DEMs were selected appropriately according to image resolution and ease of further processing. Because of the topographic setting of the study area and the spatial resolution of the available data sets, we opted for a common grid-based (2.5 D) representation of the surface, knowing full well that a 3D representation (3D mesh) of the available UAV data would also have been possible.
Change Detection
Computation of 2D Displacement Vectors
Our change detection is based on the inter-comparison of multi-temporal DOPs and DEMs (Kääb, 2005; Dall’Asta et al., 2017). An in-house developed Matlab-based toolbox for computing 2D displacement vectors for points on a regular grid was used. The input data for this comparison could be either bi-temporal DOPs (JPG, TIFF) or DEMs (Surfer 6 ASCII grid). Image matching is based on the normalized cross-correlation (NCC) coefficient as a similarity measure. Sub-pixel resolution is achieved by directional (one-dimensional) local fitting of a parabola to the NCC coefficients obtained. Outlier detection included back-matching and statistical tests based on the smoothness assumption of the displacement vectors obtained. Optionally, the flow/creep direction obtained can also be compared with the dip direction derived from a contemporary DEM. The successful application of the proposed procedure on other rock glaciers in the Austrian Alps has already been documented (Kaufmann et al., 2018).
For operational work, such as rock glacier monitoring, we prefer to apply standard parameters. In our study we used the following settings: DOP/DEM resolution 20 cm, grid spacing 5 × 5 m, window size 31 × 31 pixel (6.2 × 6.2 m), threshold of correlation value 0.1–0.4, and back-matching distance one pixel. These settings worked sufficiently well for both DOPs and DEMs. The z-component of the full 3D displacement vector can be retrieved from the respective DEMs through interpolation.
Known stable areas can be used to statistically estimate the precision of the obtained 2D (3D) displacement vectors. In terms of planimetric accuracy, we compared the photogrammetrically derived velocities with our GNSS-based values.
Computation of the Velocity-Time Graph
The main task of rock glacier monitoring is not only change detection per se, but also to provide climate-relevant information in a condensed form (IPA Action Group, 2021). The computation of a representative and long-lasting comparable velocity value over time is challenging. There are several possibilities for defining a velocity value: maximum value (single value), mean value at fixed aperture (average value), and mean value at deforming aperture with time (average value). The velocity computed/derived can be plotted in absolute and/or relative numbers as a function of time, thus depicting the rock glacier’s velocity-time graph, and directly highlighting periods of acceleration and deceleration. The velocity-time graph in our study represents maximum values, and includes the original geodetic measurements appropriately scaled to fit the photogrammetrically derived values. We did not consider the area-based approaches for defining a representative creep velocity value in this study, because of strong surface deformation and associated algorithmic computation complexity.
Volume Change Analyses
The detection of volumetric change is a common supportive task, e.g., in glaciology or geomorphology (e.g., Nuth et al., 2007; Smith and Vericat, 2015). The correct interpretation of volumetric change often needs additional information. In the case of a rock glacier, we have to consider the whole catchment area influencing the rock glacier’s mass, i.e., input (gain) and output (loss). In our study, we outlined an approximate catchment area (Figure 5A), an area most supportive for our final goal of obtaining information about permafrost degradation, i.e., the possible meltout of permafrost ice. In the case of lithosphere material (rocks) supersaturated with ice, a negative volume change would indicate ice loss, assuming no other mass wasting, e.g., washout of fine sediments and melt of perennial snow patches, is present. The computation of volumetric change is based on standard DEM differencing, producing a DEM of Difference (DoD). Since the volumetric change is the integration of surface height differences over a defined region, it is highly sensitive to systematic errors. Thus, because photogrammetrically derived DEMs are especially prone to systematic errors in the vertical direction, respective volume change studies must be conducted with care. Significance analysis is, also in this case, based on the analysis of height change residuals in stable areas. Detected systematic errors in height may be corrected for.
The significance level of the volumetric change, i.e., of the mean surface height change in the catchment area, was not set by the standard error of the mean but by the standard deviation of the residual change (cf. Jokinen and Geist, 2010; Jiménez-Jiménez et al., 2021). The first approach would have given a too optimistic result. Volumetric change assessment was not possible for those time periods in which the areal coverage of detected surface height change was incomplete, the height changes were too noisy or there were too many outliers.
Climate and Ground Climate
Ground temperature was measured at two sites at the rock glacier surface between August 2018 and 2020 using one-channel dataloggers (GeoPrecision datalogger, Model M-Log1, PT1000 temperature sensor with an accuracy of 0.1°C). Air temperature has been measured at the nearby HLC site since September 2006. As we are focusing on rock glacier monitoring (in our case from August to July of the subsequent year), our full-year data series at HLC covers the period August 2007 to July 2020. Finally, data from the Sonnblick high-alpine observatory operated by the Austrian weather service ZAMG (Zentralanstalt für Meteorologie und Geodynamik) since the 19th century were also available. In the present study, we considered the data since 1954, calculating mean annual values (monitoring years) for the period August 1954 to July 2020.
Results
Georeferencing, DOPs and DEMs
The high precision of SfM-based modeling is demonstrated by the mean reprojection error, which is in the sub-pixel range (Table 3). Orthophotos were computed at GSDs of 0.05, 0.20 and 0.50 m depending on the original resolution of the image data. However, the GSDs were equalized in order to facilitate further processing. We opted for a common GSD of 0.20 m through appropriate down- and up-sampling (Table 3). Orthophotos are shown in Figure 4. Respective DEMs were computed at grid spacings of 0.10, 0.20 and 0.50 m, also depending on the spatial resolution of the image data (Figure 3). Referring to the common GSD of the orthophotos, we also computed derivative DEMs at 0.20 m grid spacing by interpolating for those epochs with another inherent resolution (Table 3). Thus a complete data set of multi-temporal DOPs and DEMs is available at 0.20 m resolution.
TABLE 3. Technical parameters of bundle block adjustment and DOPs and DEMs generated.
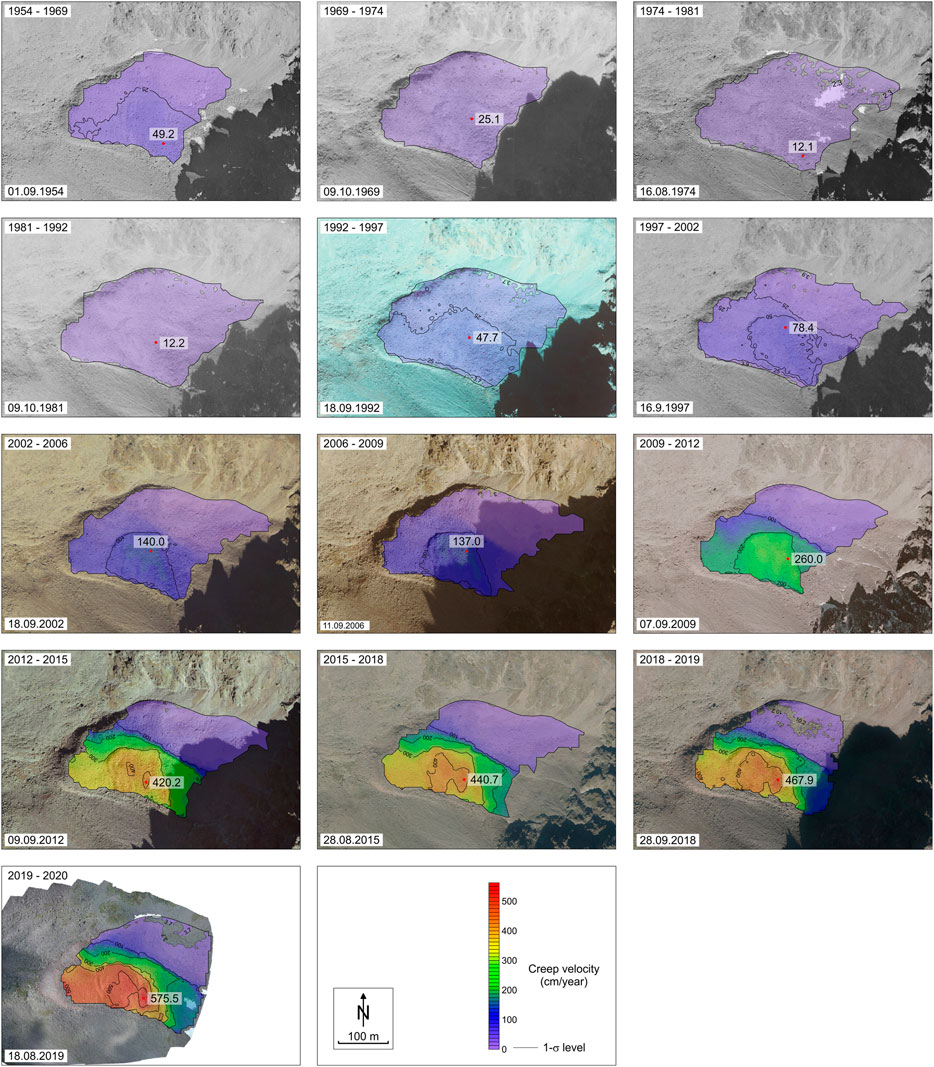
FIGURE 4. Color-coded velocity maps 1954–2020. The position of the maximum surface creep velocity is indicated by a red dot. The acquisition date of the backdrop orthophoto is given in the lower left corner of each map.
Horizontal Movement
2D displacement vector fields were computed using the available DOPs (cf. Figure 3 for UAV-based data). For reasons of comparison, we also carried out DEM-based matching for the time periods 2018–2019 and 2019–2020. Color-coded velocity maps help to visualize the spatial-temporal evolution of the mean annual 2D surface velocity (Figure 4). For the sake of clarity, velocities shown are confined by manually drawn envelopes excluding extrapolated data. The precision of the 2D change detection was estimated at stable areas in the surroundings of the rock glacier (Table 4). The level of precision obtained primarily scales with GSD of the original image data and the respective observation period.
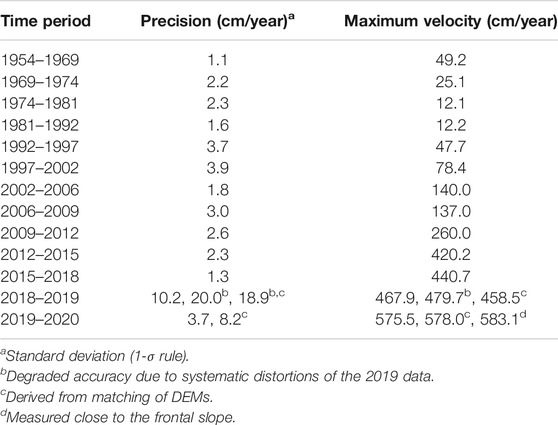
TABLE 4. Summary of the computed surface velocities.
We selected the maximum surface velocity as the proxy for describing the rock glacier’s kinematic state. Usually, the maximum and mean values correlate very well (Kääb et al., 2007; Kellerer-Pirklbauer and Kaufmann, 2012). The computation of any mean velocity value was omitted due to methodological and/or computational reasons. Table 4 lists the velocity values obtained. The velocity-time graph 1954–2020 is shown in Figure 6. The displacement values derived from the geodetic measurements were appropriately scaled, retrieving maximum values fitting those which were photogrammetrically derived. The maximum displacement in 1954–2020 amounts to ∼66.5 m, whereas the terminus of the rock glacier pushed forward much less, i.e., with a maximum of 16.4 m at the upper rim of the frontal slope (Figure 5B).
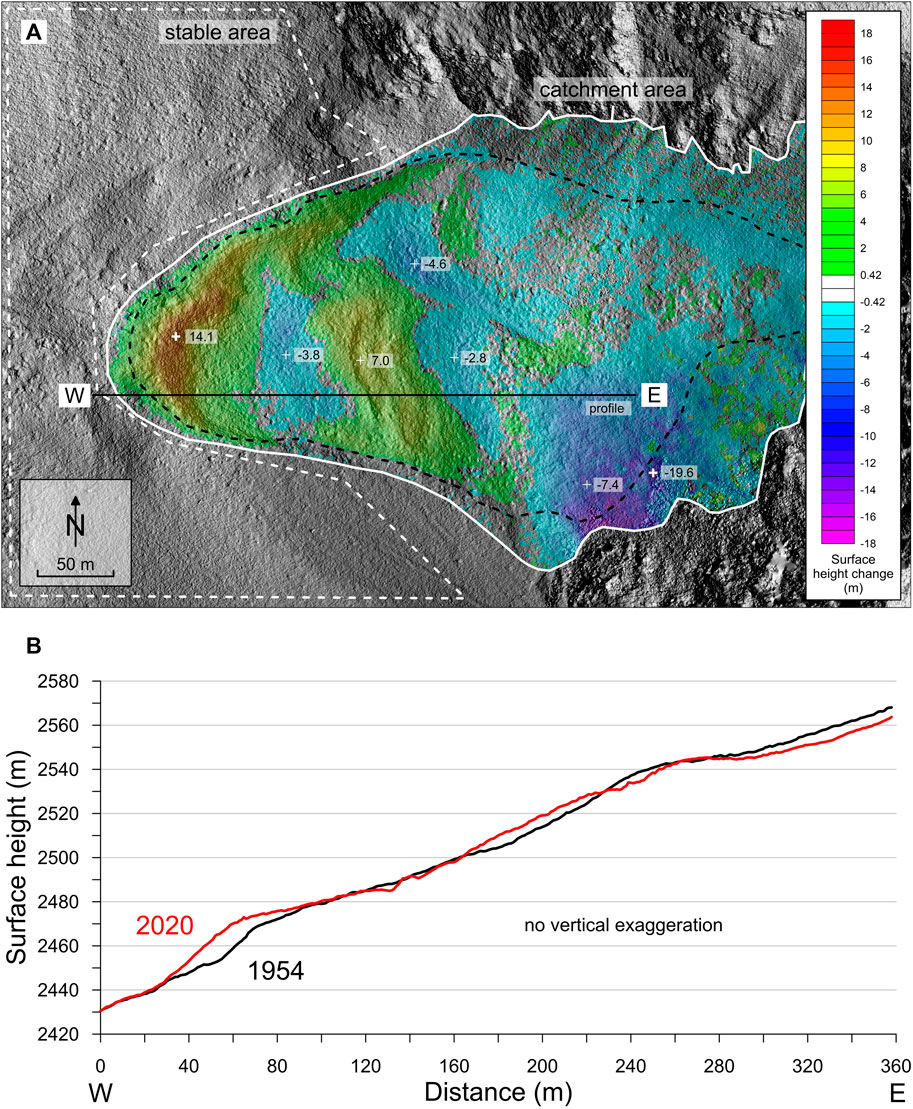
FIGURE 5. (A) Color-coded surface height change for the time period 1954–2018. The significance level is at ±0.42 m (standard deviation, 1-σ rule). Single spot height differences (max. 14.1 m, min. −19.6 m) are shown. (B) Longitudinal profile W-E for the time period 1954–2020.
The accuracy of the photogrammetrically determined horizontal creep velocities was determined by geodetic measurements, where available. For example, the UAV-based horizontal velocities are accurate up to 5.9 cm/year (root-mean-square error). In the active sliding zone, where crevasses have developed, we determined horizontal extending strain rates between 0.050 and 0.085 years−1 for the period 2019–2020, which is the same order of magnitude as reported, e.g., by Marcer et al. (2021).
From a chronological viewpoint, the sequence in Figure 4 clearly shows that the entire landform behaved rather uniformly between 1954 and 2009. The whole rock glacier decelerated after 1969, reached a minimum velocity during the 1970s and the early 1990s, and has accelerated since then. The rather uniform behavior changed after 2009. The southern, upper part (unit 2) accelerated much more in the period 2009–2012 compared to the southern, lower (unit 3) and northern (unit 1) part of the rock glacier (cf. Figure 1). This accelerating phase of unit 2 possibly also triggered higher velocities at the lower unit 3, as the result of some sort of (delayed) pushing effects. Since 2012, the entire southern part of the rock glacier (units 2 and 3) sustained high surface velocity rates exceeding 2 m/year for most of the rock glacier units. During the last period with data (2019–2020), more than 50% of the two southern units exceeded an annual velocity of 4 m/year, reaching a maximum value of 5.8 m. By far the highest mean and maximum annual values during the entire period 1954–2020 were reached during the last decade, clearly demonstrating the unusual recent behavior of the rock glacier.
Comprehensive computer animations visualizing the rock glacier’s movement 1954–2020 can be found in Kaufmann (2021). The time-lapse movies (GIFs) comprise stacked DOPs and shaded reliefs derived from DEMs.
Volumetric Change
Volumetric change was calculated between various epochs based on 1 m grids. All computed changes, including the one for the period 1954–2018, were non-significant with respect to the assumed significance level (Table 5), indicating no significant change in the rock glacier volume. However, in spatial terms, the entire landform changed substantially with respect to the elevation at its upper part (up to −19.6 m) and lower part (max. 14.1 m), due to the depletion of the ice and debris reservoir and the advance of the rock glacier front, respectively (Figure 5A). Figure 5B depicts the identical longitudinal profile in 1954 and in 2020, clearly showing the massive advance of the front, the downward movement of the central bulge, and the lowering of the rooting zone of the rock glacier.
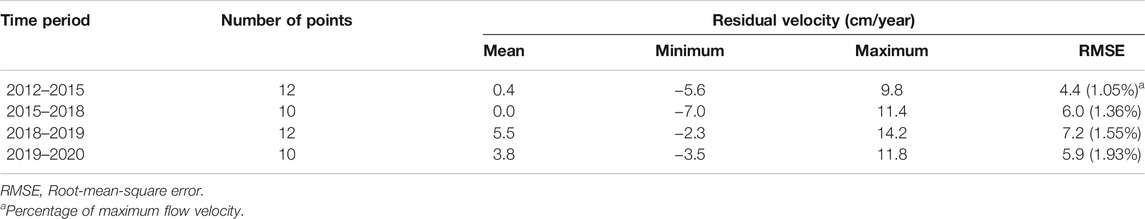
TABLE 5. Accuracy assessment of the photogrammetrically derived surface velocities.
Climate and Ground Climate
The mean annual ground surface temperatures dating from the recent past at two locations of the rock glacier are consistent with each other. In the first monitoring year (2018/19), mean annual values were calculated yielding 0.8°C (site L-GT11; cf. Figure 3A) and 0.7°C (L-GT18). The second year (2019/20) was substantially warmer, at 1.8°C (L-GT11) and 2.0°C (L-GT18). Low winter temperatures below seasonal snow cover at both sites suggest permafrost conditions, although summer insolation causing substantial rock heating is high at both monitoring sites, with daily mean temperatures even exceeding 15°C. Air temperature data at the two sites HLC and SON correlate very well (r = 0.97, p < 0.01) with each other for the period 2007 to 2020 (Figure 6).
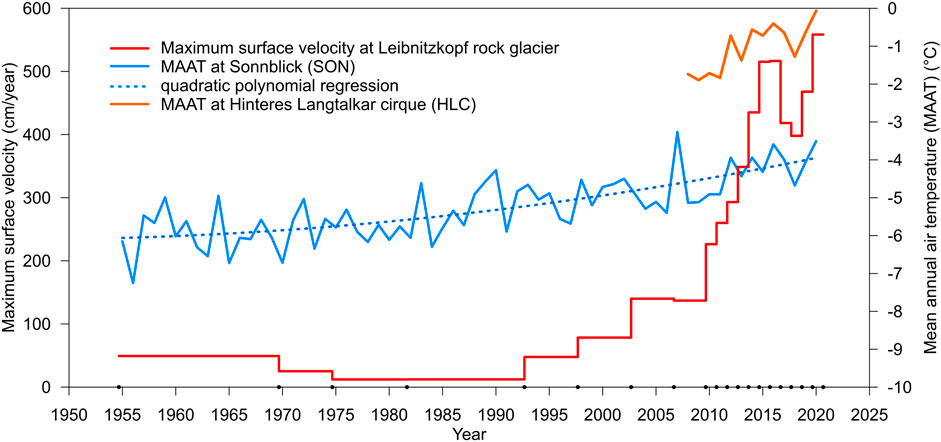
FIGURE 6. Velocity-time graph showing maximum speed values measured photogrammetrically and geodetically. Points on the x-axis indicate dates of data acquisition. This plot also shows the mean annual air temperature (MAAT) of SON (1954–2020) and HLC (2007–2020).
Considering the air temperature data and the annual rock glacier velocities in 2009–2020, one can clearly see the correlation between higher temperatures and higher movement rates (r = 0.84). The observation year 2019/20 in particular was exceptionally warm, with the highest recorded mean annual value at HLC and the second highest at SON (after 2006/07).
Discussion
Georeferencing, DOPs and DEMs
The anticipated image-based georeferencing of unreferenced time-series image data to a selected reference model (2018) could not be carried out completely. Firstly, the aerial images for 1981 and 1997 had to be georeferenced using the 1974 image data as a reference. Secondly, it was not possible to integrate the 2019 and 2020 UAV image data with the conventional aerial images from 2018. Clearly, the Agisoft Metashape keypoint detector selected points in the bi-temporal datasets which did not match. Dissimilar imaging and viewing geometry, sensor radiometry, illumination, shadowing, and the annual phenology of terrain surface cover, e.g., vegetation, caused the blob-based keypoint detector (cf. Lowe, 2004) to select mostly non-matching points. In contrast, the bi-temporal matching of any DOPs worked perfectly well using the NCC technique. We think that image-based co-registration of multi-sensor/multi-date aerial image data using a standard SfM technique can only be successful if the input data supports the geometric and radiometric requirements of the implemented SfM algorithm to a large degree. Our work did not follow the multi-epoch approach proposed by Feurer and Vinatier (2018) in order to keep the computational and semantic complexity low. Jointly processing multi-temporal image data in a single BBA would have required additional masking of the unstable areas, e.g., the rock glaciers. We argue that image data from either UAV-based acquisitions or modern digital aerial cameras will always be successfully matched in a standard SfM-based procedure.
While indirect georeferencing of UAV imagery is the method of choice in terms of the resulting quality (assessed at both independent check points and digital surface models (DSMs), e.g., Forlani et al., 2018), direct georeferencing (RTK/PPK) can result in qualities at the order of magnitude of only a few centimeters (Padró et al., 2019; Losè et al., 2020; Stott et al., 2020). However, large discrepancies can result in the viewing direction (i.e., vertical errors in nadir UAV-based surveys) for reasons including weak imaging configurations and non-metric cameras (e.g., Luhmann et al., 2014; Losè et al., 2020; Dall’Asta et al., 2017; Przybilla et al., 2020). In both direct georeferencing approaches, this effect can be easily mitigated using only a single GCP (Forlani et al., 2018; Zhang et al., 2019; Przybilla et al., 2020). In line with the literature, by using a combination of ground measurements (GCPs) and PPK-based measurements of projection centers, we were able to obtain high-quality DOPs and DEMs. The demands of measuring GCPs for georeferencing of UAV image data can be significantly reduced by applying RTK/PPK-based techniques, and where a photogrammetric reference model is available, e.g., the 2020 surveys of our UAV datasets, GCPs are not needed. However, independent quality control suggests measuring at least some points. Moreover, in line with the irrelevance of the surface type in terms of the DSM quality (e.g., Forlani et al., 2018), there are no indications that the landform and dynamics of rock glaciers require a specific methodological approach.
The nadir-looking UAV image data for 2019 and 2020 did not allow full coverage of the study area, thus the rooting zone of the rock glacier including the talus slopes further up-valley could not be mapped completely. In a follow-on project we would like to specifically acquire dedicated oblique-viewing imagery of the rooting zone of the rock glacier up to the headwalls of the cirque.
Horizontal Movement and Volumetric Change
The computation of 2D displacement vectors based on the NCC coefficient using DOPs was successful. No smoothing was applied to the original measurements. Only a few valid measurements were obtained in shadowed areas and in regions with large discontinuities in the creep pattern due to a lack of contrast, violating the poor shift assumption of the displaced surface element. The dissimilar shadows cast by the rocks due to different acquisition dates (day of the year) and times (time of the day) hampered image correlation significantly. The selected window size is the result of an iterative process of maximizing the number of valid measurements while at the same time optimizing robustness, noise behavior and spatial resolution, and minimizing correlation between measurements. Radiometric problems in image matching can be circumvented using appropriate DEMs. However, sufficient microtopography is needed as a prerequisite for successful geometry-based matching. Experiments showed that DEM matching can even provide more valid measurements than conventional image-based matching, although the accuracies obtained are significantly lower. In summary, we were able to show 1) that our UAV-based aerial surveys can fully substitute conventional surveys – apart from limited spatial coverage – and 2) that the obtained accuracy in creep velocity is of the same order of magnitude as the results obtained from geodetic point measurements.
Volumetric change of the entire rock glacier system could only be computed for those periods with full areal coverage of the studied landform and its debris-delivering catchment. Thus the UAV data had to be excluded from detailed volumetric analysis. The results obtained show that the detected volumetric changes are very small and non-significant. The level of detection is hard to define as discussed in the literature (Brasington et al., 2003; Nuth et al., 2007). The law of large numbers in statistics creates an overly optimistic level of detection (small value) for the volumetric change. The stable area for which the precision of the bi-temporal surface fit was computed amounts to 62,865 nodes of the DoD at 1 m grid spacing. Because of auto-correlation of the grid data, smoothing artifacts, possible outliers, uncertain catchment area, and as yet unknown systematic effects, we selected the precision of the single surface height change as the level of detection for significant mean surface height change (Table 6). The ratio of the two thresholds is approx. 250.
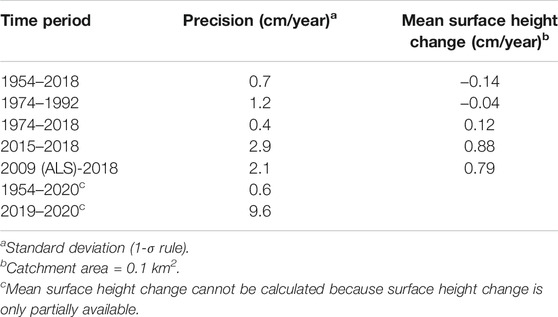
TABLE 6. Statistical assessment of the photogrammetrically derived surface height changes.
Despite the technical restrictions, from a geomorphological and glaciological point of view it is astonishing that the volumetric changes of the entire landform including its talus slopes since 1954 were rather small and thus below the significance level. This contrasts with the results from a nearby cirque with a large rock glacier system, where a clear trend toward volumetric losses was observed for the period 1954 to 2012, with a substantial increase in volumetric losses since 2002 (Kellerer-Pirklbauer and Kaufmann, 2018).
Rock Glacier Velocity and Climate Relationship
Our long-term rock glacier displacement data, in combination with long-term air temperature data from nearby sites, show a clear relationship between higher temperatures and higher surface velocities. This relationship is, however, not trivial, and is heavily debated in the literature (e.g., Cicoira et al., 2020). Kellerer-Pirklbauer and Kaufmann (2012) noted that the comparison of movement and air temperature data revealed a time lag of one or more years for acceleration caused by warm air temperatures, whereas strong cooling causes a slightly faster deceleration, presumably related to the existence and abundance of liquid water in the rock glacier body.
Air temperature at a given site is commonly lower compared to the ground surface temperature. This phenomenon is termed surface offset and is related to snow cover effects in winter (nival offset) and vegetation effects in summer (vegetation offset) (Smith and Riseborough, 2002; French, 2018). At the Leibnitzkopf rock glacier, heating of the blocky surface caused by solar radiation in summer is high due to the lack of vegetation. In contrast, discontinuous snow cover, which is quite common for blocky alpine rock glaciers, allows more efficient ground cooling (Wagner et al., 2019). Due to this complex interplay of topography and local climatic conditions, the relationship between air and ground temperature at rock glaciers is not straightforward and, thus, longer ground temperature time series are necessary for ground temperature-velocity analyses (Kellerer-Pirklbauer and Kaufmann, 2012). However, our first 2 years of ground temperature data from the Leibnitzkopf rock glacier confirm the very low temperatures in winter which are favorable for permafrost, and high temperatures in summer which cause substantial surface heating.
Assuming similar air and ground temperature increases at the study site over the last decades (a reasonable assumption as demonstrated for neighboring rock glaciers, Kellerer-Pirklbauer and Kaufmann, 2012), we can expect an increase in the thickness of the active layer, warming of the permafrost body, and an increase in liquid water content in the ice-rock mass, leading to the observed higher velocities and unstable surface conditions. An Alpine-wide increase in rock glacier velocities as well as high inter-site correlation has been demonstrated by Kellerer-Pirklbauer et al. (2018). Thus, our observations are perfectly in line with comparable data series from Italy, Switzerland, France, and other mountain regions in Austria.
As shown in our long-term movement analysis, the studied rock glacier did not behave uniformly in time and space. High strain rates of up to 0.085 years−1 in the fast-moving part of the rock glacier caused surface ruptures and crevasse-like structures although, for topographical reasons (i.e., low slope angle in front of the advancing rock glacier front), they were not as distinct as observed at other nearby rock glaciers (Kellerer-Pirklbauer and Kaufmann, 2018). Large-scale landsliding processes have not been detected at Leibnitzkopf rock glacier so far but may occur in the future. To date, only the surface of the southern part of the rock glacier has partly disintegrated and turned into an unstable state, making direct field observations more difficult and dangerous. The rooting zone of the rock glacier has depleted substantially since 1954 due to the high debris transport rates of the rock glacier system, and at the same time presumably also due to low rock fall rates at the cirque headwall, as observed at a nearby comparable site (Kellerer-Pirklbauer and Rieckh, 2016).
Combining air temperature data with the rock glacier surface velocity data for 2009–2020 allowed us to conclude that both these parameters are closely correlated (r = 0.84) at the Leibnitzkopf rock glacier. We expect increasing rock glacier creep velocity as a result of the higher temperatures predicted following climate warming. This is likely to be the case for at least as long as the rock glacier body contains sufficient permafrost ice and liquid water to sustain high movement rates. However, additional long-term data such as snow cover variability, precipitation pattern, hydrogeological information, and higher-resolution (in terms of time) kinematic data are necessary for a better understanding of the climate-rock glacier relationship at this site.
Conclusion
From a technical point of view, we conclude that:
- Time-series analysis can be carried out using co-registration without any additional extrinsic geometric control, except for the reference data.
- GNSS-supported UAV flights help to prevent systematic deformation in planimetry and height of the resulting 3D models.
- Georeferencing GNSS-supported UAV flights requires at least some ground control.
- Grid-based data (DOPs, DEMs) strongly support 3D deformation analysis with a high level of automation and standardization using approved parameters.
- UAV-based aerial surveys can fill the temporal data gap between regular official overflights.
- Accuracies of UAV-based projects are comparable to classical geodetic measurements.
- In future, rock glacier monitoring will preferably be contactless, using remote sensing techniques, e.g., image-based, avoiding dangerous in-situ measurements.
From a morphological point of view, we can say that:
- The Leibnitzkopf rock glacier accelerated dramatically since the onset of velocity monitoring in the mid-1950s, although, however, in a non-linear way. Maximum annual surface velocities generally decreased until the 1970s reaching a minimum between the mid-1970s and the early 1990s with only 12 cm/year. Afterwards, the rock glacier steadily accelerated. Since 2013, almost every year has yielded maximum velocities exceeding 4 m/year, with a record of 5.6 m/year in 2019–2020.
- The increase in velocity was not uniformly distributed over the rock glacier surface. As shown by the morphology and the velocity pattern, three different units were identified. In all the years, the northern part (unit 1) was the least active one, with annual rates barely exceeding 100 cm/year. In contrast, the southern, upper part (unit 2) started to accelerate in the period 2009–2012, causing a push effect to the more sluggish reaction of the southern, lower part (unit 3). By 2012, unit 3 gained momentum, however, and constantly increased its velocity through to 2020. Such a pushing-process was previously barely quantified and is an excellent example of distinctly different displacement behaviors of neighboring units of a single rock glacier.
- The pronounced acceleration of the rock glacier since 2009 caused substantial geomorphological changes of the entire landform such as distinctive advance of the rock glacier front, a lowering of the rooting zone of the rock glacier, and a destabilization of the entire rock glacier body. The lowering of the rooting zone is also related to the lack of sufficient rock fall material produced at the headwalls.
- As shown by long-term temperature data, the destabilization of the rock glacier is also related to changes in the thermal and hydrological conditions of the rock glacier. Climate warming caused higher temperatures at the ground surface, an increase in the active layer thickness, warmer permafrost conditions, and an increase in liquid water content, all influencing higher movement rates.
- Based on our DoD analysis, we conclude that the Leibnitzkopf rock glacier is characterized by a rather low ice content during the entire observation period. The computed volumetric change of the rock glacier system (including the talus slopes behind and up to the cirque headwall) is non-significant for the period 1954–2018.
- Finally, surface velocity rates and air temperature data strongly correlate, supporting earlier results and highlighting the potential for rock glacier velocity data as a climate proxy. This sheds light on the importance of rock glacier kinematics as an essential climate variable (ECV) for permafrost for the Global Climate Observing System (GCOS).
Data Availability Statement
The raw data supporting the conclusions of this article will be made available by the authors, without undue reservation.
Ethics Statement
Written informed consent was obtained from the relevant individuals for the publication of any potentially identifiable images or data included in this article.
Author Contributions
This manuscript was written by VK with help from all co-authors. The study was designed by VK, AK-P, and GS. Data collection and data analysis was performed by VK, AK-P, and GS. Funding was obtained by VK and AK-P.
Funding
This work was funded by the Graz University of Technology, the University of Graz, and the Hohe Tauern National Park Carinthia through its long-term-monitoring program.
Conflict of Interest
The authors declare that the research was conducted in the absence of any commercial or financial relationships that could be construed as a potential conflict of interest.
Publisher’s Note
All claims expressed in this article are solely those of the authors and do not necessarily represent those of their affiliated organizations, or those of the publisher, the editors and the reviewers. Any product that may be evaluated in this article, or claim that may be made by its manufacturer, is not guaranteed or endorsed by the publisher.
Acknowledgments
We thank Carlo Emanuelle Augello, Alexander Doric, Walter Krämer, Hildegard Seka, Wolfgang Seka, and Matthias Wecht for fieldwork support. The help of the Gridling family (farmstead Oberferch at Oberleibnig) is kindly appreciated. Air temperature data of the Sonnblick observatory were kindly provided by Zentralanstalt für Meteorologie und Geodynamik.
References
Agisoft Metashape (2021). Agisoft Metashape. Available at: https://www.agisoft.com/(Accessed May 06, 2021).
Amschwand, D., Ivy-Ochs, S., Frehner, M., Steinemann, O., Christl, M., and Vockenhuber, C. (2021). Deciphering the Evolution of the Bleis Marscha Rock Glacier (Val d'Err, Eastern Switzerland) with Cosmogenic Nuclide Exposure Dating, Aerial Image Correlation, and Finite Element Modeling. The Cryosphere 15, 2057–2081. doi:10.5194/tc-15-2057-2021
Barsch, D. (1996). Rockglaciers: Indicators for the Present and Former Geoecology in High Mountain Environments. Berlin: Springer Series in Physical Environment 16, Springer-Verlag, 331. doi:10.1007/978-3-642-80093-1
BEV (2021). BEV. Available at: https://www.bev.gv.at/(Accessed May 06, 2021)
Boeckli, L., Brenning, A., Gruber, S., and Noetzli, J. (2012). Permafrost Distribution in the European Alps: Calculation and Evaluation of an index Map and Summary Statistics. The Cryosphere 6, 807–820. doi:10.5194/tc-6-807-2012
Brasington, J., Langham, J., and Rumsby, B. (2003). Methodological Sensitivity of Morphometric Estimates of Coarse Fluvial Sediment Transport. Geomorphology 53 (3-4), 299–316. doi:10.1016/S0169-555X(02)00320-3
Buchenauer, H. W. (1990). Gletscher- und Blockgletschergeschichte der westlichen Schobergruppe (Osttirol). Marburg, Germany: Marburger Geographische Schriften 117, published by Marburger Geographische Gesellschaft e.V., 276.
Chudley, T. R., Christoffersen, P., Doyle, S. H., Abellan, A., and Snooke, N. (2019). High-accuracy UAV Photogrammetry of Ice Sheet Dynamics with No Ground Control. The Cryosphere 13, 955–968. doi:10.5194/tc-13-955-2019
Cicoira, A., Marcer, M., Gärtner‐Roer, I., Bodin, X., Arenson, L. U., and Vieli, A. (2020). A General Theory of Rock Glacier Creep Based on In‐situ and Remote Sensing Observations. Permafrost and Periglac Process 32 (1), 139–153. doi:10.1002/ppp.2090
Cook, K. L., and Dietze, M. (2019). Short Communication: A Simple Workflow for Robust Low-Cost UAV-Derived Change Detection without Ground Control Points. Earth Surf. Dynam. 7, 1009–1017. doi:10.5194/esurf-7-1009-2019
Dall’Asta, E., Forlani, G., Roncella, R., Santise, M., Diotri, F., and Mora di Cella, U. (2017). Unmanned Aerial Systems and DSM Matching for Rock Glacier Monitoring. ISPRS J. Photogrammetry Remote Sensing 127, 102–114. doi:10.1016/j.isprsjprs.2016.10.003
de Haas, T., Nijland, W., McArdell, B. W., and Kalthof, M. W. M. L. (2021). Case Report: Optimization of Topographic Change Detection with UAV Structure-From-Motion Photogrammetry through Survey Co-alignment. Front. Remote Sens. 2, 626810. doi:10.3389/frsen.2021.626810
de Jong, S. M. (2020). Grand Challenges in Earth Observation Using Unpiloted Airborne Systems. Front. Remote Sens. 1, 601737. doi:10.3389/frsen.2020.601737
Feurer, D., and Vinatier, F. (2018). Joining Multi-Epoch Archival Aerial Images in a Single SfM Block Allows 3-D Change Detection with Almost Exclusively Image Information. ISPRS J. Photogrammetry Remote Sensing 146, 495–506. doi:10.1016/j.isprsjprs.2018.10.016
Forlani, G., Dall’Asta, E., Diotri, F., Cella, U. M. d., Roncella, R., and Santise, M. (2018). Quality Assessment of DSMs Produced from UAV Flights Georeferenced with On-Board RTK Positioning. Remote Sensing 10 (2), 311. doi:10.3390/rs10020311
French, H. M. (2018). The Periglacial Environment. Fourth Edition. Hoboken, NJ, USA: Wiley Blackwell, 515.
Haeberli, W., Hallet, B., Arenson, L., Elconin, R., Humlum, O., Kääb, A., et al. (2006). Permafrost Creep and Rock Glacier Dynamics. Permafrost Periglac. Process. 17, 189–214. doi:10.1002/ppp.561
Halla, C., Blöthe, J. H., Baldis, C. T., Trombotto Liaudat, D., Hilbich, C., Hauck, C., et al. (2021). Ice Content and Interannual Water Storage Changes of an Active Rock Glacier in the Dry Andes of Argentina. The Cryosphere 15, 1187–1213. doi:10.5194/tc-15-1187-2021
IPA Action Group (2021). IPA Action Group: Rock Glacier Inventories and Kinematics. Available at: https://www.unifr.ch/geo/geomorphology/en/research/ipa-action-group-rock-glacier/(Accessed May 06, 2021).
Jiménez-Jiménez, S. I., Ojeda-Bustamante, W., Marcial-Pablo, M., and Enciso, J. (2021). Digital Terrain Models Generated with Low-Cost UAV Photogrammetry: Methodology and Accuracy. Int. J. Geo-inf. 10 (5), 285. doi:10.3390/ijgi10050285
Jokinen, O., and Geist, T. (2010). “Accuracy Aspects in Topographical Change Detection of Glacier Surface,” in Remote Sensing of Glaciers. Techniques for Topographic, Spatial and Thematic Mapping of Glaciers. Editors P. Pellikka, and W. G. Rees (Boca Raton, Florida, USA: CRC Press/Balkema), 269–283. Chapter 14.
Kääb, A., Frauenfelder, R., and Roer, I. (2007). On the Response of Rockglacier Creep to Surface Temperature Increase. Glob. Planet. Change 56 (1-2), 172–187. doi:10.1016/j.gloplacha.2006.07.005
Kääb, A. (2005). “Remote Sensing of Mountain Glaciers and Permafrost Creep,” in Schriftenreihe Physische Geographie 48 (Zürich, Switzerland: Geographisches Institut der Universität Zürich), 264.
Kääb, A., Strozzi, T., Bolch, T., Caduff, R., Trefall, H., Stoffel, M., et al. (2021). Inventory and Changes of Rock Glacier Creep Speeds in Ile Alatau and Kungöy Ala-Too, Northern Tien Shan, since the 1950s. The Cryosphere 15, 927–949. doi:10.5194/tc-15-927-2021
Kaufmann, V., Filwarny, J. O., Wisiol, K., Kienast, G., Schuster, V., Reimond, S., and Wilfinger, R. (2012). “Leibnitzkopf Rock Glacier (Austrian Alps): Detection of a Fast Moving Rock Glacier and Subsequent Measurement of its Flow Velocity,” in Proceedings of the Tenth International Conference on Permafrost, Volume 4/1 (Ekaterinburg, Russia: Extended Abstracts, The Fort Dialog-Iset Publisher), 249–250.
Kaufmann, V., and Kellerer-Pirklbauer, A. (2015). “Active Rock Glaciers in a Changing Environment. Geomorphometric Quantification and Cartographic Presentation of Rock Glacier Surface Change with Examples from the Hohe Tauern Range, Austria,” in Mountain Cartography. 16 Years ICA Commission on Mountain Cartography (1999-2015). Wiener Schriften zur Geographie und Kartographie, 21. Editor K. Kriz (Universität Wien: Institut für Geographie und Regionalforschung), 179–190. 978-3-900830-86-1.
Kaufmann, V. (2021). Leibnitzkopf Rock Glacier (Carinthia, Austria). Available at: https://www.staff.tugraz.at/viktor.kaufmann/Leibnitzkopf_Rock_Glacier.html (Accessed May 06, 2021).
Kaufmann, V. (2010). “Measurement of Surface Flow Velocity of Active Rock Glaciers Using Orthophotos of Virtual Globes,” in Geographia Technica, Special Issue, 2010 (Cluj-Napoca, Romania: Cluj University Press), 68–81. Available at: http://technicalgeography.org/index.php/special-issue-2010/38-11-viktor-kaufmann-measurement-of-surface-flow-velocity-of-active-rock-glaciers.
Kaufmann, V., Seier, G., Seier, G., Sulzer, W., Wecht, M., Liu, Q., et al. (2018). Rock Glacier Monitoring Using Aerial Photographs: Conventional vs. Uav-Based Mapping - a Comparative Study. Int. Arch. Photogramm. Remote Sens. Spat. Inf. Sci. XLII-1, 239–246. doi:10.5194/isprs-archives-xlii-1-239-2018
Kellerer-Pirklbauer, A. (2019). Long-term Monitoring of Sporadic Permafrost at the Eastern Margin of the European Alps (Hochreichart, Seckauer Tauern Range, Austria). Permafr Periglac Process 30 (4), 260–277. doi:10.1002/ppp.2021
Kellerer-Pirklbauer, A., Delaloye, R., Lambiel, C., Gärtner-Roer, I., Kaufmann, V., Scapozza, C., Krainer, K., Staub, B., Thibert, E., Bodin, X., Fischer, A., Hartl, L., Morra di Cella, U., Mair, V., Marcer, M., and Schoeneich, P. (2018). “Interannual Variability of Rock Glacier Flow Velocities in the European Alps,” in 5th European Conference on Permafrost - Book of Abstracts, Chamonix, France, 23 June - 1 July 2018, 396–397.
Kellerer-Pirklbauer, A., and Kaufmann, V. (2012). About the Relationship between Rock Glacier Velocity and Climate Parameters in central Austria. Austrian J. Earth Sci. 105 (2), 94–112.
Kellerer-Pirklbauer, A., and Kaufmann, V. (2018). Deglaciation and its Impact on Permafrost and Rock Glacier Evolution: New Insight from Two Adjacent Cirques in Austria. Sci. Total Environ. 621, 1397–1414. doi:10.1016/j.scitotenv.2017.10.087
Kellerer-Pirklbauer, A., Lieb, G. K., and Kleinferchner, H. (2012). A New Rock Glacier Inventory of the Eastern European Alps. Austrian J. Earth Sci. 105 (2), 78–93.
Kellerer-Pirklbauer, A., and Rieckh, M. (2016). Monitoring Nourishment Processes in the Rooting Zone of an Active Rock Glacier in an alpine Environment. Z. für Geomorphologie 60 (Suppl. 3), 99–121. doi:10.1127/zfg_suppl/2016/00245
Ladstädter, R., Gruber, M., and Wiechert, A. (2010). “Monolithic Stitching: One Sensor Geometry for Multiple Sensor Cameras,” in San Diego 2010 Annual Conference Proceedings, 7. Available at: http://www.asprs.org/a/publications/proceedings/sandiego2010/sandiego10/Ladstaedter.pdf.
Linner, M., Reitner, J. M., and Pavlik, W. (2013). Geologische Karte der Republik Österreich 1:50.000 Blatt 179 Lienz. Wien: Geologische Bundesanstalt.
Lowe, D. G. (2004). Distinctive Image Features from Scale-Invariant Keypoints. Int. J. Comput. Vis. 60 (2), 91–110. doi:10.1023/b:visi.0000029664.99615.94
Luhmann, T., Robson, S., Kyle, S., and Boehm, J. (2014). Close-Range Photogrammetry and 3D Imaging. 2nd edition. Berlin: De Gruyter Textbook, 684.
Marcer, M., Cicoira, A., Cusicanqui, D., Bodin, X., Echelard, T., Obregon, R., et al. (2021). Rock Glaciers throughout the French Alps Accelerated and Destabilised since 1990 as Air Temperatures Increased. Commun. Earth Environ. 2, 81. doi:10.1038/s43247-021-00150-6
McGlone, J. C. (2013). Manual of Photogrammetry. Sixth Edition. American Society for Photogrammetry and Remote Sensing, 1318.
Müller, J., Vieli, A., and Gärtner-Roer, I. (2016). Rock Glaciers on the Run - Understanding Rock Glacier Landform Evolution and Recent Changes from Numerical Flow Modeling. The Cryosphere 10, 2865–2886. doi:10.5194/tc-10-2865-2016
Nuth, C., Kohler, J., Aas, H. F., Brandt, O., and Hagen, J. O. (2007). Glacier Geometry and Elevation Changes on Svalbard (1936-90): a Baseline Dataset. Ann. Glaciol. 46, 106–116. doi:10.3189/172756407782871440
Padró, J.-C., Muñoz, F.-J., Planas, J., and Pons, X. (2019). Comparison of Four UAV Georeferencing Methods for Environmental Monitoring Purposes Focusing on the Combined Use with Airborne and Satellite Remote Sensing Platforms. Int. J. Appl. Earth Observation Geoinformation 75, 130–140. doi:10.1016/j.jag.2018.10.018
Przybilla, H.-J., Bäumker, M., Luhmann, T., Hastedt, H., and Eilers, M. (2020). Interaction between Direct Georeferencing, Control point Configuration and Camera Self-Calibration for RTK-Based UAV Photogrammetry. Int. Arch. Photogramm. Remote Sens. Spat. Inf. Sci. XLIII-B1-2020, 485–492. doi:10.5194/isprs-archives-xliii-b1-2020-485-2020
Reitner, J. M., Ivy-Ochs, S., Drescher-Schneider, R., Hajdas, I., and Linner, M. (2016). Reconsidering the Current Stratigraphy of the Alpine Lateglacial: Implications of the Sedimentary and Morphological Record of the Lienz Area (Tyrol/Austria). E&G Quat. Sci. J. 65 (2), 113–144. doi:10.3285/eg.65.2.02
Schneider, B., and Schneider, H. (2001). Zur 60jährigen Messreihe der kurzfristigen Geschwindigkeitsmessungen am Blockgletscher im Äusseren Hochebenkar, Ötztaler Alpen, Tirol. Z. für Gletscherkunde Glazialgeologie 37 (1), 1–33.
Śledź, S., Ewertowski, M. W., and Piekarczyk, J. (2021). Applications of Unmanned Aerial Vehicle (UAV) Surveys and Structure from Motion Photogrammetry in Glacial and Periglacial Geomorphology. Geomorphology 378, 107620. doi:10.1016/j.geomorph.2021.107620
Smith, M. W., and Riseborough, D. W. (2002). Climate and the Limits of Permafrost: A Zonal Analysis. Permafrost Periglac. Process. 13 (1), 1–15. doi:10.1002/ppp.410
Smith, M. W., and Vericat, D. (2015). From Experimental Plots to Experimental Landscapes: Topography, Erosion and Deposition in Sub‐humid Badlands from Structure‐from‐Motion Photogrammetry. Earth Surf. Process. Landforms 40, 1656–1671. doi:10.1002/esp.3747
Stott, E., Williams, R. D., and Hoey, T. B. (2020). Ground Control Point Distribution for Accurate Kilometre-Scale Topographic Mapping Using an RTK-GNSS Unmanned Aerial Vehicle and SfM Photogrammetry. Drones 4, 55. doi:10.3390/drones4030055
Strozzi, T., Caduff, R., Jones, N., Barboux, C., Delaloye, R., Bodin, X., et al. (2020). Monitoring Rock Glacier Kinematics with Satellite Synthetic Aperture Radar. Remote Sensing 12, 559. doi:10.3390/rs12030559
Teppati Losè, L., Chiabrando, F., and Giulio Tonolo, F. (2020). Boosting the Timeliness of UAV Large Scale Mapping. Direct Georeferencing Approaches: Operational Strategies and Best Practices. Int. J. Geo-inf. 9, 578. doi:10.3390/ijgi9100578
van Everdingen, R. O. (1998). Multi-language Glossary of Permafrost and Related Ground-Ice Terms (Revised May 2005). Boulder: National Snow and Ice Data Center/World Data Center for Glaciology. Available at: https://globalcryospherewatch.org/reference/glossary_docs/Glossary_of_Permafrost_and_Ground-Ice_IPA_2005.pdf.
Vivero, S., Delaloye, R., and Lambiel, C. (2021). Validation and Application of Sequential Unmanned Aerial Vehicle Surveys to Monitor the Kinematics of a Rapid Rock Glacier. Earth Surf. Dynam. Discuss. [preprint], doi:10.5194/esurf-2021-8
Vivero, S., and Lambiel, C. (2019). Monitoring the Crisis of a Rock Glacier with Repeated UAV Surveys. Geogr. Helv. 74, 59–69. doi:10.5194/gh-74-59-2019
Wagner, T., Pauritsch, M., Mayaud, C., Kellerer-Pirklbauer, A., Thalheim, F., and Winkler, G. (2019). Controlling Factors of Microclimate in Blocky Surface Layers of Two Nearby Relict Rock Glaciers (Niedere Tauern Range, Austria). Geografiska Annaler: Ser. A, Phys. Geogr. 101 (4), 310–333. doi:10.1080/04353676.2019.1670950
Wagner, T., Pleschberger, R., Kainz, S., Ribis, M., Kellerer-Pirklbauer, A., Krainer, K., et al. (2020). The First Consistent Inventory of Rock Glaciers and Their Hydrological Catchments of the Austrian Alps. Austrian J. Earth Sci. 113 (1), 1–23. doi:10.17738/ajes.2020.0001
Walker, S., and Petrie, G. (1996). Digital Photogrammetric Workstations 1992-96. Int. Arch. Photogrammetry Remote Sensing XXXI (Part B2), 384–395. Available at: https://www.isprs.org/proceedings/XXXI/congress/part2/384_XXXI-part2.pdf.
Westoby, M. J., Brasington, J., Glasser, N. F., Hambrey, M. J., and Reynolds, J. M. (2012). 'Structure-from-Motion' Photogrammetry: A Low-Cost, Effective Tool for Geoscience Applications. Geomorphology 179, 300–314. doi:10.1016/j.geomorph.2012.08.021
Zhang, H., Aldana-Jague, E., Clapuyt, F., Wilken, F., Vanacker, V., and Van Oost, K. (2019). Evaluating the Potential of post-processing Kinematic (PPK) Georeferencing for UAV-Based Structure- From-Motion (SfM) Photogrammetry and Surface Change Detection. Earth Surf. Dynam. 7, 807–827. doi:10.5194/esurf-7-807-2019
Keywords: rock glacier, Austrian Alps, aerial survey, UAV, photogrammetry, monitoring, change detection, climate change
Citation: Kaufmann V, Kellerer-Pirklbauer A and Seier G (2021) Conventional and UAV-Based Aerial Surveys for Long-Term Monitoring (1954–2020) of a Highly Active Rock Glacier in Austria. Front. Remote Sens. 2:732744. doi: 10.3389/frsen.2021.732744
Received: 29 June 2021; Accepted: 13 September 2021;
Published: 01 October 2021.
Edited by:
David Rippin, University of York, United KingdomCopyright © 2021 Kaufmann, Kellerer-Pirklbauer and Seier. This is an open-access article distributed under the terms of the Creative Commons Attribution License (CC BY). The use, distribution or reproduction in other forums is permitted, provided the original author(s) and the copyright owner(s) are credited and that the original publication in this journal is cited, in accordance with accepted academic practice. No use, distribution or reproduction is permitted which does not comply with these terms.
*Correspondence: Viktor Kaufmann, dmlrdG9yLmthdWZtYW5uQHR1Z3Jhei5hdA==