 Tamás Várnai
 Alexander Marshak
 Alexander Kostinski3
- 1Joint Center for Earth Systems Technology, University of Maryland Baltimore County, Baltimore, MD, United States
- 2NASA Goddard Space Flight Center, Greenbelt, MD, United States
- 3Department of Physics, Michigan Technological University, Houghton, MI, United States
Satellite images often feature sun glints caused by the specular reflection of sunlight from water surfaces or from horizontally oriented ice crystals occurring in clouds. Such glints can prevent accurate retrievals of atmospheric and surface properties using existing algorithms, but the glints can also be used to infer more about the glint-causing objects—for example about the microphysical properties and radiative effects of ice clouds. This paper introduces the recently released operational glint product of the Earth Polychromatic Camera (EPIC) onboard the Deep Space Climate Observatory (DSCOVR) spacecraft. Most importantly, the paper describes the algorithm used for generating the key component of the new product: a glint mask indicating the presence of sun glint caused by the specular reflection of sunlight from ice clouds and smooth water surfaces. After describing the glint detection algorithm and glint product, the paper shows some examples of the detected glints and discusses some basic statistics of the glint population in a yearlong dataset of EPIC images. These statistics provide insights into the performance of glint detection and point toward possibilities for using the glint product to gain scientific insights about ice clouds and water surfaces.
Introduction
Sun glints often affect Earth observations taken from a wide range of spacecrafts, for example from the polar-orbiting Terra and Aqua satellites, the Geostationary Operational Environmental Satellite (GOES) series, or Deep Space Climate Observatory (DSCOVR). The glints are caused by the specular reflection of sunlight through single scattering from highly reflective objects. Such objects include the ocean or other water surfaces and ice crystals that float in clouds at a horizontal orientation and reflect sunlight as a mirror consisting of a myriad of tiny pieces (e.g., Lynch et al., 1994; Lynch and Livingston, 2001; Konnen, 2017). Ice crystals of certain shapes—especially hexagonal plates—float in clouds at a systematic horizontal orientation due to stabilizing aerodynamic forces. This orientation is stable, because, as Katz (1998) put it: “…if the plate tilts, the wake of the leading edge partly shields the trailing edge from the flow, reducing the drag on it; the resulting torque restores the horizontal orientation…”.
In many cases, Sun glints prevent the accurate retrievals of atmospheric and surface properties using existing algorithms (e.g., Wang and Bailey, 2001; Remer et al., 2005), but the glints can also be used to learn more about the glint-causing objects (e.g., Bréon and Henriot, 2006; Lin et al., 2016) or even about atmospheric aerosols (Kaufman et al., 1997; Ottaviani et al., 2013; Knoebelspiesse et al., 2021).
Over the past 2 decades, several studies examined ice clouds using glint observations taken from low-Earth orbit satellites. Some studies characterized clouds using polarized measurements of Sun glint taken by the POLDER (Polarization and Directionality of the Earth’s Reflectances) instrument (Chepfer et al., 1999; Bréon and Dubrulle, 2004; Noel and Chepfer, 2004), while others used glint (that is, specular reflection) affecting Cloud-Aerosol Lidar with Orthogonal Polarization (CALIOP) lidar returns (e.g., Noel and Chepfer, 2010; Kikuchi et al., 2021). These studies provided numerous insights about the horizontally oriented ice crystals causing the glints, but some critical questions remain unresolved—for example, as Zhou et al., 2013 noted, it is still unclear how common these crystals are.
This paper discusses the detection of glints in images taken by the Earth Polychromatic Camera (EPIC) onboard DSCOVR spacecraft (Marshak et al., 2018). DSCOVR orbits the Sun at the L1 Lagrangian point located about 1.5 million km away from Earth, which allows EPIC to constantly view almost the entire sunlit side of Earth. EPIC captures about 22 multispectral images per day between late April and early September, and about 13 images per day during the rest of the year.
EPIC offers excellent opportunities to study glint-causing ice clouds. EPIC data is especially well-suited for identifying and analyzing glint signals from clouds because, unlike most other satellite instruments, EPIC uses a filter wheel to take images at multiple wavelengths. This helps because using a filter wheel means that EPIC takes the images at each wavelength at slightly different times. For example, red (680 nm) images are taken about 4 min after blue (443 nm) images. During these few minutes, the Earth’s rotation changes the normal direction of the observed scenes by about a degree (moving the scenes by more than 100 km), which can affect whether EPIC observations at a specific wavelength will capture or miss any narrowly focused specular reflection from ice clouds or smooth water surfaces. Therefore, sharp brightness differences between EPIC images taken a few minutes apart can identify Sun glints.
In recent years, several studies used EPIC images to study glints from ice clouds (Marshak et al., 2017; Li et al., 2019; Várnai et al., 2020a; Várnai et al., 2020b; Kostinski et al., 2021). These studies showed that Sun glint from ice clouds appears quite frequently in EPIC images (e.g., Marshak et al. (2017) and found that one in three images with land in the center contains a glint from an ice cloud), explored issues such as spectral and seasonal variations in glint reflectances, and even used glints for testing the accuracy of geolocation of EPIC images (Kostinski et al., 2021).
This paper describes an algorithm developed for the automatic detection of Sun glint from clouds and smooth water surfaces that occur in EPIC images. This algorithm is used in generating the recently released EPIC operational glint data product (https://epic.gsfc.nasa.gov/science/products/glint) that provides glint identification for the entire EPIC data series. After describing the glint detection algorithm and the operational glint product in Section Glint Detection Algorithm and in the Appendix, respectively, Section Initial Examination of Glint Product provides initial analysis of the new glint product using both individual examples and through a brief statistical analysis of the detected glints. Finally, Section Summary offers a brief summary.
Glint Detection Algorithm
Basic Approach
The operational glint detection algorithm is based on the approach first introduced in Marshak et al. (2017). The algorithm works by comparing two EPIC observations of the same scene taken at slightly different geometry: one image that captures any tightly focused specular reflection from horizontal objects in the scene, and another image that narrowly misses any such reflection, as the scene has a slightly different sun-view geometry in this second image. In glint studies, the sun-view geometry is often characterized through the glint angle (δ), which is defined as the angle between the actual satellite view direction and the direction that would look straight into the specular reflection from a perfectly horizontal surface. The algorithm reports a glint if the reflectance (R) is much higher for the observation that can capture the glint because of its smaller glint angle.
Earlier studies showed that the specular reflection from ice clouds extends to glint angles of about 2° (e.g., Várnai et al., 2020a; Kostinski et al., 2021) due factors such as: 1) the roughly 0.5° angular diameter of the solar disc, 2) wobbling that can tilt horizontally oriented crystals by up to 1° in ice clouds due to local turbulence effects (e.g., Katz, 1998; Bréon and Dubrulle, 2004), 3) diffraction that occurs when sunlight encounters very small ice crystals (e.g., Crawford, 1968), 4) small ripples or capillary waves in mostly smooth water surfaces. We note that if wind and currents make water rough, the wide range of wave slopes will spread specular reflection into a wide range of view directions, which makes glints appear larger but fainter in satellite images (Várnai et al., 2020a). The current operational product, however, aims at detecting glints from clouds and smooth water surfaces (for example from calm small lakes (a few km in diameter), as in Kostinski et al., 2021); extending the product to also detect diffuse glints from rough water surfaces (for example using the model developed in Cox and Munk (1954)) is left to the future.
As mentioned in the introduction, EPIC can provide observations of a scene at several glint angles because it takes multispectral observations using a filter wheel—which means that it captures images at different wavelengths at slightly different times. For example, the 388 nm ultraviolet (UV) images are taken about 5 min after blue images. During these 5 min, the Earth’s rotation changes the normal direction of the observed scenes by 1.25°. Considering the law of reflection, a 1.25° change in the orientation of the reflector will change the direction of specularly reflected light by 2.5°. Thus, if δ was 0° for a pixel in the blue image, δ will be 2.5° in the UV image. This means that if the pixel contains a large number of horizontally oriented ice crystals that cause a strong glint through specular reflection, EPIC data can reveal this by showing that
We note, however, that EPIC can detect even faint glints for which Eq. 1 is not satisfied. Faint glints don’t satisfy Eq. 1 because, in the absence of glint, Rblue < RUV due to the stronger Rayleigh scattering at shorter wavelengths—and so faint glints may lift Rblue only to be comparable or slightly larger than RUV. As described below, the EPIC glint detection can identify such faint glints by using thresholds that specify what Rblue values imply glint for a given RUV.
As a preparation for the in-depth description of the glint detection algorithm, let us mention three considerations:
• We will describe the detection process only for blue glints, as the operational processing uses the exact same method for green (551 nm) and red glints (except that we use in Eq. 1 Rgreen or Rred instead of Rblue as the “glint wavelength”, and we can use Rblue instead of RUV as the “non-glint wavelength”).
• Since the basis for glint detection lies in specular reflection causing higher reflectances for smaller glint angles, the process for detecting blue glints does not consider any pixels where the glint angle is larger in the blue image than in the UV image.
• The algorithm needs to avoid false glint detections when clouds that are just outside a pixel in the UV image appear inside the pixel in the blue image because of wind drift, cloud growth, or differences in the exact location of pixel boundaries in the blue and UV images. Thus, the algorithm follows Marshak et al. (2017) and uses not the RUV of the pixel itself, but the maximum reflectance within a 3 × 3 pixel area centered on the pixel.
Ultimately, the algorithm flags a pixel as blue glint if Rblue > T (RUV), where T (RUV) is a threshold function value determined by taking into account spectral variations in scene reflectivity. Since spectral variations can be markedly different over different surfaces, the operational algorithm uses separate T threshold functions for three basic surface types: water, desert, and non-desert land. The surface type at the location of each EPIC pixel is determined from the 0.05° latitude-longitude resolution global map of surface cover provided in the MCD12C1 product of the Moderate Resolution Imaging Spectroradiometer (MODIS) instrument (DOI: 10.5067/MODIS/MCD12C1.006). The exact method for determining the T (RUV) threshold function values for the entire range of possible RUV values is described in the next section.
Threshold Selection
Admittedly, the selection of glint detection thresholds is somewhat arbitrary and involves a trade-off between accuracy and sensitivity. As usual, if we prioritize accuracy and use very strict thresholds, we will miss detecting some not-so-clear-cut cases affected by relatively faint glints. On the other hand, if we prioritize sensitivity, we will capture not only actual glints but will likely have many false detections as well. The EPIC glint product uses T glint detection thresholds that result in a False Alarm Rate (FAR) of 10%. This means that in 10% of pixels flagged as glint, Rblue exceeds T (RUV) not because of glint, but because of other factors such as strong spectral variations in surface albedo—for example if a red dust plume drifts over the blue ocean.
We determine the glint detection thresholds using a pragmatic statistical approach. This approach avoids the need for physical modeling, which would be greatly complicated by variations in surface spectral properties and in the areal extent, altitude, phase, and optical thickness of clouds (which may also vary within the roughly 8 by 8 km-size EPIC pixels). We note, however, that the absence of physical modeling does not mean the lack of physical basis or constraints: The physics of specular reflection is essential to the method as it is based on glints being limited to locations with suitable sun-view geometries and relies on the constraint that glint from clouds have a narrow angular spread (typically less than 2°).
In determining what T thresholds will result in a FAR of 10%, we will rely on the statistical probabilities (P) that, for a random pixel, Rblue exceeds T (RUV) due to any (glint or non-glint) reason (Pany) or due to non-glint factors (Png), respectively. Specifically, we state that non-glint factors do not vary much at small glint angles
We use Eq. 2 in determining the T (RUV) thresholds for each possible RUV value through a three-step statistical analysis of all EPIC images taken during 2018. First, for each possible RUV value, we calculate the probability distribution functions PDF(Rblue | RUV, δ < 2°) and PDF(Rblue | RUV, 2° < δ < 5°). Second, for each possible RUV, we calculate Pany for a wide range of candidate T values as
and
Third, for each RUV, we select the T value that, in Eqs 3a, 3b, yields such Pany values that, in Eq. 2, will give a FAR close to 0.1 (Figure 1).
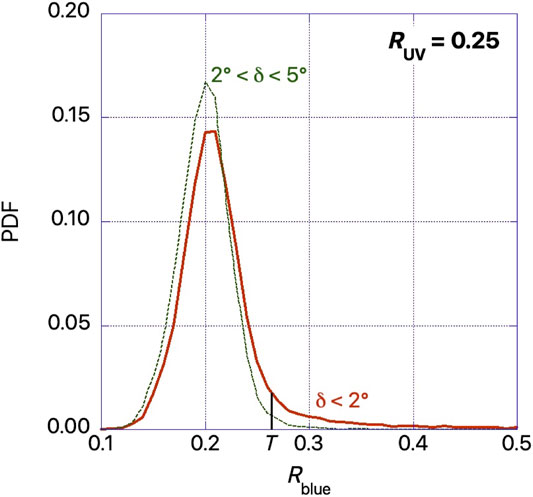
FIGURE 1. Illustration of threshold selection for the detection of blue glints over non-desert land at pixels where the 388 nm UV reflectance is 0.25. The green solid and red dashed curves show the PDFs based on all EPIC images taken in 2018 for two different ranges of the glint angle (δ). Cloud glints often enhance reflectances < 2°, thus creating the long tail of the red curve. The black vertical bar indicates the T threshold value that was selected because it leads to a 10% false alarm ratio: The area to the right of this line [representing an integral in Eq. (2)] is 10 times smaller under the green (no glint) curve than under the red (glint-affected) curve.
Finally, for robust glint detections, we need to consider that the T (RUV) threshold functions determined through the procedure described above can feature random jumps or drops due to sampling noise caused by the finite size of our dataset (containing all EPIC images taken in 2018). To avoid such unphysical jumps and drops, the raw T values are adjusted through a series of three smoothing operations:
• Resetting to zero the PDF values for RUV bins containing three or fewer pixels,
• Fitting a fourth or eighth order polynomial to the raw T (RUV) functions (eighth order is used when this reduces the root mean square error of the fit by at least 10%),
• Using linear extrapolation of T (RUV) to obtain thresholds outside the range of RUV values observed in 2018.
The final T thresholds obtained at the end of this smoothing process are illustrated in Figure 2. The figure shows that the T threshold values are capped at the saturation level of the EPIC blue detector (Rblue ≈ 1.3), as it would be pointless to set a threshold higher than any reflectance reported by EPIC. At lower reflectances, T increases with RUV; the discernible changes in the slope of this increase are likely caused by transitions from clear sky to partly and then fully cloudy situations as RUV increases.
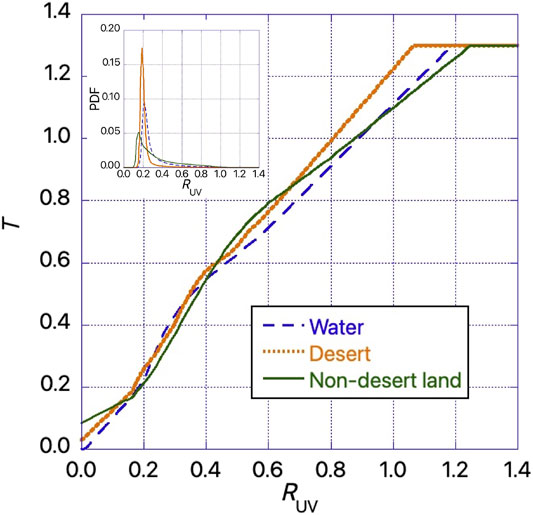
FIGURE 2. Threshold values used in the detection of blue glints. Pixels are flagged as glint if their blue reflectance exceeds the T threshold value for the pixel’s 388 nm reflectance RUV. The inset shows the PDFs of RUV for the three surface types, indicating that the most frequently used threshold values occur at moderate RUV values.
Glint Detection Algorithm
Using the basic approach described in Section Basic Approach and the thresholds discussed in Section Threshold Selection, the operational algorithm detects blue glints through the following process:
• Eliminate EPIC images if data for any of the bands used by the algorithm is missing.
• Cycle through each pixel in the image and eliminate pixels if δ > 2° or if δblue > δUV. This occurs if the distance from the specular point (where δ = 0°) exceeds about 100 km.
• Identify the surface type of the pixel based on its coordinates and a global map of surface types (obtained from the MODIS MCD12C1 surface cover product).
• Based on the surface type and RUV (the maximum 388 nm reflectance in the 3 × 3 pixel area around the pixel), select the T glint detection threshold value to be used.
• Flag the pixel as glint if Rblue > T, or as non-glint if Rblue ≤ T.
Initial Examination of Glint Product
This section discusses an initial examination of the glint product. In the absence of independent datasets that could make the traditional validation of the new EPIC glint product possible, this section provides insights about the performance and characteristics of the new product first by showing a few examples of the operational glint mask, and then by presenting an initial statistical analysis of glint detection results.
Glint Examples
Figure 3 shows glint detection results for four EPIC images, three containing glints from ice clouds and one from the smooth ocean surface. Additional examples can be found at the EPIC website at https://epic.gsfc.nasa.gov/science/products/glint.
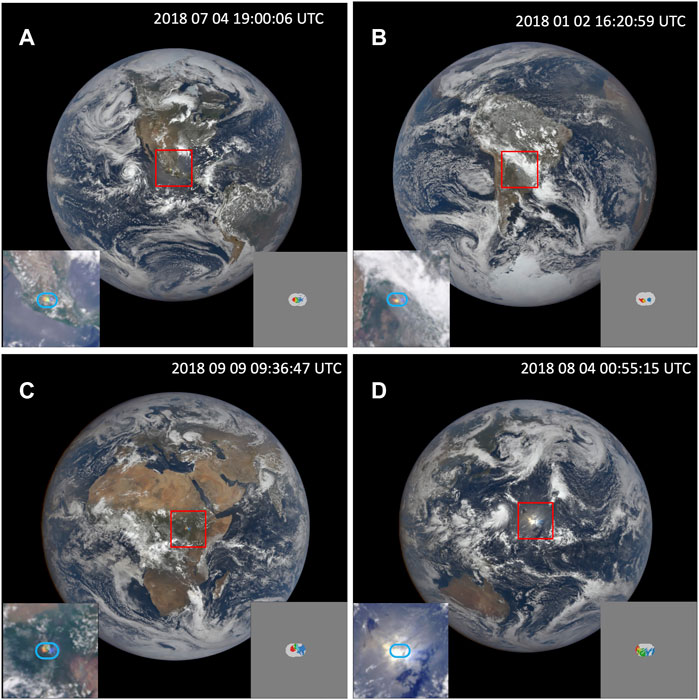
FIGURE 3. Sample sun glints caused by specular reflection from ice crystals in clouds (A–C) and from smooth ocean surface (D). The insets show the glint-affected areas in detail (left inset), as well as the EPIC glint mask (right inset). Different colors in this rendering of the glint mask indicate which wavelength(s) in the EPIC observations are affected by glint, with yellow and turquoise indicating the overlap of red and green, or blue and green glints, respectively. Light grey means “no glint”, while dark gray indicates that no glint detection is attempted as the glint angle exceeds 2°.
Figure 3A shows the glint displayed in Figure 1 of Várnai et al. (2020b). The figure illustrates that in case of extensive ice clouds, EPIC images can feature a colorful pattern in which the eastern and western edges of the glint appear blue and red, respectively, while the middle appears green. Green and especially red glints appear to the west of blue glints because EPIC takes the red (green) images 4 (3) minutes after taking the blue image—and during this time, the rotation of Earth brings a more westward location into the position where EPIC can observe specular reflection from horizontal objects. The typical distance between blue and red glints is about 100 km.
Figure 3B illustrates that glints affecting different EPIC bands can overlap, for example the overlap of red and green glints creates a yellow glint.
Figure 3C shows that in rare occasions, cloud glints can extend all the way up to 2° glint angle. This may indicate intense turbulence that increases the wobbling of horizontally oriented ice crystals.
Figure 3D shows a bright glint from the smooth ocean surface. For two reasons, we believe that while clouds may contribute to the glint at a few pixels, the vast majority of this glint originates from the water surface and not from clouds. First, the glint extends to a much larger area (and larger glint angles) than any cloud glints EPIC observed over land. The presence of glint at even large glint angles indicates that while the reflecting object may be smooth for a water surface, it is not nearly as uniformly flat as the horizontal ice crystals are in clouds. Second, for almost all glint pixels, the oxygen A-band ratios (R764 nm/R780 nm) are below the 0.45 threshold that has been proposed to distinguish surface and cloud glints (Várnai et al., 2020b). We point out that the glint mask readily detects this bright glint, but it does not detect the relatively faint diffuse glints from rough ocean surfaces, which appear relatively dark grey in the image. We note that such diffuse glints from rough ocean surfaces have been detected in images of several satellite instruments such as MODIS or the Multi-angle Imaging SpectroRadiometer (MISR) (e.g., Feng et al., 2017; Knobelspiesse et al., 2021).
Finally, a comparison of glint latitudes in Figure 3 illustrates that, as discussed in Marshak et al. (2017), the latitude of glint observations shifts with the seasons, with glints being detected in the Northern Hemisphere in July (Panel A), in the Southern Hemisphere in January (Panel B), and around the equator in September and April (Panels C and D).
Glint Statistics
Following the individual examples discussed above, this section presents some basic statistics about the glints detected by the operational algorithm in all EPIC images taken during 2017. The goal of this initial statistical analysis lies not in providing physical insights on atmospheric or surface properties, but in getting an initial glimpse of glint product behaviors. (We note that statistics for 2018 were very similar to those for 2017, but the examination of interannual variability is left to a future study of the entire EPIC data series.)
Figure 4 shows what fraction of pixels were flagged as glint for various surface types and glint colors, as a function of glint angle. The figure reveals several notable features discussed below.
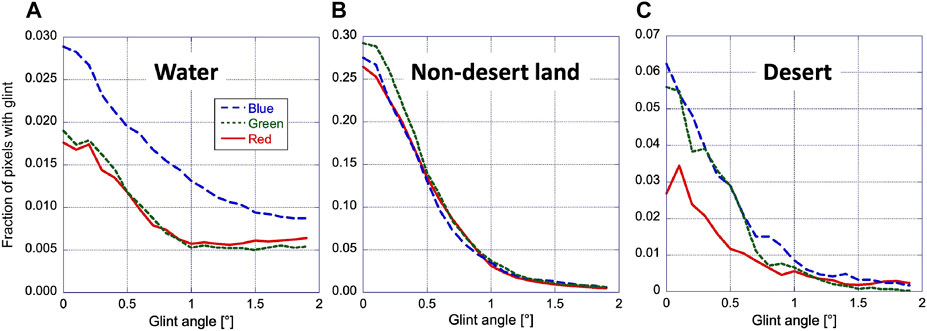
FIGURE 4. Fraction of all pixels for which the glint mask indicates the presence of glint, plotted separately for each surface type and EPIC band as a function of glint angle (the angle between the actual EPIC view direction and the direction of looking straight into the specular reflection from a perfectly horizontal surface). As discussed in the text, the differences in glint detection frequency over various surface types come from a combination of differences in ice cloud populations and in glint detection sensitivity.
The dominant feature of all panels in Figure 4 is a sharp increase in the fraction of pixels with glint at small glint angles. This is consistent with glint reflectances being largest at small glint angles (e.g., Várnai et al., 2020a; Várnai et al., 2020b; Kostinski et al., 2021) and can be attributed to specular reflection from horizontally oriented ice crystals in clouds and from very smooth water surfaces (such as small, calm lakes, as in Kostinski et al., 2021).
Figure 4A reveals that glints are detected more frequently in the blue EPIC band than in the green and red bands. (The figure considers all glints regardless of whether they come from the surface or clouds.) Green and red glints may be detected less frequently because, similarly to green (or red) glints, glintless white clouds also increase the ratios of green to blue reflectances or red to blue reflectances—which makes it harder to identify glints with a high confidence. The panel also shows that glint detections do not drop to zero at larger glint angles, probably due to somewhat wavy water surfaces that spread specular reflection into a wider range of glint angles.
A comparison of the peak values in Panels a, b, and c reveals that, even for blue glints, glint detection is much less frequent over ocean than land. Considering that about a third of land pixels is classified desert in our dataset, the land-ocean difference is roughly 7-fold, which is roughly twice as large as the factor of 3.5 between glint-caused reflectance enhancements over land and ocean in Figure 2A of Várnai et al. (2020b). This may show that it is harder to identify individual glints over ocean than over land and calls for future improvements in the detection of ice cloud glints over ocean.
The combination of Panels b and c shows that for very small glint angles, glints are detected at about 22% of all observations taken over land. Considering that at the latitudes of EPIC glint observations, the average ice cloud cover above land varies between 20 and 50% during the course of a year (Várnai et al., 2020b, based on King et al., 2013), finding glints in 22% of pixels suggests that glint detection over land is highly effective and that horizontally oriented crystals are quite prevalent in ice clouds. It is important to keep in mind, though, that glint may be observed even if horizontal ice crystals occur only in a portion of a typically 8 by 8 km size EPIC pixel. This implies that horizontal ice crystals likely occur over less than 22% of the actual land area. Moreover, we note that while the sharp drop-off in glint probability with glint angle suggests a dominance of such almost perfectly horizontal surfaces that seem more likely in clouds than in lakes or rivers, future studies will be needed to estimate the relative frequencies of cloud and surface glints.
The comparison of Panels b and c reveals that glints are detected less frequently over desert than non-desert land, due to the lower frequency of ice clouds (and lakes). Finally, we point out that over desert, red glints are detected less frequently than green or blue glints. This seems to indicate that changes in mineral composition of the typically brownish desert can create red patches even without glint, which makes it more difficult to identify red glints with high confidence.
By displaying the number and typical size of glints, Table 1 shows that over all surface types, glints are more frequently detected for the EPIC blue band than for the green or red bands—but also that blue glints are systematically smaller than green or red ones. Overall, the total glint area is similar for all bands over non-desert land, whereas over water and desert, blue glints cover the largest areas despite their smaller sizes.
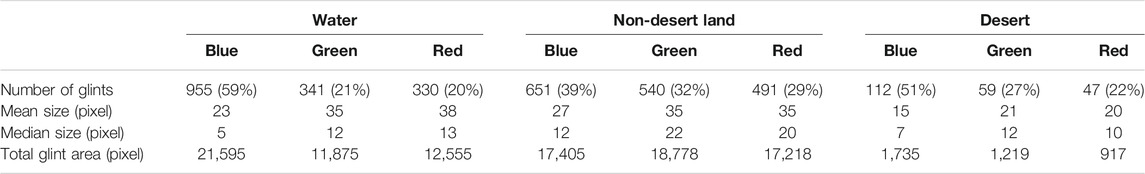
TABLE 1. Number and size of glints detected by the EPIC glint product. The numbers in parentheses indicate, what the fraction of all glints detected over a certain surface type are detected at each color.
Over water, blue glints may cover the largest areas due to the higher effectiveness of blue glint detection mentioned above. Similarly, the higher detection effectiveness discussed at Figure 3C may explain why, over desert, blue glints cover larger areas than red glints. The difference between the total area of blue and green glints over desert comes from small blue glints detected at relatively large (>1°) glint angles (Figure 3C), but future studies will be needed to explain these glints.
Finally, we note that for all surface types and EPIC bands, the median of the glint size is much smaller than the mean. This implies that glint size distributions have long tails toward large sizes, indicating a significant occurrence of very large glints. Such large glints may occur in cases of extensive ice cloud cover or large calm water surfaces (as in Figures 3C,D) but, detector saturation artifacts may also play a role (as in the lower right panel of Figure 1 in Marshak et al., 2017). As discussed in the next section, the origin of large—and small—glints can be best explored using additional information not present in the current, initial version of the EPIC operational glint product.
Summary
This paper described the recently released operational glint product of the Earth Polychromatic Camera (EPIC) onboard the Deep Space Climate Observatory (DSCOVR) spacecraft. First, the paper outlined the basic approach used for obtaining the key parameter provided in the product: a glint mask that identifies glints caused by the specular reflection of sunlight from ice clouds and smooth water surfaces. This mask can help in identifying cases when various EPIC products may be less accurate due to the effects of glints and can also help in learning more about the glint-causing clouds or water bodies.
Building on earlier studies (Marshak et al., 2017; Várnai et al., 2020a), glints are detected by comparing two EPIC images having slightly different sun-view geometries: One capturing the glint and the other missing the glint’s narrowly focused intense specular reflection. Pixels are flagged as glint if their reflectances in the two images differ substantially. After outlining the general approach, the paper described the glint detection algorithm in detail—including, the method used for obtaining glint detection thresholds that keep the likelihood of erroneous (“false”) detections below 10%.
After describing the glint detection process, the paper illustrated various features of the detected glints and provided basic statistics of the glint population observed in a yearlong dataset of EPIC images. These examples and statistics characterized glint populations and yielded insights into the performance of glint detection, and help guiding both future product development and scientific usage. For example, the results indicated a substantial underdetection of cloud glints over ocean, as glints from the water surface (that are often too wide to be detected by our method) made it harder to identify cloud glints with a high confidence. We expect to study this underdetection and improve the detection of glint pixels in the future.
While the current paper considered only the glint product by itself, the main scientific benefits will likely come from combining the glint product with other information. For example, the glint product could be combined with EPIC data on oxygen absorption, with visible EPIC reflectances, or with cloud products from other satellites. EPIC observations in the oxygen A and B absorption bands could help in determining whether glints are caused by water surfaces or ice clouds (Marshak et al., 2017; Várnai et al., 2020a). The initial analysis of oxygen absorption band data for the detected glints indicate behaviors that are very similar to those in earlier studies. For example, oxygen A-band histograms over ocean suggest that just under two-thirds (≈64%) of blue glints come from the ocean surface, very close to the 60% indicated by Figure 2A of Várnai et al. (2020a). Over land, the histogram of blue glint oxygen A-band ratios (R764 nm/R780 nm) peaked at 0.36—close to 0.37 peak in Figure 3A of Marshak et al. (2017) that suggested typical cloud altitudes around 5–8 km. Further analysis [considering the EPIC cloud product (Yang et al., 2019) as well] is expected to yield more details about the altitude and temperature of clouds producing glints. (We note that studying blue glints appears most promising, as the location of these glints are least likely to be affected by cloud glints at the wavelengths used by the EPIC cloud product.) In addition, EPIC visible reflectances could help estimate reflectance enhancements caused by glints (Várnai et al., 2020a; Várnai et al., 2020b) and from this, the fraction of horizontally oriented ice crystals in ice clouds. Other collocated datasets—for example global reanalyses or cloud products from satellites that view the glint area from directions not affected by glint—could help identify conditions favoring the formation of horizontally oriented ice crystals and provide new information on the microphysical and radiative properties of ice clouds.
Data Availability Statement
This paper discusses and analyzes publicly available datasets that can be obtained at https://asdc.larc.nasa.gov/project/DSCOVR/DSCOVR_EPIC_L2_GLINT_01.
Author Contributions
TV developed the presented glint detection algorithm and performed the data analysis. AM helped in the algorithm development and participated in data analysis. AK participated in the data analysis. All authors contributed to the writing and editing of the manuscript.
Funding
This work was supported in part by the NASA DSCOVR Project and in part by the National Science Foundation (NSF) under Grant AGS-1639868.
Conflict of Interest
The authors declare that the research was conducted in the absence of any commercial or financial relationships that could be construed as a potential conflict of interest.
Publisher’s Note
All claims expressed in this article are solely those of the authors and do not necessarily represent those of their affiliated organizations, or those of the publisher, the editors and the reviewers. Any product that may be evaluated in this article, or claim that may be made by its manufacturer, is not guaranteed or endorsed by the publisher.
Acknowledgments
We thank Marshall Sutton and the Atmospheric Science Data Center at the NASA Langley Research Center for incorporating the glint detection code into the operational processing of DSCOVR data.
References
Bréon, F.-M., and Dubrulle, B. (2004). Horizontally Oriented Plates in Clouds. J. Atmos. Sci. 61, 2888–2898. doi:10.1175/jas-3309.1
Bréon, F. M., and Henriot, N. (2006). Spaceborne Observations of Ocean Glint Reflectance and Modeling of Wave Slope Distributions. J. Geophys. Res. 111, C06005. doi:10.1029/2005JC003343
Chepfer, H., Brogniez, G., Goloub, P., Bréon, F. M., and Flamant, P. H. (1999). Observations of Horizontally Oriented Ice Crystals in Cirrus Clouds with POLDER-1/ADEOS-1. J. Quantitative Spectrosc. Radiative Transfer 63, 521–543. doi:10.1016/S0022-4073(99)00036-9
Cox, C., and Munk, W. (1954). Measurement of the Roughness of the Sea Surface from Photographs of the Sun's Glitter. J. Opt. Soc. Am. 44, 838–850. doi:10.1364/JOSA.44.000838
Feng, L., Hu, C., Barnes, B. B., Mannino, A., Heidinger, A. K., Strabala, K., et al. (2017). Cloud and Sun‐glint Statistics Derived from GOES and MODIS Observations over the Intra‐Americas Sea for GEO‐CAPE mission Planning. J. Geophys. Res. Atmos. 122, 1725–1745. doi:10.1002/2016JD025372
Katz, J. I. (1998). Subsuns and Low Reynolds Number Flow. J. Atmos. Sci. 55, 3358–3362. doi:10.1175/1520-0469(1998)055<3358:salrnf>2.0.co;2
Kaufman, Y. J., Tanré, D., Gordon, H. R., Nakajima, T., Lenoble, J., Frouin, R., et al. (1997). Passive Remote Sensing of Tropospheric Aerosol and Atmospheric Correction for the Aerosol Effect. J. Geophys. Res. 102, 16815–16830. doi:10.1029/97JD01496
Kikuchi, M., Okamoto, H., and Sato, K. (2021). A Climatological View of Horizontal Ice Plates in Clouds: Findings from Nadir and Off‐Nadir CALIPSO Observations. Geophys. Res. Atmos. 126, e2020JD033562. doi:10.1029/2020JD033562
Knobelspiesse, K., Ibrahim, A., Franz, B., Bailey, S., Levy, R., Ahmad, Z., et al. (2021). Analysis of Simultaneous Aerosol and Ocean Glint Retrieval Using Multi-Angle Observations. Atmos. Meas. Tech. 14, 3233–3252. doi:10.5194/amt-14-3233-2021
Können, G. P. (2017). Rainbows, Halos, Coronas and Glories: Beautiful Sources of Information. Bull. Amer. Meteorol. Soc. 98, 485–494. doi:10.1175/BAMS-D-16-0014.1
Kostinski, A., Marshak, A., and Várnai, T. (2021). Deep Space Observations of Terrestrial Glitter. Earth Space Sci. 8, e2020EA001521. doi:10.1029/2020EA001521
Li, J.-Z., Fan, S., Kopparla, P., Liu, C., Jiang, J. H., Natraj, V., et al. (2019). Study of Terrestrial Glints Based on DSCOVR Observations. Earth Space Sci. 6, 166–173. doi:10.1029/2018EA000509
Lin, Z., Li, W., Gatebe, C., Poudyal, R., and Stamnes, K. (2016). Radiative Transfer Simulations of the Two-Dimensional Ocean Glint Reflectance and Determination of the Sea Surface Roughness. Appl. Opt. 55, 1206–1215. doi:10.1364/ao.55.001206
Lynch, D. K., Gedzelman, S. D., and Fraser, A. B. (1994). Subsuns, Bottlinger's Rings, and Elliptical Halos. Appl. Opt. 33, 4580–4589. doi:10.1364/AO.33.004580
Lynch, D. K., and Livingston, W. (2001). Color and Light in Nature. Cambridge, U.K.: Cambridge Univ. Press.
Marshak, A., Herman, J., Adam, S., Karin, B., Carn, S., Cede, A., et al. (2018). Earth Observations from DSCOVR EPIC Instrument. Bull. Amer. Meteorol. Soc. 99, 1829–1850. doi:10.1175/BAMS-D-17-0223.1
Marshak, A., Várnai, T., and Kostinski, A. (2017). Terrestrial Glint Seen from Deep Space: Oriented Ice Crystals Detected from the Lagrangian point. Geophys. Res. Lett. 44, 5197–5202. doi:10.1002/2017GL073248
Noel, V., and Chepfer, H. (2010). A Global View of Horizontally Oriented Crystals in Ice Clouds from Cloud-Aerosol Lidar and Infrared Pathfinder Satellite Observation (CALIPSO). J. Geophys. Res. 115, D00H23. doi:10.1029/2009JD012365
Noel, V., and Chepfer, H. (20042004). Study of Ice crystal Orientation in Cirrus Clouds Based on Satellite Polarized Radiance Measurements. J. Atmos. Sci. 61, 2073–2081. doi:10.1175/1520-0469(2004)061<2073:soicoi>2.0.co;2
Ottaviani, M., Knobelspiesse, K., Cairns, B., and Mishchenko, M. (2013). Information Content of Aerosol Retrievals in the Sunglint Region. Geophys. Res. Lett. 40, 631–634. doi:10.1002/grl.50148
Remer, L. A., Kaufman, Y. J., Tanré, D., Mattoo, S., Chu, D. A., Martins, J. V., et al. (2005). The MODIS Aerosol Algorithm, Products, and Validation. J. Atmos. Sci. 62, 947–973. doi:10.1175/JAS3385.1
Várnai, T., Kostinski, A. B., and Marshak, A. (2020a). Deep Space Observations of Sun Glints from marine Ice Clouds. IEEE Geosci. Remote Sensing Lett. 17, 735–739. doi:10.1109/LGRS.2019.2930866
Várnai, T., Marshak, A., and Kostinski, A. B. (2020b). Deep Space Observations of Cloud Glints: Spectral and Seasonal Dependence. IEEE Geosci. Remote Sensing Lett., 1–5. doi:10.1109/LGRS.2020.3040144
Wang, M., and Bailey, S. W. (2001). Correction of Sun Glint Contamination on the SeaWiFS Ocean and Atmosphere Products. Appl. Opt. 40, 4790–4798. doi:10.1364/ao.40.004790
Yang, Y., Meyer, K., Wind, G., Zhou, Y., Marshak, A., Platnick, S., et al. (2019). Cloud Products from the Earth Polychromatic Imaging Camera (EPIC): Algorithms and Initial Evaluation. Atmos. Meas. Tech. 12, 2019–2031. doi:10.5194/amt-12-2019-2019
Zhou, C., Ping Yang, P., Dessler, A. E., and Faming Liang, F. (2013). Statistical Properties of Horizontally Oriented Plates in Optically Thick Clouds from Satellite Observations. IEEE Geosci. Remote Sensing Lett. 10, 986–990. doi:10.1109/LGRS.2012.2227451
Appendix
Description of Glint Product Files
The operational EPIC glint product generated by the method described above is publicly available at the NASA Atmospheric Science Data Center (ASDC) at https://eosweb.larc.nasa.gov. There is a separate glint product file for each individual EPIC image, with each file containing three parameters for each pixel: Surface type, glint angle, and glint mask.
• The surface type flag shows whether the area of a pixel is covered mainly by water (value = 0), desert (value = 2), or non-desert land (value = 1)
• The glint angle tells how favorable the EPIC view direction is for glint detection and can help in using glints for inferring scene properties.
• The glint mask indicates whether or not glint has been detected (1 = glint, 0 = no glint).
We mention that while the surface type flag is provided in a 2-D array that (matching the EPIC image size) contains 2048 rows and 2048 columns, the glint angle and glint mask values are provided in 3-D arrays containing 2048 rows, 2048 columns, and three layers (one layer for each of the blue, green, and red spectral bands). In order to reduce the data volume by enabling a more effective file compression, the values of all parameters are set to −1 for pixels where glint detection is not attempted as the glint angle exceeds 2°.
Keywords: EPIC, sun glint, ice cloud, horizontally oriented particles, operational product, DSCOVR
Citation: Várnai T, Marshak A and Kostinski A (2021) Operational Detection of Sun Glints in DSCOVR EPIC Images. Front. Remote Sens. 2:777806. doi: 10.3389/frsen.2021.777806
Received: 15 September 2021; Accepted: 29 October 2021;
Published: 18 November 2021.
Edited by:
Yongxiang Hu, Langley Research Center, National Aeronautics and Space Administration (NASA), United StatesReviewed by:
Jun Wang, The University of Iowa, United StatesBastiaan Van Diedenhoven, Netherlands Institute for Space Research (NWO), Netherlands
Copyright © 2021 Várnai, Marshak and Kostinski. This is an open-access article distributed under the terms of the Creative Commons Attribution License (CC BY). The use, distribution or reproduction in other forums is permitted, provided the original author(s) and the copyright owner(s) are credited and that the original publication in this journal is cited, in accordance with accepted academic practice. No use, distribution or reproduction is permitted which does not comply with these terms.
*Correspondence: Tamás Várnai, dGFtYXMudmFybmFpQG5hc2EuZ292