 Nadja den Besten1,2*
 Susan Steele-Dunne3
 Benjamin Aouizerats1Ariel Zajdband4Richard de Jeu1Pieter van der Zaag2,5
- 1VanderSat B.V., Agri, Food, and Commodity unit, Haarlem, Netherlands
- 2Department of Water Management, Delft University of Technology, Delft, Netherlands
- 3Department of Geoscience and Remote Sensing, Faculty of Civil Engineering and Geosciences, Delft University of Technology, Delft, Netherlands
- 4Planet, San Francisco, CA, United States
- 5IHE Delft Institute for Water Education, Delft, Netherlands
In this study the impact of sucrose accumulation in Sentinel-1 backscatter observations is presented and compared to Planet optical observations. Sugarcane yield data from a sugarcane plantation in Xinavane, Mozambique are used for this study. The database contains sugarcane yield of 387 fields over two seasons (2018-2019 and 2019-2020). The relation between sugarcane yield and Sentinel-1 VV and VH backscatter observation is analyzed by using the Normalized Difference Vegetation Index (NDVI) data as derived from Planet Scope optical imagery as a benchmark. The different satellite observations were compared over time to sugarcane yield to understand how the relation between the observations and yield evolves during the growing season. A negative correlation between yield and Cross Ratio (CR) from Sentinel-1 backscatter was found while a positive correlation between yield and Planet NDVI was observed. An additional modeling study on the dielectric properties of the crop revealed how the CR could be affected by sucrose accumulation during the growing season and supported the opposite correlations. The results shows CR contains information on sucrose content in the sugarcane plant. This sets a basis for further development of sucrose monitoring and prediction using a combination of radar and optical imagery.
1 Introduction
Sugarcane is an important source for both sugar and ethanol production, where the quantity and quality of soluble sugar in the plant, named sucrose, determines the final sugar yield. Sucrose production develops over the season in the stem of the sugarcane plant (Wang et al., 2013). Sucrose accumulates in high concentrations in the stem. Different sucrose concentrations have been reported by cultivars around the world, ranging between 10 and 15 percent of fresh weight (Inman-Bamber, 2013).
Monitoring sugarcane and its sucrose content during the growing season can provide essential information to several users, such as individual producers, sugarcane mills, or commodity traders (Abdel-Rahman and Ahmed, 2008). This is because monitoring and yield forecasting helps to evaluate production processes, adjust on-site management, and estimates the potential industrial production (Bocca et al., 2015). Currently, the most common method for yield estimation in the field is still based on historical records and expert knowledge (Shendryk et al., 2021). Specialists estimate yield based on visual assessment, basing their estimation on knowledge, historical yield data, land characteristics, weather, and the manifestation of pests and diseases (Bocca et al., 2015).
Previous studies have researched the relation between sugarcane yield and vegetation indices computed from satellite data (Bégué et al., 2010; Lofton et al., 2012; Morel et al., 2014; Molijn et al., 2019). Common techniques are based on optical indices (e.g. NDVI). For instance, Morel et al. (2014) found integrated NDVI values over the growing season best related to yield on a field scale. Fernandes et al. (2017) investigated how NDVI timeseries and neural networks can be combined to predict regional sugarcane yield in Brazil. Unfortunately, the integration of new yield estimation techniques into the decision making process of sugarcane production remains slow (Bocca et al., 2015).
Few studies have focused on Synthetic Aperture Radar (SAR) data and its relation to sugarcane or sucrose yield. Limited studies have assessed the capability of SAR data to monitor sugarcane biomass or estimate sugarcane yield. Shendryk et al. (2021) focused on predicting yield with machine learning, where Sentinel-1 data was used as a predictor variable. Molijn et al. (2019) explored the suitability of Sentinel-1 data to monitor biomass throughout the growing season. However, in none of these studies was SAR data directly compared to a large yield database.
This study will show how sucrose accumulation affects Sentinel-1 backscatter. Sentinel-1 backscatter and Planet optical data are used and compared. We start by assessing the variation of different vegetation indices over the growing season. Hereafter, the relationship of different vegetation indices to sugarcane yield over the season is compared. Finally, a modeling study was set up to mimic the impact of sucrose accumulation on the dielectric constant. The modeling study will provide explanation on the behavior of Sentinel-1 backscatter and supports the potential to monitor potential sucrose yield with satellite data.
2 Sugarcane Growth
Around the world sugarcane is grown in subtropical and tropical conditions. While Brazil and India are the largest sugarcane producers worldwide, accounting for 21 and 39% respectively (FAO, 2021a), the continent of Africa accounts for five percent of the total sugarcane production (FAO, 2021b). Where Brazil produces sugarcane mostly under dryland conditions, the majority of the sugarcane grown on the African continent is sustained with irrigation (Dubb et al., 2017).
Sugarcane can be grown as a plant cane or ratoon crop (Inman-Bamber, 2013). When sugarcane is grown as a ratoon crop, it is not replanted annually but grown from the preceding plant. As it is cost-effective, ratooning is the most common practice within the sugarcane growing countries (Surendran et al., 2016). Sugarcane is planted and harvested all year round. Harvest dates depend on the sugar mill and ideally, cane growth is planned to sustain maximum capacity (Bocca et al., 2015).
Compared to other perennial crops, sugarcane has a relatively long growing season and is harvested after a period of between 12 and 18 months. Physiological changes controlled by different mechanisms define different growth stages. In general, sugarcane growth is divided by the following four periods: an initial stage (30 days), tillering stage (90 days), development stage (150 days), and the final stage (90 days) (Doorenbos and Kassam, 1979; Silva et al., 2015). Throughout the analysis, we will refer to these growth stages.
The initial stage is characterised by the germination of the original stool. The onset of biomass growth and sucrose accumulation coincides with the development of the leaf canopy, during the tillering stage (Inman-Bamber, 2013). During the development stage the sugarcane plant focuses more on elongation of the stem, which is an important sink for sucrose development (Cock, 2001; Inman-Bamber, 2013). In the final stage, senescence is the dominant process (Martins et al., 2016). During this process the leaves turn yellow as chlorophyll content decreases. This process is combined with water loss in the plant and therewith increases the sucrose concentration in the plant (Bégué et al., 2010). In irrigated sugarcane, irrigation is often stopped at the end of the season to maximize the accumulation of sucrose (Inman-Bamber, 2013).
3 Data and Methods
3.1 Field Data Acquisition
This study uses crop yield data from a sugarcane plantation located on the banks of the lower Incomati river in Xinavane, Mozambique (see Supplementary Material). The plantation grows ratoon sugarcane under irrigated conditions in a subtropical climate. From April to December, the local sugar mill opens and the sugarcane fields are harvested (den Besten et al., 2020, 2021). The focus of this research lies on 387 fields that make up the majority of the area owned and grown by the Tongaat Hulett group, where agricultural management is centrally organized. The average field-size is approximately 20 hectares (den Besten et al., 2020). The sugarcane in the plantation is planted in rows 1–1.5 m apart. The dominant sugarcane varieties in the plantation are N25 and N23.
In the analysis, we use sugarcane yield data of season 2018-2019 and 2019-2020. After harvest, trucks containing harvested sugarcane are weighed and documented per field. After weighing, several samples are tested for their sucrose content. This process results in data per field on sugarcane yield (tons/hectare, TCH) and sucrose yield (tons/hectare, TSH). The relation between sugarcane and sucrose yield is linear for this plantation with a correlation coefficient of 0.95 for 688 samples (see Figure 1B). Because of this very high correlation and the fact that the sucrose database is not complete, we focus during this study on the yield data available for sugarcane as a proxy for its sucrose content to maximize the number of available data points.
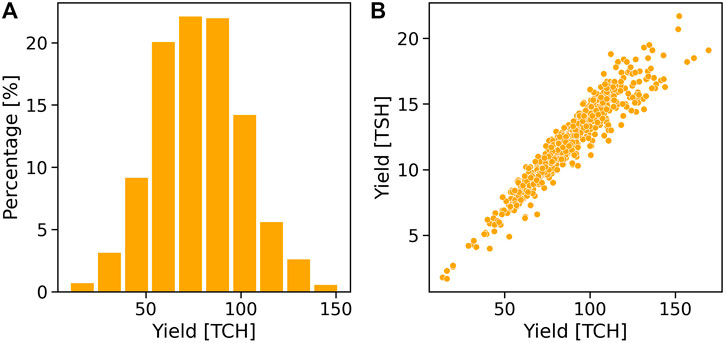
FIGURE 1. (A) Distribution of sugarcane yield for season 2018-2019 and 2019-2020. (B) Comparison sucrose yield and sugarcane yield (r = 0.95).
3.2 Satellite Data Acquisition and Processing
For this analysis, time series per season were extracted for different remote sensing products per field based on harvesting dates. Time series dates were expressed in terms of “days after ratooning” to allow for comparison between fields. Time series of the field-averaged Sentinel-1 backscatters at VV and VH polarizations were used, as well as Planet’s NDVI product.
3.2.1 Sentinel-1 Backscatter
Sentinel-1 data was processed by using the Sentinel Application Platform (SNAP) toolbox (ESA, 2021b). During this process a radiometric calibration and terrain correction are applied to convert the data into normalized backscatter and correct for elevation differences respectively. The Sentinel-1 satellites observed with Synthetic Aperture Radar (SAR), captures backscatter at 5.405 GHz (C-band) at 5 × 20 m spatial resolution. In southern Mozambique, Sentinel-1 has a revisit frequency of approximately 12 days (ESA, 2021a). Only descending data from both Sentinel-1 platforms were used of orbit number 6 and 79 to minimize observation geometry effects (Vreugdenhil et al., 2018). Finally, the observations were sampled at a 10 by 10 m resolution.
Backscatter timeseries were extracted from Sentinel-1 observations for each field for VV and VH polarizations. In addition, the cross ratio (CR) was calculated for each field. The CR can be calculated by subtracting VH-VV on a logarithmic scale. In previous researches CR was used to study vegetation dynamics as it reduces the backscatter effect of soil moisture and soil-vegetation interactions (Vreugdenhil et al., 2018; Khabbazan et al., 2019). CR has been shown to increase with vegetation growth and is, therefore, more representative of the scattering associated with volume scattering from vegetation (Veloso et al., 2017), while the individual VV and VH backscatters include a stronger contribution of soil moisture from rain events as well as irrigation.
3.2.2 Planet Fusion NDVI
The Normalized Difference Vegetation Index (NDVI) is a widely used vegetation index. NDVI requires red and near-infra red bands and is indicative of the chlorophyll content of a vegetated surface (Rouse et al., 1974). Planet realizes daily global imaging in optical spectrum, observing in RGB and near infra red at approximately 3 m spatial resolution with commercial satellites. For this study Planet’s NDVI fusion products was used and up-scaled to Sentinel-1’s 10 m spatial resolution. The Planet fusion product merges PlanetScope observations with Sentinel-2, Landsat-8 and MODIS data (Houborg and McCabe, 2018). The end result is a daily cloud free NDVI timeseries. The new Planet data improves cross-sensor inconsistencies due to variations in orbital configurations, spectral responses, and radiometric quality. The CubeSat ENabled Spatio-Temporal Enhancement Method (CESTEM) creates a robust NDVI signal that can be used to observe high-frequency vegetation dynamics (Houborg and McCabe, 2018; Aragon et al., 2021; Planet Labs Inc, 2020).
3.3 Sugarcane Data Analysis
The sugarcane yield and satellite data were used to understand the effect of sucrose accumulation on different vegetation indices retrieved with satellite data. In addition, a modeling study was done to explain the effect of changes in the vegetation water content as a result of sucrose accumulation on the dielectric constant of vegetation.
3.3.1 Yield Analysis
First, the variation of NDVI and CR per field was assessed over the growing season. To understand the behaviour of the two vegetation indices in poor and good performing fields, the 10th and 90th percentile of the sugarcane yield dataset for the season 2018-2019 and 2019-2020 was calculated. The 10th percentile was found to be 50.0 TCH and the 90th percentile 108.7 TCH. The average NDVI and CR over time was computed for the selected fields below and above the chosen percentiles.
Second, the VV backscatter, VH backscatter, CR, and NDVI were compared with yield over the growing season. The Pearson correlation coefficient was computed for each day after ratooning for average field values of the satellite derived products and the final sugarcane yield. For each satellite product the 5-day moving average of the correlation coefficient was plotted to understand the changes over the growing season.
3.3.2 Modeling Study
To understand the effect of sucrose accumulation on radar backscatter a modeling study was performed. Radar backscatter of a canopy is determined by its dielectric properties, size, shape, orientation, and roughness, and the distribution of the canopy (Karam and Fung, 1989; Steele-Dunne et al., 2017). The dielectric properties of vegetation are described by the dual-dispersion model of Ulaby and El-Rayes (1987). This is a model converting the gravimetric water content into the complex dielectric constant of vegetation (ϵv) (Meyer et al., 2019). Ulaby and El-Rayes (1987) assumes ϵv is a mixture of three components: a non-dispersive residual component (ϵr) [-], a free water component (ϵfw) [-], and a bound water component (ϵb) [-]. Where bound water refers to the water molecules that are in a solution, and free water means refers to water molecules not in compound (Ulaby and El-Rayes, 1987). Ulaby and El-Rayes (1987) define the dielectric constant of vegetation (ϵv) as follows:
Where υfw: volume fraction of free water [-] υb: volume fraction of the bulk vegetation-bound water mixture [-]. All the components depend on the gravimetric water content (Mg). Where Mg is the gravimetric moisture content defined as the amount of water [g] per wet biomass [g] (Meyer et al., 2019). The non-dispersive residual component (ϵr) is estimated as:
The free water and bound water component of the complex dielectric constant of vegetation in Eq. 1 are defined as follows:
where f is the frequency [GHz], σ the ionic conductivity of free-water solution [Sm−1], and j denotes the imaginary number. The parameter σ was found to be constant (1.27 Sm−1) by Ulaby and El-Rayes (1987). The difficulty of the model is to estimate the distribution of free and bound water. With the help of lab experiments Ulaby and El-Rayes (1987) found a relation between the gravimetric moisture content and the υfw and υb:
Literature on water content and sucrose development in sugarcane over time is not abundant (Inman-Bamber, 2013). However, a study by Muchow et al. (1996) reported on a field experiment that documented the development of sucrose, vegetation water, and dry vegetation over the growing season. The location of the experiment was Australia and sugarcane was grown as a ratoon crop under irrigated conditions (Muchow et al., 1996). The experiment entailed sampling of sugarcane on eight moments in the growing season. From these results the gravimetric moisture content was estimated by:
where Msucrose is the fraction of sucrose of the total fresh biomass and Mdry the fraction of dry weight of the fresh biomass. Data from (Muchow et al., 1996) were used to model the effect of temporal changes in Mg on the dielectric constant in vegetation. This allows us to explain the observed changes in backscatter and CR. In Table 1 the resulting υfw and υb can be found.
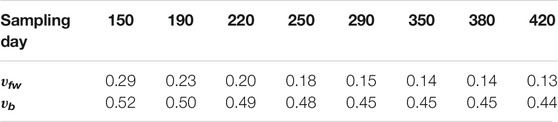
TABLE 1. Free and bound water fractions after several moments in the growing season. υb and υfw computed with field experiment results Muchow et al. (1996).
4 Results
Figures 2A,B show the NDVI and CR per field during the growing season, where panel A shows the NDVI and panel B the CR. The red and green lines in Figure 2A and dots in Figure 2B display the NDVI and CR observation values in 10th and 90th percentile fields considering crop yield. The NDVI and CR of the fields with a yield below the 10th percentile and above the 90th percentile are averaged to compute the red and green lines, respectively. From Figure 2A the 90th percentile NDVI development show an increase over the growing season. The 90th percentile reaches a much higher NDVI value. The 10th percentile NDVI development show lower values. The difference between the 10th and 90th percentile line becomes evident during the Development and Final stage, when the biomass is fully developing. The results suggest good performing fields develop high NDVI values over the growing season and poor performing fields develop lower NDVI values. Which is in line with previous research on NDVI and sugarcane yield (Bégué et al., 2010; Pinheiro Lisboa et al., 2018).
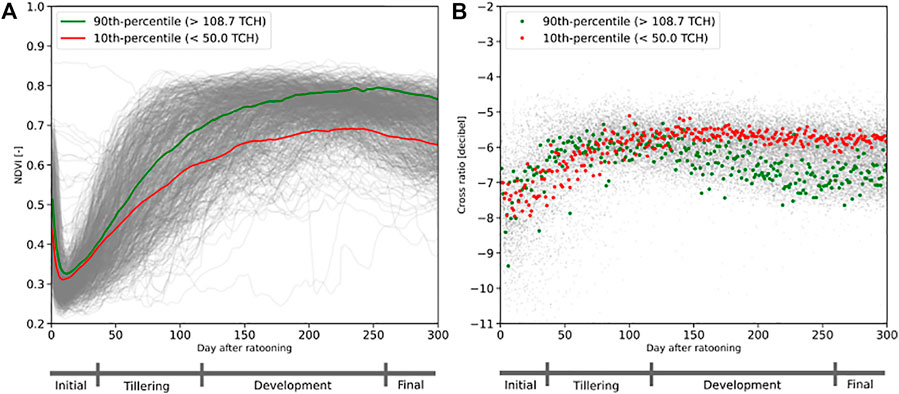
FIGURE 2. (A) NDVI timeseries of the fields under study over the growing season. Each gray line corresponds to a single field. (B) Cross ratio timeseries of the fields under study. The green and red dots display the average values of fields with a yield above the 90th percentile (>108.7 TCH) and below the 10th percentile (<50.0 TCH). The bar below the figure indicates the length of the different crop stages.
Figure 2B shows an opposite signal compared to NDVI. The CR development of 90th percentile line shows a decrease over the growing season, starting in the Development stage. The average CR values of the 10th percentile fields are more constant from the end of the Tillering stage onward. Interestingly, the CR values of the 10th percentile fields are higher than the 90th percentile fields in the Development and Final stage. Combining with Figure 2A, this suggests that good-performing fields are characterized by high NDVI and low CR. Conversely, poor-performing fields are characterized by low NDVI and higher CR values. To our knowledge, this is the first such analysis of CR in sugarcane. However, in other crops (e.g. corn) the CR increases over time as a result of increase in vegetation water content (Vreugdenhil et al., 2018).
Figure 3 visualizes the relation between different satellite products and sugarcane yield over the growing season. The satellite derived products assessed in Figure 3 are: VV, VH, CR and NDVI. In Figure 3 the Pearson correlation over each day in the growing season is calculated for the final yield and average field value of the satellite derived product for all fields under study. Figure 3 shows the correlation between sugarcane yield and NDVI is increasing alongside the sugarcane development. The highest correlation is 0.56 on 254 days after ratooning, at the end of the Development stage. In the Final stage, the correlation with yield declines. This is expected since, at this stage, dry-off causes wilting of the sugarcane plant (see section 2).
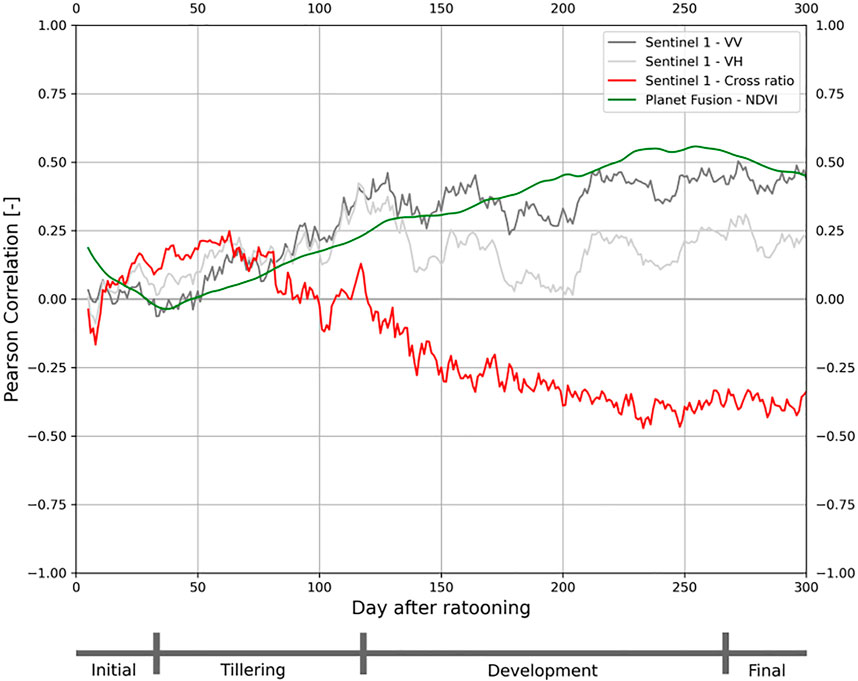
FIGURE 3. Pearson correlation with sugarcane yield for season 2019-2020 for VV and VH polarization, Cross ratio, and NDVI. The bar below the figure indicates the length of the different crop stages.
VV and VH show a similar variation in their correlation to yield throughout the growing season. The highest correlation for VV is 0.50 on day 272 and 0.42 for VH on day 116. The correlation to yield for VV and VH start to deviate from each other during the Development stage. VV shows higher correlations to yield compared to the VH, suggesting that VV provides a better indicator of sugarcane growth than VH. This is in contrast to other studies on broadleaf crops and tall leaf stems (e.g. corn) which showed an increasing backscatter signal over the growing season (Macelloni et al., 2001). Macelloni et al. (2001) and Vreugdenhil et al. (2018) showed VH to be more sensitive to crop growth indicators (i.e. Leaf Area Index, Vegetation Water Content). However, the crops considered in those studies do not accumulate sucrose over the growing season.
The CR shows a negative relationship with yield over time. This is opposite to the relationship NDVI shows with yield over time. Over the growing season the relation between CR and yield shows an increasing negative correlation with a maximum correlation of −0.47 on day 233. In particular, halfway through the Tillering stage and towards the start of the Development stage, the CR correlation shows a steep decline. Towards the end of the Development stage, the correlation stablizes and remains stable throughout the Final stage. The steep increase in negative correlation between the yield and CR half way the Tillering stage suggests a change in the sugarcane plant growth. Interestingly, this coincides with the period in which the sugarcane plant starts to accumulate sucrose (see section 2).
A modeling study was performed to investigate how sucrose accumulation affects the dielectric constant, a key driver of the radar backscatter. Data were used from a field campaign conducted by Muchow et al. (1996), in which they documented the development of sucrose, vegetation water, and dry vegetation over the growing season. The data are visualized in Figure 4, where the accumulation of sucrose is evident, particularly during the Development stage.
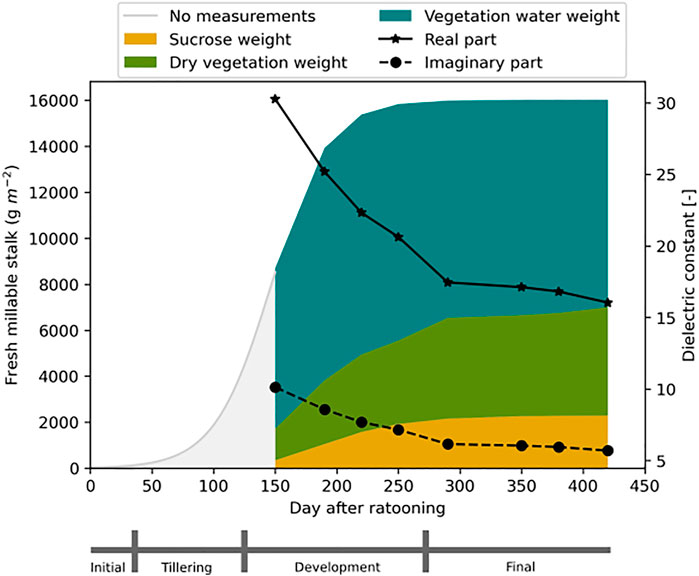
FIGURE 4. Results of a field campaign by Muchow et al. (1996) and the influence of the change in distribution between bound and free particles on the dielectric properties of vegetation. The bar below the figure indicates the length of the different crop stages.
The accumulation of sucrose within the plant lowers the total gravimetric water content in the plant (section 3.2.2 and Eq. 1). Based on the Dual Dispersion model of Ulaby and El-Rayes (1987), this lowers the dielectric constant of vegetation significantly, see Figure 4. Figure 4 shows how the dielectric constant of vegetation, particularly the real part, decreases. This decrease explains the decrease in backscatter, which in turn explains the negative correlation between CR and yield.
It is worth noting that a change in the chemical composition of stem water as a result of sucrose accumulation would also affect the dielectric constant, a factor not explicitly considered in Eq. 6 (Ulaby and El-Rayes, 1987; McDonald et al., 2002). As sucrose is bound to water, an increase in sucrose should increase the amount of bound water (Moore and Botha, 2013). Bound water has a lower dielectric constant than free water, as the molecules are not free to rotate. Hence, accounting for the impact of sucrose on the bound water fraction is likely to lead to a further decrease in dielectric constant.
As a result of sucrose production within the sugarcane stem, the combined effect of a changing water content and chemical composition affects the backscatter signal through a decrease in dielectric constant directly. This is different from NDVI, which indicates the chlorophyll content of the vegetated surfaces (Rouse et al., 1974). The link between chlorophyll content and sucrose accumulation is indirect. The CR in particular has a distinctive response to the sucrose development and, therefore, proves to contain information on sucrose accumulation in the sugarcane plant. In addition, the results support the CR to be more representative of the scattering associated with the canopy, as was found in other studies (Veloso et al., 2017; Vreugdenhil et al., 2018; Khabbazan et al., 2019).
5 Discussion
This study shows the relationship between sugarcane yield and vegetation indices from Sentinel-1 backscatter and Planet NDVI. The results show a negative correlation between the CR and sugarcane yield over the growing season. Previous studies on the CR reported the ability to observe changes in vegetation structure and accumulation of fresh biomass (Veloso et al., 2017; Vreugdenhil et al., 2018). However, no comparable studies exist where the CR is compared to yield in sucrose accumulating crops.
Contrary to the results using CR, NDVI develops a positive correlation to yield over the growing season. In other words, where good performing fields are characterized by low CR values and high NDVI, poor performing fields are characterized by high CR values and low NDVI. Other researchers have found positive correlations with NDVI and sugarcane crop yield (Bégué et al., 2010; Morel et al., 2014). In these studies the integral of NDVI over the growing season was compared to final sugarcane yield or the maximum value within a growing season. In addition, Bégué et al. (2010) found lower NDVI values in the final stage for fields with a higher sucrose content. This can be explained by the leaf senescence, which causes the chlorophyll content to drop. And could explain why the results show a decrease in correlation with NDVI towards the end of the growing season.
A modeling study was used to show how the dielectric constant of sugarcane is affected by the change in the sugarcane’s internal composition (El-Rayes and Ulaby, 1987; Ulaby and El-Rayes, 1987). Contrary to other crops, the chemical composition of plant water in sucrose-producing crops, like sugarcane, changes over the growing season. Sucrose is produced from the Tillering stage through to the Development stage. This decreases the amount of free water and increases the bound water in the sugarcane stem over the growing season (Wang et al., 2013, 2011). The combined effect of a decrease in vegetation water content and change in chemical composition of the vegetation water due to sucrose accumulation in the sugarcane stem alters the backscatter signal (McDonald et al., 2002).
The alteration of the backscatter signal is visible in the CR over the growing season which shows a negative correlation to sucrose yield. This shows the CR is able to observe sucrose accumulation during the growing season. Hence, the CR is indicative of the sucrose content in the sugarcane plant. To improve understanding of the effect of sucrose accumulation on the backscatter signal, more research should focus on the effect of sucrose accumulation on the partitioning between free and bound water in vegetation. Within the current estimation of gravimetric moisture content in Ulaby and El-Rayes (1987) the development of bound water in sucrose accumulating crops are underestimated. The estimation of apportioning free and bound water is currently based on, predominantly, corn leaf experiments by Ulaby and El-Rayes (1987). More studies should focus on experiments with sucrose accumulating vegetation (e.g. agave).
In this study, we prove that CR computed with Sentinel-1 backscatter can be used to observe sucrose accumulation in sugarcane. Although this study focuses on sugarcane, we foresee that Sentinel-1 backscatter could also be of use to monitor quality and/or sucrose accumulation in other crops (e.g. agave). In addition, combining optical and backscatter observations is expected to be of value for crop monitoring and yield prediction. Future studies along the same line, therefore, should focus on combining these different data products.
Data Availability Statement
The raw data supporting the conclusions of this article will be made available by the authors, without undue reservation.
Author Contributions
NB, SS-D, and RJ contributed to conception and design of the study. BA and NB organized the database. NB acquired field data and performed the analysis. NB wrote the first draft of the manuscript. All authors contributed to manuscript revision, read, and and approved the submitted version.
Funding
This project was partly supported through the MINERVA knowledge network, funded by the Netherlands Space Office (NSO) and the Dutch Research Council (NWO).
Conflict of Interest
NB, BA and RJ were employed by VanderSat B.V. AZ is employed by Planet Labs Inc.
The remaining authors declare that the research was conducted in the absence of any commercial or financial relationships that could be construed as a potential conflict of interest.
Publisher’s Note
All claims expressed in this article are solely those of the authors and do not necessarily represent those of their affiliated organizations, or those of the publisher, the editors and the reviewers. Any product that may be evaluated in this article, or claim that may be made by its manufacturer, is not guaranteed or endorsed by the publisher.
Acknowledgments
A special thanks to VanderSat colleagues Yoann Malbeteau and Rogier Burger who were part of the research.
Supplementary Material
The Supplementary Material for this article can be found online at: https://www.frontiersin.org/articles/10.3389/frsen.2021.778691/full#supplementary-material
References
Abdel-Rahman, E., and Ahmed, F. B. (2008). The Application of Remote Sensing Techniques to Sugarcane (Saccharum Spp. Hybrid) Production: a Review of the Literature. Int. J. Remote Sensing 29, 3753–3767. doi:10.1080/01431160701874603
Aragon, B., Ziliani, M. G., Houborg, R., Franz, T. E., and McCabe, M. F. (2021). Cubesats Deliver New Insights into Agricultural Water Use at Daily and 3 M Resolutions. Sci. Rep. 11, 12131. doi:10.1038/s41598-021-91646-w
Bégué, A., Lebourgeois, V., Bappel, E., Todoroff, P., Pellegrino, A., Baillarin, F., et al. (2010). Spatio-temporal Variability of Sugarcane fields and Recommendations for Yield Forecast Using Ndvi. Int. J. Remote Sensing 31, 5391–5407. doi:10.1080/01431160903349057
Bocca, F. F., Rodrigues, L. H. A., and Arraes, N. A. M. (2015). When Do I Want to Know and Why? Different Demands on Sugarcane Yield Predictions. Agric. Syst. 135, 48–56. doi:10.1016/j.agsy.2014.11.008
den Besten, N., Kassing, R., Muchanga, E., Earnshaw, C., de Jeu, R., Karimi, P., et al. (2020). A Novel Approach to the Use of Earth Observation to Estimate Daily Evaporation in a Sugarcane Plantation in Xinavane, mozambique. Phys. Chem. Earth, Parts A/B/C 124, 102940. doi:10.1016/j.pce.2020.102940
den Besten, N., Steele-Dunne, S., de Jeu, R., and van der Zaag, P. (2021). Towards Monitoring Waterlogging with Remote Sensing for Sustainable Irrigated Agriculture. Remote Sensing 13, 2929. doi:10.3390/rs13152929
Doorenbos, J., and Kassam, A. (1979). Yield Response to Water. Irrigation and drainage paper 33, 257–280. doi:10.1016/b978-0-08-025675-7.50021-2
Dubb, A., Scoones, I., and Woodhouse, P. (2017). The Political Economy of Sugar in Southern Africa–Introduction.
El-Rayes, M., and Ulaby, F. (1987). Microwave Dielectric Spectrum of Vegetation-Part I: Experimental Observations. IEEE Trans. Geosci. Remote Sensing GE-25, 541–549. doi:10.1109/tgrs.1987.289832
ESA (2021a). Sentinel-1 Observation Scenario. Available at: https://sentinels.copernicus.eu/web/sentinel/missions/sentinel-1/observation-scenario (Accessed 0707, , 2021).
ESA (2021b). Snap. Available at https://step.esa.int/main/toolboxes/snap (Accessed 1203, 2021).
FAO (2021a). Chapter 5. Sugar. Available at https://www.fao.org/3/CA4076EN/CA4076EN_Chapter5_Sugar.pdf (Accessed 0707, 2021).
FAO (2021b). Faostat. Available at: http://www.fao.org/faostat/en/#data/QC. Accessed: 2021-07-07.
Fernandes, J. L., Ebecken, N. F. F., and Esquerdo, J. C. D. M. (2017). Sugarcane Yield Prediction in brazil Using Ndvi Time Series and Neural Networks Ensemble. Int. J. Remote Sensing 38, 4631–4644. doi:10.1080/01431161.2017.1325531
Houborg, R., and McCabe, M. F. (2018). A Cubesat Enabled Spatio-Temporal Enhancement Method (Cestem) Utilizing Planet, Landsat and Modis Data. Remote Sensing Environ. 209, 211–226. doi:10.1016/j.rse.2018.02.067
Inman-Bamber, G. (2013). Sugarcane Yields and Yield-Limiting Processes. Sugarcane: Physiol. Biochem. Funct. Biol., 579–600. doi:10.1002/9781118771280.ch21
Karam, M. A., and Fung, A. K. (1989). Leaf-shape Effects in Electromagnetic Wave Scattering from Vegetation. IEEE Trans. Geosci. Remote Sensing 27 (6), 687–697. doi:10.1109/tgrs.1989.1398241
Khabbazan, S., Vermunt, P., Steele-Dunne, S., Ratering Arntz, L., Marinetti, C., van der Valk, D., et al. (2019). Crop Monitoring Using sentinel-1 Data: A Case Study from the netherlands. Remote Sensing 11, 1887. doi:10.3390/rs11161887
Lofton, J., Tubana, B. S., Kanke, Y., Teboh, J., Viator, H., and Dalen, M. (2012). Estimating Sugarcane Yield Potential Using an In-Season Determination of Normalized Difference Vegetative index. Sensors 12, 7529–7547. doi:10.3390/s120607529
Macelloni, G., Paloscia, S., Pampaloni, P., Marliani, F., and Gai, M. (2001). The Relationship between the Backscattering Coefficient and the Biomass of Narrow and Broad Leaf Crops. IEEE Trans. Geosci. Remote Sensing 39, 873–884. doi:10.1109/36.917914
Martins, M. T. B., de Souza, W. R., da Cunha, B. A. D. B., Basso, M. F., de Oliveira, N. G., Vinecky, F., et al. (2016). Characterization of Sugarcane (Saccharum spp.) Leaf Senescence: Implications for Biofuel Production. Biotechnol. Biofuels 9, 153. doi:10.1186/s13068-016-0568-0
McDonald, K. C., Zimmermann, R., and Kimball, J. S. (2002). Diurnal and Spatial Variation of Xylem Dielectric Constant in norway spruce (Picea Abies [l.] karst.) as Related to Microclimate, Xylem Sap Flow, and Xylem Chemistry. IEEE Trans. Geosci. Remote Sensing 40, 2063–2082. doi:10.1109/tgrs.2002.803737
Meyer, T., Jagdhuber, T., Piles, M., Fink, A., Grant, J., Vereecken, H., et al. (2019). Estimating Gravimetric Water Content of a winter Wheat Field from L-Band Vegetation Optical Depth. Remote sensing 11, 2353. doi:10.3390/rs11202353
Molijn, R., Iannini, L., Vieira Rocha, J., and Hanssen, R. (2019). Sugarcane Productivity Mapping through C-Band and L-Band Sar and Optical Satellite Imagery. Remote Sensing 11, 1109. doi:10.3390/rs11091109
Moore, P. H., and Botha, F. C. (2013). Sugarcane: Physiology, Biochemistry and Functional Biology. John Wiley & Sons.
Morel, J., Todoroff, P., Bégué, A., Bury, A., Martiné, J.-F., and Petit, M. (2014). Toward a Satellite-Based System of Sugarcane Yield Estimation and Forecasting in Smallholder Farming Conditions: A Case Study on Reunion Island. Remote Sensing 6, 6620–6635. doi:10.3390/rs6076620
Muchow, R. C., Robertson, M. J., and Wood, A. W. (1996). Growth of Sugarcane under High Input Conditions in Tropical australia. Ii. Sucrose Accumulation and Commercial Yield. Field Crops Res. 48, 27–36. doi:10.1016/0378-4290(96)00042-1
Pinheiro Lisboa, I., Melo Damian, J., Roberto Cherubin, M., Silva Barros, P., Ricardo Fiorio, P., Cerri, C., et al. (2018). Prediction of Sugarcane Yield Based on Ndvi and Concentration of Leaf-Tissue Nutrients in fields Managed with Straw Removal. Agronomy 8, 196. doi:10.3390/agronomy8090196
Planet Labs Inc (2020). Planet Fusion Monitoring - Technical Specification. in 654 Harrison St. Floor 4. version 1.0.0-beta. 3 edn. San Francisco CA, 94107.
Rouse, J. W., Haas, R. H., Schell, J. A., and Deering, D. W. (1974). Monitoring Vegetation Systems in the Great plains with Erts. NASA Spec. Publ. 351, 309.
Shendryk, Y., Davy, R., and Thorburn, P. (2021). Integrating Satellite Imagery and Environmental Data to Predict Field-Level Cane and Sugar Yields in australia Using Machine Learning. Field Crops Res. 260, 107984. doi:10.1016/j.fcr.2020.107984
Silva, V. d. P. R. d., Garcêz, S. L. A., Silva, B. B. d., Albuquerque, M. F. d., and Almeida, R. S. R. (2015). Métodos de estimativa da evapotranspiração da cultura da cana-de-açúcar em condições de sequeiro. Rev. Bras. Eng. Agríc. Ambient. 19, 411–417. doi:10.1590/1807-1929/agriambi.v19n5p411-417
Steele-Dunne, S. C., McNairn, H., Monsivais-Huertero, A., Judge, J., Liu, P.-W., and Papathanassiou, K. (2017). Radar Remote Sensing of Agricultural Canopies: A Review. IEEE J. Sel. Top. Appl. Earth Observations Remote Sensing 10, 2249–2273. doi:10.1109/jstars.2016.2639043
Surendran, U., Ramesh, V., Jayakumar, M., Marimuthu, S., and Sridevi, G. (2016). Improved Sugarcane Productivity with Tillage and Trash Management Practices in Semi Arid Tropical Agro Ecosystem in india. Soil Tillage Res. 158, 10–21. doi:10.1016/j.still.2015.10.009
Ulaby, F., and El-Rayes, M. (1987). Microwave Dielectric Spectrum of Vegetation - Part II: Dual-Dispersion Model. IEEE Trans. Geosci. Remote Sensing GE-25, 550–557. doi:10.1109/tgrs.1987.289833
Veloso, A., Mermoz, S., Bouvet, A., Le Toan, T., Planells, M., Dejoux, J.-F., et al. (2017). Understanding the Temporal Behavior of Crops Using sentinel-1 and sentinel-2-like Data for Agricultural Applications. Remote sensing Environ. 199, 415–426. doi:10.1016/j.rse.2017.07.015
Vreugdenhil, M., Wagner, W., Bauer-Marschallinger, B., Pfeil, I., Teubner, I., Rüdiger, C., et al. (2018). Sensitivity of sentinel-1 Backscatter to Vegetation Dynamics: An Austrian Case Study. Remote Sensing 10, 1396. doi:10.3390/rs10091396
Wang, J., Nayak, S., Koch, K., and Ming, R. (2013). Carbon Partitioning in Sugarcane (Saccharum Species). Front. Plant Sci. 4, 201. doi:10.3389/fpls.2013.00201
Keywords: cross ratio, sucrose accumulation, sugarcane, sentinel-1, yield prediction, planet NDVI, dielectric properties
Citation: den Besten N, Steele-Dunne S, Aouizerats B, Zajdband A, de Jeu R and van der Zaag P (2021) Observing Sucrose Accumulation With Sentinel-1 Backscatter. Front. Remote Sens. 2:778691. doi: 10.3389/frsen.2021.778691
Received: 17 September 2021; Accepted: 16 November 2021;
Published: 20 December 2021.
Edited by:
Haipeng Wang, Fudan University, ChinaReviewed by:
Fusun Balik Sanli, Yıldız Technical University, TurkeyNan Ye, Monash University, Australia
Copyright © 2021 den Besten, Steele-Dunne, Aouizerats, Zajdband, de Jeu and van der Zaag. This is an open-access article distributed under the terms of the Creative Commons Attribution License (CC BY). The use, distribution or reproduction in other forums is permitted, provided the original author(s) and the copyright owner(s) are credited and that the original publication in this journal is cited, in accordance with accepted academic practice. No use, distribution or reproduction is permitted which does not comply with these terms.
*Correspondence: Nadja den Besten, bmRlbmJlc3RlbkB2YW5kZXJzYXQuY29t