 Sebastián Vivero1*
 Xavier Bodin2
 David Farías-Barahona3,4
 Shelley MacDonell5
 Nicole Schaffer5
 Benjamin Aubrey Robson6
 Christophe Lambiel1
- 1Institute of Earth Surface Dynamics (IDYST), University of Lausanne, Lausanne, Switzerland
- 2Laboratoire Environnements, Dynamiques et Territoire de Montagne (EDYTEM), CNRS, Université Grenoble Alpes, Université Savoie Mont-Blanc, Bourget Du Lac, France
- 3Departamento de Geografía, Universidad de Concepción, Concepción, Chile
- 4Institut für Geographie, Friedrich-Alexander-Universität Erlangen-Nürnberg, Erlangen, Germany
- 5Centro de Estudios Avanzados en Zonas Áridas, La Serena, Chile
- 6Department of Earth Science, University of Bergen, Bergen, Norway
The diachronic analysis of aerial and satellite imagery, uncrewed aerial vehicle (UAV) and in situ surveys obtained between 1956 and 2019 are employed to analyse landform surface kinematics for the Tapado site located in the Dry Andes of Chile. A feature tracking procedure was used between series of orthorectified and co-registered images to calculate surface velocities on several ice-debris landforms, including rock glaciers and debris-covered glaciers. For the active rock glaciers, the results exhibit typical viscous flow, though local destabilisation process seems to occur, increased velocities since 2000 (>1 m/yr) and terminus advance. Nevertheless, the debris-covered glaciers displays heterogeneous spatial patterns of surface velocities, together with collapse (downwasting) associated with the development of thermokarst depressions and supraglacial ponds. Our findings show that surface kinematics and multitemporal observations derived from different sensors are valuable tools for differentiating between glacial and periglacial features. The pluri-decadal time series since 1956 constitute a unique dataset for documenting the surface kinematics of creeping mountain permafrost in the Southern Hemisphere. The approach developed in this work offers a way forward to reconstruct the recent behaviour of glacial and periglacial features in the Andes, where archival aerial photographs are available but have not previously been processed rigorously to obtain an accurate assessment of landform kinematics.
1 Introduction
Cryosphere components in high-mountain regions such as glaciers, snow cover and permafrost are sensitive to environmental changes such as rising temperatures because of their proximity to melting or thawing conditions (Haeberli and Beniston, 1998; Barry and Gan, 2011; Hock et al., 2019). Permafrost is invisible for the layperson because it is a thermal phenomenon (Dobiński, 2011); however, direct temperature measurements (Noetzli et al., 2021), geophysical measurements (Mollaret et al., 2019), geomorphological evidence (Barsch, 1996) and modelling approaches (Gruber, 2012) can reveal permafrost conditions in diverse mountain or polar environments. In the Dry Andes (17°30´–35°S, sensu Lliboutry, 1998), rock glaciers are regarded as the unequivocal expression of the creep of mountain permafrost, and it is assumed that they play an essential role as water reservoirs due to their prevalent occurrence in the high Andean landscape (Corte, 1976; Schrott, 1996; Azócar and Brenning, 2010; Perucca and Esper Angillieri, 2011; Schaffer et al., 2019). In this mountain region, rock glaciers, push moraines and debris-covered glaciers assemblages represent cases of intricate permafrost-glacier interactions (Trombotto et al., 1997; Bodin et al., 2010). In addition, recent studies performed in the Dry Andes have highlighted the remarkable development of several transitional landforms from glacial to periglacial domains (Monnier and Kinnard, 2015, 2017). These studies stress glacial and periglacial processes’ importance and encourage more in-depth investigations to characterise this hybrid cryospheric landscape. Nevertheless, and due to this complexity, glaciers and periglacial landforms are not distinguished from one another in current country-wide glacier inventories at the Chilean and Argentinian share of the Andes (Barcaza et al., 2017; Zalazar et al., 2020). Environmental laws designed to protect surface and subsurface perennial ice reservoirs (sensu stricto glaciers and rock glaciers) have been implemented in Argentina, and are currently in discussion in Chile, which means that their correct characterisation and monitoring have become a highly relevant environmental matter (Brenning, 2008; Brenning and Azócar, 2010; Kronenberg, 2013; Wainstein et al., 2020).
In the Andes, one of the earliest rock glacier monitoring activities was performed in 1970 at the Pedregoso rock glacier in the Valparaiso Region of Chile (32°S). Using a triangulation land survey technique, Marangunic (1976) measured 23 points during the late summer of 1970, estimating velocities between 0.2 and 1.28 cm per day at the rock glacier root and the central part, respectively. Later on, Valenzuela (2004), reported the kinematics of South Infiernillo Alto rock glacier near the Los Bronces mining site (33°S). In this particular case, the rock glacier reached up to 25 m/yr in 1995 after the deposit of 14 m tons of mining waste on the rock glacier’s central part. Terrestrial geodetic surveys have been sporadically implemented at the Tapado rock glaciers since 2009 (Dirección General de Aguas [DGA], 2010), between 2012 and 2016 at the Varas rock glacier (23°S) in the Norwest Argentinean Andes (Martini et al., 2017) and between 2013 and 2016 at the Morenas Coloradas rock glacier (32°S) in the Central Argentinean Andes (Trombotto-Liaudat and Bottegal, 2020). More recently, Blöthe et al. (2020) provided the surface velocities of 244 rock glaciers between 2010 and 2018 in the Cordón del Plata Range (Central Argentinean Andes) using high-resolution satellite images and cross-correlation matching techniques. Using a combination of UAV and geophysical surveys, Halla et al. (2021) investigated the surface kinematics, ice content and interannual water storage at the Dos Lenguas rock glacier, approximately 15 km to the southeast of the Tapado area. Despite the recent upsurge of rock glacier studies in the Andes, the lack of long-term systematic measurements of these landforms has precluded a better understanding of their response to changes in environmental conditions (Masiokas et al., 2020) and more appropriate classifications of rock glaciers according to their degree of activity (i.e., the traditional distinction between active and inactive landforms, sensu Barsch, 1996).
Several studies have highlighted the coherent nature of rock glacier surface deformation over time, indicating a large-scale stress transmission mechanism on the ice-debris mixtures under permafrost conditions (Wahrhaftig and Cox, 1959; Kääb, 2002; Haeberli et al., 2006). This coherent surface deformation is mainly the result of permafrost creep processes occurring inside the rock glacier body, like the plastic deformation of frozen sediments supersaturated with ice and the localised deformation at the shear horizon (Wagner, 1992; Haeberli, 2000; Arenson et al., 2002; Cicoira et al., 2021). As a result of these intrinsic rock glacier dynamics, changes in surface morphology and kinematics fields are dissimilar between rock glaciers and other ice-debris complexes like debris-covered glaciers (Berthling, 2011; Bosson and Lambiel, 2016). However, differentiating among debris-covered glaciers, glacial and periglacial landforms from solely monotemporal remote sensing observations is non-trivial (see, for instance, the classification scheme proposed by Janke et al., 2015), and the interpretation of composite geomorphological processes is potentially ambiguous. Therefore, multitemporal observations based on archival or contemporary high-resolution imagery are more suitable to describe complex geomorphological processes in high mountain environments (Roer and Nyenhuis, 2007; Micheletti et al., 2015; Groh and Blöthe, 2019; Hu et al., 2021; Kääb et al., 2021).
Conventionally, rock glacier inventories and classification schemes are based on the presumed degree of activity by the visual inspection of optical imagery alone (Brardinoni et al., 2019). Furthermore, deliberations on rock glacier activity based only on surface morphology indicators (see Imhof, 1996; Burger et al., 1999) should be taken with precaution, as controversy and confusion have intensified from morphological centred approaches on complex landform mapping (Berthling, 2011). Currently, kinematical data obtained from optical and radar remote sensing datasets (Delaloye et al., 2007; Barboux et al., 2014; Villarroel et al., 2018; Hu et al., 2021; Kääb et al., 2021) has been recognised to be instrumental in distinguishing among different types of slope movements in the high mountain periglacial environments. Typically, rock glacier kinematics can be evaluated from remotely sensed datasets, either airborne or space-borne, obtained for at least two different points in time to calculate significant displacements above a certain threshold (Kääb, 2005).
In the present study, we aim to analyse spatial-temporal changes of surface kinematics over rock glaciers and ice-debris complexes in the Dry Andes by exploiting an assemblage of remote sensing datasets spanning 63 years (1956–2019). This work supports a geomorphological mapping proposal based on multitemporal remote sensing techniques and geomorphic interpretations informed by observations on the evolution of landform kinematics. Furthermore, we provide a systematic description of the development of rock glacier kinematics over distinct types of landforms since 1956. Our work is embedded into the efforts of the recently founded International Permafrost Association (IPA) Action Group (RGIK, 2021) on rock glacier inventories and kinematics by deciphering long-term surface velocities.
2 Study Site and Previous Work
The study site is located in the La Laguna basin at the headwaters of the Elqui River catchment in the Coquimbo Region of Chile (30°S, 69°W, see Figure 1). The regional climate is characterised by semiarid conditions and is influenced mainly by the extratropical precipitation systems (Garreaud, 2007), although nonnegligible convective activity is occasionally present during the austral summer months (Vuille and Keimig, 2004). The annual precipitation amounts and corresponding snowpack processes exhibit substantial variability associated with El Niño-Southern Oscillation (ENSO, e.g., Montecinos and Aceituno, 2003; Réveillet et al., 2020), with above (below) -average precipitation during El Niño (La Niña) events. At the nearest long-term meteorological station (La Laguna, 3,160 m a.s.l.), the mean annual air temperature (MAAT) was 8.15°C in 1976–2019; and the mean annual precipitation was 156 mm in 1964–2019. The MAAT at the La Laguna station experienced a warming trend of 0.17°C per decade (Monnier et al., 2014). Furthermore, a sequence of dry years has been observed since 2010 in this region, with a precipitation deficit between 20 and 40% (Garreaud et al., 2020). Short-term meteorological data from an automatic weather station (AWS) at 4,306 m a.s.l. (Figure 1) indicates a MAAT of -0.6°C between 2014 and 2020 (CEAZA, 2021). According to a recent permafrost distribution model developed by Azócar et al. (2017), permafrost is scattered between 3,900 and 4,500 m a.s.l. and more prevalent above 4,500 m a.s.l.
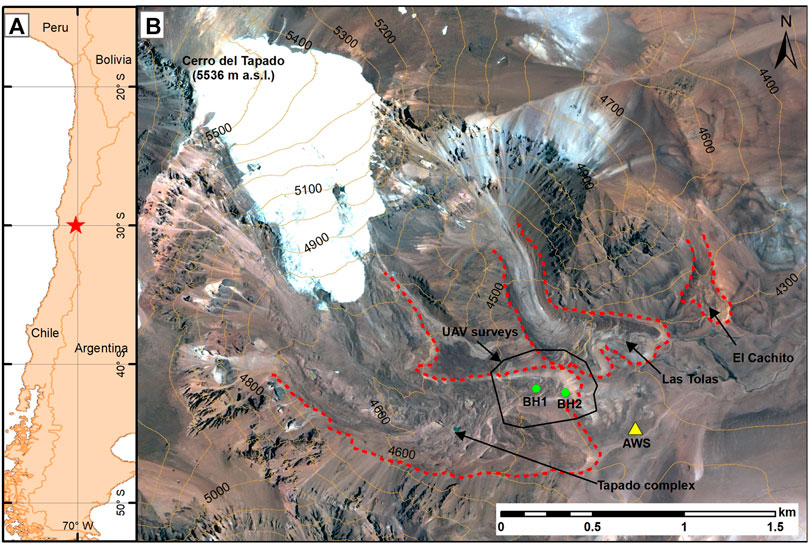
FIGURE 1. (A) Location of the study area (red star), near the boundary between Chile and Argentina. (B) The Tapado complex and studied landforms (dashed red lines). The yellow triangle indicates the position of the Automatic Weather Station (AWS). Green circles indicate the position of the shallow boreholes 1 (BH1) and 2 (BH2). Black polygon indicates the area covered by the UAV surveys. The background image corresponds to a Pléiades orthoimage from November 18th 2014. Contours are derived from the corresponding DEM. © CNES (2018), and Airbus DS (2018), all rights reserved.
The Tapado area (Figure 1) includes the Cerro del Tapado (5,536 m a.s.l.), which is covered with the largest glacier in the region (Barcaza et al., 2017). The Tapado Glacier has drawn much research attention in recent years due to its relatively easy accessibility, large area and unique position south of the so-called “South American Arid Diagonal” (Nicholson et al., 2016; Pourrier et al., 2014; Sinclair and MacDonell, 2016). The analysis of a 36 m long ice core and borehole temperatures near the summit retrieved in February 1999 revealed a large interannual variability of net accumulation during the 20th century and temperatures down to -11°C at the ice-bedrock interface (Ginot et al., 2006). In connection with the Tapado Glacier, a complex glacio-geomorphologic assemblage (here termed Tapado complex) of rock glaciers, moraines, and a debris-covered glacier is present (Monnier et al., 2014). Next to the Tapado complex, Las Tolas and El Cachito rock glaciers (Figure 1) display clear signs of ongoing activity such as transversal ridges and furrows and steep lateral-frontal talus (Figure 2). The dominant surface material in this area is mainly a mix of pebbles and cobbles derived from the Pastos Blancos and Doña Ana formations, whose lithologies are mainly silicic volcanic rocks (Strauch et al., 2006). According to their predominant clast size, the rock glaciers are classified as pebbly rock glaciers (sensu Ikeda and Matsuoka, 2006), which is also the dominant typology in this part of the Andes (Falaschi et al., 2014).
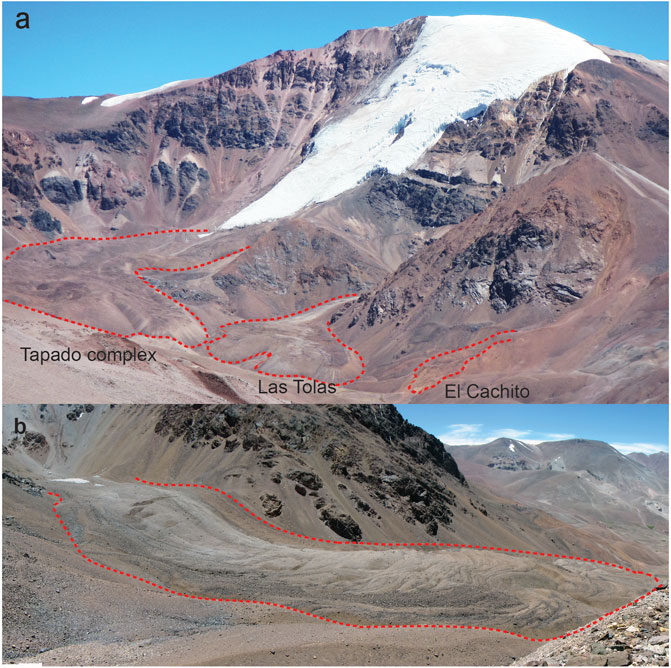
FIGURE 2. Terrestrial view of the study area. (A) Overview of Tapado site with the three studied units (05.02.2015). (B) The tongue-shaped Las Tolas rock glacier with clear margins (also note the crevasses in the upper area) and well-developed furrows and ridges (01.02.2018).
Earlier reconnaissance work done by Paskoff (1967) detailed the first geomorphological map of the Tapado site as well as some initial insights into the complex interplay between glacial and periglacial landforms. Later on, Milana and Güell (2008) performed seismic refraction surveys on the lower Tapado complex and Las Tolas rock glacier, inferring active layer thicknesses of 4 and 11 m, respectively. From these findings, they postulated that the Tapado rock glacier was derived from the debris-covered glacier and labelled it of “glacigenic” origin based on the higher ice content detected by their geophysical survey. Monnier et al. (2014) performed more extensive geomorphological and geophysical measurements, concluding that the debris-covered glacier overlapped the Tapado rock glaciers after a noticeable glacier advance, which probably occurred during the Little Ice Age (LIA) climate episode (Espizua and Pitte, 2009). Recent studies have also focused on the hydrological mechanisms operating through the different cryospheric components (Pourrier et al., 2014) and their hydrological relevance (Schaffer et al., 2019).
3 Material and Methods
The methodological approach provides an integrated kinematic quantification and geomorphological analysis using various multi-temporal remote sensing datasets (Table 1). Distributed kinematic changes were quantified at different time intervals within the period 1956–2019. Products of the kinematic quantification were subject to a quantitative evaluation and a detailed geomorphic interpretation. The ensemble of orthoimages was projected to the Universal Transverse Mercator (UTM) 19S zone and WGS-84 Datum to provide compatible datasets. Elevation values were recorded in heights above the WGS-84 ellipsoid.
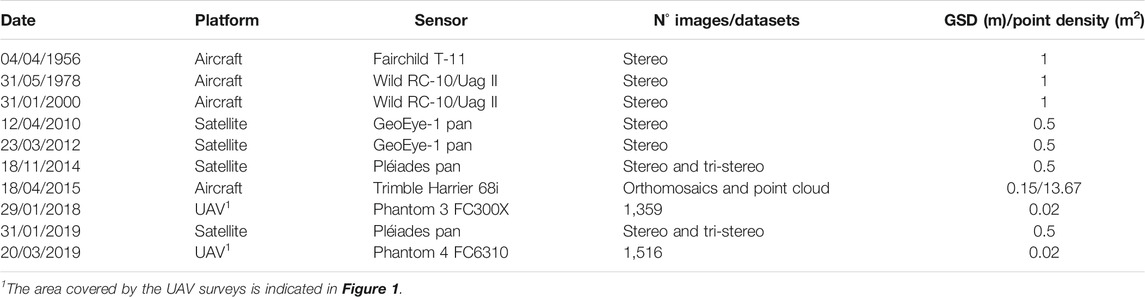
TABLE 1. Available remote sensing imagery for the study area between 1956 and 2019. Pan refers to the panchromatic bands in GeoEye-1 and Pléiades sensors.
3.1 Airborne Laser Scanning Dataset
The airborne laser scanning (ALS) survey was performed by Digimapas company on 18 April 2015, using a Trimble Harrier 68i laser scanning system onboard a helicopter, flying at 640 m above the ground. The airborne system was embedded with a metric camera, an inertial measurement unit (IMU) and GNSS devices. The postprocessing (trajectories, point cloud filtering, orthomosaic and registration) and quality control steps were performed by Digimapas. After filtering, the final point density was 13.67 pts/m2 with a vertical accuracy (RMSE) within 0.086 m (DIGIMAPAS, 2015).
The lack of surface contrast caused by a thin layer of seasonal snow excluded the use of the accompanying orthomosaic for the ALS 2015 dataset for further kinematic measurements. However, this dataset proved to be extremely useful during the extraction of photogrammetric ground control on assumed stable areas outside the Tapado complex. Following the approach presented by James et al. (2006), several ground control points (GCPs) were extracted from the ALS dataset based on two main principles: 1) correctly and easily recognisable on several images; and 2) located on stable zones during each period. These requirements were typically met by medium-sized boulders on flat areas and rock outcrops near mountain ridges.
3.2 Geodetic Measurements
The surface kinematics of the Tapado rock glacier have been surveyed on a network of 46 points since 2009 using differential GNSS (dGNSS) system (Dirección General de Aguas [DGA], 2010). A temporary base station on a flat exposure of bedrock, near the rock glacier, was deployed during each surveying campaign with a logging interval of 1–2 s. Additionally, around three control points located on stable terrain outside the rock glaciers were measured during each campaign as a quality check and to ensure the stability of the base station. During the 2018 and 2019 field surveys, this control network was augmented to include between 14 and 17 GCPs to be used during the processing of the UAV surveys. The base station coordinates were fixed using the Trimble Center Point RTX postprocessing service, and the differential postprocessing of the GNSS raw data between this base and the rover GNSS antenna was conducted using Trimble Business Center (TBC, V.4) surveying software. The stability of the base station and the coordinate system is discussed in section 5.3. The reported average horizontal and vertical precisions (95%) were 0.02 and 0.04 m, respectively.
3.3 Archival Aerial Photographs
Archival aerial photographs from the 1956 HYCON aerial survey were provided by the Instituto Geográfico Militar (IGM) of Chile, and the 1978 CHILE60 and 2000 GEOTEC aerial surveys were provided by the Servicio Aerofotogramétrico (SAF) of Chile. In the high Chilean Andes, and until recently, the general approach for analysing raw archival aerial photographs sourced from either the IGM or SAF was their treatment by georeferencing using the available regular 1:50000 scale cartography or recent datasets (Bown et al., 2008; Rabatel et al., 2011; Ruiz Pereira and Veettil, 2019; among others). However, georeferencing itself cannot compensate for the distortions induced by the camera optics and the extreme relief encountered in such mountain regions (Mikhail et al., 2001). Therefore, more robust processing based on reconstructing the interior and exterior image orientations of historical aerial photographs can be sought using modern digital photogrammetric techniques and high-quality ground control (see Farías-Barahona et al., 2019, 2020). With the reconstruction of three-dimensional terrain data through stereo images, input imagery can be transformed into geometrically corrected images (i.e. orthoimages and orthomosaics). We applied this methodology using Geomatica Banff photogrammetric software.
Aerial photographs were scanned at 1,200 dpi and 8-bit/pixel using a photogrammetric scanner and provided with their corresponding calibration certificates, except the 1956 photographs for which the camera calibration certificate was not available. Therefore, we only retrieved the calibrate focal length from the 1956 photographs’ data strip and estimated the rest of the interior orientation parameters such as principal points and radial distortion parameters through a self-calibration adjustment implemented in Geomatica Banff photogrammetric software. Such adjustment requires more GCPs than when calibration certificates are available. A bundle block adjustment (Table 2) was performed based on several GCPs extracted from the 2015 ALS dataset (point cloud and orthomosaic) and automatically generated Tie Points (TPs) followed by a subsequent aerotriangulation, including adjusted camera parameters. Using a Semi-Global Matching algorithm, DEMs were extracted from stereo images at a resolution of 1 m × 1 m. Orthoimages were generated at the same resolution and extent (i.e. concurrent) using their corresponding DEMs.
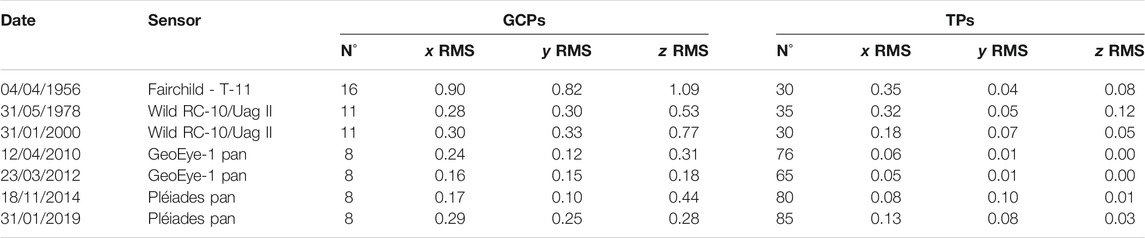
TABLE 2. Bundle block adjustment parameters included the number (N°) of ground control points (GCPs) and tie points (TPs) employed and the RMS error in x, y and z directions (m) for each date.
3.4 High-Resolution Satellite Imagery
Two stereo panchromatic images from the GeoEye-1 and two tri-stereos Pléiades satellites were available for this study (Table 1). GeoEye-1 and Pléiades images were provided in level 1B and coded over 11-bit/pixel and 12-bit/pixel for each sensor, respectively. The original orientation data obtained from the rational polynomial coefficient (RPC) was refined using 8 GCPs and between 65 and 85 automatically extracted TPs. The GCPs were sourced from the 2015 ALS dataset similarly to the aerial photographs. Table 2 shows the accuracy of the GCPs and TPs for each bundle block adjustment. Using the OrthoEngine module in Geomatica Banff, the processing of the satellites images follows the same preparation as the aerial photographs to generate high-resolution orthoimages and DEMs for each year.
3.5 Uncrewed Aerial Vehicle Surveys
The UAV surveys were planned to acquire recent high-resolution images of the northern frontal lobe of the Tapado complex (Figure 1) and performed simultaneously with the GNSS surveys in January 2018 and March 2019. The 2018 and 2019 UAV surveys were conducted using Phantom 3 Pro and Phantom 4 Pro DJI devices (Table 1), and their planning and execution were achieved employing the PIX4Dcapture flight planning app. The front and side overlaps were set to 80 and 70%, respectively, using a single grid flight plan. The nominal altitude above the ground during both surveys was kept around 45 m by flying nearly parallel to the slope, and the final ground sampling distances (GSD) were below 2 cm. The total area covered by both UAV surveys reached 0.2 km2.
The UAV images were processed using PIX4Dmapper pro version 4.4 software through a prescribed Structure-from-Motion (SfM) photogrammetry approach to derive 3D point clouds, DEMs and orthomosaics (Carrivick et al., 2016). Noise filtering and medium surface smoothing were activated in the software processing options. A bundle block orientation of each survey was achieved using 14 (2018) and 17 (2019) GCPs distributed on the rock glacier surface (Figure 3). The resulting orthomosaics and DEMs were sampled at a resolution of 2 cm × 2 cm. High-resolution elevation changes were computed by the DEMs of differences (DoD) method, using the Geomorphic Change Detection (GCD), version 7 software (Wheaton et al., 2010). Between 16 (2018) and 11 (2019) checkpoints (CPs) were strictly employed to independently gauge the quality of their corresponding DEM (Figure 3). The standard deviation of the elevation differences between the reference CPs and DEM was used to calculate the minimum level of detection (LoD), which determines the threshold between significant and non-significant elevation change (at 95% confidence interval).
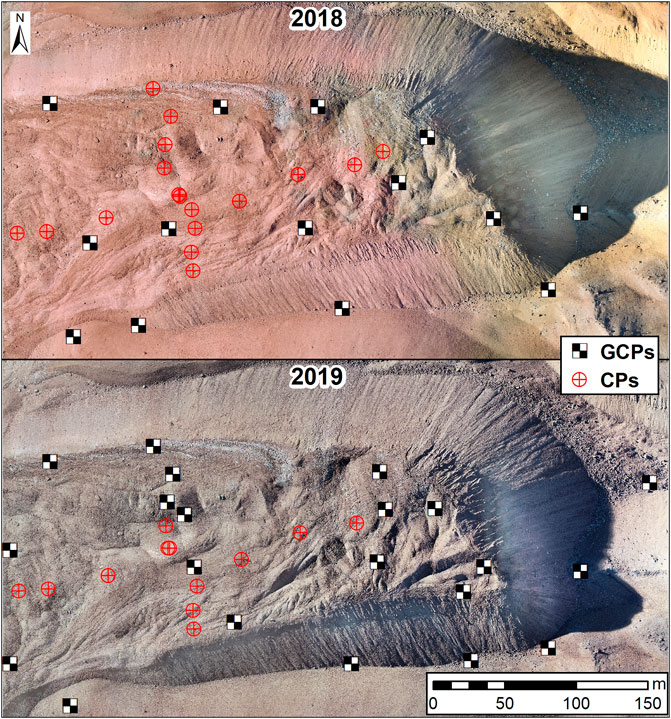
FIGURE 3. Distribution of GCPs and CPs used during the 2018 and 2019 UAV surveys. The background images correspond to the UAV-derived orthomosaics from 2018 to 2019, respectively.
3.6 Feature Tracking
Each orthoimage pair was analysed at their respective coarsest resolutions (see Table 1). Surface feature tracking was obtained by a normalised cross-correlation procedure using CIAS software (Kääb and Vollmer, 2000; Debella-Gilo and Kääb, 2011). The dimensions of the reference and search windows were first defined based on the orthoimages resolution, quality and time interval considered. Typically, smaller (larger) reference and search windows were employed for short (long) periods. The resulting sizes of the reference (search) windows are 64 × 64 (128 × 128) for aerial images (early periods), 25 × 25 (50 × 50) for satellite images (recent periods) and 50 × 50 (200 × 200) for UAV-derived orthomosaics. To derive comparable surface velocities, conjugated (corresponding) points in two orthoimages were spaced within the predefined boundaries based on an invariable 10 m sampling grid (i.e. eulerian framework). Older aerial photographs presented different image quality due to dust, dirt and scratches on the film during the scanning process, reducing the quality of the feature matching processing. On the other hand, modern high-resolution satellite imagery presented better conditions for feature tracking due to their higher radiometric resolution of 11–12 bit/pixel and better signal-to-noise ratio with respect to the archival aerial photographs scanned at 8-bit/pixel (Poli et al., 2015).
The accuracy of the kinematic time series was assessed by stable features such as boulders and outcrops that were considered representative of the study landforms (Figure 4). This assessment is done by matching features on stable ground, computing an apparent x-y shift, scale and rotation values between the two images, and then the final residuals after the adjustments (Kääb, 2021). The x and y standard deviations (σx and σy) of the residuals were used to calculate the uncertainty associate with the horizontal displacements (σl) following the rationale presented by Redpath et al. (2013) and evaluated using the LoD with a confidence limit of 90% (i.e. 1.64×σl). The resulting LoD values were converted to m/yr based on the time difference between subsequent datasets (Table 1).
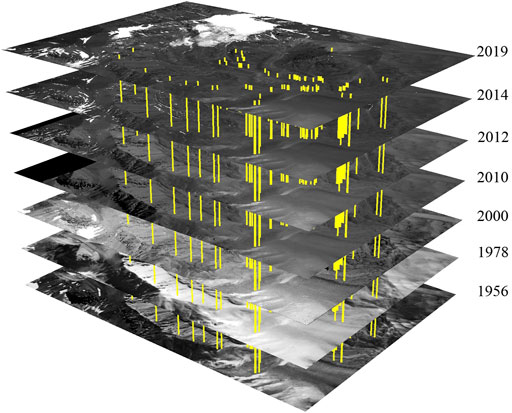
FIGURE 4. Time-series of orthorectified aerial and satellite images between 1956 and 2019. Yellow lines represent the stable points outside the moving landforms employed for CIAS assessment.
Different conditions were applied to filter and exclude poorly correlated points and those displaying anomalous displacement or directions. Depending on the intrinsic quality of orthoimages pairs (e.g. image 1 and image 2), reliable displacement values were retrieved with correlation coefficients higher than 0.4–0.6 (Wangensteen et al., 2006; Kääb et al., 2021). Zones with significant changes in the surface texture such as thermokarst depressions and ponds, fluvioglacial fans, snow patches and exposed glacier ice hampered the feature tracking procedure. Therefore, these zones were excluded from the feature tracking analyses. Time series of surface kinematic were derived using the mean value within manually drawn kinematic zones, defined by an almost coherent movement and the availability of high-quality correlation points during the analysed periods.
3.7 Ground and Air Temperature Data
Ground temperatures from two shallow boreholes were available at the northern frontal lobe of the Tapado complex (Figure 1). The setup consists of five temperature data loggers (E348-S-TMB-M006 HOBO) placed at depths between 0.2 and 2.5 m (Dirección General de Aguas [DGA], 2010). Recordings are stored in a centralised datalogger (HOBO U-30) with a logging interval of 30 min. Air temperature data was also measured on each borehole site, but the recordings were quite discontinuous. Long term mereological data was sourced from the nearest meteorological station (La Laguna, 3,160 m a.s.l.) using the Chilean Climate Explorer (http://explorador.cr2.cl). In this study, we derived the MAAT from 1976 (beginning of the temperature measurements) to 2019.
4 Results
4.1 Evaluation of the Displacement Accuracy
The horizontal accuracy assessment between orthoimage pairs was achieved by evaluating the apparent displacement of the stable points outside the studied areas (Figure 3 and Table 3). As expected, the older orthoimage pair presents the larger LoD associated with the more significant errors during the bundle block adjustments (Table 2) and the relatively low quality of the original scanned film. Additionally, the 1956 aerial survey is the only one where the internal calibration parameters were reconstructed using a self-calibration technique. Nevertheless, this large LoD is somehow compensated by the significant time span between the early aerial photography acquisitions (nearly 22 years). Smaller LoDs are associated with the orthoimages pairs from the recent satellite acquisitions (GeoEye-1 and Pléiades) and the UAV-derived orthomosaics. The standard deviations associated with CIAS analysis were approximately equal in the y and x directions for most orthoimages pairs, revealing a small anisotropy in the resulting displacement uncertainties.
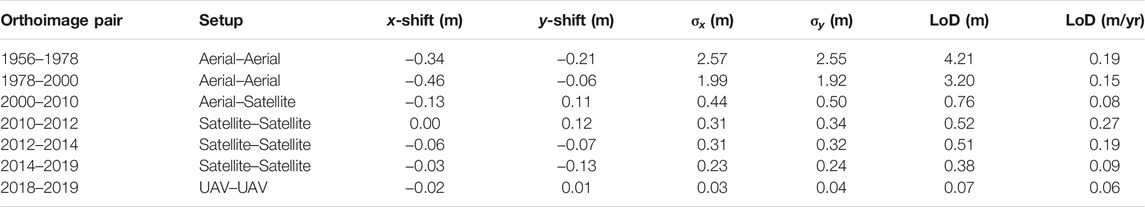
TABLE 3. Assessment of the horizontal displacement accuracy of orthoimage pairs over stable terrain.
4.2 Surface Kinematics
Figure 5 displays surface velocities of the Tapado site derived from a pair of Pléiades orthoimages between 2014 and 2019. This figure highlights the complex morphology and heterogeneous kinematic patterns of the Tapado complex. It also reveals the noticeably coherent kinematic behaviour of the Las Tolas and El Cachito landforms. Areas with steep slopes, snow cover and significant textural changes between 2014 and 2019 provided low-quality kinematic data and therefore were excluded from our analysis. However, surface kinematics on the debris-covered glacier revealed rather chaotic values due to drastic textural changes. Surface velocities below the LoD were concentrated in the recently deglaciated glacier forefield and near the unit’s margins. Velocities of more than 1.5 m/yr were detected in the upper debris-covered glacier; and the central and lower sections of Las Tolas and El Cachito rock glaciers, respectively.
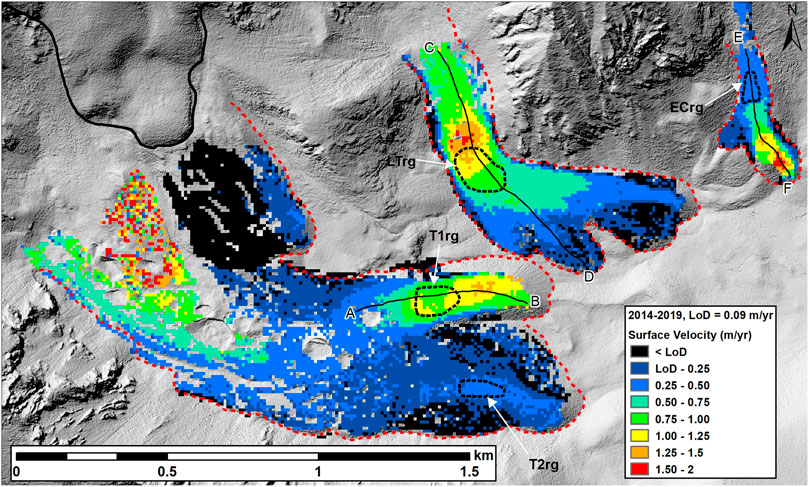
FIGURE 5. Surface velocities of the three investigated units between 2014 and 2019. Black lines and labels (A–F) indicate the surface velocity profiles (Figure 6). White arrows indicate the four zones (black dashed outlines) where the time series (1956–2019) of surface kinematics were compiled (Figure 7). The background image corresponds to a Pléiades-derived hillshade from January 2019. CNES (2018), and Airbus DS (2018), all rights reserved.
The velocity profiles of the three most active rock glacier units can be seen in Figure 6. The fastest rock glacier part was up to 1.8 m/yr near the front of the El Cachito rock glacier. The Las Tolas rock glacier presented the fastest section (1.6 m/yr) around the middle approximately halfway between the rooting zone and the terminus. On the Tapado 1 rock glacier (T1rg), the increase in velocity along the centre profile was neither uniform nor linear but indicated at least two rapid sections (Figure 6).
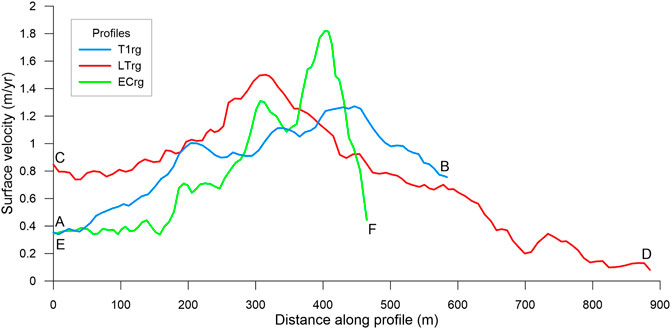
FIGURE 6. Longitudinal surface velocity profiles (2014–2019) for the Tapado 1 (T1rg), Las Tolas (LTrg) and El Cachito (ECrg) rock glaciers.
Time series of surface kinematics were compiled for two rock glacier units at the Tapado complex (T1rg and T2rg), Las Tolas (LTrg) and El Cachito (ECrg) rock glaciers (Figure 7). However, between 1956 and 1978, results from CIAS analysis at the El Cachito rock glacier showed values below the LoD; therefore, no kinematic values were reported. Figure 7 also includes the estimated MAAT at 4,500 m a.s.l. since 1976 and the recent in-situ kinematic monitoring by GNSS surveys at the Tapado 1 rock glacier (2010–2019). Excluding the Tapado 2 rock glacier, the group of landforms display a nearly synchronous kinematic behaviour. The Tapado 2 rock glacier displayed nearly constant velocities and low activity (<0.3 m/yr, see Figure 7). Surface kinematics indicate relatively low velocities in the 1950–2000 period, followed by a rapid acceleration since the 2000s. Over the period 2010–2012, the surface kinematics of the El Cachito, Tapado 1 and Tapado 2 rock glaciers experienced a slight deceleration, which lasted until 2015 for Tapado 1. The Las Tolas rock glacier was the only landform that did not decelerate during the entire study period.
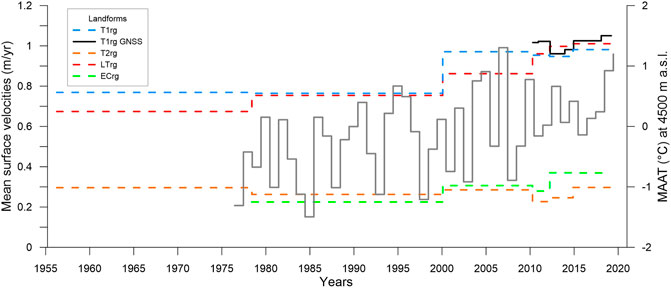
FIGURE 7. Time series of mean surface velocities for the kinematics zones as defined in Figure 5. The continuous black line represents the Tapado 1 (T1rg) rock glacier mean surface velocities obtained from the GNSS surveys (6 points) between 2010 and 2019. The MAAT at 4,500 m a.s.l. (continuous grey line) was extrapolated from La Laguna meteorological station (3,130 m a.s.l.) using a temperature lapse rate of -0.6°C per 100 m.
The 63 years glacier retreat and periglacial processes can be observed from the dynamic visualisation of the sequential orthoimages at the video supplement (Supplementary video S1). On the one hand, this dynamic visualisation also shows the chaotic downwasting structure and the development of thermokarst depressions and ponds at the debris-covered glacier. On the other hand, the viscous flow appearance of the most active rock glaciers is revealed during the same period.
4.3 High Spatial Resolution Surface Changes
The spatial surface behaviour of the Tapado 1 rock glacier is analysed based on the recent UAV-derived DEMs and orthomosaics (Figure 8). The delineation of the surface between the central and frontal parts and lateral talus (Figure 8) was distinguished by the distinctive elevation change patterns (see Halla et al., 2021 for a similar rock glacier division). From the high-resolution DoD, the advection of transverse ridges is seen through the alternating positive and negative elevation changes at the rock glacier central tongue. Here, surface rising (sinking) patterns are found in the front (rear) of individual ridges. The amplitude associated with the surface rising and sinking can reach between 0.5–1 m, whereas the wavelength of the ridge-and-furrow morphology is around 20 m. The widespread positive elevation changes at the frontal and lateral slopes are associated with the advance of the rock glacier and reworking processes. Negative elevation changes (up to -1.5 m) are associated with some rockfalls and gullying patterns just below the rock glacier front. The recent changes of the Tapado 1 rock glacier can be observed from the dynamic visualisation of the sequential high-resolution hillshades at the video supplement (Supplementary video S2).
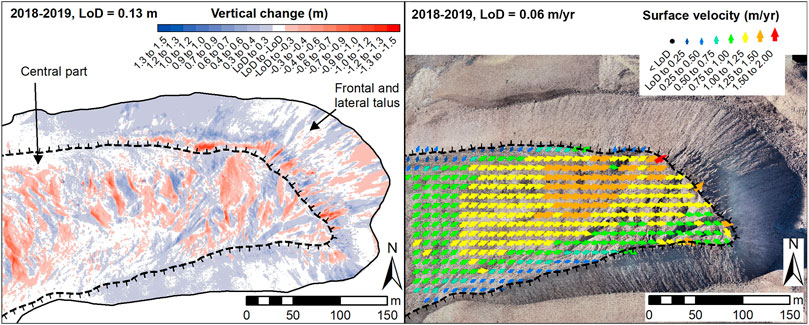
FIGURE 8. UAV-derived vertical changes and surface kinematics of Tapado 1 rock glacier (T1rg) between January 2018 and March 2019. The background image corresponds to the UAV-derived orthomosaic from March 2019.
The surface velocities at the Tapado 1 rock glacier derived from recent satellite images (2014–2019) and UAV (2018–2019) display a similar structure (Figures 5 and 8). Surface velocities over 1.25 m/yr were measured near the rock glacier front. Near the lateral margins, there is a sharp decrease in the observed velocities. Surface velocities remained high near the rock glacier front. Due to the steep topography of the frontal and lateral talus (slopes angles between 32 and 39°) and the significant texture changes, no reliable velocities values were obtained on this zone. Nevertheless, visual inspection of the high-resolution orthomosaics indicates that the surface changes are associated with erosive processes such as falling boulders, small debris slides and localised gullying.
4.4 Landform Interpretation
The following landform interpretation is mainly based on the recent guidelines published by the IPA Action Group on rock glacier inventories and kinematics (RGIK, 2021). Some subjectivity is still inherent in the difficulty of conciliating kinematics zones with fuzzy geomorphological boundaries.
4.4.1 Tapado Complex
Following the recent definitions of spatial connection of the rock glacier to the upslope unit, the Tapado 1–5 rock glacier units are glacier-connected (Figure 9) because they interact with the debris-covered glacier and push moraine complexes. Independently from the origin of the ground ice, glaciers can supply large amounts of meltwater and ice to proglacial permafrost landforms. As the case for Tapado 6 rock glacier, this unit is classified as glacier forefield-connected, which probably was in contact with the Tapado glacier during the LIA advance. This recently exposed glacier forefield is the heritage of the former Tapado glacier dynamics, and its thermal regime (i.e. polythermal glacier) probably explains the presence of several fluted moraines, fluvioglacial fans and dry gullies. Due to the diffuse margin between this rock glacier unit and the glacier forefield, the Tapado 6 rock glacier unit was previously interpreted as part of an upper lateral moraine complex (Monnier et al., 2014). However, the surface velocities up to 0.25 m/yr and the well-developed frontal and lateral talus indicate an active rock glacier unit, though the development of the landform remains difficult to determine when considering the evolution of the glacier.
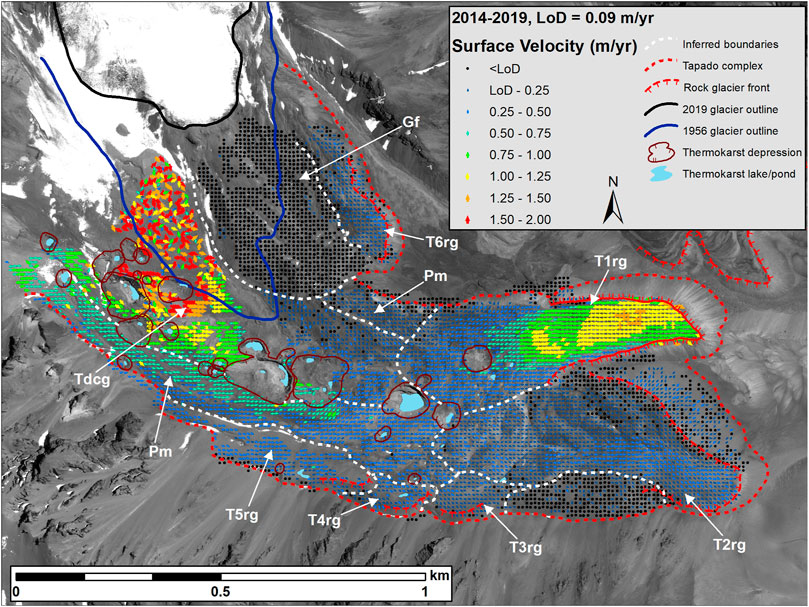
FIGURE 9. Geomorphological interpretation of the Tapado complex base on recent surface kinematics and multitemporal analysis. Gf: glacier forefield, Tdgc: Tapado debris-covered glacier, Pm: Push moraine, T1–6rg: Tapado rock glacier units. The background image corresponds to an orthorectified Pléiades image from January 2019. © CNES (2018), and Airbus DS (2018), all rights reserved.
Large thermokarst depressions might indicate the boundary between the Tapado debris-covered glacier and the push moraines (Figure 9). These push moraines (glaciotectonized frozen sediments) are associated with the former glacier advance during the LIA. Following glacier retreat and downwasting, these push moraines have developed a particular back creeping process toward the former glacier body (Haeberli, 1979; Kneisel and Kääb, 2007), which is shown in Figure 9. Despite the short transport route of fine-grained sediments in Tapado glacier forefields, the size of this push moraine formation is quite exceptional and may indicate the incorporation of a preceding ice-debris landform during its development.
4.4.2 Las Tolas and El Cachito rock glaciers
The Las Tolas rock glacier is a talus-connected landform. The topographical sequence goes from a massive headwall of an ice-free cirque with several coalescent talus slopes, a distinguished body of permafrost creep with the typical ridge-and-furrow morphology, and ending with a trident-like form (Figure 5). Considering the particular topographical setting, the El Cachito rock glacier was catalogued as a debris-mantled slope-connected rock glacier. Multitemporal observations and kinematic data suggest the debris are provided from the in-situ weathering process founding the upslope geomorphological unit and subsequently mobilising downslope to convene into a well-organised expression of creeping mountain permafrost (Supplementary video S1).
5 Discussion
5 1 Potential Sources of Uncertainty
The study area is situated on a tectonically active mountain range due to the Nazca plate’s subduction beneath the South American one. Several earthquakes have hit the area during the last decades, generating large coseismic and postseismic displacements (Ruiz and Madariaga, 2018). Remarkably, the September 2015 Mw 8.3 Illapel earthquake generated coseismic displacements up to 2.13 m across the whole region (Barnhart et al., 2016). The study site is located 235 km NE from the earthquake epicentre. Postprocessing values of the Tapado GNSS base station before (2014) and after (2018) the Illapel earthquake indicated a westward motion of 0.2 m, which is coherent with the data from the nearest earthquake monitoring GPS station (Shrivastava et al., 2016). Together with the continuous mountain uplift, such displacements have generated various horizontal and vertical shifts in the global coordinate system among fixed points, which were assumed to remain stable. However, it should be remarked that this study involved using a standard set of GCP and CP (extracted from the ALS and GNSS surveys before September 2015) during the orthorectification and coregistration procedures. This procedure ensured that orthorectified images were generated with respect to the epoch of the ALS and GNSS surveys, irrespective of the overall planimetric displacements associated with the massive earthquakes, as well as the potential mountain uplift. This approach benefits from eliminating the possible systemic error (bias) due to tectonic displacements since 1956 by assuming a homogenous plate motion in the study area (i.e. roughly 13 km2, see Figure 1). Hence, a more consistent set of kinematic values for the studied landforms can be informed from a tectonically active region.
5.2 Kinematics Evolution and Recent Climatic Trends
Traditionally, rock glaciers have been considered less sensitive to climate change than glaciers (Barsch, 1996). This notion has been mainly held for the Andes, where long term subsurface temperature monitoring on mountain permafrost is lacking. Yet, a few studies have observed permafrost degradation on Andean rock glaciers by geophysical investigations (Francou et al., 1999), short-term borehole measurements (Monnier and Kinnard, 2013) or by future climate warming scenarios (Drewes et al., 2018). Elsewhere in Europe, a plethora of studies have highlighted some symptoms of permafrost degradation, such as rock glacier acceleration (Kääb et al., 2007; Eriksen et al., 2018; Kellerer-Pirklbauer et al., 2018), destabilisation (Delaloye et al., 2013; Vivero and Lambiel, 2019; Marcer et al., 2021) or even collapse (Bodin et al., 2017; Marcer et al., 2020), mainly due to rising air temperatures and feedback mechanisms such as the availability of meltwater (Buchli et al., 2013; Cicoira et al., 2019). In our study area, despite their relatively small size, the kinematic results on the three most active landforms show velocity rates that are comparable to the rock glaciers in the northern Tien Shan region (Kääb et al., 2021) and the Cordón del Plata range (Blöthe et al., 2020). The general acceleration trend since the 2000s that we observed with our results is in reasonable agreement with values reported elsewhere in the Northern Hemisphere (Hartl et al., 2016; Necsoiu et al., 2016; Eriksen et al., 2018; PERMOS et al., 2019; Kääb et al., 2021). Regarding the atmospheric warming in this region (Carrasco et al., 2008; Falvey and Garreaud, 2009), our findings on the long-term kinematics evolution can be regarded as an indicator of environmental changes, in particular climatic and ground-thermal conditions, but also the complex interaction between glaciers and mountain permafrost.
The short-term temperature data from the two shallow boreholes at Tapado 1 rock glacier (2 m depth, see Figure 1) suggests a slight cooling trend in the active layer during the 2010–2015 period (Figure 10), which is concomitant with the lower MAATs estimated at 4,500 m a.s.l during the same period and a short deceleration trend for the majority of the studied landforms (Figure 7). This short cooling trend may be related to the prevalence between La Niña (dry and cold phase of the ENSO) and neutral ENSO conditions since 2009 (Garreaud et al., 2017). In addition, the active layer temperature variations revealed that the zero-curtain effect (Outcalt et al., 1990) was only present during the freezing May-June but not during the thawing conditions November–December. Commonly, the zero-curtain occurs during the onset of the freezing or thawing periods by delivering latent heat generated by water phase changes (French, 2017). Hence, the lack of a zero-curtain during thawing conditions can indicate low moisture content in the active layer (Zenklusen Mutter and Phillips, 2012). This could be explained by the premature depletion of the snow cover, occurring just before the temperature rises, and below the normal precipitation levels and high sublimation rates occurring during La Niña conditions (Ginot et al., 2006; Réveillet et al., 2020). Furthermore, the early removal of the thin snow cover facilitates the penetration of the winter cold in the active layer, potentially leading to a noticeable permafrost cooling. More research on the particular conditions of the Andean active layer and its relation to climate events is undoubtedly needed.
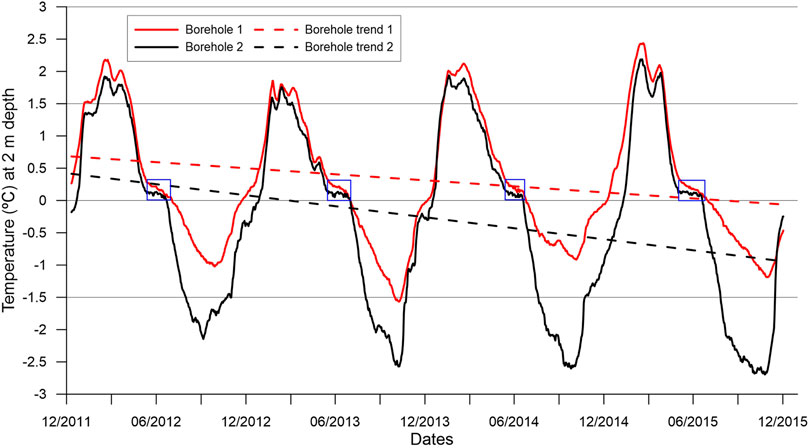
FIGURE 10. Active layer temperature records (daily averages) at the two shallow boreholes (2 m depth) at Tapado 1 rock glacier (see Figure 1) between November 2011 and November 2015. Blue boxes indicate the zero-curtain periods during freezing conditions (May-June).
5.3 Evidence of Destabilisation Processes
Multitemporal analysis on the El Cachito rock glacier (Figure 11) evidenced that the front toe of the rock glacier advanced about 20 m (∼1 m/yr) between 1978 and 2000, but only 6 m (∼0.3 m/yr) between 2000 and 2019. Note that during the same periods, the front toe of the Tapado 1 rock glacier advanced only 4 m (∼0.2 m/yr) and 5 m (∼0.25 m/yr), respectively. Also, a transverse scarp approximately 120 m long at an elevation of 4,390 m asl can be observed at the El Cachito rock glacier from the 1978 orthoimage (Figure 11). During the first period, the lack of coherent surface topography precluded obtaining kinematic values just below the scarp, where the surface structure changed dramatically. Therefore, the surface velocities reported in Figure 7 could not capture the main destabilisation phase. The recent velocities (2014–2019, Figure 6) ranged from about 1.8 m/yr near the front (below the former scarp) to 0.35 m/yr near the upper central zone (above the former scarp). This form of reversed velocity profile has been observed on destabilised rock glaciers where extensive flow patterns are associated with convex slopes (Delaloye et al., 2013; Marcer et al., 2019) and might indicate that the destabilisation phase has not ended.
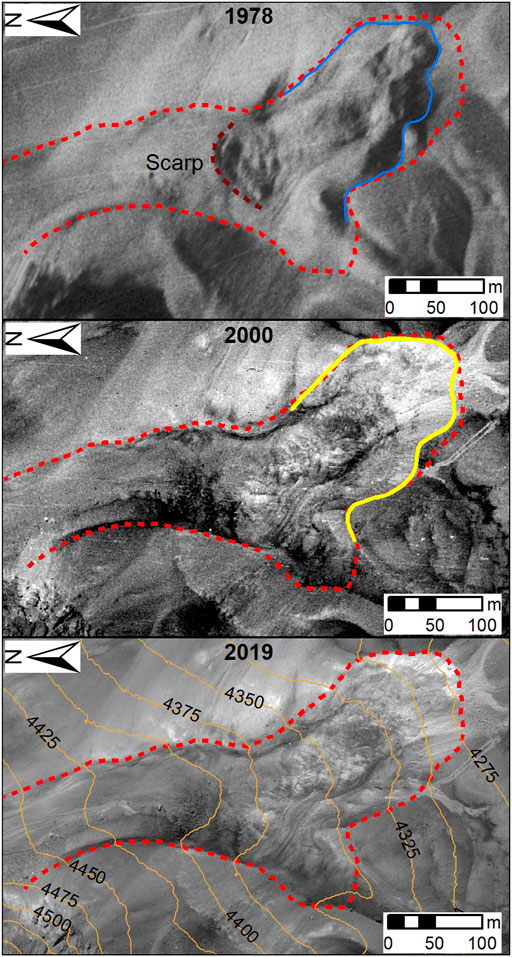
FIGURE 11. Sequence of orthoimages for the El Cachito rock glacier. The front toe of the landform that could be identified is indicated in blue (1978) and yellow (2000). Red dashed line indicates the landform outline in 2019. Note the strong changes in the surface morphology just below the scarp between 1978 and 2000. © CNES (2018), and Airbus DS (2018), all rights reserved.
Aside from the collapse of the Las Tórtolas rock glacier (20 km to the N, 4,500 m a.s.l, Bodin et al., 2012) or the sudden acceleration of the South Infiernillo Alto rock glacier after the artificial overload by waste deposits (330 km to the S, 3,900 m a.s.l, Valenzuela, 2004), there are no reports about destabilised or collapsed rock glaciers in the Andes. Nevertheless, a visual evaluation for the area surrounding the Tapado site (30°S) using Google Earth Pro revealed at least two other rock glaciers exhibiting destabilised morphologies (e.g. large transverse scarps and rapid terminus advance). The absence of detailed geomorphological maps and the lack of geophysical information hinders our ability to unravel the exact processes from these particular types of slope failures. Nevertheless, the destabilisation process in these rock glaciers stresses the need for more studies in the context of periglacial hazards in this part of the Andes (Iribarren Anacona et al., 2015; Vergara Dal Pont et al., 2020).
6 Conclusion
We have compiled one of the longest records of rock glacier kinematics in the Southern Hemisphere. The quantification of kinematics on different landforms was based on an assemblage of diverse remote sensing datasets covering the 1956–2019 period. Average rock glacier velocities ranged from 0.26 m/yr during the 1978–2000 up to 1.25 m/yr during the 2014–2019 periods. The recent rock glacier acceleration trend in this part of the Dry Andes mimics what has been reported in the Northern Hemisphere. UAV-derived datasets provided detailed short-term surface elevation changes and surface velocities at the northern frontal lobe of the Tapado complex, which were not observable with the other datasets.
Archival aerial photography, high-resolution satellite images and UAV surveys are suitable for determining the surface flow of different cryospheric components located in remote areas. The combination of UAV surveys and SfM photogrammetry can help document rapid cryospheric changes in a relatively low-cost approach. Furthermore, improved landform documentation can be achieved with the assessment of past and recent kinematics information. Also, our contribution can further support the work of the IPA Action Group rock glacier kinematics and inventories, which want to establish rock glacier kinematic as an Essential Climate Variable (ECV) in the framework of the Global Climate Observing System (GCOS) of the World Meteorological Organization (WMO). In this context, the appropriate analysis of archival aerial photography can help to reduce the paucity of long-term systematic measurements on rock glacier kinematics and fill the gap between Northern and Southern hemisphere permafrost observations.
Data Availability Statement
The raw data supporting the conclusion of this article will be made available by the authors, without undue reservation.
Author Contributions
SV designed the study and wrote the manuscript under the supervision of CL, and SV performed the two UAV campaigns, processed the GNSS data, historical photographs and satellite imagery. DFB, and XB helped with GNSS and archival aerial photography processing. SV, SM, NS, BR, and XB performed data acquisition during several field trips. All authors contributed to editing the manuscript.
Funding
SV recognizes the financial support of the Leading House for the Latin American Region (University of St. Gallen), grant number MOB1829.
Conflict of Interest
The authors declare that the research was conducted in the absence of any commercial or financial relationships that could be construed as a potential conflict of interest.
Publisher’s Note
All claims expressed in this article are solely those of the authors and do not necessarily represent those of their affiliated organizations, or those of the publisher, the editors and the reviewers. Any product that may be evaluated in this article, or claim that may be made by its manufacturer, is not guaranteed or endorsed by the publisher.
Acknowledgments
We greatly acknowledge the Geographical Military Institute (IGM) for the aerial photographs of Tapado and the Water Directorate of Chile (DGA) for the 2015 ALS data. We wish to thank the European Space Agency for the free provision of the Pléiades imagery through the Restrained Dataset project 41743. The original design of the surface rock glacier kinematics and the shallow borehole instruments, whose results are cited in the text, was initiated during the DGA-2010 funded programme ‘Dynamics of rock glaciers in semiarid Chile’ by Alexander Brenning, XB, and Guillermo Azócar (Pontificia Universidad Católica de Chile, Instituto de Geografía). DF acknowledges the Vicerrectoría de Investigación y Desarrollo, Universidad de Concepción, Postdoctorado VRID. We thank the editor, Matt Westoby, and two reviewers for their very useful comments on our manuscript.
Supplementary Material
The Supplementary Material for this article can be found online at: https://www.frontiersin.org/articles/10.3389/frsen.2021.784015/full#supplementary-material
References
Arenson, L., Hoelzle, M., and Springman, S. (2002). Borehole Deformation Measurements and Internal Structure of Some Rock Glaciers in Switzerland. Permafrost Periglac. Process. 13, 117–135. doi:10.1002/ppp.414
Azócar, G. F., Brenning, A., and Bodin, X. (2017). Permafrost Distribution Modelling in the Semi-arid Chilean Andes. The Cryosphere 11, 877–890. doi:10.5194/tc-11-877-2017
Azócar, G. F., and Brenning, A. (2010). Hydrological and Geomorphological Significance of Rock Glaciers in the Dry Andes, Chile (27°-33°S). Permafrost Periglac. Process. 21, 42–53. doi:10.1002/ppp.669
Barboux, C., Delaloye, R., and Lambiel, C. (2014). Inventorying Slope Movements in an Alpine Environment Using DInSAR. Earth Surf. Process. Landforms 39, 2087–2099. doi:10.1002/esp.3603
Barcaza, G., Nussbaumer, S. U., Tapia, G., Valdés, J., García, J.-L., Videla, Y., et al. (2017). Glacier Inventory and Recent Glacier Variations in the Andes of Chile, South America. Ann. Glaciol. 58, 166–180. doi:10.1017/aog.2017.28
Barnhart, W. D., Murray, J. R., Briggs, R. W., Gomez, F., Miles, C. P. J., Svarc, J., et al. (2016). Coseismic Slip and Early Afterslip of the 2015 Illapel, Chile, Earthquake: Implications for Frictional Heterogeneity and Coastal Uplift. J. Geophys. Res. Solid Earth 121, 6172–6191. doi:10.1002/2016JB013124
Barry, R. G., and Gan, T. Y. (2011). The Global Cryosphere. Cambridge: Cambridge University Press. doi:10.1017/CBO9780511977947The Global Cryosphere
Barsch, D. (1996). Rockglaciers: Indicators for the Present and Former Geoecology in High Mountain Environments. Berlin: Springer-Verlag. doi:10.1007/978-3-642-80093-1
Berthling, I. (2011). Beyond Confusion: Rock Glaciers as Cryo-Conditioned Landforms. Geomorphology 131, 98–106. doi:10.1016/j.geomorph.2011.05.002
Blöthe, J. H., Halla, C., Schwalbe, E., Bottegal, E., Trombotto Liaudat, D., and Schrott, L. (2020). Surface Velocity fields of Active Rock Glaciers and Ice‐debris Complexes in the Central Andes of Argentina. Earth Surf. Process. Landforms 46, esp.504–522. doi:10.1002/esp.5042
Bodin, X., Krysiecki, J.-M., Schoeneich, P., Le Roux, O., Lorier, L., Echelard, T., et al. (2017). The 2006 Collapse of the Bérard Rock Glacier (Southern French Alps). Permafrost Periglac. Process. 28, 209–223. doi:10.1002/ppp.1887
Bodin, X., Krysiecki, J.-M., and Iribarren-Anacona, P. (2012). “Recent Collapse of Rock Glaciers: Two Study Cases in the Alps and in the Andes,” in 12th Congress, Protection of Living Spaces from Natural Hazards, Grenoble, France.
Bodin, X., Rojas, F., and Brenning, A. (2010). Status and Evolution of the Cryosphere in the Andes of Santiago (Chile, 33.5°S.). Geomorphology 118, 453–464. doi:10.1016/j.geomorph.2010.02.016
Bosson, J.-B., and Lambiel, C. (2016). Internal Structure and Current Evolution of Very Small Debris-Covered Glacier Systems Located in Alpine Permafrost Environments. Front. Earth Sci. 4. doi:10.3389/feart.2016.00039
Bown, F., Rivera, A., and Acuña, C. (2008). Recent Glacier Variations at the Aconcagua basin, central Chilean Andes. Ann. Glaciol. 48, 43–48. doi:10.3189/172756408784700572
Brardinoni, F., Scotti, R., Sailer, R., and Mair, V. (2019). Evaluating Sources of Uncertainty and Variability in Rock Glacier Inventories. Earth Surf. Process. Landforms 44, 2450–2466. doi:10.1002/esp.4674
Brenning, A., and Azócar, G. F. (2010). Minería Y Glaciares Rocosos: Impactos Ambientales, Antecedentes Políticos Y Legales, Y Perspectivas Futuras. Rev. Geogr. Norte Gd. 158, 143–158. doi:10.4067/s0718-34022010000300008
Brenning, A. (2008). “The Impact of Mining on Rock Glaciers and Glaciers: Examples from Central Chile,” in Darkening Peaks: Glacier Retreat, Science And Society. Editors B. S. Orlove, E. Wiegandt, and B. Luckman (Berkeley: University of California Press), 196–205.
Buchli, T., Merz, K., Zhou, X., Kinzelbach, W., and Springman, S. M. (2013). Characterization and Monitoring of the Furggwanghorn Rock Glacier, Turtmann Valley, Switzerland: Results from 2010 to 2012. Vadose Zone J. 12, vzj20120067. doi:10.2136/vzj2012.0067
Burger, K. C., Degenhardt, J. J., and Giardino, J. R. (1999). Engineering Geomorphology of Rock Glaciers. Geomorphology 31, 93–132. doi:10.1016/S0169-555X(99)00074-4
Carrasco, J. F., Osorio, R., and Casassa, G. (2008). Secular Trend of the Equilibrium-Line Altitude on the Western Side of the Southern Andes, Derived from Radiosonde and Surface Observations. J. Glaciol. 54, 538–550. doi:10.3189/002214308785837002
Carrivick, J. L., Smith, M. W., and Quincey, D. J. (2016). Structure from Motion in the Geosciences. Chichester, UK: John Wiley & Sons. doi:10.1002/9781118895818Structure from Motion in the Geosciences
CEAZA (2021). Datos provistos por CEAZA, obtenidos desde. www.ceazamet.cl. Available at: www.ceazamet.cl (Accessed June 5, 2021).
Cicoira, A., Beutel, J., Faillettaz, J., and Vieli, A. (2019). Water Controls the Seasonal Rhythm of Rock Glacier Flow. Earth Planet. Sci. Lett. 528, 115844. doi:10.1016/j.epsl.2019.115844
Cicoira, A., Marcer, M., Gärtner‐Roer, I., Bodin, X., Arenson, L. U., and Vieli, A. (2021). A General Theory of Rock Glacier Creep Based on In‐situ and Remote Sensing Observations. Permafrost and Periglac Process 32, 139–153. doi:10.1002/ppp.2090
Corte, A. (1976). The Hydrological Significance of Rock Glaciers. J. Glaciol. 17, 157–158. doi:10.1017/s0022143000030859
Debella-Gilo, M., and Kääb, A. (2011). Sub-pixel Precision Image Matching for Measuring Surface Displacements on Mass Movements Using Normalized Cross-Correlation. Remote Sensing Environ. 115, 130–142. doi:10.1016/j.rse.2010.08.012
Delaloye, R., Lambiel, C., Lugon, R., Raetzo, H., and Strozzi, T. (2007). Typical ERS InSAR Signature of Slope Movements in a Periglacial Mountain Environment (Swiss Alps). Montreux: European Space Agency, 2–7. (Special Publication) ESA SP.
Delaloye, R., Morard, S., Barboux, C., Abbet, D., Gruber, V., Riedo, M., et al. (2013). Rapidly Moving Rock Glaciers in Mattertal. Gesellschaft: Jahrestagung der Schweizerischen Geomorphol, 21–31.
DIGIMAPAS (2015). Modelos Digital de Elevación de Centro Montañosos y Glaciares de las zonas Glaciológicas Norte y Centro, Mediante Lidar Aerotransportado. Santiago, Chile. (Final Report).
Dirección General de Aguas [DGA] (2010). Dinámica de Glaciares Rocosos en el Chile Semiárido: Parte I, Plan de Monitoreo.
Dobinski, W. (2011). Permafrost. Earth-Science Rev. 108, 158–169. doi:10.1016/j.earscirev.2011.06.007
Drewes, J., Moreiras, S., and Korup, O. (2018). Permafrost Activity and Atmospheric Warming in the Argentinian Andes. Geomorphology 323, 13–24. doi:10.1016/j.geomorph.2018.09.005
Eriksen, H. Ø., Rouyet, L., Lauknes, T. R., Berthling, I., Isaksen, K., Hindberg, H., et al. (2018). Recent Acceleration of a Rock Glacier Complex, Ádjet, Norway, Documented by 62 Years of Remote Sensing Observations. Geophys. Res. Lett. 45, 8314–8323. doi:10.1029/2018GL077605
Espizua, L. E., and Pitte, P. (2009). The Little Ice Age Glacier advance in the Central Andes (35°S), Argentina. Palaeogeogr. Palaeoclimatol. Palaeoecol. 281, 345–350. doi:10.1016/j.palaeo.2008.10.032
Falaschi, D., Castro, M., Masiokas, M., Tadono, T., and Ahumada, A. L. (2014). Rock Glacier Inventory of the Valles Calchaquíes Region (∼ 25°S), Salta, Argentina, Derived from ALOS Data. Permafrost Periglac. Process. 25, 69–75. doi:10.1002/ppp.1801
Falvey, M., and Garreaud, R. D. (2009). Regional Cooling in a Warming World: Recent Temperature Trends in the Southeast Pacific and along the West Coast of Subtropical South America (1979-2006). J. Geophys. Res. 114, 1–16. doi:10.1029/2008JD010519
Farías-Barahona, D., Vivero, S., Casassa, G., Schaefer, M., Burger, F., Seehaus, T., et al. (2019). Geodetic Mass Balances and Area Changes of Echaurren Norte Glacier (Central Andes, Chile) between 1955 and 2015. Remote Sensing 11, 260. doi:10.3390/rs11030260
Farías-Barahona, D., Wilson, R., Bravo, C., Vivero, S., Caro, A., Shaw, T. E., et al. (2020). A Near 90-year Record of the Evolution of El Morado Glacier and its Proglacial lake, Central Chilean Andes. J. Glaciol. 66, 846–860. doi:10.1017/jog.2020.52
Francou, B., Fabre, D., Pouyaud, B., Jomelli, V., and Arnaud, Y. (1999). Symptoms of Degradation in a Tropical Rock Glacier, Bolivian Andes. Permafrost Periglac. Process. 10, 91–100. doi:10.1002/(SICI)1099-1530(199901/03)10:1<91:AID-PPP304>3.0.CO;2-B
French, H. M. (2017). The Periglacial Environment. 4th ed. Chichester, UK: John Wiley & Sons. doi:10.1002/9781119132820The Periglacial Environment 4e
Garreaud, R. D., Alvarez-Garreton, C., Barichivich, J., Boisier, J. P., Christie, D., Galleguillos, M., et al. (2017). The 2010-2015 Megadrought in central Chile: Impacts on Regional Hydroclimate and Vegetation. Hydrol. Earth Syst. Sci. 21, 6307–6327. doi:10.5194/hess-21-6307-2017
Garreaud, R. D., Boisier, J. P., Rondanelli, R., Montecinos, A., Sepúlveda, H. H., and Veloso‐Aguila, D. (2020). The Central Chile Mega Drought (2010-2018): A Climate Dynamics Perspective. Int. J. Climatol. 40, 421–439. doi:10.1002/joc.6219
Garreaud, R. (2007). Precipitation and Circulation Covariability in the Extratropics. J. Clim. 20, 4789–4797. doi:10.1175/JCLI4257.1
Ginot, P., Kull, C., Schotterer, U., Schwikowski, M., and Gäggeler, H. W. (2006). Glacier Mass Balance Reconstruction by Sublimation Induced Enrichment of Chemical Species on Cerro Tapado (Chilean Andes). Clim. Past 2, 21–30. doi:10.5194/cp-2-21-2006
Groh, T., and Blöthe, J. H. (2019). Rock Glacier Kinematics in the Kaunertal, Ötztal Alps, Austria. Geosciences 9, 373. doi:10.3390/geosciences9090373
Gruber, S. (2012). Derivation and Analysis of a High-Resolution Estimate of Global Permafrost Zonation. The Cryosphere 6, 221–233. doi:10.5194/tc-6-221-2012
Haeberli, W., and Beniston, M. (1998). Climate Change and its Impacts on Glaciers and Permafrost in the Alps. Ambio 27, 258–265. doi:10.2307/4314732
Haeberli, W., Hallet, B., Arenson, L., Elconin, R., Humlum, O., Kääb, A., et al. (2006). Permafrost Creep and Rock Glacier Dynamics. Permafrost Periglac. Process. 17, 189–214. doi:10.1002/ppp.561
Haeberli, W. (1979). Holocene Push-Moraines in alpine Permafrost. Geografiska Annaler: Ser. A, Phys. Geogr. 61, 43–48. doi:10.1080/04353676.1979.11879980
Haeberli, W. (2000). Modern Research Perspectives Relating to Permafrost Creep and Rock Glaciers: A Discussion. Permafrost Periglac. Process. 11, 290–293. doi:10.1002/1099-1530(200012)11:4<290:aid-ppp372>3.0.co;2-0
Halla, C., Blöthe, J. H., Tapia Baldis, C., Trombotto Liaudat, D., Hilbich, C., Hauck, C., et al. (2021). Ice Content and Interannual Water Storage Changes of an Active Rock Glacier in the Dry Andes of Argentina. The Cryosphere 15, 1187–1213. doi:10.5194/tc-15-1187-2021
Hartl, L., Fischer, A., Stocker‐waldhuber, M., and Abermann, J. (2016). Recent Speed‐up of an alpine Rock Glacier: an Updated Chronology of the Kinematics of Outer Hochebenkar Rock Glacier Based on Geodetic Measurements. Geografiska Annaler: Ser. A, Phys. Geogr. 98, 129–141. doi:10.1111/geoa.12127
Hock, R., Rasul, G., Adler, C., Cáceres, B., Gruber, S., Hirabayashi, Y., et al. (2019). “High Mountain Areas,” in IPCC Special Report On the Ocean And Cryosphere In a Changing Climate. IPCC - Intergovernmental Panel on Climate Change). H.-O. Pörtner, D. C. Roberts, V. Masson-Delmotte, P. Zhai, M. Tignor, E. Poloczanskaet al. 131–202.
Hu, Y., Liu, L., Wang, X., Zhao, L., Wu, T., Cai, J., et al. (2021). Quantification of Permafrost Creep Provides Kinematic Evidence for Classifying a Puzzling Periglacial Landform. Earth Surf. Process. Landforms 46, 465–477. doi:10.1002/esp.5039
Ikeda, A., and Matsuoka, N. (2006). Pebbly versus Bouldery Rock Glaciers: Morphology, Structure and Processes. Geomorphology 73, 279–296. doi:10.1016/j.geomorph.2005.07.015
Imhof, M. (1996). Modelling and Verification of the Permafrost Distribution in the Bernese Alps (Western Switzerland). Permafrost Periglac. Process. 7, 267–280. doi:10.1002/(SICI)1099-1530(199609)7:3<267:AID-PPP221>3.0.CO;2-L
Iribarren Anacona, P., Mackintosh, A., and Norton, K. P. (2015). Hazardous Processes and Events from Glacier and Permafrost Areas: Lessons from the Chilean and Argentinean Andes. Earth Surf. Process. Landforms 40, 2–21. doi:10.1002/esp.3524
James, T. D., Murray, T., Barrand, N. E., and Barr, S. L. (2006). Extracting Photogrammetric Ground Control from Lidar DEMs for Change Detection. Photogrammetric Rec. 21, 312–328. doi:10.1111/j.1477-9730.2006.00397.x
Janke, J. R., Bellisario, A. C., and Ferrando, F. A. (2015). Classification of Debris-Covered Glaciers and Rock Glaciers in the Andes of central Chile. Geomorphology 241, 98–121. doi:10.1016/j.geomorph.2015.03.034
PERMOS (2019). “Permafrost in Switzerland 2014/2015 to 2017/2018,” in Cryospheric Commission of the Swiss Academy of Sciences. Editors J. Nötzli, C. Pellet, and B. Staub. doi:10.13093/permos-2019-01
Kääb, A. (2021). Correlation Image Analysis Software (CIAS). Available at: https://www.mn.uio.no/geo/english/research/projects/icemass/cias/(Accessed March 20, 2021).
Kääb, A., Frauenfelder, R., and Roer, I. (2007). On the Response of Rockglacier Creep to Surface Temperature Increase. Glob. Planet. Change 56, 172–187. doi:10.1016/j.gloplacha.2006.07.005
Kääb, A. (2002). Monitoring High-Mountain Terrain Deformation from Repeated Air- and Spaceborne Optical Data: Examples Using Digital Aerial Imagery and ASTER Data. ISPRS J. Photogrammetry Remote Sensing 57, 39–52. doi:10.1016/S0924-2716(02)00114-4
Kääb, A. (2005). Remote Sensing of Mountain Glaciers and Permafrost Creep. Zürich: Geographisches Institut der Universität Zürich.
Kääb, A., Strozzi, T., Bolch, T., Caduff, R., Trefall, H., Stoffel, M., et al. (2021). Inventory and Changes of Rock Glacier Creep Speeds in Ile Alatau and Kungöy Ala-Too, Northern Tien Shan, since the 1950s. The Cryosphere 15, 927–949. doi:10.5194/tc-15-927-2021
Kääb, A., and Vollmer, M. (2000). Surface Geometry, Thickness Changes and Flow Fields on Creeping Mountain Permafrost: Automatic Extraction by Digital Image Analysis. Permafr. Periglac. Process. 11, 315–326. doi:10.1002/1099-1530(200012)11:4<315:AID-PPP365>3.0.CO;2-J
Kellerer‐Pirklbauer, A., Delaloye, R., Lambiel, C., Gärtner-Roer, I., Kaufmann, V., Scapozza, C., et al. (2018). “Interannual Variability of Rock Glacier Flow Velocities in the European Alps,” in Proceedings of the 5th European Conference on Permafrost (EUCOP5-2018), Chamonix, France, 396–397.
Kneisel, C., and Kääb, A. (2007). Mountain Permafrost Dynamics within a Recently Exposed Glacier Forefield Inferred by a Combined Geomorphological, Geophysical and Photogrammetrical Approach. Earth Surf. Process. Landforms 32, 1797–1810. doi:10.1002/esp.1488
Kronenberg, J. (2013). Linking Ecological Economics and Political Ecology to Study Mining, Glaciers and Global Warming. Env. Pol. Gov. 23, 75–90. doi:10.1002/eet.1605
Lliboutry, L. (1998). “Glaciers of South America,” in Satellite Image Atlas of Glaciers of the World. Editors R. S. Williams, and J. G. Ferrigno. Geological survey professional paper, 1386, 1103.
Marangunic, C. (1976). Actas del Primer Congreso Geologico Chileno. Santiago, Chile), 291–300.El glaciar de roca Pedregoso, río Colorado, V Region.
Marcer, M., Cicoira, A., Cusicanqui, D., Bodin, X., Echelard, T., Obregon, R., et al. (2021). Rock Glaciers throughout the French Alps Accelerated and Destabilised since 1990 as Air Temperatures Increased. Commun. Earth Environ. 2, 81. doi:10.1038/s43247-021-00150-6
Marcer, M., Ringsø Nielsen, S., Ribeyre, C., Kummert, M., Duvillard, P. A., Schoeneich, P., et al. (2020). Investigating the Slope Failures at the Lou Rock Glacier Front, French Alps. Permafrost and Periglac Process 31, 15–30. doi:10.1002/ppp.2035
Marcer, M., Serrano, C., Brenning, A., Bodin, X., Goetz, J., and Schoeneich, P. (2019). Evaluating the Destabilization Susceptibility of Active Rock Glaciers in the French Alps. The Cryosphere 13, 141–155. doi:10.5194/tc-13-141-2019
Martini, M. A., Strelin, J. A., Flores, E., Astini, R. A., and Kaplan, M. R. (2017). Recent Climate Warming and the Varas Rock Glacier Activity, Cordillera Oriental, Central Andes of Argentina. GeoResJ 14, 67–79. doi:10.1016/j.grj.2017.08.002
Masiokas, M. H., Rabatel, A., Rivera, A., Ruiz, L., Pitte, P., Ceballos, J. L., et al. (2020). A Review of the Current State and Recent Changes of the Andean Cryosphere. Front. Earth Sci. 8, 1–27. doi:10.3389/feart.2020.00099
Micheletti, N., Lambiel, C., and Lane, S. N. (2015). Investigating Decadal‐scale Geomorphic Dynamics in an alpine Mountain Setting. J. Geophys. Res. Earth Surf. 120, 2155–2175. doi:10.1002/2015JF003656
Mikhail, E. M., Bethel, J. S., and McGlone, J. C. (2001). Introduction to Modern Photogrammetry. New York: John Wiley & Sons.
Milana, J. P., and Güell, A. (2008). Diferencias mecánicas e hídricas del permafrost en glaciares de rocas glacigénicos y criogénicos, obtenidas de datos sísmicos en el Tapado, Chile. Rev. La Asoc. Geol. Argentina 63, 310–325.
Mollaret, C., Hilbich, C., Pellet, C., Flores-Orozco, A., Delaloye, R., and Hauck, C. (2019). Mountain Permafrost Degradation Documented through a Network of Permanent Electrical Resistivity Tomography Sites. The Cryosphere 13, 2557–2578. doi:10.5194/tc-13-2557-2019
Monnier, S., and Kinnard, C. (2013). Internal Structure and Composition of a Rock Glacier in the Andes (Upper Choapa valley, Chile) Using Borehole Information and Ground-Penetrating Radar. Ann. Glaciol. 54, 61–72. doi:10.3189/2013AoG64A107
Monnier, S., Kinnard, C., Surazakov, A., and Bossy, W. (2014). Geomorphology, Internal Structure, and Successive Development of a Glacier Foreland in the Semiarid Chilean Andes (Cerro Tapado, Upper Elqui Valley, 30°08′ S., 69°55′ W.). Geomorphology 207, 126–140. doi:10.1016/j.geomorph.2013.10.031
Monnier, S., and Kinnard, C. (2015). Reconsidering the Glacier to Rock Glacier Transformation Problem: New Insights from the central Andes of Chile. Geomorphology 238, 47–55. doi:10.1016/j.geomorph.2015.02.025
Monnier, S., and Kinnard, C. (2017). Pluri-decadal (1955-2014) Evolution of Glacier-Rock Glacier Transitional Landforms in the central Andes of Chile (30-33° S). Earth Surf. Dynam. 5, 493–509. doi:10.5194/esurf-5-493-2017
Montecinos, A., and Aceituno, P. (2003). Seasonality of the ENSO-Related Rainfall Variability in central Chile and Associated Circulation Anomalies. J. Clim. 16, 281–296. doi:10.1175/1520-0442(2003)016<0281:SOTERR>2.0.CO;2
Necsoiu, M., Onaca, A., Wigginton, S., and Urdea, P. (2016). Rock Glacier Dynamics in Southern Carpathian Mountains from High-Resolution Optical and Multi-Temporal SAR Satellite Imagery. Remote Sensing Environ. 177, 21–36. doi:10.1016/j.rse.2016.02.025
Nicholson, L. I., Pętlicki, M., Partan, B., and MacDonell, S. (2016). 3-D Surface Properties of Glacier Penitentes over an Ablation Season, Measured Using a Microsoft Xbox Kinect. The Cryosphere 10, 1897–1913. doi:10.5194/tc-10-1897-2016
Noetzli, J., Arenson, L. U., Bast, A., Beutel, J., Delaloye, R., Farinotti, D., et al. (2021). Best Practice for Measuring Permafrost Temperature in Boreholes Based on the Experience in the Swiss Alps. Front. Earth Sci. 9, 1–20. doi:10.3389/feart.2021.607875
Outcalt, S. I., Nelson, F. E., and Hinkel, K. M. (1990). The Zero-Curtain Effect: Heat and Mass Transfer across an Isothermal Region in Freezing Soil. Water Resour. Res. 26, 1509–1516. doi:10.1029/WR026i007p01509
Paskoff, R. (1967). Notes de morphologie glaciaire sur la haute vallée du Rio Elqui (Province de Coquimbo, Chili). bagf 44, 44–55. doi:10.3406/bagf.1967.5818
Perucca, L., and Esper Angillieri, M. Y. (2011). Glaciers and Rock Glaciers' Distribution at 28° SL, Dry Andes of Argentina, and Some Considerations about Their Hydrological Significance. Environ. Earth Sci. 64, 2079–2089. doi:10.1007/s12665-011-1030-z
Poli, D., Remondino, F., Angiuli, E., and Agugiaro, G. (2015). Radiometric and Geometric Evaluation of GeoEye-1, WorldView-2 and Pléiades-1A Stereo Images for 3D Information Extraction. ISPRS J. Photogrammetry Remote Sensing 100, 35–47. doi:10.1016/j.isprsjprs.2014.04.007
Pourrier, J., Jourde, H., Kinnard, C., Gascoin, S., and Monnier, S. (2014). Glacier Meltwater Flow Paths and Storage in a Geomorphologically Complex Glacial Foreland: The Case of the Tapado Glacier, Dry Andes of Chile (30°S). J. Hydrol. 519, 1068–1083. doi:10.1016/j.jhydrol.2014.08.023
Rabatel, A., Castebrunet, H., Favier, V., Nicholson, L., and Kinnard, C. (2011). Glacier Changes in the Pascua-Lama Region, Chilean Andes (29° S): Recent Mass Balance and 50 Yr Surface Area Variations. The Cryosphere 5, 1029–1041. doi:10.5194/tc-5-1029-2011
Redpath, T. A. N., Sirguey, P., Fitzsimons, S. J., and Kääb, A. (2013). Accuracy Assessment for Mapping Glacier Flow Velocity and Detecting Flow Dynamics from ASTER Satellite Imagery: Tasman Glacier, New Zealand. Remote Sensing Environ. 133, 90–101. doi:10.1016/j.rse.2013.02.008
Réveillet, M., MacDonell, S., Gascoin, S., Kinnard, C., Lhermitte, S., and Schaffer, N. (2020). Impact of Forcing on Sublimation Simulations for a High Mountain Catchment in the Semiarid Andes. The Cryosphere 14, 147–163. doi:10.5194/tc-14-147-2020
RGIK (2021). IPA Action Group Rock Glacier Inventories and Kinematics.Towards Standard Guidelines for Inventorying Rock Glaciers: Baseline Concepts (Version 4.2.1).
Roer, I., and Nyenhuis, M. (2007). Rockglacier Activity Studies on a Regional Scale: Comparison of Geomorphological Mapping and Photogrammetric Monitoring. Earth Surf. Process. Landforms 32, 1747–1758. doi:10.1002/esp.1496
Ruiz Pereira, S. F., and Veettil, B. K. (2019). Glacier Decline in the Central Andes (33°S): Context and Magnitude from Satellite and Historical Data. J. South Am. Earth Sci. 94, 102249. doi:10.1016/j.jsames.2019.102249
Ruiz, S., and Madariaga, R. (2018). Historical and Recent Large Megathrust Earthquakes in Chile. Tectonophysics 733, 37–56. doi:10.1016/j.tecto.2018.01.015
Schaffer, N., MacDonell, S., Réveillet, M., Yáñez, E., and Valois, R. (2019). Rock Glaciers as a Water Resource in a Changing Climate in the Semiarid Chilean Andes. Reg. Environ. Change 19, 1263–1279. doi:10.1007/s10113-018-01459-3
Schrott, L. (1996). Some Geomorphological-Hydrological Aspects of Rock Glaciers in the Andes (San Juan, Argentina). Z. für. Geomorphol. 104, 161–173.
Shrivastava, M. N., González, G., Moreno, M., Chlieh, M., Salazar, P., Reddy, C. D., et al. (2016). Coseismic Slip and Afterslip of the 2015 Mw 8.3 Illapel (Chile) Earthquake Determined from Continuous GPS Data. Geophys. Res. Lett. 43 (10), 710–10,719. doi:10.1002/2016GL070684
Sinclair, K. E., and MacDonell, S. (2016). Seasonal Evolution of Penitente Glaciochemistry at Tapado Glacier, Northern Chile. Hydrol. Process. 30, 176–186. doi:10.1002/hyp.10531
Strauch, G., Oyarzun, J., Fiebig-Wittmaack, M., González, E., and Weise, S. M. (2006). Contributions of the Different Water Sources to the Elqui River Runoff (Northern Chile) Evaluated by H/O Isotopes. Isotopes Environ. Health Stud. 42, 303–322. doi:10.1080/10256010600839707
Trombotto, D., Buk, E., and Hernández, J. (1997). Monitoring of Mountain Permafrost in the Central Andes, Cordon del Plata, Mendoza, Argentina. Permafrost Periglac. Process. 8, 123–129. doi:10.1002/(SICI)1099-1530(199701)8:1<123:AID-PPP242>3.0.CO;2-M
Trombotto-Liaudat, D., and Bottegal, E. (2020). Recent Evolution of the Active Layer in the Morenas Coloradas Rock Glacier, Central Andes, Mendoza, Argentina and its Relation with Kinematics. Cig 46, 159–185. doi:10.18172/cig.3946
Valenzuela, L. (2004). “Stability Issues in Natural and Man Made Slopes in Mining,” in Landslides: Evaluation and Stabilization/Glissement de Terrain: Evaluation et Stabilisation, Set of 2 Volumes: Proceedings of the Ninth International Symposium on Landslides. Editors W. A. Lacerda, M. Ehrlich, S. A. B. Fontoura, and A. S. F. Sayão (Rio de Janeiro: Taylor & Francis Group), 467–473. doi:10.1201/b16816-66
Vergara Dal Pont, I., Moreiras, S. M., Santibañez Ossa, F., Araneo, D., and Ferrando, F. (2020). Debris Flows Triggered from Melt of Seasonal Snow and Ice within the Active Layer in the Semi‐arid Andes. Permafrost and Periglac Process 31, 57–68. doi:10.1002/ppp.2020
Villarroel, C., Tamburini Beliveau, G., Forte, A., Monserrat, O., and Morvillo, M. (2018). DInSAR for a Regional Inventory of Active Rock Glaciers in the Dry Andes Mountains of Argentina and Chile with Sentinel-1 Data. Remote Sensing 10, 1588. doi:10.3390/rs10101588
Vivero, S., and Lambiel, C. (2019). Monitoring the Crisis of a Rock Glacier with Repeated UAV Surveys. Geogr. Helv. 74, 59–69. doi:10.5194/gh-74-59-2019
Vuille, M., and Keimig, F. (2004). Interannual Variability of Summertime Convective Cloudiness and Precipitation in the central Andes Derived from ISCCP-B3 Data. J. Clim. 17, 3334–3348. doi:10.1175/1520-0442(2004)017<3334:IVOSCC>2.0.CO;2
Wagner, S. (1992). Creep of alpine Permafrost, Investigated on the Murtel Rock Glacier. Permafrost Periglac. Process. 3, 157–162. doi:10.1002/ppp.3430030214
Wahrhaftig, C., and Cox, A. (1959). Rock Glaciers in the Alaska Range. Geol. Soc. America Bull. 70, 383–436. doi:10.1130/0016-7606(1959)70[383:rgitar]2.0.co;2
Wainstein, P., Arenson, L. U., and Umerez, J. (2020). Glaciares Rocosos (Glaciares de Escombros) - Crioformas Aún Cotidianamente Confundidas. J. Min. Eng. Res. 2, 47–56. doi:10.35624/jminer2020.01.06
Wangensteen, B., Guðmundsson, Á., Eiken, T., Kääb, A., Farbrot, H., and Etzelmüller, B. (2006). Surface Displacements and Surface Age Estimates for Creeping Slope Landforms in Northern and Eastern Iceland Using Digital Photogrammetry. Geomorphology 80, 59–79. doi:10.1016/j.geomorph.2006.01.034
Wheaton, J. M., Brasington, J., Darby, S. E., and Sear, D. A. (2009). Accounting for Uncertainty in DEMs from Repeat Topographic Surveys: Improved Sediment Budgets. Earth Surf. Process. Landforms 35, a–n. doi:10.1002/esp.1886
Zalazar, L., Ferri, L., Castro, M., Gargantini, H., Gimenez, M., Pitte, P., et al. (2020). Spatial Distribution and Characteristics of Andean Ice Masses in Argentina: Results from the First National Glacier Inventory. J. Glaciol. 66, 938–949. doi:10.1017/jog.2020.55
Keywords: rock glacier, photogrammetry, dry andes, mountain permafrost, Chile
Citation: Vivero S, Bodin X, Farías-Barahona D, MacDonell S, Schaffer N, Robson BA and Lambiel C (2021) Combination of Aerial, Satellite, and UAV Photogrammetry for Quantifying Rock Glacier Kinematics in the Dry Andes of Chile (30°S) Since the 1950s. Front. Remote Sens. 2:784015. doi: 10.3389/frsen.2021.784015
Received: 27 September 2021; Accepted: 26 October 2021;
Published: 19 November 2021.
Edited by:
Matt Westoby, Northumbria University, United KingdomReviewed by:
Levan Tielidze, Victoria University of Wellington, New ZealandLander Van Tricht, Vrije University Brussel, Belgium
Copyright © 2021 Vivero, Bodin, Farías-Barahona, MacDonell, Schaffer, Robson and Lambiel. This is an open-access article distributed under the terms of the Creative Commons Attribution License (CC BY). The use, distribution or reproduction in other forums is permitted, provided the original author(s) and the copyright owner(s) are credited and that the original publication in this journal is cited, in accordance with accepted academic practice. No use, distribution or reproduction is permitted which does not comply with these terms.
*Correspondence: Sebastián Vivero, c2ViYXN0aWFuLnZpdmVyb2FuZHJhZGVAdW5pbC5jaA==