 Ray Nassar1*
 Omid Moeini1
 Jon-Paul Mastrogiacomo2Christopher W. O’Dell3Robert R. Nelson4Matthäus Kiel4Abhishek Chatterjee4Annmarie Eldering4†David Crisp4†
- 1Environment and Climate Change Canada, Toronto, ON, Canada
- 2University of Toronto, Toronto, ON, Canada
- 3Colorado State University, Fort Collins, CO, United States
- 4Jet Propulsion Laboratory, California Institute of Technology, Pasadena, CA, United States
We quantify CO2 emissions from Europe’s largest fossil fuel power plant, the Bełchatόw Power Station in Poland, using CO2 observations from NASA’s Orbiting Carbon Observatory (OCO) 2 and 3 missions on 10 occasions from March 2017 to June 2022. The space-based CO2 emission estimates reveal emission changes with a trend that is consistent with the independent reported hourly power generation trend that results from both permanent and temporary unit shutdowns. OCO-2 and OCO-3 emission estimates agree with the bottom-up emission estimates within their respective 1σ uncertainties for 9 of the 10 occasions. Different methods for defining background values and corresponding uncertainties are explored in order to better understand this important potential error contribution. These results demonstrate the ability of existing space-based CO2 observations to quantify emission reductions for a large facility when adequate coverage and revisits are available. The results are informative for understanding the expected capability and potential limitations of the planned Copernicus Anthropogenic CO2 Monitoring (CO2M) and other future satellites to support monitoring and verification of CO2 emission reductions resulting from climate change mitigation efforts such as the Paris Agreement.
1 Introduction
Reducing CO2 emissions from fossil fuel combustion is essential to controlling the rise in global temperatures, the central objective of the United Nations Framework Convention on Climate Change (UNFCCC) Paris Agreement. About half of global fossil fuel CO2 emissions come from large facilities such as power plants (Singer et al., 2014; IEA, 2019). An observation-based approach for quantifying CO2 emissions from these facilities could support transparency under the Paris Agreement. The use of space-based atmospheric observations in a global CO2 emission monitoring system has been considered for over a decade (Bovensmann et al., 2010; Pacala et al., 2010). The Copernicus Anthropogenic CO2 Monitoring (CO2M) mission is a planned constellation of two to three satellites, which comprise the space component of the European Commission’s greenhouse gas Monitoring and Verification Support (MVS) capacity (Ciais et al., 2015; Meijer et al., 2017; Pinty et al., 2017). The CO2M Mission Requirements Document (MRD) identifies these objectives:
1) To detect emitting hot spots, such as megacities and power plants,
2) To monitor hot spot emissions to assess emission reductions/increases,
3) To assess emission changes against local reduction targets to monitor impacts of Nationally Determined Contributions (NDCs) under the Paris Agreement,
4) To assess the national emissions and changes in 5-year time steps to estimate the global stocktake.
Previously, in Nassar et al. (2017), we presented the first detection and quantification of CO2 emissions from individual power plants derived from observations by NASA’s Orbiting Carbon Observatory 2 (OCO-2) (Crisp et al., 2017), which helped to demonstrate CO2M’s first objective in select cases where adequate coverage was available. Other work has explored different modeling and analysis methods (Zheng et al., 2019) and the simultaneous use of satellite CO2 and NO2 data (Reuter et al., 2019; Hakkarainen et al., 2021) for power plant CO2 emission quantification. Methodological improvements for OCO-2 emission estimates were implemented in Nassar et al. (2021). Here we present the quantification of CO2 emission reductions at the European Union’s largest CO2 point source, the Bełchatów Power Station in Poland, by adapting the Nassar et al. (2021) method for the Orbiting Carbon Observatory 3 (OCO-3), thus demonstrating CO2M’s second objective in a case study on a large power plant. Baseline CO2 observations near Bełchatów were made in March 2017 with OCO-2 (Nassar et al., 2021; Crisp et al., 2022). Using the new CO2 mapping capability of OCO-3 (Taylor et al., 2020) at Bełchatów from April 2020 to June 2022, we determine emission reductions consistent with reported hourly power generation changes. To our knowledge, this work represents the first space-based observational evidence of anthropogenic CO2 emission reductions at the scale of a single facility, demonstrating the feasibility of facility-scale emission monitoring to support efforts to track CO2 emission reductions under the Paris Agreement. Following launch in 2025–2026, CO2M will begin to enable MVS capabilities far surpassing those of existing missions, while in the longer term, an international constellation of satellites with complementary orbits and observing approaches (Crisp et al., 2018) could deliver further enhancements for policy-relevant CO2 emission monitoring.
2 Methods
2.1 Observations and meteorological data
NASA’s OCO-2 satellite (Crisp et al., 2017) was launched in July 2014 and observes from a sun-synchronous orbit (∼705 km altitude) with an equator crossing time of ∼13:30 for the ascending node. OCO-2 has limited imaging capability, measuring the column-averaged mole fraction of CO2 (XCO2) in eight parallelogram-shaped footprints (≤1.29 × 2.25 km2) across a narrow swath that ranges from ∼2 to 10 km. OCO-3 was launched to the International Space Station (ISS) in May 2019 and is similar to OCO-2, but observes from a lower (∼420 km), precessing orbit, rather than a sun-synchronous orbit. OCO-3 also has slightly larger footprints (≤1.6 × 2.2 km2) and enhanced scanning capability through the addition of a Pointing Mirror Assembly (PMA). OCO-3’s PMA enables multiple sweeps of an area in Snapshot Area Mapping (SAM) mode to deliver XCO2 imagery over a city-scale area of interest in under 2 min (Taylor et al., 2020). We often refer to the complete set of observations from a SAM mode overpass as a SAM.
We generated Keyhole Markup Language (KML) files to view OCO-2 and OCO-3 version 10 (v10) XCO2 data, wind vectors and clouds in Google Earth, which enables an assessment of the surrounding area for issues like complex terrain, land-water crossings or relevant secondary sources. Cloud observations used with OCO-2 are from the Moderate Resolution Imaging Spectroradiometer (MODIS) on Aqua, which flies in the A-Train ∼6 min after OCO-2. For OCO-3, both MODIS Aqua and Terra cloud data are considered, although both can have large temporal offsets relative to OCO-3. We use wind information from MERRA-2 (0.5 ° × 0.65 °, 3-h average) (Molod et al., 2015) and ERA-5 (0.25° × 0.25°, instantaneous hourly) (Bell et al., 2020).
OCO-2 and OCO-3 KML files and emission estimates are based on the NASA Atmospheric Carbon Observations from Space (ACOS; O’Dell et al., 2012; Crisp et al., 2012) Build 10 algorithm yielding v10 data. In general, we use bias-corrected but unfiltered OCO-2 and OCO-3 v10 XCO2 data, since the methodology benefits from images with few data gaps, but in two instances for OCO-3 (described later), standard filtering has been applied. In addition to using the same XCO2 retrieval algorithm, both OCO-2 and OCO-3 are also calibrated and validated against the same ground-based reference data from the Total Carbon Column Observing Network (TCCON) (Wunch et al., 2011), which is linked to the World Meteorological Organization (WMO) standard CO2 reference scale. However, for OCO-2, small errors in pointing knowledge (∼1/3 of a footprint) result in XCO2 biases in the presence of rough topography. These biases were greatly reduced in version 9 (Kiel et al., 2019) and version 10 is a further improvement. OCO-3 pointing errors result from different factors than for OCO-2 and efforts to reduce them are still evolving, hence OCO-3 pointing errors may be slightly larger, but typically smaller than a footprint (∼0–2 km).
The 2017-03-28 overpass analyzed in Nassar et al. (2021) is a rare OCO-2 overpass near Bełchatów with the wind direction intersecting the OCO-2 swath, a visually-discernable enhancement and free of other prohibitive issues for emission quantification. This OCO-2 overpass and nine OCO-3 SAMs from April 2020 to June 2022 are shown in Figure 1 and are used in the present analysis to quantify Bełchatów Power Station CO2 emission changes over time.
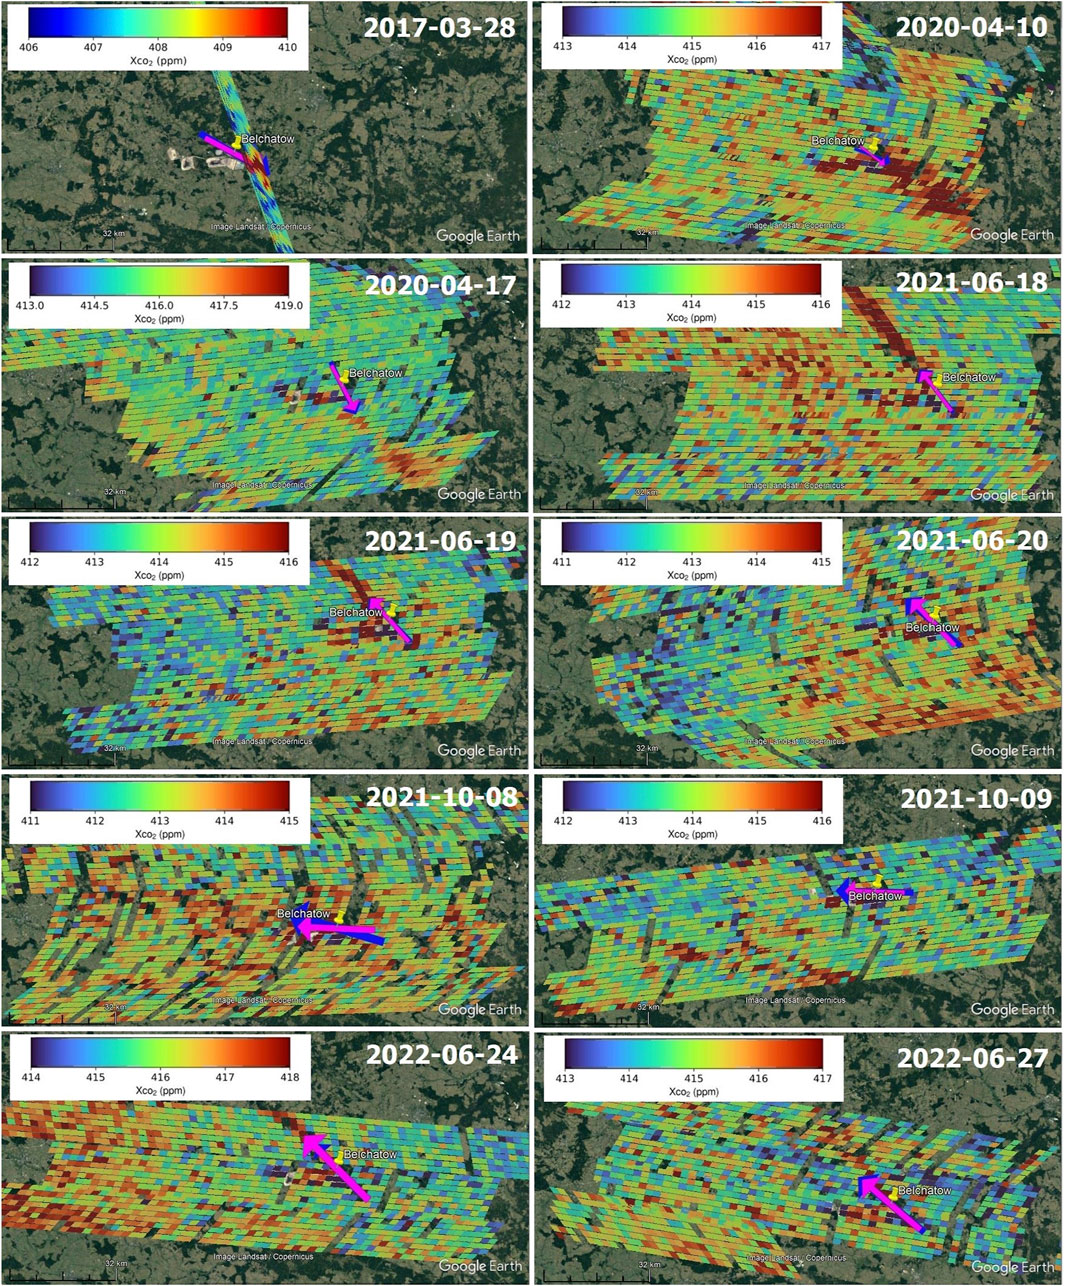
FIGURE 1. Bełchatόw Power Plant overpasses from OCO-2 (2017-03-28) and OCO-3 (all others). Colored parallelograms are bias-corrected XCO2 footprints with customized color scales, overlaid on Google Earth Landsat/Copernicus satellite surface imagery. The power plant location is the yellow tack and the MERRA-2 (blue) and ERA-5 (pink) wind vectors are shown as arrows of length proportional to wind speed. The spatial scale is indicated in the lower left of each panel.
2.2 Gaussian plume model
We simulate XCO2 enhancements using a vertically-integrated Gaussian plume model based on the following equations, as in Nassar et al. (2017; 2021):
V is the CO2 vertical column in (g/m2) at the point source and downwind of it. The x-direction is parallel to the wind direction and the y-direction perpendicular to the wind direction. V depends on the emission rate F (in g/s), the across wind distance y (in m), wind speed u (in m/s) at the height of the plume midline, and the standard deviation in the y-direction, σy (in m). Here x is specified in m and xo = 1,000 m is a characteristic length so that the argument of the exponent is dimensionless. The atmospheric stability parameter a is determined by classifying a source environment by the Pasquill-Gifford stability, which depends on the surface wind speed, cloud cover and time of day (Pasquill, 1961; Martin, 1976). All overpasses are treated as clear sky near the sources based on the fact that OCO-2 or OCO-3 observe successfully and a visual inspection of MODIS cloud data. The vector average of MERRA-2 and ERA-5 is used to reduce effects of outliers from a single meteorological data set. A modified approach to stability parameter a (Pasquill, 1961; Martin, 1976) is applied as in Nassar et al. (2021).
2.3 Plume rise, background, wind optimization and model-observation fit
To determine the height of the plume midline, we account for plume rise above the stack height as in Nassar et al. (2021), assuming a typical rise of 250 m based on Brunner et al. (2019). Emission uncertainties related to plume rise are discussed below.
To determine XCO2 enhancements (ΔXCO2) from OCO-2, a background value is found by averaging footprints within a certain distance of the swath in one or both directions from the plume (excluding a buffer region typically about the length of an OCO-2 footprint) as shown in Figure 2A. For OCO-3, we revise the background methodology for the different coverage offered by SAM mode, instead averaging footprints within a radius of 30 km, excluding the plume and a 3-km narrow buffer region (selected as roughly the length of an OCO-3 footprint), as shown in Figure 3. For each SAM, the mean background value in molecules/m2 from the OCO-3 Level 2 Standard files is converted to g/m2 and used with the mean XCO2 value for the identical set of footprints to obtain a conversion factor “k” (in ppm·g−1m2), which is used to convert the model CO2 enhancements to ΔXCO2 in ppm. Uncertainties related to background selection are discussed below.
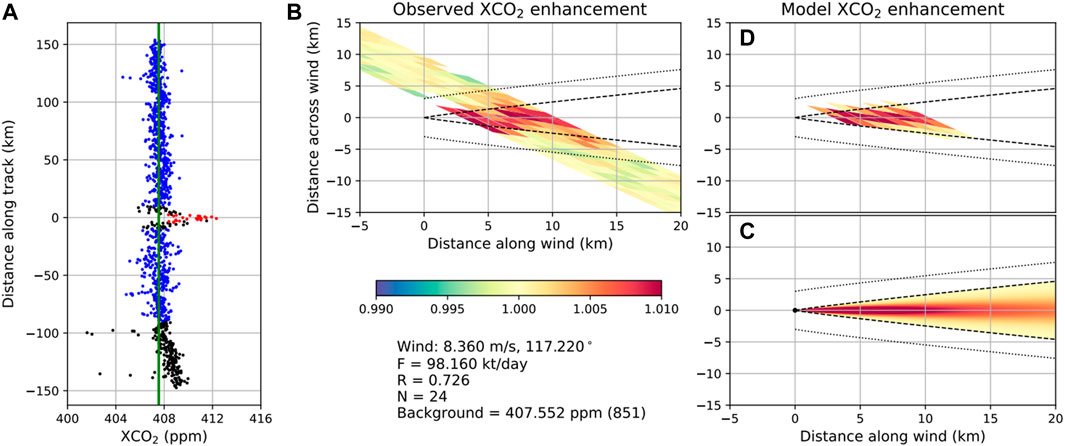
FIGURE 2. CO2 emission quantification from the OCO-2 Bełchatόw overpass on 2017-03-28. (A) A one-dimensional view of XCO2 footprint values by collapsing the cross-track direction to show the enhancement or plume footprints (red), background footprints (blue) and others (black). The background value determined by averaging all blue points is shown as a vertical green line. (B) Observed XCO2 relative to the background value with the positive x-axis aligned with the wind direction. (C) Gaussian plume model XCO2 enhancement with dotted lines denoting a region between the enhancement and background. (D) Model XCO2 enhancements as would be observed by OCO-2 and used in the observation-model fit.

FIGURE 3. Background XCO2 for OCO-3 emission estimates is determined as the average XCO2 within a 30-km radius excluding the plume sector and a narrow buffer region (left). The background uncertainty is determined as the higher uncertainty that results from one of two ensembles: 1) A varying radius ensemble of 20, 30, and 40 km radii (upper centre and right) and 2) the full 30-km radius along with the eastern and western halves of the same radius (lower centre and right).
The OCO-2/OCO-3 footprints that comprise the observed plume correspond to the plume extent from the Gaussian plume model (Eqs 1,2). The parameter σy(x) relates to the plume width, based on the atmospheric stability parameter a, which is determined from the mean wind speed (at the plume midline height) from the meteorological data. As in Nassar et al. (2021), we sample the model at 25 equal-area parallelogram-shaped sub-footprints, which we average to give a model value corresponding to an OCO-2/OCO-3 footprint. We also account for the path of the incoming and/or reflected light through the plume with a similar geometrical approach to our past work (Nassar et al., 2017).
A least squares fit between the model and observed ΔXCO2 is carried out and the correlation coefficient (R) is calculated with the x-axis aligned with the vector mean of the MERRA-2 and ERA-5 winds. Adjustments to the mean wind direction up to 45° are also applied and the optimal wind direction is considered to be that which maximises R. If a low R is obtained even after optimization, results are viewed with caution since this either means that the observations are of questionable quality or the true plume is poorly approximated by a Gaussian, recognizing that a Gaussian is not always a valid approximation for a point source plume. The emission estimate is based on the factor required to scale a unit emission to match the observations in the fit, so it is independent of a prior emission estimate.
2.4 Emission uncertainties
Emission uncertainties are determined for various contributing factors and these component uncertainties are then added in quadrature for a total (1σ) uncertainty ε.
The uncertainty due to wind speed (εw) is calculated as the relative difference of the MERRA-2 or ERA-5 wind speed from the mean wind speed, then this relative difference is converted to emissions (ktCO2/day). Other uncertainty terms are calculated with an ensemble approach, where different values are used in the calculation to conduct an emission estimate, then the standard deviation of the ensemble is considered the uncertainty from that component.
The background uncertainty (εb) is determined from conducting emission estimates with different plausible background regions, then the standard deviation of those estimates is taken. For OCO-2, manually-selected backgrounds of varying linear distances from the source were used. For OCO-3 SAMs, a background ensemble is based on backgrounds that are determined from all footprints within radii of 20, 30 and 40 km from the source, excluding the plume area and a buffer region of 3 km on either side of the plume. Since east-west gradients in the background region were sometimes observed for OCO-3, we also consider the contribution due to variations within the 30 km radius by estimating emissions using only the eastern or western half of the same circular area, giving a second ensemble also consisting of 3 members: full 30-km radius, eastern half, and western half. The larger uncertainty resulting from these two ensembles (varied radii, full-eastern-western) is used as the background uncertainty. This approach could also be adapted for gradients in the background occurring in other directions, if required.
The error term (εr) introduced in Nassar et al. (2021) accounts for the impact of plume rise on anthropogenic CO2 emission quantification (Brunner et al., 2019). We obtain an ensemble of emission estimates assuming plume rise values of 100, 200, 250, 300 and 400 m, consistent with Brunner et al. (2019), where typical plume rise for a large German power plant peaks near 250 m (although slightly lower in winter) with a skewed distribution exhibiting a tail of higher values.
For OCO-2 an enhancement uncertainty (εe) was determined from an ensemble of emissions estimates using variations of the retrieved data rather than attempting to propagate individual OCO-2 or OCO-3 XCO2 footprint uncertainties, which have an unknown correlation between them. In Nassar et al. (2017) different bias correction methods with OCO-2 version 7 data were used (including non-bias-corrected data) for this term. In Nassar et al. (2021), the enhancement ensemble for OCO-2 overpasses used v9 and v10 observations. For OCO-3, no earlier versions of the data based on a different retrieval algorithm are available and the use of non-bias-corrected data or ad hoc bias corrections is discouraged. For OCO-3, we explored calculating εe using different filtering approaches, but it led to unrealistically large uncertainties in some cases and negligible uncertainties in others, so it was discontinued. For OCO-3, we have thus omitted the εe term. For the previously published OCO-2 Bełchatów 2017-03-28 overpass reported as 98.2 ± 11.9 ktCO2/day, the uncertainty is only reduced slightly to ±11.6 ktCO2/day.
Accounting for all relevant uncertainties in a proper quantitative sense is a challenge. Here we present an attempt at quantifying the uncertainties that we consider reasonable, but acknowledge that our quoted uncertainties could be an underestimate of the total uncertainty due to missing terms or unaccounted for correlations in the existing terms.
3 Results
3.1 Emission estimates and uncertainties derived from OCO-2 and OCO-3 observations
The Bełchatów Power Station is the fifth largest coal-fired power plant in the world based on its current nameplate capacity of 5102 MW. It is the largest lignite-fired power plant in the world and lignite (brown coal) typically has a higher emissions intensity (kgCO2/kWh) than anthracite (hard coal). Bełchatów’s annual emissions were 37.6 MtCO2 in 2017 in the European Pollutant Release and Transfer Register (E-PRTR), when it had 13 units operating for a capacity of 5420 MW, following the addition of a new 858 MW unit and prior to the 2019 shutdown of its oldest unit. On 28 March 2017 (2017-03-28) at 12:23 Central European Standard Time (CEST), OCO-2 made a close flyby ∼3 km downwind of the power plant (Figure 1). Bias-corrected, unfiltered OCO-2 v10 (XCO2) data yield a broad clean background (based on 851 footprints, Figure 2) and the observed enhancement (24 footprints) gives a maximum correlation of 0.726 with our plume model requiring only a −2.0° rotation to the MERRA-2 and ERA-5 mean wind direction. Estimated emissions are 98.2 ± 11.9 ktCO2/day (1σ uncertainty), which is within 5% of the daily average value of 103 ktCO2/day derived from 2017 E-PRTR annual emissions.
From April 2020 to June 2022 inclusive, 69 SAMs were attempted by OCO-3 at Bełchatów. Fifteen of these SAMs had at least 1,000 footprints with XCO2 successfully retrieved after loss of data due to clouds and other factors (excluding data quality filtering), but sometimes lacked observations in close proximity to and downwind of the source. OCO-3 SAM observations at Bełchatów that were not obstructed by clouds and with a wind speed acceptable for Gaussian plume modeling (≥2 m/s) were obtained on nine different dates during 2020–2022. The dates, times, emission estimates, total uncertainties and related information are given in Table 1. Wind speeds and directions for these overpasses are given in Table 2 and the component uncertainties are given in Table 3.
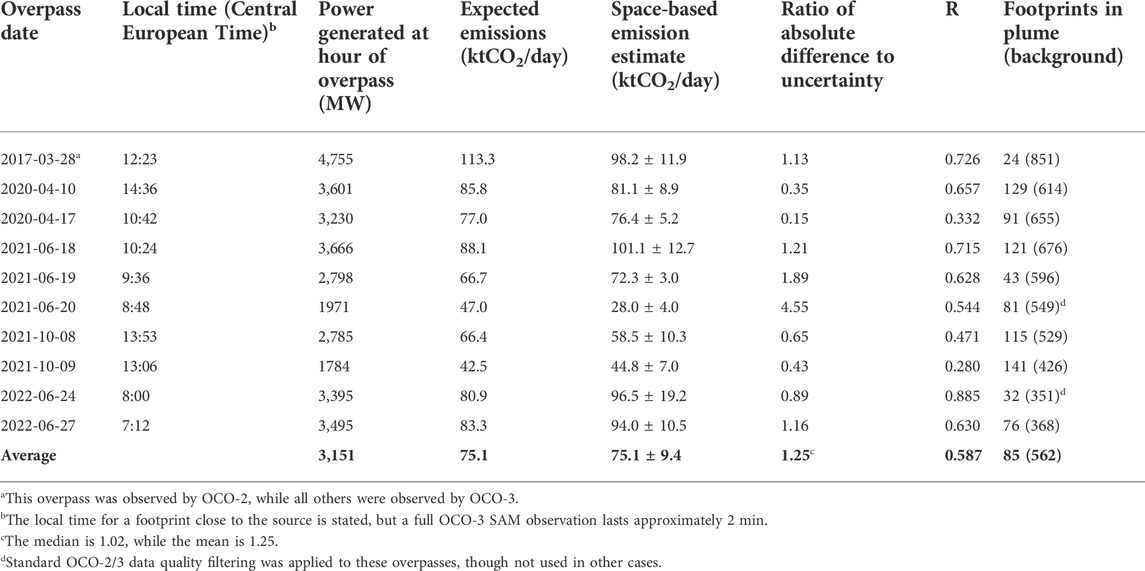
TABLE 1. Bełchatόw CO2 emission estimates on multiple dates compared with reported power generation.
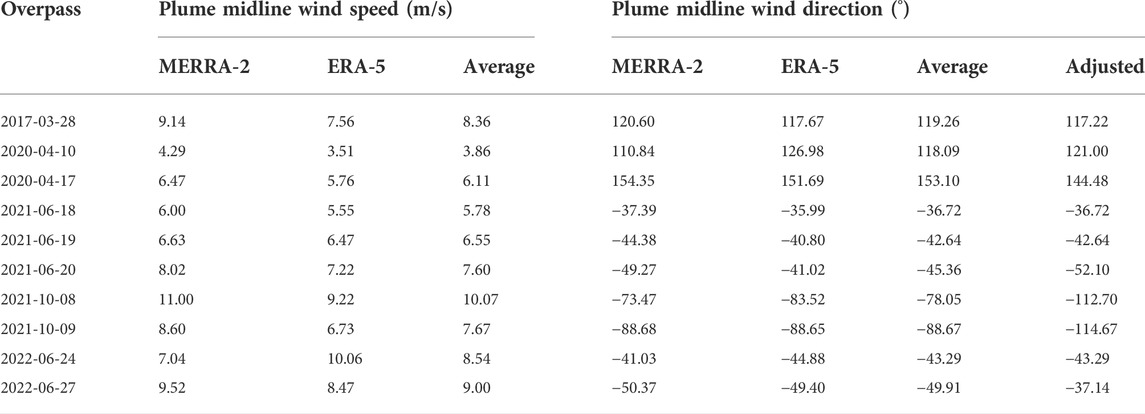
TABLE 2. Wind speeds and wind direction for each emission estimate.

TABLE 3. Component Uncertainties in ktCO2/day. For OCO-3 two different background ensembles were calculated: 1) variable radius and 2) full circle, east, west with the lower uncertainty in parentheses as the higher value was used in the total uncertainty. The largest contributor to the total uncertainty is shown in bold.
OCO-3 observed a SAM over Bełchatów on 2020-04-10 (∼14:36 CEST), which is approximately 80 × 120 km2, excluding an extended background region. The wind blew to the southeast with a mean speed of 3.86 m/s resulting in a CO2 plume downwind from the power plant, which appears as an enhancement above a slightly noisy background XCO2. The 30 km radius background sector consists of 614 footprints and the plume consists of 129 footprints giving a maximum correlation of 0.657 after applying a +3.0° rotation to the mean wind direction. Emissions were estimated as 81.1 ± 8.9 ktCO2/day (Figure 4). The dominant uncertainty is wind speed (8.2 ktCO2/day) with only minor contributions from other factors (Table 3).
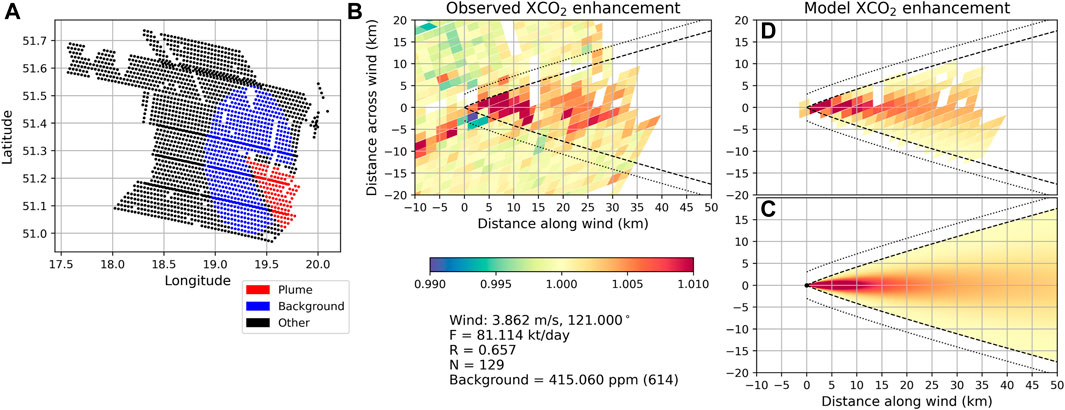
FIGURE 4. CO2 emission quantification from the OCO-3 Bełchatόw SAM on 2020-04-10. (A) Dots representing footprints are colored as enhancement (red), background (blue) and other (black). (B) Observed XCO2 footprints relative to the background value with the positive x-axis aligned with the wind direction. (C) Gaussian plume model XCO2 enhancement with dotted lines denoting a region between the enhancement and background. (D) Model XCO2 enhancements as would be seen by OCO-3 and used in the observation-model fit.
The 2020-04-17 (∼10:42 CEST) OCO-3 SAM initially gave a maximum correlation of less than 0.200 even after wind adjustment, indicating a poor fit. A misalignment between the source location and the plume origin may be responsible for the low correlation. OCO-3 observations currently involve a geolocation correction (Taylor et al., 2020) with a 1σ magnitude of about 2 km, but the correction methodology is still evolving. Exploring ad hoc shifts to the plume origin suggests that the offset in this case might be larger than 2 km; however, the same effect could also result from a few biased footprints near the source. As we are unsure if a geolocation issue or some biased footprints are the underlying cause, we only fit the plume beginning at 8 km from the origin, which gives a correlation of 0.332 with a wind adjustment of -8.62° and an emission estimate of 76.3 ± 3.4 ktCO2/day (Figure 5). Once again, wind speed is the dominant contributor to the uncertainty (3.2 ktCO2/day).
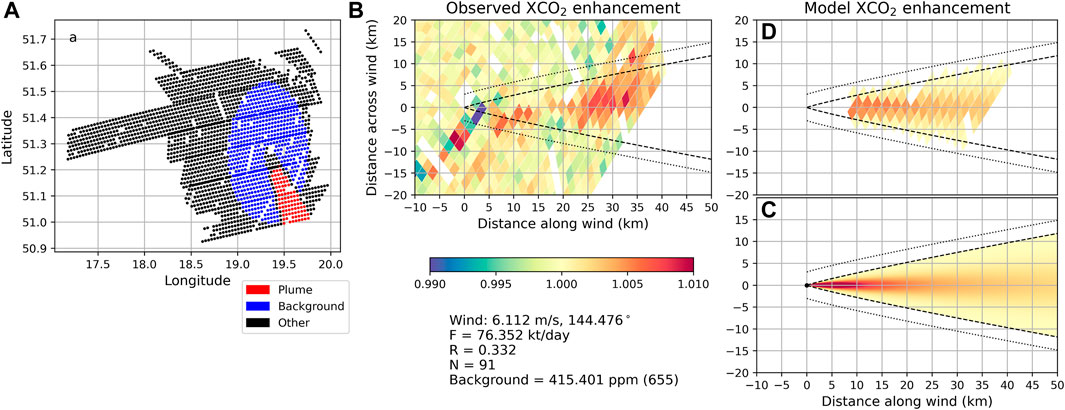
FIGURE 5. Same as Figure 4 for OCO-3 Bełchatόw SAM on 2020-04-17. Panel (D) indicates that the plume is fit beginning at 8 km from the source due to issues near the plume origin possibly related to geolocation errors.
Earlier analyses that led to this work investigated a clear-sky SAM on 2020-04-08 with a low mean wind speed (1.68 m/s) and an abrupt change to wind direction 1–2 h before the observation. This SAM was not included in the present analysis since Gaussian plume modeling requires a constant wind direction and is not considered reliable at wind speeds less than 2 m/s, where advection is not as dominant over diffusion (Reuter et al., 2019). The 2020-04-08 SAM is being investigated with other high resolution modeling methods and analysis of the SAM will be presented in future work.
Emission estimates and uncertainties were determined from the other SAMs from June 2021, October 2021 and June 2022, with examples from each month in Figures 6–8. For the 2021-06-20 SAM, a correlation of 0.508 was obtained and an emission estimate of 24.0 ktCO2/day with our usual approach of not applying data quality filtering, which often removes more footprints than desired for our method and sometimes gives spurious emission estimates and lower correlations. In this case, applying the standard OCO-2/3 data quality filters improved the correlation to 0.543 with an emission estimate of 28.0 ktCO2/day, so we consider this emission estimate with filtered data as a more realistic result. While higher than the emission estimate with no data filtering, this is still the lowest emission estimate for Bełchatów and represents the largest absolute or relative difference from expected Bełchatów emissions (explained in Section 3.2 below). For the 2022-06-24 SAM, filtering removes some low-biased background footprints while giving the same correlation, so the emission estimate with standard OCO-3 filtering is reported. For all other SAMs, results without data quality filtering are given. The dates and times, reported power generation, expected emissions, OCO-3 emission estimate and uncertainty, correlation, and number of OCO-3 footprints in the plume and background for all SAMs analyzed are given in Table 1.
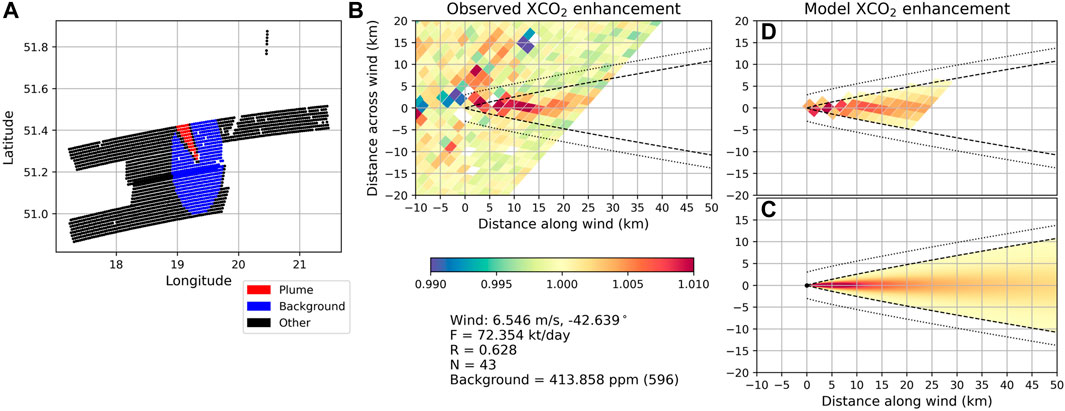
FIGURE 6. Same as Figure 4 for OCO-3 Bełchatόw SAM on 2021-06-19.
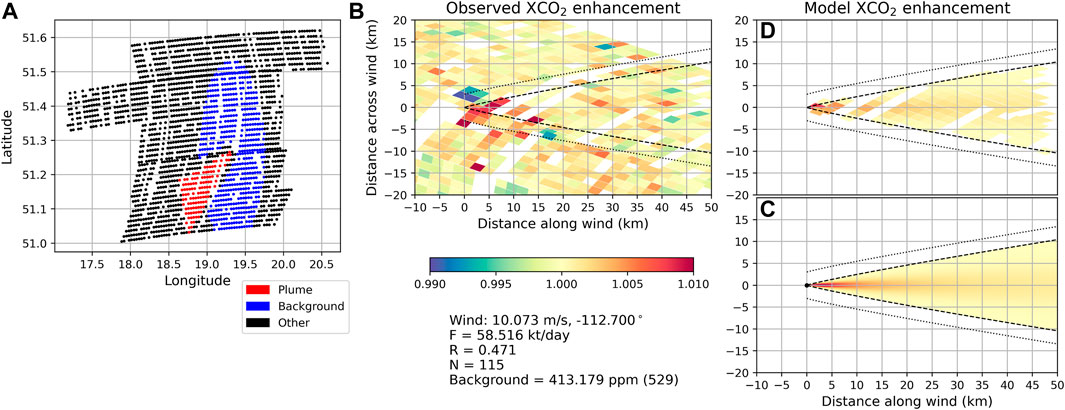
FIGURE 7. Same as Figure 4 for OCO-3 Bełchatόw SAM on 2021-10-08. The observed XCO2 plume appears weak due to the high wind speed (10.07 m/s) dissipating the enhancement.

FIGURE 8. Same as Figure 4 for OCO-3 Bełchatόw SAM on 2022-06-24. The higher number of missing footprints (evident in panels (A,B)) compared with other SAMs is due to application of data quality filtering. Although the observed (panel (B)) and model (panel (D)) enhancements match very well, estimated emissions are somewhat higher than expected, even following improvements by applying standard OCO-3 data quality filters.
3.2 Comparison with expected emission values
Although E-PRTR only reports annual emissions, the European Network of Transmission System Operators for Electricity (ENTSO-E) Transparency Platform (https://transparency.entsoe.eu/dashboard/show) provides hourly power generation for European Union power plant units with only a 1-day lag. Its objective is to facilitate access to information by all market participants and stakeholders to promote transparency. Reported hourly power generation for the 10 dates investigated in this study are provided in Table 4. On 2017-03-28 from 12:00-13:00 CEST, when Bełchatów was observed by OCO-2, it had all units running with 4,755 MW of power generation reported. Hourly power generation ranged from 1,830 to 3,772 kW on the 9 occasions that Bełchatów was observed by OCO-3. For these 10 occasions, mean hourly power generation was 3,151 kW while the mean estimated emissions from OCO-2 and OCO-3 observations were 75.1 ± 9.4 ktCO2/day. The ratio of the mean emission rate to mean power generation gives an emission intensity (ktCO2/kW) for Bełchatów that we can apply to all overpasses to calculate expected emissions as shown in Table 1. The expected emission values also have associated uncertainties due to uncertainty in the reported power generation values and variations in emission intensity for different units. Gurney et al. (2016) found that the uncertainty for reported CO2 emissions from U.S. power plants had a median difference of 6% for monthly reported emissions from two different government datasets. Here we are deriving emissions from European hourly reported power generation for a single large power plant. The finer temporal scale and proxy approach (power generation as a proxy for CO2 emissions) might suggest higher relative emission uncertainties, while such a large power plant might have lower relative uncertainty on power generation, so we assume a modest 1σ uncertainty of 5% for the expected emissions.
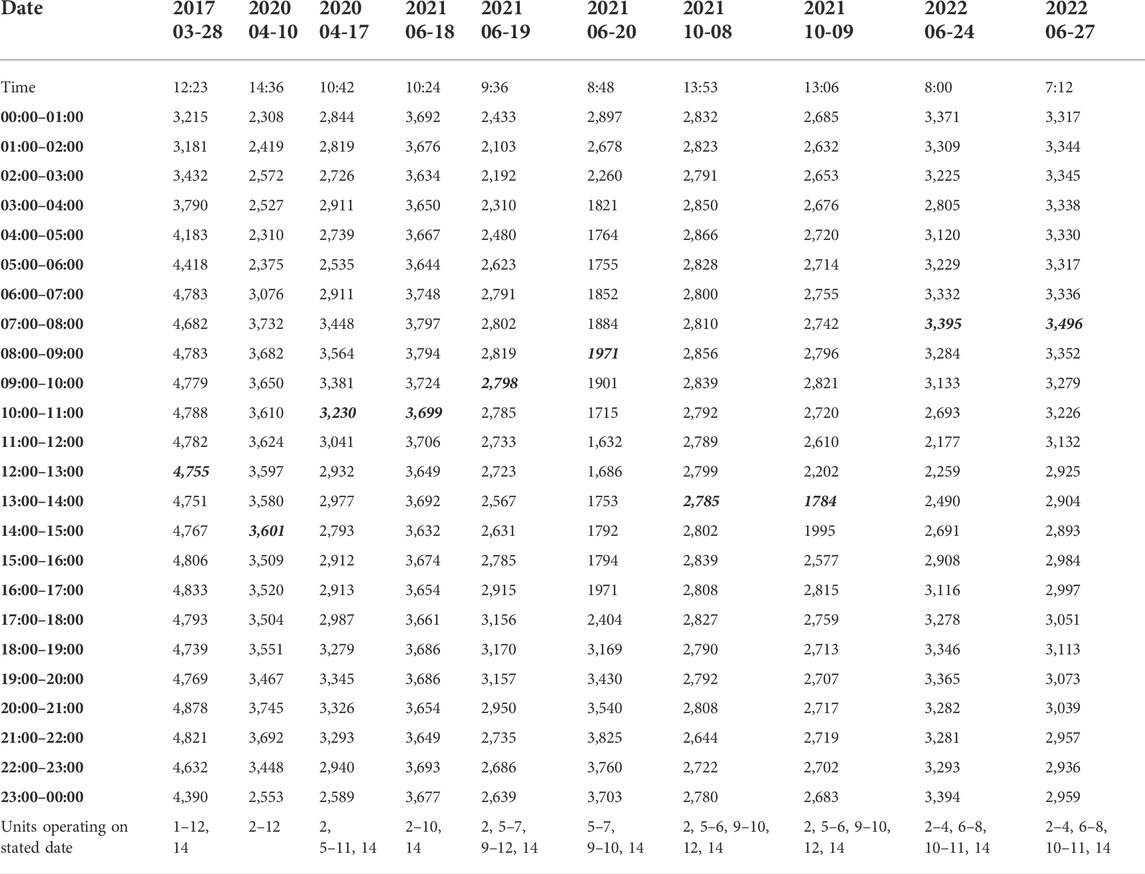
TABLE 4. Reported hourly power generation for the Bełchatόw Power Station in kilowatts (kW) from the European Network or Transmission System Operators for Electricity (ENTSO-E) Transparency Platform. Values shown are taken as the sum of the reported hourly generation (kW) for the units specified in the final row. The overpass time is given in the second row with the corresponding hourly power generation for that time indicated by bold italics.
The emission estimates are visually compared with the expected emissions, each with their 1σ uncertainties in Figure 9, which suggests that overall, emission reductions and increases are clearly detected with a qualitatively similar trend derived from the OCO-2/3 observations and those expected based on reported power generation. Nine of 10 emission estimates agree within the expected values within 1σ uncertainty. Correlation values range from 0.280 to 0.885, including 7 of 10 with R > 0.500 and 8 of 10 with R > 0.400. Surprisingly, the instances with the two lowest correlations, yielded the best agreement between emission estimates and reported emissions. We calculate the ratio of the absolute difference (between the estimated emissions and expected emissions) to the 1σ uncertainty as another metric to gauge the agreement between emissions estimates and expected emissions. The mean ratio is 1.25 and the median ratio is 1.02, with values close to 1 suggesting that the uncertainties are of a similar magnitude as the differences. The main exception is the 2021-06-20 SAMs (to which we have already applied filtering to improve the result) partly due to very low uncertainties.
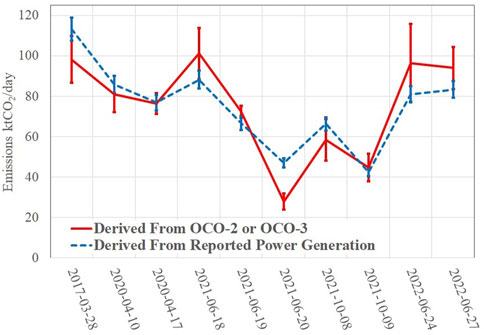
FIGURE 9. Time series of emissions expected based on ENTSO-E reported power generation and OCO-2/OCO-3 observations each with 1σ error bars.
In cases where the emission estimate from OCO-2/3 was not in good agreement with expected emissions, but the correlation was good, the background and/or biased wind data are likely the cause of the discrepancy. For example, the 2021-06-18 SAM exhibits an asymmetric background where low XCO2 values east of the source might not be a good representation of the background below the plume to the northwest. This was verified by estimating emissions using a background that only included footprints west of the source, which gave an estimate of 87.1 ktCO2/day (rather than 101.1 ± 12.7 ktCO2/day) in much better agreement with the expected 86.3 ktCO2/day. Our methodology already accounts for this effect by including the background sensitivity as a component in the uncertainty, which is high in the 2021-06-18 case. On 2021-06-20, the excellent agreement between MERRA-2 and ERA-5 wind speeds may be a coincidence that yields a very low wind speed uncertainty, which is likely an unrealistic representation of the true uncertainty contribution due to wind speed.
4 Discussion and conclusion
We analyzed nine new OCO-3 SAMs in the vicinity of the Bełchatów Power Station from April 2020 to June 2022 and compared them with the previously published OCO-2 Bełchatów emission estimate from March 2017 (Nassar et al., 2021; Crisp et al., 2022). Collective analysis of these ten overpasses provides strong evidence of CO2 emission reductions consistent with reduced electricity generation at Bełchatόw, Europe’s largest fossil fuel burning power plant. Monitoring strong localized sources or hotspots to verify emission reductions is one of the main objectives of the European Commission’s planned Monitoring and Verification Support (MVS) capacity for which the Copernicus Anthropogenic CO2 Monitoring (CO2M) satellite constellation is the primary space component. We have demonstrated such capability with existing space-based CO2 observations on a single large power plant in this case study by comparing our derived emission trend with the expected trend based on reported power generation values.
Space-based CO2 observations hold much promise in future efforts to monitor and ultimately provide information to help reduce anthropogenic CO2 emissions to mitigate climate change. Our results demonstrate the ability of space-based CO2 data to detect and quantify emission reductions at the local scale, in order to effectively monitor anthropogenic CO2 emissions and their planned reductions. Multiple satellite missions are planned to launch in the next 3–4 years, namely MicroCarb (Bertaux et al., 2020), GeoCarb (Moore et al., 2018), GOSAT-GW (Kasahara et al., 2020) and CO2M (Meijer et al., 2019). With 250 km swaths, each CO2M satellite will deliver about 50 times as much land coverage as OCO-2 or OCO-3. Combining their coverage with other upcoming imaging satellites will increase capabilities to well over two orders of magnitude more observations than presently available. Here we have quantified emissions of a large facility, but if future observations deliver similar precision, with increased coverage and revisit rates, quantifying much weaker sources will be possible.
Previous studies have shown that OCO-2’s narrow swath resulted in few overpasses in the vicinity of power plants, and also gave many different geometrical alignments between the wind direction and swath. The small number of good cases and their different geometries complicated the development of a standardized or automated method for background definition (and background uncertainty). This was one of multiple reasons why past OCO-2 emission estimates involved some degree of human intervention and decision making. With OCO-3 SAMs essentially eliminating the geometrical alignment issue and also providing more overpasses, here we have attempted a more standardized and less subjective treatment of issues like the background definition and background uncertainty. This represents a step toward enabling a more automated approach overall, which will be essential for facility-scale operational CO2 emission monitoring with future wide swath missions like CO2M, but could still be challenging for situations with complex backgrounds.
It is also important to note some limitations of the present work and its conclusions regarding CO2 emissions monitoring. Reporting under the UNFCCC currently deals with annual timescales, yet deriving annual emissions from space is not trivial and remains to be demonstrated at the facility scale. Hill and Nassar (2019) examined the issue of intermittency or intra-annual variability of U.S. power plants in reported data from the Environmental Protection Agency (EPA). Intra-annual variations in coal-fired power plant CO2 emissions were shown to be non-periodic, exhibiting intermittency that could not be predicted in the absence of external data. However, with enough revisits to sample the intermittency, annual emissions could be estimated with an accuracy comparable to the daily emission estimates based on a statistical treatment of the intermittency. For example, it was determined that if daily facility-scale CO2 emissions could be estimated with 10% uncertainty, then 41 overpasses would be needed to achieve annual emissions with 10% uncertainty. Hence, a large number of overpasses would be required to demonstrate inter-annual facility-scale CO2 emission reductions of a magnitude less than 10%, which will require a constellation of multiple satellites, perhaps taking advantage of complementary orbits. As inferred by Nassar et al. (2021), multiple revisits of a given facility reduces the random error component of emission estimates, such that for eight U.S. facility overpasses, the mean difference between individual estimated and reported emissions was 15.1%, but the total difference was only 0.8%. In the present work, the mean uncertainty on emissions was about 12.2% but since the total expected emissions were set to the total observed emissions, they were equal by design.
This work showed that there remains room for improvement in reducing uncertainties in CO2 emission quantification from space. Two areas requiring continual improvement are XCO2 retrievals and external meteorological data. On 6 of 10 occasions, the largest contributor to uncertainty was the background, while on 4 of 10 occasions as well as on average, the largest contributor to the uncertainty was wind speed, which comes from external meteorological data sets. The background uncertainty is primarily related to the XCO2 retrieval relative accuracy and the presence of spatially-dependent biases in the observations (potentially linked to factors such as viewing geometry, aerosols, thin clouds, topography or surface albedo contributions). CO2M intends to yield reductions in such biases through the addition of a multi-angle polarimeter (MAP), which will address biases caused by some of these factors. Furthermore, it should be noted that minor secondary sources (or even sinks) in the background field are also a contributing factor to the background uncertainty. In the case of Bełchatów these should be negligible, but for many other point sources these secondary sources may be significant. CO2M will also have collocated NO2 imaging capability that will help to identify secondary sources and assist in determining the plume shape, wind direction and generally distinguish the plume from the background (Kuhlmann et al., 2021). Emission uncertainties will also improve with the availability of more accurate wind speed data from meteorological data sets. Achieving such improvements will likely require a combination of enhanced satellite and in situ observations and meteorological data assimilation systems, but recommendations for achieving the needed improvements are beyond the scope of this work.
Emerging studies suggest that very fine spatial resolution (∼50 m) space-based CO2 imaging observations can enable emission quantification for smaller power plants (Strandgren et al., 2020), although such missions would primarily work in target mode for a list of sources of interest, making them complementary to missions like CO2M, designed to deliver global coverage, as well as other planned or proposed missions designed for rapid revisits over a regional domain (e.g. Moore et al., 2018; Butz et al., 2019; Nassar et al., 2019). Regardless, clouds and night-time conditions will continue to be limitations for CO2 observations based on passive shortwave infrared (SWIR) solar reflectance like OCO-2/3 and CO2M. Exploration of observing methods that employ cloud avoidance (e.g. Suto et al., 2021) or active sensing could provide complementary observations from space, while ground- or aircraft-based observations can also play an important role in overcoming these limitations.
This work reaffirms the capability to quantify facility-scale CO2 emissions from space and for the first time demonstrates the capability to monitor CO2 emission changes over time, addressing the first and second objectives of CO2M in a case study on a large European coal-fired power plant. The expanding constellation of CO2 satellites, related observations from the ground or other platforms and modeling tools together should be able to deliver more robust monitoring of facilities over a range of sizes. Despite some limitations, this emerging Monitoring Verification and Support (MVS) system can play an important role in the general management and support of anthropogenic CO2 emission reductions in order to achieve targets set out in the Paris Agreement.
Data availability statement
OCO-2, OCO-3, MODIS and MERRA-2 data are available at the GES DISC: https://disc.gsfc.nasa.gov/. ERA-5 data are available at the Climate Data Store: https://cds.climate.copernicus.eu/cdsapp#!/home. ENTSO-E power data are available at: https://transparency.entsoe.eu/dashboard/show.
Author contributions
RN conceived the study and methodology, created figures and wrote the manuscript. OM applied the methodology to estimate emissions and created some figures. J-PM contributed to the methodology and emission estimates. CO’D led development of OCO-2/3 XCO2 retrievals. RRN and MK contributed to OCO-2/3 retrievals and OCO-3 operations. AE, DC, and AC led OCO-2 and OCO-3 operations and contributed to OCO-2/3 retrievals. All co-authors contributed to revision of the manuscript.
Funding
Some of the work described here was performed at the Jet Propulsion Laboratory, California Institute of Technology, under contract to the National Aeronautics and Space Administration (NASA). US government sponsorship is acknowledged. The CSU contribution to this work was funded by NASA ROSES Grant 80NSSC21K1078 and NASA JPL subcontract 1557985.
Acknowledgments
We thank NASA for making the OCO-2, OCO-3 and MERRA-2 data publicly available. We thank the European Center for Medium Range Weather Forecasting (ECMWF) for ERA-5 data and acknowledge that neither the European Commission (EC) nor ECMWF are responsible for results or conclusions derived from use of their data. We thank ENTSO-E and EPRTR for making European energy and emissions data publicly available. We thank Google for making the Google Earth application publicly available and LandSat and Copernicus for the underlying imagery for the application. OCO-2 and OCO-3 v10 data are available at the GES DISC: https://disc.gsfc.nasa.gov/. We thank Megan Dawson (University of Waterloo) for the code to view MODIS cloud imagery with OCO-3 data and Jinwoong Kim (ECCC) for helpful comments on the manuscript.
Conflict of interest
The authors declare that the research was conducted in the absence of any commercial or financial relationships that could be construed as a potential conflict of interest.
Publisher’s note
All claims expressed in this article are solely those of the authors and do not necessarily represent those of their affiliated organizations, or those of the publisher, the editors and the reviewers. Any product that may be evaluated in this article, or claim that may be made by its manufacturer, is not guaranteed or endorsed by the publisher.
References
Bell, B., Hersbach, H., Berrisford, P., Dahlgren, P., Horányi, A., Sabater, M., et al. (2020). ERA5 hourly data on pressure levels from 1950 to 1978 (preliminary version). Copernic. Clim. Change Serv. (C3S) Clim. Data Store (CDS). AvaliableAt: https://cds.climate.copernicus-climate.eu/cdsapp#!/dataset/reanalysis-era5-pressure-levels-preliminary-back-extension?tab=overview.
Bertaux, J.-L., Hauchercorne, A., Lefèvre, F., Bréon, F.-M., Blanot, L., Jouglet, D., et al. (2020). The use of the 1.27 µm O2 absorption band for greenhouse gas monitoring from space and application to MicroCarb. Atmos. Meas. Tech. 13, 3329–3374. doi:10.5194/amt-13-3329-2020
Bovensmann, H., Buchwitz, M., Burrows, J. P., Reuter, M., Krings, T., Gerilowski, K., et al. (2010). A remote sensing technique for global monitoring of power plant CO2 emissions from space and related applications. Atmos. Meas. Tech. 3, 781–811. doi:10.5194/amt-3-781-2010
Brunner, D., Kuhlmann, G., Marshall, J., Clément, V., Fuhrer, O., Broquet, G., et al. (2019). Accounting for the vertical distribution of emissions in atmospheric CO2 simulations. Atmos. Chem. Phys. 19, 4541–4559. doi:10.5194/acp-19-4541-2019
Butz, A., Orphal, J., Checa Garcia, R., Friedl-Vallon, F., von Clarmann, T., Bovensmann, H., et al. (2019). Geostationary emission explorer for Europe (G3E): Mission concept and initial performance assessment, atmos. Meas. Tech. 8, 4719–4734. doi:10.5194/amt-8-4719-2015
Ciais, P., Crisp, D., Van Der Gon, H. D., Engelen, R., Janssens-Maenhuot, G., Heimann, M., et al. (2015). Towards a European operational observing system to monitor fossil CO2 emissions. Brussels: European Commission.
Crisp, D., Dolman, H., Tanhua, T., McKinley, G., Hauck, J., Bastos, A., et al. (2022). How well do we understand the land-ocean-atmosphere carbon cycle? Rev. Geophys. 60, 2021RG000736. doi:10.1029/2021RG000736
Crisp, D., Fisher, B. M., O’Dell, C., Frankenberg, C., Basillio, R., Bösch, H., et al. (2012). The ACOS CO2 retrieval algorithm – Part II: Global XCO2 data characterization. Atmos. Meas. Tech. 5, 687–707. doi:10.5194/amt-5-687-2012
Crisp, D., Meijer, Y., Munro, R., Bowman, K., Chatterjee, A., Baker, D., et al. (2018). A constellation architecture for monitoring carbon dioxide and methane from space. Brussels, Belgium: Jet Propulsion Laboratory, National Aeronautics and Space Administration.
Crisp, D., Pollock, H. R., Rosenberg, R., Chapsky, L., Lee, R. A. M., Oyafuso, F. A., et al. (2017). The on-orbit performance of the Orbiting Carbon Observatory-2 (OCO-2) instrument and its radiometrically calibrated products. Atmos. Meas. Tech. 10, 59–81. doi:10.5194/amt-10-59-2017
Gurney, K., Huang, J., and Coltin, K. (2016). Bias present in US federal agency power plant CO2 emissions data and implications for the US clean power plan. Environ. Res. Lett. 11, 064005. doi:10.1088/1748-9326/11/6/064005
Hakkarainen, J., Szeląg, M. E., Ialongo, I., Retscher, C., Oda, T., and Crisp, D. (2021). Analyzing nitrogen oxides to carbon dioxide emission ratios from space: A case study of the matimba power station in south Africa. Atmosphere Environment 10, 100110. doi:10.1016/j.aeaoa.2021.100110
Hill, T., and Nassar, R. (2019). Pixel size and revisit rate Requirements for monitoring power plant CO2 emissions from space. Remote Sens. 11, 1608. doi:10.3390/rs11131608
International Energy Agency (Iea) (2019). CO2 emissions from fuel combustion. Paris, France: OECD/IEA. AvaliableAt: www.iea.org.
Kasahara, M., Kachi, M., Inaoka, K., Fujii, H., Kubota, T., Shimada, R., et al. (2020). Overview and current status of GOSAT-GW mission and AMSR3 instrument. Proc. SPIESensors, Syst. Next-Generation Satell. 11530, 1153007. doi:10.1117/12.2573914
Kiel, M., O’Dell, C. W., Fisher, B., Eldering, A., Nassar, R., MacDonald, C., et al. (2019). How bias correction goes wrong: Measurement of XCO2 affected by erroneous surface pressure estimates. Atmos. Meas. Tech. 12, 2241–2259. doi:10.5194/amt-12-2241-2019
Kuhlmann, G., Henne, S., Meijer, Y., and Brunner, D. (2021). Quantifying CO2 emissions of power plants with CO2 and NO2 imaging satellites. Front. Remote Sens. 2, 689838. doi:10.3389/frsen.2021.689838
Martin, D. O. (1976). Comment on the change of concentration standard deviations with distance. J. Air Pollut. Control Assoc. 26 (2), 145–147. doi:10.1080/00022470.1976.10470238
Meijer, Y., Boesch, H., Bombelli, A., Brunner, D., Buchwitz, M., Ciais, P., et al. (2019). Copernicus CO2 monitoring mission Requirements document (MRD). Netherlands, Europe: European Space Agency, Earth and Mission Science Division.
Molod, A., Takacs, L., Suarez, M., and Bacmeister, J. (2015). Development of the GEOS-5 atmospheric general circulation model: Evolution from MERRA to MERRA2. Geosci. Model Dev. 8, 1339–1356. doi:10.5194/gmd-8-1339-2015
Moore, B., Crowell, S. M. R., Rayner, P. J., Kumer, J., O’Dell, C. W., O’Brien, D., et al. (2018). The potential of the geostationary carbon cycle observatory (GeoCarb) to provide multi-scale constraints on the carbon cycle in the americas. Front. Environ. Sci. 6, 109. doi:10.3389/fenvs.2018.00109
Nassar, R., Hill, T. G., McLinden, C. A., Wunch, D., Jones, D. B. A., and Crisp, D. (2017). Quantifying CO2 emissions from individual power plants from space. Geophys. Res. Lett. 44, 10045-10053. doi:10.1002/2017GL074702
Nassar, R., Mastrogiacomo, J.-P., Bateman-Hemphill, W., McCracken, C., MacDonald, C. G., Hill, T., et al. (2021). Advances in quantifying power plant CO2 emissions with OCO-2. Remote Sens. Environ. 264, 112579. doi:10.1016/j.rse.2021.112579
Nassar, R., McLinden, C., Sioris, C. E., McElroy, C. T., Mendonca, J., Tamminen, J., et al. (2019). The atmospheric imaging mission for northern regions: AIM-north. Can. J. Remote Sens. 45 (3-4), 423–442. doi:10.1080/07038992.2019.1643707
O’Dell, C. W., Connor, B., Bösch, H., O’Brien, D., Frankenberg, C., Castano, R., et al. (2012). The ACOS CO<sub>2</sub> retrieval algorithm – Part 1: Description and validation against synthetic observations. Atmos. Meas. Tech. 5, 99–121. doi:10.5194/amt-5-99-2012
Pacala, S., Breidenich, C., Brewer, P. G., Fung, I., Gunson, M. R., Heddle, G., et al. (2010). “Verifying greenhouse gas emissions: Methods to support international climate agreements,” in Committee on methods for estimating greenhouse gas emissions (Washington, WA, USA: National Research Council Report, National Academies Press).
Pasquill, F. (1961). The estimation of the dispersion of windborne material. Meteorol. Mag. 90 (1063), 33–49.
Pinty, B., Janssens-Maenhout, G., Dowell, M., Zunker, H., Brunhes, T., Ciais, P., et al. (2017). An operational anthropogenic CO2 emissions monitoring and verification support capacity. Baseline requirements, model components and functional architecture. Tech. rep. Brussels: European Commission Joint Research Centre. http://resolver.tudelft.nl/uuid:832e87d0-0ed8-44b2-8867-8714cebde4cb
Reuter, M., Buchwitz, M., Schneising, O., Krautwurst, S., O’Dell, C. W., Richter, A., et al. (2019). Towards monitoring localized CO2 emissions from space: Co-located regional CO2 and NO2, enhancements observed by the OCO-2 and S5P satellites. Atmos. Chem. Phys. 19, 9371–9383. doi:10.5194/acp-19-9371-2019
Singer, A. M., Branham, M., Hutchins, M. G., Welker, J., Woodard, D. L., Badurek, C. A., et al. (2014). The role of CO2 emissions from large point sources in emissions totals, responsibility and policy. Environ. Sci. Policy 44, 190–200. doi:10.1016/j.envsci.2014.08.001
Strandgren, J., Krutz, D., Wilzewski, J., Paproth, C., Sebastien, I., Gurney, K. R., et al. (2020). Towards spaceborne monitoring of localized CO2 emissions: An instrument concept and first performance assessment, atmos. Atmos. Meas. Tech. 13, 2887–2904. doi:10.5194/amt-13-2887-2020
Suto, H., Kataoka, F., Kikuchi, N., Knuteson, R. O., Butz, A., Haun, M., et al. (2021). Thermal and near-infrared sensor for carbon observation Fourier transform spectrometer-2 (TANSO-FTS-2) on the Greenhouse gases Observing SATellite-2 (GOSAT-2) during its first year in orbit. Atmos. Meas. Tech. 14, 2021–2039. doi:10.5194/amt-14-2013-2021
Taylor, T. E., Eldering, A., Merrelli, A., Kiel, M., Somkuti, P., Cheng, C., et al. (2020). OCO-3 early mission operations and initial (vEarly) XCO2 and SIF retrievals. Remote Sens. Environ. 251, 112032. doi:10.1016/j.rse.2020.112032
Wunch, D., Toon, G. C., Blavier, J.-F., Washenfelder, R. A., Notholt, J., Connor, B. J., et al. (2011). The total carbon column observing Network. Phil. Trans. R. Soc. A 369, 2087–2112. doi:10.1098/rsta.2010.0240
Keywords: power plants, anthropogenic, CO2, Paris Agreement, OCO-2, OCO-3, CO2M
Citation: Nassar R, Moeini O, Mastrogiacomo J-P, O’Dell CW, Nelson RR, Kiel M, Chatterjee A, Eldering A and Crisp D (2022) Tracking CO2 emission reductions from space: A case study at Europe’s largest fossil fuel power plant. Front. Remote Sens. 3:1028240. doi: 10.3389/frsen.2022.1028240
Received: 25 August 2022; Accepted: 05 October 2022;
Published: 28 October 2022.
Edited by:
Yasjka Meijer, European Space Research and Technology Centre (ESTEC), NetherlandsCopyright © 2022 Nassar, Moeini, Mastrogiacomo, O’Dell, Nelson, Kiel, Chatterjee, Eldering and Crisp. This is an open-access article distributed under the terms of the Creative Commons Attribution License (CC BY). The use, distribution or reproduction in other forums is permitted, provided the original author(s) and the copyright owner(s) are credited and that the original publication in this journal is cited, in accordance with accepted academic practice. No use, distribution or reproduction is permitted which does not comply with these terms.
*Correspondence: Ray Nassar, cmF5Lm5hc3NhckBlYy5nYy5jYQ==
†now retired