 S. McKenzie Skiles
 Christopher P. Donahue
 Adam G. Hunsaker2,4
 Jennifer M. Jacobs
- 1Department of Geography, University of Utah, Salt Lake City, UT, United States
- 2Earth Systems Research Center, Institute for the Study of Earth, Oceans, and Space, University of New Hampshire, Durham, NH, United States
- 3Geography Earth and Environmental Sciences, University of Northern British Columbia, Prince George, BC, Canada
- 4Department of Civil and Environmental Engineering, University of New Hampshire, Durham, NH, United States
Snow albedo, a measure of the amount of solar radiation that is reflected at the snow surface, plays a critical role in Earth’s climate and in regional hydrology because it is a primary driver of snowmelt timing. Satellite multi-spectral remote sensing provides a multi-decade record of land surface reflectance, from which snow albedo can be retrieved. However, this observational record is challenging to assess because discrete in situ observations are not well suited for validation of snow properties at the spatial resolution of satellites (tens to hundreds of meters). For example, snow grain size, a primary driver of snow albedo, can vary at the sub-meter scale driven by changes in aspect, elevation, and vegetation. Here, we present a new uncrewed aerial vehicle hyperspectral imaging (UAV-HSI) method for mapping snow surface properties at high resolution (20 cm). A Resonon near-infrared HSI was flown on a DJI Matrice 600 Pro over the meadow encompassing Swamp Angel Study Plot in Senator Beck Basin, Colorado. Using a radiative transfer forward modeling approach, effective snow grain size and albedo maps were produced from measured surface reflectance. Coincident ground observations were used for validation; relative to retrievals from a field spectrometer the mean grain size difference was 2 μm, with an RMSE of 12 μm, and the mean broadband albedo was within 1% of that measured near the center of the flight area. Even though the snow surface was visually homogenous, the maps showed spatial variability and coherent patterns in the freshly fallen snow. To demonstrate the potential for UAV-HSI to be used to improve validation of satellite retrievals, the high-resolution maps were used to assess grain size and albedo retrievals, and subpixel variability, across 17 Landsat 9 OLI pixels from a satellite overpass with similar conditions two days following the flight. Although Landsat 9 did not capture the same range of values and spatial variability as the UAV-HSI, on average the comparison showed good agreement, with a mean grain size difference of 9 μm and the same broadband albedo (86%).
Introduction
It is critical to quantify the timing and magnitude of seasonal snowmelt from the world’s mountains. Seasonal snowmelt from mountain headwaters dominates downstream hydrology and provides water to billions; controlling water availability, flood potential, agriculture, hydroelectric generation, and water quality (Barnett et al., 2005; Mankin et al., 2015). The energy for snowmelt in most mountain environments predominantly comes from net solar radiation, the biggest contributor of snowpack’s energy balance, which is primarily controlled by snow albedo (Marks and Dozier, 1992; DeWalle and Rango, 2008). Therefore, inaccuracy in the estimation of snow albedo constitutes the major source of uncertainty in calculating the energy balance of the snowpack. Additionally, limited knowledge of snow albedo, and trends over space and time in the Arctic, forested regions, and tundra directly propagates to uncertainty in the controls that snow has on climate, ecology, and phenology.
Despite the importance of snow albedo, there are very few in situ measurements of it, and those that do exist are rarely representative of the surrounding terrain, especially in mountains. There are relatively long satellite records of multispectral surface reflectance from satellites, but retrieving snow albedo, which differs from land surface albedo when the pixel is not fully snow-covered, is complicated by topography and frequency of mixed pixels in complex terrain. Currently, there is not a publicly distributed global remotely sensed snow albedo product suitable for snow in mountains, although estimates have been made for fractional snow-covered products from the Moderate Resolution Imaging Spectrometer (MODIS) for some regions (Bair et al., 2019). Given the importance of snow albedo it is likely that retrievals will be developed for finer scale multispectral satellites, like Landsat’s Operational Land Imager (OLI), but the coarseness of satellite data, spatially or temporally, relative to snow process scales means that products are challenging to assess. Nevertheless, given the challenges of in situ measurements’ representativeness and inaccessibility of the terrain, satellite remote sensing is the only practical way to consistently observe mountain snow and understand how it is changing over space and time.
This motivates the development of methods that can fill the gap between sparse non-representative point measurements and coarse satellite observations that could be used for validation or downscaling and to quantify patterns and spatiotemporal variability. Here, we present a new uncrewed aerial vehicle hyperspectral imaging (UAV-HSI) method for mapping effective snow grain size and albedo at high resolution (20 cm) over Swamp Angel Study Plot in Senator Beck Basin, San Juan Mountains, CO. To demonstrate the utility of UAV-HSI snow property retrievals, the maps were resampled to the spatial resolution of Landsat 9 OLI (30 m) and then used to assess the multispectral grain size and albedo retrieval and subpixel variability. Spectral imaging is becoming increasingly suitable for UAV deployment as instruments decrease in size and increase in data quality, but to date, no studies have used UAV-HSI to carry out quantitative snow property retrievals or to assess coarser multispectral satellite retrievals.
Background
Snow albedo
Snow albedo is defined as the ratio of incoming hemispherical (direct and diffuse) solar radiation to that of reflected radiation at the snow surface in all directions (bi-hemispherical). A significant body of work has refined models and measurements of snow and ice optical properties, and the spectrally varying controls on albedo are well understood (Warren and Wiscombe, 1980; Wiscombe and Warren, 1980; Warren, 1982; Grenfell and Warren, 1999; Warren and Brandt, 2008; Gardner and Sharp, 2010). In the visible wavelengths ice is transparent, and due to scattering between grains, clean snow reflects up to 99% of incoming light. Decreases in visible snow albedo occur when light-absorbing particles (LAPs) are present at or near the surface, which increases the likelihood of light absorption (Warren, 2019). In the near- and shortwave-infrared ice is increasingly absorptive and snow grain size is the primary driver of snow albedo. As snow grains grow, typically a gradual process over time, the path length of ice increases, which increases the likelihood of absorption. Steep temperature gradients and melt-freeze cycles can cause rapid grain growth and therefore accelerate albedo decline.
Comparison of multiple scattering radiative transfer models and empirical measurements have shown that the spectral albedo of clean snow (no LAPs) can be well-simulated by representing snow as a collection of ‘equivalent spheres’, expressed as either as an effective grain radius or as the specific surface area (Grenfell and Warren, 1999; Painter and Dozier, 2004; Domine et al., 2006; Picard et al., 2009). Hereafter, the term effective grain radius will be simplified and referred to as grain size. The relationship between grain size and albedo has led to the development of different grain size retrieval methods from measured surface reflectance, which offers a pathway to retrieve albedo from optical remote sensing.
Although sometimes the terms are used interchangeably, it is important to distinguish between albedo and reflectance measured from a remote sensing instrument, such as a satellite- or airborne imaging spectrometer. Generally, passive optical sensors measure a hemispherical-conical reflectance factor (HCRF) meaning that it only senses a portion of the light reflected back towards the instrument, while albedo is a measure of reflected light integrated over all angles (Schaepman-Strub et al., 2006). Because snow is preferentially forward scattering, and instantaneous reflectance measurements do not capture all of the relevant light interactions, modeling is required to translate HCRF to albedo by accounting for viewing and solar geometry (Painter et al., 2009).
Previous work
The band placement of current multispectral satellites is not ideal for retrieving snow properties because there are limited bands in the near infrared (NIR) and the resulting ‘step’ like spectra do not resolve snow reflectance features (Landsat 9 OLI example in Figure 1). Still, snow property retrieval algorithms have been developed. A NIR band ratio has been used to calculate the normalized difference grain size index (NDGSI) for MODIS (Painter et al., 2012). This approach implicitly assumes pixels are fully snow-covered. For pixels that are not fully snow-covered, spectral unmixing can be used to simultaneously retrieve the snow-covered fraction and the grain size within that fraction, which is the approach used by Snow Property Inversion from Remote Sensing (SPIReS; Bair et al., 2020) and MODIS Snow-Covered Area and Grain Size solution (MODSCAG; Painter et al., 2009). A clean snow albedo product, derived from the grain size, is also provided by MODSCAG. Because making accurate in situ measurements at the scale of satellite retrievals (e.g., 500 m for MODIS) is challenging, ground validation assessment of these products is scarce. For example, the reported uncertainty for MODSCAG grain size is 64 μm, with a bias of 30 μm, based on only 12 manual measurements of observable grain size with a hand lens (Painter et al., 2009), which is not representative of the “effective” particle size that is being retrieved.
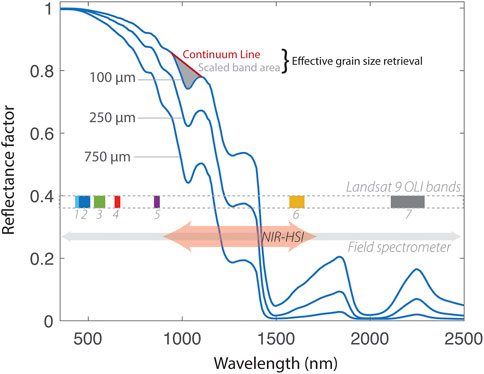
FIGURE 1. Spectral reflectance factors for snow having an effective grain radius of 100, 250, and 750 μm. An example of the scaled band area grain size retrieval method is shown on the 100 μm spectra across the ice absorption feature centered at 1030 nm. The spectral resolution of the NIR-HSI (orange arrow), field spectrometer (gray arrow), and Landsat 9 OLI (between dashed lines) are indicated on the plot.
Snow products are most well developed for MODIS because of the record length (>20 years), near daily temporal resolution, and radiometric resolution make it the best available option for mountain snow. At 30 m spatial resolution Landsat would seem better suited for monitoring snow processes, but historically, the radiometric resolution of Landsat sensors resulted in saturation over snow (Rittger et al., 2021), and the temporal repeat was coarse (16 days), limiting snow applications to seasonal assessment of snow extent. In research applications Landsat data has been used to assess or downscale the coarser scale MODIS retrievals, but only for limited spatial and temporal subsets (Durand et al., 2008; Rittger et al., 2012). Suitability for snow property retrievals changed with the launch of the OLI on Landsat 8 in 2013, a modern push broom sensor with better radiometric resolution and signal-to-noise ratio. The launch of Landsat 9 OLI in 2021 further increased Landsat’s suitability for snow because the orbit is offset from Landsat 8, cutting the temporal repeat in half to 8 days. The current USGS snow product available for Landsat is fractional snow extent (Level 3 product), but there is not yet a snow grain size or snow albedo product.
Airborne imaging spectrometers, also referred to as hyperspectral sensors due to their high number of continuous bands, have been used to retrieve grain size by relating characteristics of spectrally resolved ice absorption features to simulated values. This has been done using the scaled band area method (Figure 1), which integrates under the continuum line (red line, Figure 1) for the full ice absorption feature (gray shaded area, Figure 1) centered at 1030 nm (Nolin and Dozier, 2000), spectral slope method calculated from the shoulder to the base of the 1030 nm ice absorption feature (Skiles et al., 2018b), spectral best fit (Seidel et al., 2016), or optimal estimation (Bohn et al., 2021). Spectral snow albedo can then be modeled from grain size using the per-pixel illumination and viewing angle, and further integrated to broadband albedo through the convolution of spectral irradiance and spectral albedo (Painter et al., 2013; Seidel et al., 2016; Skiles et al., 2018b). These algorithms are more accurate than satellite retrievals because they leverage the continuous spectral signature of snow in each pixel, and the higher spatial resolution (2–20 m) reduces the frequency of mixed pixels. The limitation of this approach is infrequent collections due to cost and logistics associated with crewed aircraft.
Increasingly, UAVs are being used for snow applications. Many have focused on differential snow depth mapping using UAV based photogrammetry or lidar (Harder et al., 2016; Miziński and Niedzielski, 2017; Redpath et al., 2018; Harder et al., 2020; Jacobs et al., 2021). There have been case studies, though, that have demonstrated mapping of broadband albedo in snow-covered environments. These studies have used paired pyranometers mounted in upward- and downward-looking configurations (Webster and Jonas, 2018; Sproles et al., 2020; Mullen et al., 2022) or a single downward-looking pyranometer on the UAV and a stationary upward-looking pyranometer within the flight area (Levy et al., 2018). These measurements return a single spectrally integrated value for incident and reflected radiation, from which broadband albedo can be calculated. If care is taken to fly only over snow, this would be an effective snow albedo (Mullen et al., 2022), otherwise, snow cannot be separated from other land surface types with a spectrally integrated measurement. Rather, the goal is to measure mixed land surfaces to understand heterogeneity when snow is present with other land surface types (Webster and Jonas, 2018). The measurements are referred to as effective because the measured ratio of outgoing to incoming solar radiation is relative to the illumination and the upward- and downward-looking spatial footprint at time of measurement, which is in flux during the UAV flight due to the instruments 180° field of view.
At ground-based scales similar methods have been applied to map snow grain size along vertical snow profiles at the laboratory and snowpit scale from spectral reflectance measured with a near infrared hyperspectral imager (NIR-HSI). These retrievals were based on the same concept as airborne imaging spectroscopy, using per-pixel scaled band area (Donahue et al., 2021), or best fit to simulated NIR reflectance (Donahue et al., 2022). These retrievals established the feasibility of mapping grain size from a relatively inexpensive and compact NIR-HSI, as well as demonstrating an application for interpreting radar remote sensing retrievals (Donahue and Hammonds, 2022). This motivated the current study, which has two primary goals; 1) validate quantitative retrievals of snow grain size, and albedo, from UAV-HSI measured reflectance, and 2) demonstrate the utility of these retrievals for assessing per-pixel values of grain size and albedo, and sub-pixel variability, from Landsat 9 OLI.
Methods
Study site
The UAV overflight took place on 31 May 2022, at Swamp Angel Study Plot (SASP; 37.906914°N, −107.711,322°W; 3368 m), located within Senator Beck Basin Study Area (Landry et al., 2014). Senator Beck Basin (Figure 2A) is a small (∼3 km2) study basin in the San Juan Mountains of southwest Colorado, United States that has been operating since water year 2004, and has been previously used as a primary ground validation site for multiple airborne snow imaging spectroscopy efforts (Painter et al., 2013; Seidel et al., 2016; Skiles et al., 2018b). SASP, located in an open meadow (∼18,000 m2) below tree line near the basin pour point, is an accessible well-instrumented study plot within the basin boundary (Figure 2). The study plot contains an instrumentation tower situated within a roped-off area (∼200 m2) to limit snow disturbance.
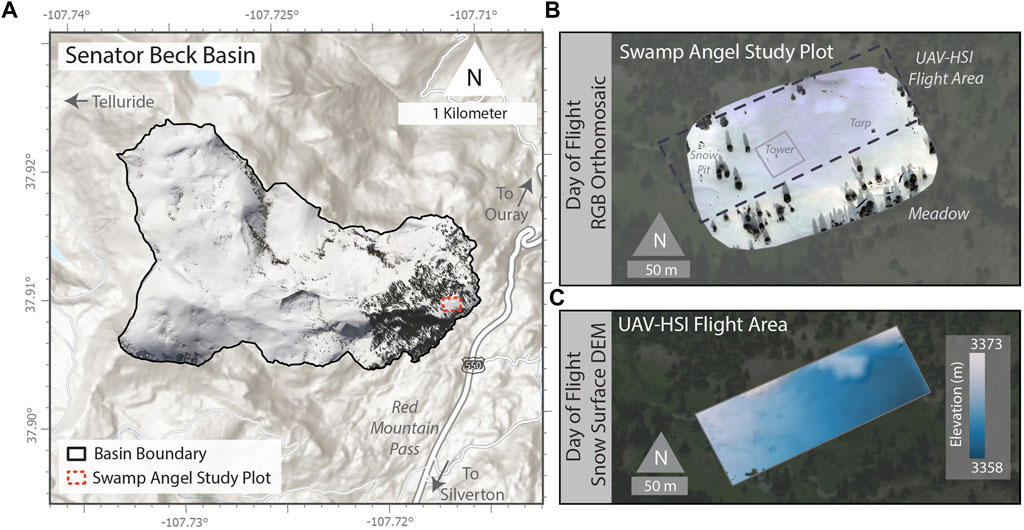
FIGURE 2. (A) Overview map of Senator Beck Basin, Colorado, United States (B) Swamp Angel Study Plot with RGB orthomosaic from day of flight. (C) The UAV-HSI flight area with day of flight lidar derived snow surface digital elevation model (DEM).
The tower measurements that were used in this study to put the snow conditions and snow property retrievals in context were snow height, air temperature, and snow albedo, which is calculated from incoming and outgoing solar radiation. The data from Senator Beck is posted at the end of the water year (September 30th), which was not yet available for this study. Real time data was used instead, which was provisional (MesoWest Site ID: CASWP). To fill in a data gap in the provisional record for snow height, the quality assessed end of day values were filled in using the nearby Red Mountain Pass SNOTEL site (Site 713).
In addition to the UAV-HSI data collection presented here, a UAV lidar with RGB camera was flown over SASP on the same day. This data is not described in detail, as it is not a part of the analysis presented here, but the orthomosaic of the RGB imagery and the 1 m snow surface DEM from the lidar are helpful to visualize conditions at time flight (Figures 2B, C). The meadow gently slopes upward from the southeast corner and is bounded by a hill on the northern edge and the creek on the southern edge. On the day of flight, the snow surface slope across the majority of the meadow ranged between 1 and 4°, with a mean snow surface elevation of 3,363 m (2.75 m standard deviation).
Field collection
UAV near infrared hyperspectral imaging
In this study a Resonon Pika NIR-320 hyperspectral imager was directly mounted to a DJI Matrice 600 Pro Hexacopter (M600) in a nadir-looking configuration (Figure 3A). The NIR-320 is a line-scan (i.e., push broom) imager with 168 continuous spectral bands, measuring spectral radiance between 900–1700 nm at 4.9 nm bandwidth and 14-bit radiometric resolution. The output data product is a spectral data cube, which has two spatial dimensions (x,y) and a spectral dimension (λ = 168), with each spatial pixel containing the at-sensor spectral radiance signature. The imager weighs 2.6 kg and is 11.0 × 29.6 × 8.9 cm in size. To track the location and movement during flight, an inertial measurement unit (IMU) and global navigation satellite system (GNSS) receiver was mounted to the side of the imager, which was used to georectify the imagery postflight.
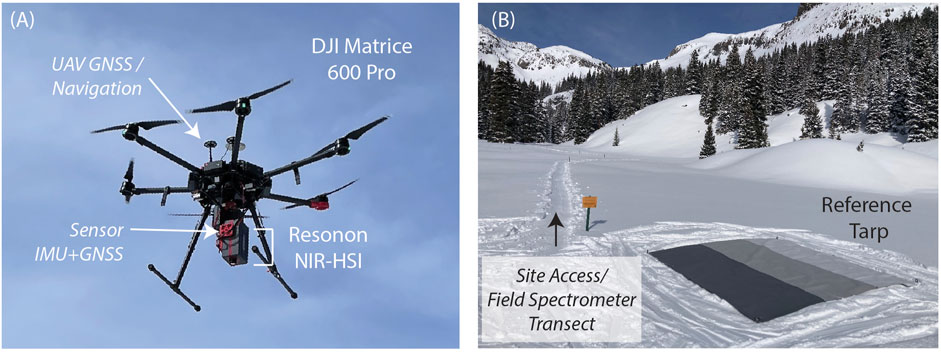
FIGURE 3. Photographs of (A) UAV-HSI system and (B) reference tarp at the field location.
The flight consisted of three flight lines with 20% overlap; the first line started at 11:29:46 and the last line completed at 11:33:21 local time, with a total flight time of approximately four minutes. At the time of flight, which took place within two hours of solar noon (13:15 local time), the solar zenith angle was 41° and the snow surface was fully illuminated. There was high, light, cirrus clouds but they were not obscuring the sun. The flight altitude was 20 m above ground level (3388 m agl), producing imagery at 20 cm pixel-resolution. Areal coverage was ∼13,250 m2, which included the roped-off study plot and most of the surrounding meadow (Figure 2). A reference tarp made up of three spectrally flat reflectance gray panels (11%, 32%, 54%), which was used in post-processing, was placed in the flight area prior to the flight (Figure 3B).
Field spectroscopy
For assessment and validation of the UAV measurements, discrete point measurements of surface spectral reflectance factors were collected in situ with an ASD® FieldSpec4 field spectrometer. The FieldSpec 4, designed for fast and precise spectral measurements, contiguously samples the spectral range 350–2500 nm, with contiguous bands that are 3 nm (at 700 nm) to 10 nm (at 1400 and 2100 nm) at full width half maximum. The spectra are resampled and splined to 1 nm resolution and the wavelength reproducibility and accuracy is 0.1 and 0.5 nm, respectively. There were 20 total reflectance measurements within the flight area, to limit snow disturbance the measurements were collected over undisturbed snow adjacent to the existing ski track used to access the study plot (Figure 3B). Measurements took place just prior to the flight, between 11:12 and 11:26 a.m. local time. The reflectance transects began with a measurement of a Spectralon® white reference panel for calibration, proceeded by snow HCRF measurements at regular intervals along the transect in a nadir-looking configuration using a pistol grip and 8° field of view narrowing fore optic. With each measurement collected ∼1 m above the snow surface, the measurement spot size was ∼28 cm. Each measurement location was recorded with an Emlid RS2 RTK GNSS receiver, coupled with a stationary Emlid RS2 base station. During the flight, the field spectrometer was also used to measure incoming spectral solar irradiance (W m−2) using a level upward-looking remote cosine receptor.
Data processing
An overview of the data collection and processing workflow is shown in Figure 4. Each flight line was georectified using Spectronon processing software, provided by Resonon, using the location data and instrument parameters. The flight lines were then mosaiced using ENVI® image processing and analysis software, which uses the georeferencing information to align individual lines, and interpolates across the overlapping regions using cubic convolution. Due to location error, some identifiable features (trees, tree shadows, and ski tracks) did not initially align perfectly and the mosaic was corrected by manually shifting the flight lines to align the features.
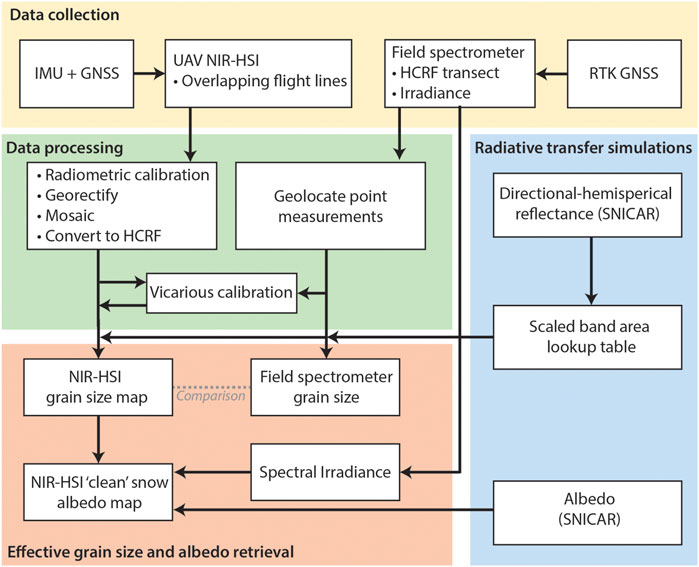
FIGURE 4. Overview of UAV-HSI and field spectrometer processing steps.
The remainder of the workflow was developed and carried out in MATLAB®. First, the HCRF was calculated for each NIR-HSI pixel radiance using the center panel (32%) of the gray reference tarp. To reduce noise in the spectral reflectance curves a least-squares Savitzky-Golay filter (Savitzky and Golay, 1964) was applied with a polynomial degree of 5. Using a 35% reflectance threshold within the ice absorption feature (1029 nm), pixels containing non-snow and shadows were masked out of the NIR-HSI map, including trees and the reference tarp.
Then, for each NIR-HSI pixel and field spectrometer point measurement the scaled band area (
The grain size was retrieved by relating the measured scaled band area to theoretical scaled band areas from directional-hemispherical reflectance factors (DHRF) simulated using the Snow, Ice, and Aerosol Radiative Transfer Model (SNICAR-ADv3; Flanner et al. (2021)). A scaled band area lookup table was generated for effective grain radii ranging from 30 to 1500 μm at 1 μm increments and a direct solar illumination corresponding to the sun geometry at the time of flight (41° solar zenith angle). The comparison of the measured HCRF with the simulated DHRF is a suitable approach because they are nearly identical at nadir viewing angles (Dumont et al., 2010), which was the case for the NIR-HSI and field spectrometer over the flat meadow.
To assess the UAV retrievals, the NIR-HSI reflectance signatures and grain sizes were compared to those from the field spectrometer, which was used as the reference measurement. There was some uncertainty in the absolute and relative locations of the NIR-HSI pixels, due to a combination of GNSS uncertainty and the manual alignment of flight lines. Therefore, field spectrometer point measurements that were located inside of the ski track were manually moved (at most 10 cm) outside of the ski track because all measurements were taken over undisturbed snow. To account for this, and the larger spot size of the field spectrometer (28 cm) relative to a UAV-HSI pixel (20 cm), the comparison included the NIR-HSI pixel containing the field spectrometer point location and the surrounding nearest neighbor pixels (9 pixels total).
Following the initial comparison there was a consistent low bias in the grain sizes, discussed in more detail in Vicarious Calibration Section. To address this bias, one of the field spectrometer reflectance measurements was used to carry out a vicarious calibration (Richter et al., 2001; Secker et al., 2001; Milton et al., 2009) on the NIR-HSI imagery. This calculates a per-band correction factor, forcing the NIR-HSI spectral reflectance to match the field spectrometer, and then applies that correction factor to every pixel in the scene. In this instance, the 9-pixel average reflectance factor was used to represent the NIR-HSI spectral reflectance. The vicarious calibration point, measurement point #14 (Figure 5A), was selected because 1) it was in the overlapping region between two flight lines, 2) the nine neighboring pixels were well matched with low variability, and 3) the reflectance signatures were similar in magnitude to the ASD but had variation in the shape of the ice absorption feature. This resulted in correcting the scaled band area, as opposed to reflectance magnitude, which is shown in the example pre- and post-calibration UAV-HSI pixels at field spectrometer point #2 (Figure 5B).
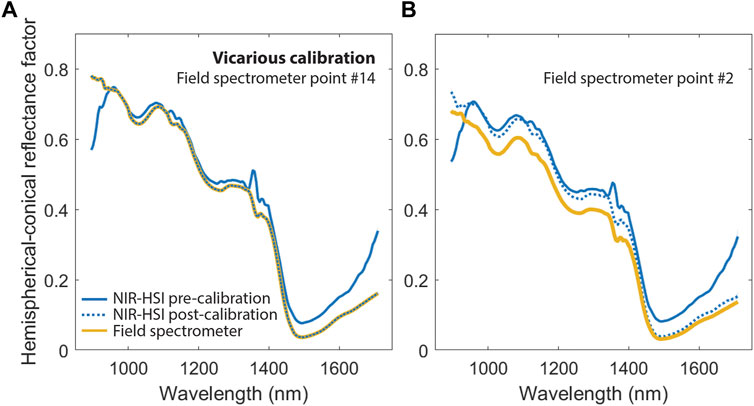
FIGURE 5. (A) NIR-HSI pre- and post-vicarious calibration using the field spectrometer point measurement #14. (B) Field spectrometer point #2 and the pre- and post-vicariously calibrated NIR-HSI spectra at the same location.
Finally, broadband snow albedo was mapped per-pixel using the post-calibration grain sizes and illumination geometry. Spectral bihemispherical snow albedo
We note that this approach is based solely on grain size and does not account for albedo reduction due to surface darkening by LAPs, and therefore would be considered a ‘clean’ snow albedo. For this case study, this is a reasonable approach because the snow was freshly fallen and clean. If the snow were not clean, measurements of snow reflectance in the visible wavelengths would be needed, in addition to the NIR, to quantify the observed snow albedo.
Landsat 9 OLI
The Landsat 9 overpass occurred two days after the UAV-HSI flight, on April 2nd at 11:50 a.m. Parts of the scene were obscured by clouds, but SASP was cloud free. Although the overpass was not coincident with the UAV flight, the comparison is suitable given that conditions were similar for the Landsat 9 overpass, with fresh snow at the surface and collection time <30 min after the UAV-HSI flight (solar zenith angle 38°). The Landsat 9 Level-2 surface reflectance scene (L2SP, Path: 035, Row: 034, Tier 1) was first subset to the bounding box of the NIR-HSI flight. Then, pixels with less than 25% NIR-HSI areal coverage were excluded, and 17 pixels remained that overlapped with the NIR-HSI flight area. To retrieve grain size, the NDGSI was calculated using band 5 (850–880 nm) and band 6 (1570–1650 nm):
Grain size, which scales logarithmically with the index value (see Figure 1 in Painter et al., 2012), was retrieved by matching the Landsat NDGSI to theoretical NDGSI values based on SNICAR simulated spectra for a range of grain sizes at 38° direct illumination. The corresponding broadband albedo in each pixel was then calculated using the retrieved grain size and illumination geometry as previously described using Eq. 2. To compare the two datasets, the NIR-HSI grain size and albedo were resampled from 20 cm to Landsat 9 resolution (30 m). To quantify the sub-pixel variability within each 30 m pixel, zonal statistics for grain size and albedo were calculated for each Landsat pixel from the NIR-HSI imagery using the native 20 cm resolution. The statistics used to characterize and interpret the variability were percent coverage, standard deviation, and range between the highest and lowest values.
Results
Field conditions and UAV flight parameters
The day of the flight (March 31st) was preceded by cloud cover and precipitation; between March 28th and March 31st 25 cm of new snow fell. The peak snow height of 174 cm at the instrumentation tower occurred at 4 a.m. local time on the day of flight, after which skies began to clear. At the time of flight snow height had settled to 171 cm (Figure 6). The air temperatures were near the freezing point; the night prior to the flight the temperature reached a low of −10°C and reached just above 1°C during the flight. A snow pit excavated near the study plot showed that the top 10 cm of the snowpack was unconsolidated new snow made up of small and decomposing precipitation particles, on top of a new, but more consolidated, snow layer. The temperature of the surface snow layer was 0°C, but had fallen on snow which retained cold content, with the coldest temperature of −1°C at 70 cm height. Winds were light, less than 1 m s−1, typical in the protected meadow, and were coming from the east in the morning, shifting to the south at 9 a.m. The prevailing wind direction at SASP is southwest (Landry et al., 2014).
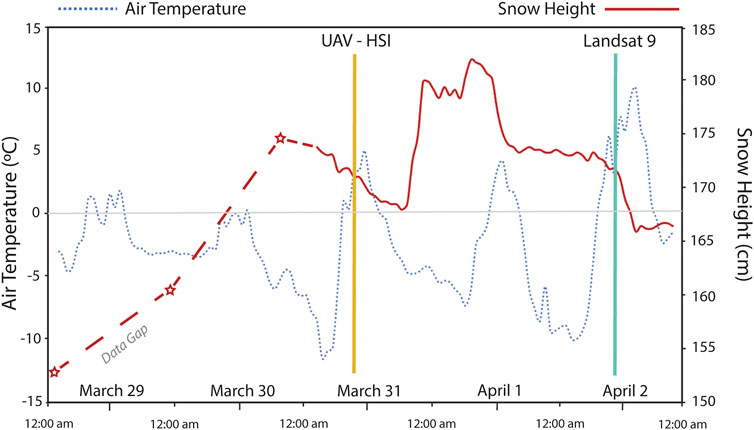
FIGURE 6. Swamp Angel Study Plot air temperature and snow height between March 29 and April 2. The gap in snow height during the storm prior to March 31st shows midnight values, as red stars, from a nearby SNOTEL site.
During flight, the UAV was relatively stable and consistent in terms of pitch, roll, and yaw, which was recorded along each flight line during imagery collection from the IMU (Figure 7). This is important because the sensor was directly mounted to the UAV, as opposed to being on gimbal. The mean roll angle, or movement side to side, was 0.6° and was higher during flight lines 1 and 3. The mean pitch angle, or movement up or down, tended to be slightly ‘down’ (negative) for flight lines 1 and 3, and slightly ‘up’ (positive) for flight line 2, with an overall mean pitch of −1.4°. The yaw, or heading, was also consistent per flight line. Overall, the flight parameters provide confidence that the imager was generally nadir-looking during flight, with only minor deviations due to the movement of the UAV.
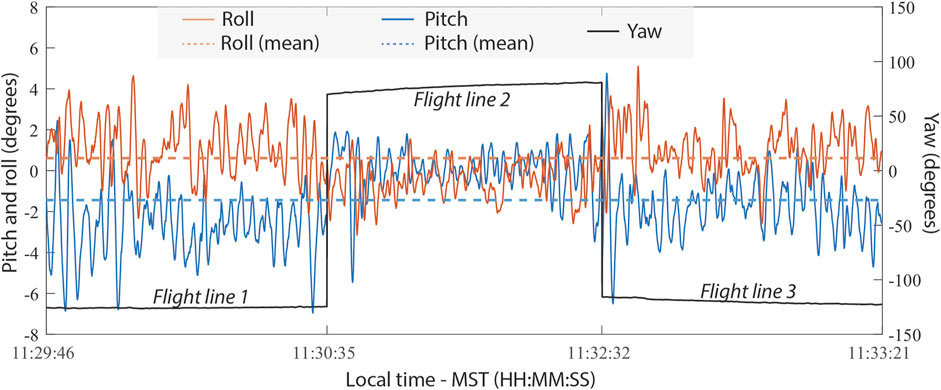
FIGURE 7. Roll, pitch, and yaw of the UAV during the flight collected from the inertial measurement unit (IMU).
Grain size retrieval
Pre-vicarious calibration
The UAV-HSI grain size value distributions were relatively small, consistent with expectations for freshly fallen snow. Across the full scene (Figure 8A), made up of 296,864 pixels, the mean grain size was 79 μm (Figure 8B). The range in grain sizes extended from 30 to 250 μm, and the distribution was slightly skewed toward smaller grain sizes, with a standard deviation of 21 μm. The grain size map showed spatial variability across the meadow, with distinct patterns across the snow surface. Notably, the ski track used to access the study plot and around the meadow, used to take field spectrometer measurements, had distinctly larger grains due to ski compaction of the new snow. Larger grains, and the widest variability in values, were found around trees in the western portion of the meadow and in the upper northeast corner. Undisturbed snow in the open meadow had the smallest grains. Visually this area was the most consistent, but the grain size map shows interesting and distinct patterns in the new snow that likely relate to microtopography due to wind and settlement of the new snow on the old snow surface.
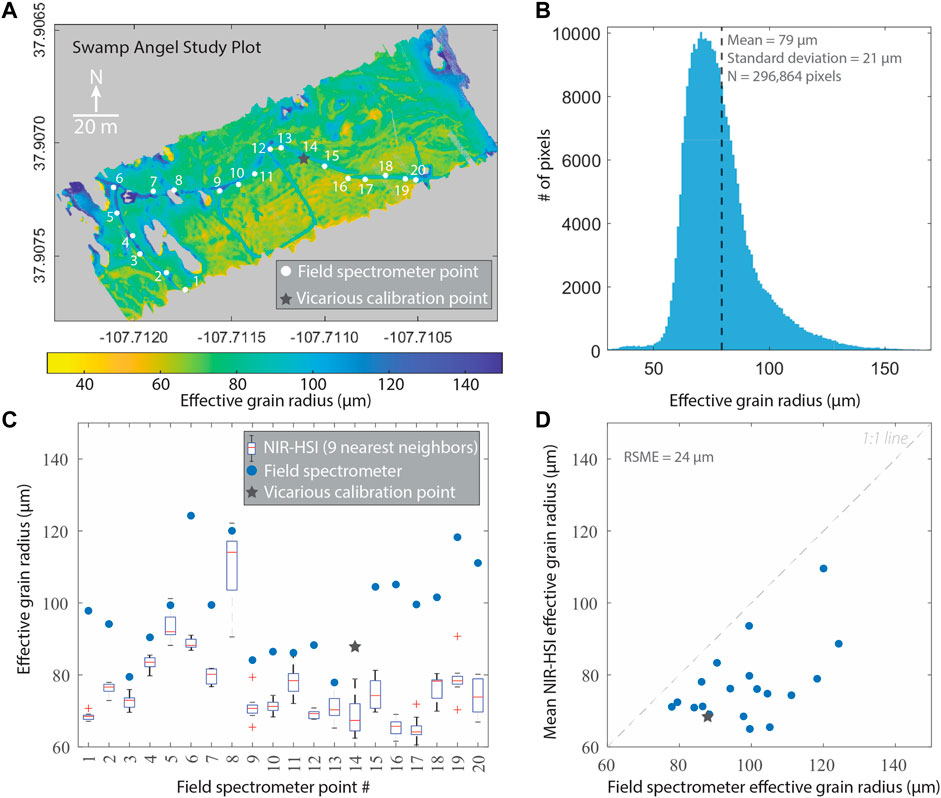
FIGURE 8. Pre-vicarious calibration UAV-HSI grain size retrievals compared to the in situ field spectrometer point measurements. (A) Effective grain size map retrieved from UAV-HSI and the location of the field spectrometer points. (B) Histogram of the UAV-HSI effective grain sizes across the map in (A). (C) The effective grain size for each field spectrometer point measurement (blue circles) compared against the box plot distribution of UAV-HSI grain sizes in the 9 neighboring pixels (D) One-to-one plot comparing the average (mean) grain size from 9 neighboring UAV-HSI pixels to that from the field spectrometer.
For the initial retrieval, the NIR-HSI grain sizes were biased low compared to the reference grain size retrieved from the field spectrometer at the 20 discrete measurement locations, with an RMSE of 24 μm. The field spectrometer measurements had a higher mean value (98 μm) and the bias was consistent across the scene; for nearly all points (1–20) the values were higher than the interquartile range from the neighborhood of surrounding NIR-HSI pixels (Figures 8C, D). As discussed in methods (Data Processing Section), measurement point #14 was selected to vicariously calibrate the UAV-HSI spectra (gray star in Figure 8A), and the reasons why a calibration may be needed are discussed further in section 5.2.1.
Vicarious calibration
The vicarious calibration factors, determined from the comparison at point #14, were applied to the whole scene. The magnitude of reflectance at the longer wavelengths was adjusted down, closer to what would be expected for snow, which is absorptive past 1500 nm (Figure 5A). Overall, though, the result of the calibration was not a distinct shift in NIR reflectance magnitude but rather adjustments to the shape of the spectral curve, demonstrated for Point #2 in Figure 5B. For example, the distinct ‘pull down’ feature at the shortest wavelengths, not a feature of snow absorption but an artifact of the sensor itself, was no longer present. Additionally, the absorption feature was slightly deepened and broadened on the right side, which resulted in an increase in the scaled band area, and therefore, grain size.
The calibration did not change the grain size patterns (Figure 9A), but rather the result was an overall increase in grain sizes across the scene, improving the comparison to the reference field spectrometer values. Following the calibration, the mean grain size was 100 μm, an increase of 26 μm relative to the pre-calibration value. The overall histogram (Figure 9B) maintained its shape, with a slight skew toward the smaller grains and a small increase in the standard deviation from 21 to 23 μm. The update in grain sizes brought the values closer in line with the reference values from the field spectrometer; the reference values were brought closer to the interquartile range of the neighboring pixels (Figure 9C), and the consistent low bias was no longer present (Figure 9D). The post calibration comparison showed values falling both above and below the 1:1 line with the RMSE reduced to 12 μm. As would be expected, the calibration point itself fell on the 1:1 line (red star in Figure 9D).
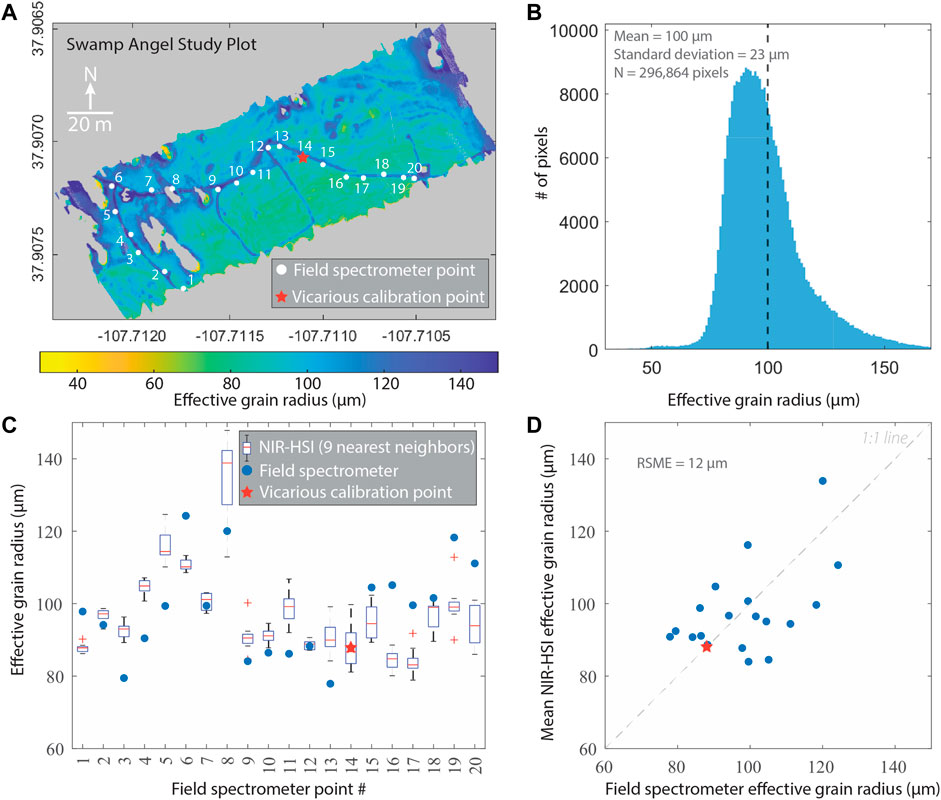
FIGURE 9. Vicariously calibrated UAV-HSI grain size retrievals compared to the in situ field spectrometer point measurements. (A) Effective grain size map retrieved from UAV-HSI and the location of the field spectrometer points. (B) Histogram of the UAV-HSI effective grain sizes across the map in (A). (C) The effective grain size for each field spectrometer point measurement (blue circles) compared against the box plot distribution of UAV-HSI grain sizes in the 9 neighboring pixels. (D) One-to-one plot comparing the average (mean) grain size from 9 neighboring pixels to that from the field spectrometer.
Albedo
The albedo retrieval from the vicariously calibrated grain sizes (Figure 10A) showed high values, also consistent with what we could expect from freshly fallen snow. The range of albedo was 83%–89% with a mean albedo of 86% (Figure 10B). This is a close match to the albedo measured at the instrumentation tower, which was 87% at 11 a.m. and 85% at 12 p.m. (data was reported at hourly intervals). Using the incoming solar radiation at time of flight from the field spectrometer, 633 W m−2, the corresponding mean reflected solar radiation was 543 W m−2, with a range from 525 to 563 W m−2. The complement of snow reflection is snow absorption, or net solar radiation, the primary variable of interest for snow energy balance modeling. The mean net solar radiation was 90 W m−2, with a range of 70 and 108 W m−2.
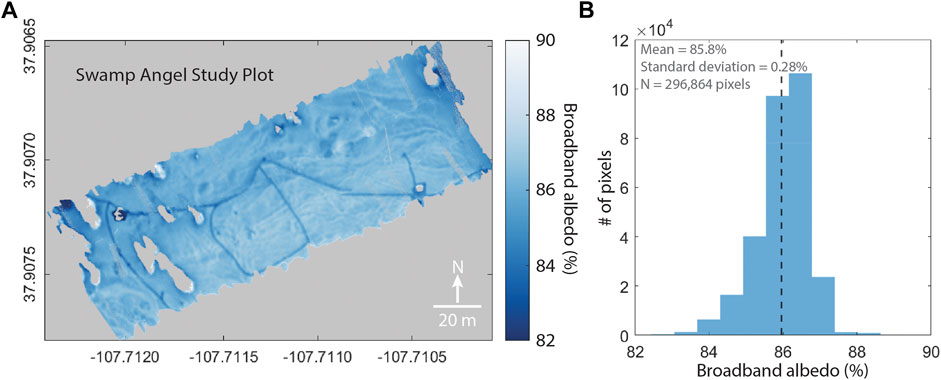
FIGURE 10. (A) Map of UAV-HSI derived broadband albedo across Swamp Angel Study Plot. (B) Histogram of broadband albedo in all pixels contained in the map from (A).
Because the albedo retrieval is based on the grain size retrievals, the overall patterns across the snow surface were similar between the two. Albedo was lowest along the ski track and most variable around the trees, with lower variability and higher albedo in the open portion of the meadow. Although the range of values was relatively small, the map demonstrates distinct coherent patterns in snow albedo that appear to relate to vegetation and landscape features, or in the open, follow the long fetch of the meadow. High resolution maps like this demonstrate the high amount of variability that can be present in new snow, even though it would appear visually homogenous due to the high consistent reflectance in the visible wavelengths. This also shows how a relatively small difference in snow albedo can result in a relatively large differences in net solar radiation at small (submeter) scales.
Landsat 9 OLI
The conditions on April 2nd, the day of the Landsat 9 overpass, were similar to those on the day of the UAV-HSI overflight on March 31st (Figure 6). Between collections, the air temperatures remained below freezing overnight, a low of −7°C on the 31st and a low of -10°C on the 1st, with highs around 5°C during the day. Skies were clear the afternoon of the 31st, with cloud cover and snowfall on the 1st. Snow reached a peak depth of 180 cm around 1 p.m. local time on the 1st. Skies began to clear again on the 2nd, with snow settling to 170 cm at the time of the Landsat 9 overpass. The NDGSI grain sizes across the 17 Landsat 9 pixels were relatively small and representative of new snow and compared well to the resampled scaled band area UAV-HSI grain size values (Figures 11A, B).
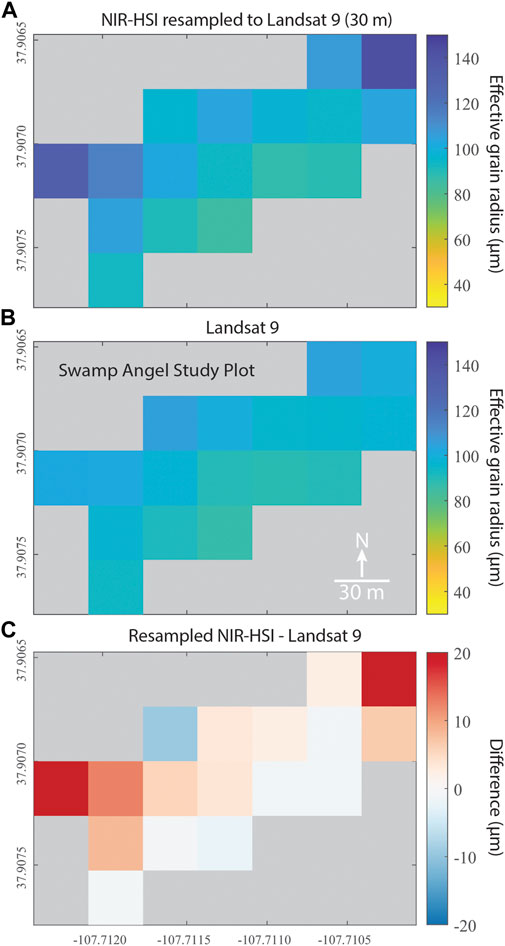
FIGURE 11. Comparison of (A) resampled (downscaled) NIR-HSI grain size map to (B) Landsat 9 OLI NDGSI map, with the difference map shown in (C).
The mean Landsat 9 grain size was 97 μm (2.7 μm standard deviation) and the mean resampled UAV-HSI grain size was 106 μm (8.4 μm standard deviation). This result indicates that NDGSI is a suitable approach for mapping snow grain size from Landsat 9 for these conditions; flat terrain, and primarily snow-covered pixels. However, Landsat 9 showed overall less variability compared to resampled UAV-HSI. The largest grain sizes and variability from UAV-HSI were on the edges of the scene where pixels containing the masked trees and tree shadows are seen in the full high resolution map (Figure 9A). These pixels also had the largest difference (42 and 31 μm) relative to Landsat (Figure 11C), but conversely, these pixels also had the least coverage (<30%; Figure 12A). The differences are likely related, at least in part, to the partial coverage by the UAV-HSI, but other factors may also play a role, which is discussed further in Comparison to Landsat 9 Section.
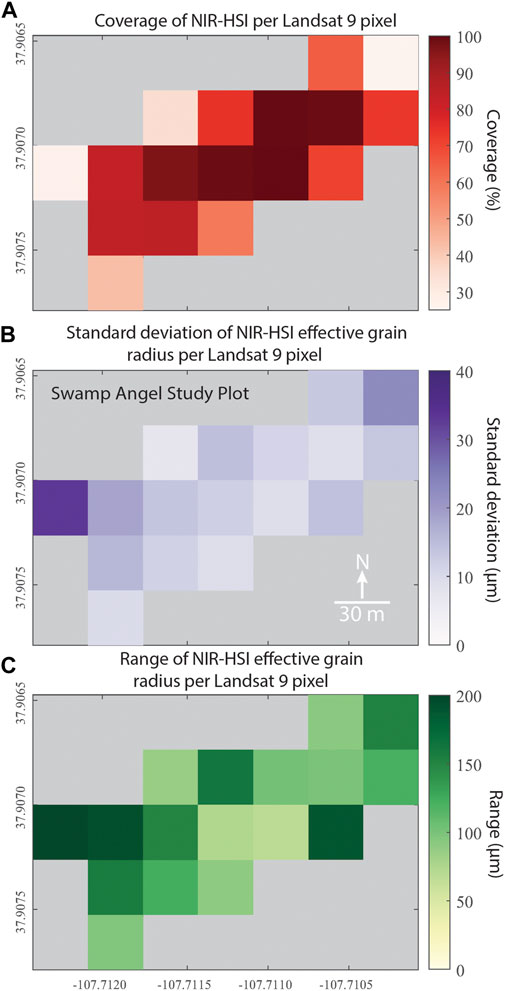
FIGURE 12. Landsat 9 NDGSI zonal statistics based on high resolution UAV-HSI effective grain size retrieval; (A) percentage of UAV-HSI pixel coverage in each Landsat pixel, (B) standard deviation of effective grain size per Landsat 9 pixel based on UAV-HSI, and (C) the range of effective grain size per Landsat 9 pixel based on UAV-HSI.
Because grain size is the baseline retrieval from snow reflectance, the Landsat 9 subpixel variability analysis for grain size is presented here in Figures 11, 12. Corresponding plots for snow albedo can be found in Supplementary Figure S1. The albedo results were similar to those from grain size, with a good comparison between Landsat 9 and UAV-HSI. The mean values were 86.0% and 85.7%, respectively. On April 2nd the incoming solar radiation at time of overpass was 659 W m−2, calculating the net solar radiation from this value would result in a difference of only 2 W m−2 between Landsat 9 and UAV-HSI. The overall patterns were also similar to grain size, with the largest difference in albedo values at the edges of the compared area.
Although the mean values compared well between Landsat 9 and the UAV-HSI, the sub-pixel grain size and albedo distributions showed relatively high variability (Figure 12 for grain size, Supplementary Figure S1 for albedo). There were five Landsat pixels with 100% coverage, encompassing ∼22,500 UAV-HSI pixels. The high coverage pixels were found in the center of UAV-HSI scene, over the open fetch of the meadow where snow grain size was least variable, and albedo was highest (Figure 12A). The standard deviation in UAV-HSI grain size in the Landsat 9 pixel footprints were between 8 and 13 μm, and the range between minimum and maximum grain size per pixel was between 60 μm and 160 μm (Figures 12B, C). Corresponding, for albedo the standard deviations in these pixels were between 0.4 and 0.5%, with total ranges of 3.0–6.2%.
The lowest coverage, between 25 and 30%, was in two edge pixels, which still contained ∼6,000 UAV-HSI pixels. These pixels were on the west and northeast edge of the flight area, where higher variability in grain size and albedo were present around the trees. These Landsat 9 pixels also had the most subpixel variability, with standard deviations in grain size of 33 and 22 μm and grain size range of 197 and 152 μm. Corresponding standard deviation values for albedo were 0.7–1.3%, ranging from 5.3 to 8.3%. Relatively high standard deviations and ranges were also seen for grain size and albedo across pixels with higher coverage, indicating the variability was representative of the surface and not solely a function of the lower coverage and pixel count.
Discussion
UAV data collection
Data collection with UAVs is increasingly accessible and flexible relative to crewed aircraft, still, it is not without its challenges. The HSI instrument used in this study required a relatively large and less portable UAV, like the M600 Pro, with a high payload capacity. The combination of thin air, due to the high elevation of the site, cold temperatures, and the weight of the sensor greatly reduced typical flight times. This meant that the M600 Pro had to be shuttled into the study site on a ski sled, rather than flown from the road, and that the area covered was relatively small with lower than desired overlap between flight lines. The flight lines themselves also did not perfectly align due to GNSS location error, despite the UAV and the sensor having differential (real time kinematic) GNSS receivers. In this instance, it may have related to a degraded signal due to the mountain environment or the temporary base station, but uncertainty in location and therefore georectification may simply be a reality of the smaller sensors and receivers necessary for UAV systems.
Additionally, data collection and data processing require a unique set of skills, which limits the current accessibility of this method. With a relatively large UAV and heavy payload, having an overall cost exceeding $50K USD, a pilot that is both skilled at flying and is familiar with hyperspectral imaging is necessary. Acquiring quality data requires the instrument to be focused at time of flight, suitable integration time and framerate need to be selected, the illumination conditions need to be consistent during flight, and the UAV needs to be steady and stable. Also, a relatively large field team was required for this study to set out the tarp, collect near-coincident field spectrometer measurements and record the locations, measure incoming irradiance during flight, and excavate a snowpit to record snow properties, which required familiarity in field spectroscopy and snow observations. Finally, data processing required expertise in analyzing spectral data cubes and snow radiative transfer modeling.
Over time, these hurdles will lower. As hyperspectral imagers become lighter, they will be able to fly on smaller UAV’s, which will likely address the challenges with site access and flight time. As uncertainties are constrained and better understood, the need for coincident ground observations will be reduced. Using atmospheric correction to convert at sensor radiance to reflectance could eliminate the need for the in-scene reference tarp and allow for more flexibility in variable lighting conditions or view angles across flight lines. Finally, snow radiative transfer modeling is becoming more accessible with online and open source code bases (Libois et al., 2013; Flanner et al., 2021), that could integrate with processing workflows to support automated or semi-automated processing of UAV-HSI datasets.
Retrieval sensitivity and uncertainty
Effective grain size
Inverting snow properties from remotely sensed data based upon radiative transfer modeling has some uncertainty due to the method used to fit measured and simulated spectra, environmental, and topographic conditions. The scaled band area method, used here, has a reported uncertainty of 50 μm using Airborne Visible/Infrared Imaging Spectrometer (AVIRIS Classic) data (Nolin and Dozier, 2000), which has significantly lower spatial and spectral resolution, and lower signal-to-noise ratio, as compared to the NIR-HSI or the field spectrometer. In a controlled laboratory environment, Donahue et al. (2021) found that grain sizes from the same NIR-HSI used in this study had the same mean grain size value as that retrieved from coincident field spectrometer measurements, validating the coarser spectral resolution retrievals. Relative to stereology, however, grain sizes were 41 μm lower (23%), a similar result was also reported in Gergely et al. (2013), indicating a low bias in ‘optical’ grain size relative to physical grain size parameters like specific surface area.
Here, the difference in grain size relative to the reference field spectrometer measurements, 2 μm mean difference and 12 μm RMSE, indicates that the uncertainty in terms of the optical retrieval is lower relative to classic AVIRIS retrievals, but higher than that found in the laboratory. It is worth recognizing that this was 1) following the vicarious calibration, and 2) that the reference measurements are not without errors. The sensitivity of grain size retrieved from a field spectrometer, due to variability in environmental and collection conditions during field measurements, has been reported as 20 μm (Skiles and Painter, 2017). There is also sensitivity in retrievals related to the radiative transfer modeling, and care must be taken to represent conditions at the time of measurement, for example solar geometry, as incorrect inputs will bias retrievals (Fair et al., 2022). If the same radiative transfer simulations are being used for the field spectrometer and UAV-HSI grain size retrievals, the error in grain size due to incorrect model inputs would be present in both, and therefore would be unknown. Additionally, scaled band area of the ice absorption feature centered at 1030 nm is not suitable for wet snow; it is modeled based on ice particles only and cannot represent the widening of the ice absorption feature caused by the presence liquid water (Donahue et al., 2022).
For future work in more complex environments, there are additional considerations for retrieving grain size, and albedo, that relate to the influence of topography on at-sensor radiance. The scaled band area method is said to be somewhat insensitive to the absolute measured reflectance (Nolin and Dozier, 2000), although this is not strictly accurate, as the conversion from measured at-sensor radiance to surface reflectance can introduce uncertainty into the grain size retrieval by altering the area of the absorption feature. Here, we used a calibration tarp laid on the flat ground to convert from radiance to reflectance. This would not be a suitable approach for sloping terrain, hills, or mountain sides, which influences magnitude of at-sensor radiance. In this case, an atmospheric correction, such as ATCOR4 (Richter and Schläpfer, 2002), would likely be the best approach because it would correct illumination based upon the topography. Relatedly, SNICAR would not be suitable choice for the radiative transfer modeling because the sensor would no longer be in a nadir-looking configuration above a slope (Richter, 1998). In this case, a radiative transfer model that simulates angular intensities, such as the discrete ordinates radiative transfer (DISORT) or asymptotic radiative transfer (ART) models (Stamnes et al., 2000; Kokhanovsky and Zege, 2004), would be needed to simulate directional reflectance.
For this study, the NIR-HSI needed to be vicariously calibrated in order to retrieve grain sizes that were comparable to the field spectrometer, and albedo values comparable to the instrumented tower. The need for vicarious calibration can be due to a combination of sensor characteristics, noise, sensor misalignment or movement, environmental conditions, and the method used to convert from radiance to reflectance. Using higher certainty field measurements coincident with overflight to correct and scale reflectance values is a common practice for imaging spectroscopy at satellite and airborne scales (Secker et al., 2001; Teillet et al., 2001; Brook and Dor, 2011; Skiles et al., 2018b; Bruegge et al., 2021). Practically speaking, though, it is a logistical challenge that takes time and requires high accuracy in situ spectrometer measurements. In the future it would be useful to carry out additional UAV-HSI case studies, across a variety of environmental and snow conditions, in order to better understand sources of uncertainty in reflectance values, as well as uncertainty if uncalibrated reflectance values were used in retrievals.
Finally, the case study presented here had a short flight time (∼4 min) during which the illumination conditions did not change. In future applications during longer flights that cover more area, the sun angle will change during flight and could result in reflectance gradients between flight lines. Although not implemented here, finishing the flight with a flight line that crosses all other lines may be useful for equalizing any effects from changing illumination.
Albedo
Recall, the albedo product retrieved here, using the NIR-HSI, is the ‘clean’ snow albedo, and does not consider any impacts from LAPs. This is why the baseline comparison between datasets focused primarily on grain size. This was suitable for the snow conditions in this case study, but if present, it would be critical to account for LAPs because they lower albedo in the visible wavelengths, where solar irradiance peaks and exerts a stronger weight on broadband albedo (Skiles et al., 2018a). To account for snow darkening and reduction of snow albedo by LAPs additional measurements of reflectance across the visible wavelengths would be needed. Practically speaking, this would have required an additional sensor co-aligned to the NIR sensor, which would increase the overall weight of the payload. This was outside the means and scope of this study.
Without accounting for LAPs, the method presented here for retrieving albedo is directly linked to snow grain size. The relationship is non-linear, though, with albedo change being more sensitive to smaller grain sizes. For example, under the illumination conditions and radiative transfer modeling present in this study, a 25 μm span in grain sizes, from 99 to 124 μm, would result in the same retrieved albedo value of 85% (rounded to nearest whole number). Whereas the same albedo value of 75% would results from a span of 112 μm, from 668 to 780 μm. This means that for a clean snow, grain size, based approach of estimating albedo, larger errors would be expected at higher albedos and smaller grain sizes, like the conditions in this study, and lower errors for older, aging snow, which would be expected later in the spring season during melt conditions.
Comparison to Landsat 9
Part of the motivation for this case study was to show how UAV-HSI could be used to assess coarser scale satellite retrievals. Underlying this motivation is the understanding that 1) spatial data is best validated spatially, and 2) discrete point measurements in heterogenous environments are not representative of satellites observations with spatial resolutions of tens to hundreds of meters (e.g. (Román et al., 2013; Ryan et al., 2017)). Because snow variability is essentially fractal in nature, increasing with increasing resolution, field spectrometer, or instrumentation tower observations, are not well-suited for assessing Landsat directly because the discrete measurements are not measuring the same processes as those being resolved within the 30 m pixels. For example, patterns influenced by wind or local scale snow compaction. The assessment of retrievals presented in this study, therefore, was step-wise with scale by design; first, the discrete field spectrometer measurements (28 cm spot size) were used to assess the UAV-HSI grain size (20 cm pixels), then, the UAV-HSI retrievals were re-sampled to the same spatial scale as Landsat 9 for comparison.
Although our motivation is ultimately better monitoring of mountain snow, this case study started simple, with retrievals over a flat mountain meadow. This is an important baseline because if retrievals are inaccurate in idealized conditions, they will be more so in more complex terrain. Our approach to retrieving grain size, NDGSI, was also relatively simple but as shown here, also accurate for flat, fully snow-covered pixels. The largest differences between the UAV-HSI and Landsat 9 were in pixels with 1) lower percent coverage, and 2) trees. The partial coverage may not have been representative of what Landsat was sampling within those 30 m pixels, but also, trees were masked out of the reference UAV-HSI imagery. Vegetation is relatively reflective in the NIR, and when mixed with snow, could positively bias NDGSI.
Using band ratios has a long legacy in the snow remote sensing community (Riggs et al., 1994; Salomonson and Appel, 2004; Hall and Riggs, 2010; Gascoin et al., 2020) and they are computationally simple, which makes them appealing for global scale retrievals. A band ratio approach is likely suitable for snow cover at high latitudes, where fully snow-covered pixels could be expected at the 30 m scale, or even high alpine snow, when accounting for topographic effects on illumination. This is not the case for midlatitude mountains, though, where over 90% of Landsat pixels can still be mixed (Selkowitz and Forster, 2016). The next logical extension of this work would be assessing spectral mixture analysis using UAV-HSI imagery over snow mixed with other land cover types. Additionally, since snow is rarely clean, incorporating visible bands in the albedo calculation to account for snow darkening by LAPs would be prudent in an operational product.
Conclusion
The first goal in this case study was to demonstrate and validate quantitative retrievals of snow surface properties, snow grain size and albedo, from a compact HSI on a UAV platform. We were able to map grain size and albedo at 20 cm resolution across three flight lines covering the Swamp Angel Study Plot meadow. The grain size retrievals were validated using 20 field spectrometer measurements collected within the flight area, and the broadband albedo was validated using the solar radiation sensors on the study plot instrumentation tower. Relative to reference values the snow properties were accurately mapped, with a mean grain size difference of 2 μm and RMSE of 12 μm, and a mean broadband albedo within 1% of broadband albedo measured near the center of flight area. However, the good comparison to reference measurements required a vicarious calibration, and additional flights will be needed to assess if similar results would be achieved for different snow conditions, and in different environments. An interesting outcome of the study was the relatively high level of small scale (submeter) variability and spatially coherent patterns of grain size and albedo present in the new snow.
The second goal of this paper was to demonstrate an application for UAV-HSI snow property retrievals; using the higher spatial and spectral resolution retrievals to assess coarser grain size and albedo from satellite multispectral imaging. There was a Landsat 9 overpass two days following the UAV-HSI flight, allowing us to assess NDGSI grain size and albedo retrieved from 17 Landsat 9 pixels that overlapped with the UAV-HSI flight area. Ideally, the satellite overpass and UAV-HSI overflight would have been on the same day, but the snow and illumination conditions were similar between collection dates. Although there was less variability in satellite-based grain size values across the comparison area, the Landsat 9 values compared well to the resampled UAV-HSI reference dataset, with a mean grain size difference of 9 μm and the same mean albedo (86%). The high-resolution UAV-HSI dataset was also used to quantify subpixel variability, which was lowest in the open meadow and highest around vegetation, which is useful for interpreting the representativeness of the 30 m pixel values. In the future, additional UAV-HSI flights could be used for quality assessment of Landsat OLI snow retrievals, or even downscaling.
Data availability statement
The datasets, and related code, presented in this study can be found at: https://doi.org/10.6084/m9.figshare.20779072.v4.
Author contributions
MS: Developed research objectives, acquired funding, conducted field work, processed Landsat NDGSI, analyzed results, created visualizations, and co-authored original draft manuscript. CD: Developed research objectives, the workflow to process UAV-HSI and field spectrometer data, performed radiative transfer simulations, analyzed results, created visualizations, and co-authored original draft manuscript. AH: Piloted the UAV and collected and pre-processed HSI data. JJ: Acquired funding for the research project, was responsible for project administration, and reviewed and edited the manuscript.
Funding
Distribution A: Approved for Public Release. Distribution is Unlimited. This research was supported by the Broad Agency Announcement Program and the Cold Regions Research and Engineering Laboratory grant no. W913E518C0005 and W913E521C0006. Additional support came from National Science Foundation award EAR-2012091.
Acknowledgments
We would like to thank the students of the University of Utah Advanced Snow Measurement Techniques graduate seminar for data collection support. We would also like to thank Jonathan Ryan and Alexander Kokhanovsky for reviewing and providing helpful comments that improved the manuscript. We acknowledge the Center for Snow and Avalanche Studies for the management of Senator Beck Basin Study Area.
Conflict of interest
The authors declare that the research was conducted in the absence of any commercial or financial relationships that could be construed as a potential conflict of interest.
Publisher’s note
All claims expressed in this article are solely those of the authors and do not necessarily represent those of their affiliated organizations, or those of the publisher, the editors and the reviewers. Any product that may be evaluated in this article, or claim that may be made by its manufacturer, is not guaranteed or endorsed by the publisher.
Supplementary material
The Supplementary Material for this article can be found online at: https://www.frontiersin.org/articles/10.3389/frsen.2022.1038287/full#supplementary-material
References
Bair, E. H., Rittger, K., Skiles, S. M., and Dozier, J. (2019). An examination of snow albedo estimates from MODIS and their impact on snow water equivalent reconstruction. Water Resour. Res. 55 (9), 7826–7842. doi:10.1029/2019wr024810
Bair, E. H., Stillinger, T., and Dozier, J. (2020). Snow property inversion from remote sensing (SPIReS): A generalized multispectral unmixing approach with examples from MODIS and Landsat 8 OLI. IEEE Transactions on Geoscience and Remote Sensing 59 (9), 7270–7284.
Barnett, T. P., Adam, J. C., and Lettenmaier, D. P. (2005). Potential impacts of a warming climate on water availability in snow-dominated regions. Nature 438, 303–309. doi:10.1038/nature04141
Bohn, N., Painter, T. H., Thompson, D. R., Carmon, N., Susiluoto, J., Turmon, M. J., et al. (2021). Optimal estimation of snow and ice surface parameters from imaging spectroscopy measurements. Remote Sens. Environ. 264, 112613. doi:10.1016/j.rse.2021.112613
Brook, A., and Dor, E. B. (2011). Supervised vicarious calibration (SVC) of hyperspectral remote-sensing data. Remote Sens. Environ. 115 (6), 1543–1555. doi:10.1016/j.rse.2011.02.013
Bruegge, C. J., Arnold, G. T., Czapla-Myers, J., Dominguez, R., Helmlinger, M. C., Thompson, D. R., et al. (2021). Vicarious calibration of eMAS, AirMSPI, and AVIRIS sensors during FIREX-AQ. IEEE Trans. Geoscience Remote Sens. 59 (12), 10286–10297. doi:10.1109/tgrs.2021.3066997
DeWalle, D. R., and Rango, A. (2008). Principles of snow hydrology. Cambridge: Cambridge University Press.
Domine, F., Salvatori, R., Legagneux, L., Salzano, R., Fily, M., and Casacchia, R. (2006). Correlation between the specific surface area and the short wave infrared (SWIR) reflectance of snow. Cold Regions Sci. Technol. 4 (1), 60–68. doi:10.1016/j.coldregions.2006.06.002
Donahue, C., and Hammonds, K. (2022). Laboratory observations of preferential flow paths in snow using upward-looking polarimetric radar and hyperspectral imaging. Remote Sens. 14 (10), 2297. doi:10.3390/rs14102297
Donahue, C., Skiles, S. M., and Hammonds, K. (2021). In situ effective snow grain size mapping using a compact hyperspectral imager. J. Glaciol. 67 (261), 49–57. doi:10.1017/jog.2020.68
Donahue, C., Skiles, S. M., and Hammonds, K. (2022). Mapping liquid water content in snow at the millimeter scale: An intercomparison of mixed-phase optical property models using hyperspectral imaging and in situ measurements. Cryosphere 16 (1), 43–59. doi:10.5194/tc-16-43-2022
Dumont, M., Brissaud, O., Picard, G., Schmitt, B., Gallet, J.-C., and Arnaud, Y. (2010). High-accuracy measurements of snow Bidirectional Reflectance Distribution Function at visible and NIR wavelengths–comparison with modelling results. Atmos. Chem. Phys. 10 (5), 2507–2520. doi:10.5194/acp-10-2507-2010
Durand, M., Molotch, N. P., and Margulis, S. A. (2008). Merging complementary remote sensing datasets in the context of snow water equivalent reconstruction. Remote Sens. Environ. 112 (3), 1212–1225. doi:10.1016/j.rse.2007.08.010
Fair, Z., Flanner, M., Schneider, A., and Skiles, S. M. (2022). Sensitivity of modeled snow grain size retrievals to solar geometry, snow particle asphericity, and snowpack impurities. The Cryosphere 16, 3801–3814. doi:10.5194/tc-16-3801-2022
Flanner, M. G., Arnheim, J. B., Cook, J. M., Dang, C., He, C., Huang, X., et al. (2021). SNICAR-ADv3: A community tool for modeling spectral snow albedo. Geosci. Model Dev. 14 (12), 7673–7704. doi:10.5194/gmd-14-7673-2021
Gardner, A. S., and Sharp, M. J. (2010). A review of snow and ice albedo and the development of a new physically based broadband albedo parameterization. J. Geophys. Res. Earth Surf. 115 (F1), F01009. doi:10.1029/2009jf001444
Gascoin, S., Barrou Dumont, Z., Deschamps-Berger, C., Marti, F., Salgues, G., López-Moreno, J. I., et al. (2020). Estimating fractional snow cover in open terrain from sentinel-2 using the normalized difference snow index. Remote Sens. 12 (18), 2904. doi:10.3390/rs12182904
Gergely, M., Wolfsperger, F., and Schneebeli, M. (2013). Simulation and validation of the InfraSnow: An instrument to measure snow optically equivalent grain size. IEEE Trans. geoscience remote Sens. 52 (7), 4236–4247. doi:10.1109/tgrs.2013.2280502
Grenfell, T. C., and Warren, S. G. (1999). Representation of a nonspherical ice particle by a collection of independent spheres for scattering and absorption of radiation. J. Geophys. Research–Atmospheres 104 (D24), 31697–31709. doi:10.1029/1999jd900496
Hall, D. K., and Riggs, G. A. (2010). Normalized-difference snow index (NDSI). Encyclopedia of snow, ice and glaciers.
Harder, P., Pomeroy, J. W., and Helgason, W. D. (2020). Improving sub-canopy snow depth mapping with unmanned aerial vehicles: Lidar versus structure-from-motion techniques. Cryosphere 14 (6), 1919–1935. doi:10.5194/tc-14-1919-2020
Harder, P., Schirmer, M., Pomeroy, J., and Helgason, W. (2016). Accuracy of snow depth estimation in mountain and prairie environments by an unmanned aerial vehicle. Cryosphere 10 (6), 2559–2571. doi:10.5194/tc-10-2559-2016
Jacobs, J. M., Hunsaker, A. G., Sullivan, F. B., Palace, M., Burakowski, E. A., Herrick, C., et al. (2021). Snow depth mapping with unpiloted aerial system lidar observations: A case study in durham, New Hampshire, United States. Cryosphere 15 (3), 1485–1500. doi:10.5194/tc-15-1485-2021
Kokhanovsky, A. A., and Zege, E. P. (2004). Scattering optics of snow. Appl. Opt. 43 (7), 1589–1602. doi:10.1364/AO.43.001589
Landry, C. C., Buck, K. A., Raleigh, M. S., and Clark, M. P. (2014). Mountain system monitoring at Senator Beck Basin, San Juan Mountains, Colorado: A new integrative data source to develop and evaluate models of snow and hydrologic processes. Water Resources Research 50 (2), 1773–1788.
Levy, C. R., Burakowski, E., and Richardson, A. D. (2018). Novel measurements of fine-scale albedo: Using a commercial quadcopter to measure radiation fluxes. Remote Sens. 10 (8), 1303. doi:10.3390/rs10081303
Libois, Q., Picard, G., France, J., Arnaud, L., Dumont, M., Carmagnola, C., et al. (2013). Influence of grain shape on light penetration in snow. Cryosphere 7 (6), 1803–1818. doi:10.5194/tc-7-1803-2013
Mankin, J. S., Viviroli, D., Singh, D., Hoekstra, A. Y., and Diffenbaugh, N. S. (2015). The potential for snow to supply human water demand in the present and future. Environ. Res. Lett. 10 (11), 114016. doi:10.1088/1748-9326/10/11/114016
Marks, D., and Dozier, J. (1992). Climate and energy exchange at the snow surface in the alpine region of the Sierra Nevada 2. Snow cover energy balance. Water Resour. Res. 28 (11), 3043–3054. doi:10.1029/92wr01483
Milton, E. J., Schaepman, M. E., Anderson, K., Kneubühler, M., and Fox, N. (2009). Progress in field spectroscopy. Remote Sens. Environ. 113, S92–S109. doi:10.1016/j.rse.2007.08.001
Miziński, B., and Niedzielski, T. (2017). Fully-automated estimation of snow depth in near real time with the use of unmanned aerial vehicles without utilizing ground control points. Cold Regions Sci. Technol. 138, 63–72. doi:10.1016/j.coldregions.2017.03.006
Mullen, A., Sproles, E. A., Hendrikx, J., Shaw, J. A., and Gatebe, C. K. (2022). An operational methodology for validating satellite-based snow albedo measurements using a UAV. Front. Remote Sens. 56. doi:10.3389/frsen.2021.767593
Nolin, A. W., and Dozier, J. (2000). A hyperspectral method for remotely sensing the grain size of snow. Remote Sens. Environ. 74 (2), 207–216. doi:10.1016/s0034-4257(00)00111-5
Painter, T. H., Bryant, A., and Skiles, S. M. (2012). Radiative forcing by light absorbing impurities in snow from MODIS surface reflectance data. Geophys. Res. Lett. 39 (17). doi:10.1029/2012GL052457
Painter, T. H., and Dozier, J. (2004). The effect of anisotropic reflectance on imaging spectroscopy of snow properties. Remote Sens. Environ. 89 (4), 409–422. doi:10.1016/j.rse.2003.09.007
Painter, T. H., Rittger, K., McKenzie, C., Slaughter, P., Davis, R. E., and Dozier, J. (2009). Retrieval of subpixel snow covered area, grain size, and albedo from MODIS. Remote Sens. Environ. 113, 868–879. doi:10.1016/j.rse.2009.01.001
Painter, T. H., Seidel, F., Skiles, S. M., Bryant, A., and Rittger, K. (2013). Imaging spectroscopy of albedo and radiative forcing by light absorbing impurities in mountain snow. J. Geophys. Res. Atmos. 118 (17), 9511–9523. doi:10.1002/jgrd.50520
Picard, G., Arnaud, L., Domine, F., and Fily, M. (2009). Determining snow specific surface area from near-infrared reflectance measurements: Numerical study of the influence of grain shape. Cold Regions Sci. Technol. 56 (1), 10–17. doi:10.1016/j.coldregions.2008.10.001
Redpath, T. A., Sirguey, P., and Cullen, N. J. (2018). Repeat mapping of snow depth across an alpine catchment with RPAS photogrammetry. Cryosphere 12 (11), 3477–3497. doi:10.5194/tc-12-3477-2018
Richter, R. (1998). Correction of satellite imagery over mountainous terrain. Appl. Opt. 37 (18), 4004–4015. doi:10.1364/ao.37.004004
Richter, R., Müller, A., and Heiden, U. (2001). “(Vicarious calibration of imaging spectrometers in the reflective region,” in The digital airborne spectrometer experiment (DAISEX)), 111.
Richter, R., and Schläpfer, D. (2002). Geo-atmospheric processing of airborne imaging spectrometry data. Part 2: Atmospheric/topographic correction. Int. J. Remote Sens. 23 (13), 2631–2649. doi:10.1080/01431160110115834
Riggs, G. A., Hall, D. K., and Salomonson, V. V. (1994). “(A snow index for the Landsat thematic mapper and moderate resolution imaging spectroradiometer,” in Proceedings of IGARSS'94-1994 IEEE International Geoscience and Remote Sensing Symposium, 1942-1944 (IEEE).
Rittger, K., Bormann, K. J., Bair, E. H., Dozier, J., and Painter, T. H. (2021). Evaluation of VIIRS and MODIS snow cover fraction in high-mountain Asia using landsat 8 OLI. Front. Remote Sens. 2, 647154. doi:10.3389/frsen.2021.647154
Rittger, K., Painter, T. H., and Dozier, J. (2012). Assessment of methods for mapping snow cover from MODIS. Adv. Water Resour. 51, 367–380. doi:10.1016/j.advwatres.2012.03.002
Román, M. O., Gatebe, C. K., Shuai, Y., Wang, Z., Gao, F., Masek, J. G., et al. (2013). Use of in situ and airborne multiangle data to assess MODIS-and Landsat-based estimates of directional reflectance and albedo. IEEE Trans. Geoscience Remote Sens. 51 (3), 1393–1404. doi:10.1109/tgrs.2013.2243457
Ryan, J., Hubbard, A., Irvine-Fynn, T. D., Doyle, S. H., Cook, J., Stibal, M., et al. (2017). How robust are in situ observations for validating satellite-derived albedo over the dark zone of the Greenland Ice Sheet? Geophys. Res. Lett. 44 (12), 6218–6225. doi:10.1002/2017gl073661
Salomonson, V. V., and Appel, I. (2004). Estimating fractional snow cover from MODIS using the normalized difference snow index. Remote Sens. Environ. 89 (3), 351–360. doi:10.1016/j.rse.2003.10.016
Savitzky, A., and Golay, M. J. (1964). Smoothing and differentiation of data by simplified least squares procedures. Anal. Chem. 36 (8), 1627–1639. doi:10.1021/ac60214a047
Schaepman-Strub, G., Schaepman, M. E., Painter, T. H., Dangel, S., and Martonchik, J. V. (2006). Reflectance quantities in optical remote sensing—definitions and case studies. Remote Sens. Environ. 103 (1), 27–42. doi:10.1016/j.rse.2006.03.002
Secker, J., Staenz, K., Gauthier, R. P., and BudkewitSch, P. (2001). Vicarious calibration of airborne hyperspectral sensors in operational environments. Remote Sens. Environ. 76 (1), 81–92. doi:10.1016/s0034-4257(00)00194-2
Seidel, F. C., Rittger, K., Skiles, S. M., Molotch, N. P., and Painter, T. H. (2016). Case study of spatial and temporal variability of snow cover, grain size, albedo and radiative forcing in the Sierra Nevada and Rocky Mountain snowpack derived from imaging spectroscopy. Cryosphere 10 (3), 1229–1244. doi:10.5194/tc-10-1229-2016
Selkowitz, D. J., and Forster, R. R. (2016). Automated mapping of persistent ice and snow cover across the Western US with Landsat. ISPRS J. Photogrammetry Remote Sens. 117, 126–140. doi:10.1016/j.isprsjprs.2016.04.001
Skiles, S. M., Flanner, M. G., Cook, J., Dumont, M., and Painter, T. H. (2018a). Radiative forcing by light absorbing particles in snow. Nat. Clim. Change 8, 964–971. doi:10.1038/s41558-018-0296-5
Skiles, S. M., Lund, J., and Painter, T. H. (2018b). “Ground validation of airborne snow observatory spectral and broadband snow albedo during Snowex’17,” in IGARSS 2018-2018 IEEE International Geoscience and Remote Sensing Symposium (IEEE)), 6287–6290.
Skiles, S. M., and Painter, T. H. (2017). Daily evolution in dust and black carbon content, snow grain size, and snow albedo during snowmelt, Rocky Mountains, Colorado. J. Glaciol. 63 (237), 118–132. doi:10.1017/jog.2016.125
Sproles, E. A., Mullen, A., Hendrikx, J., Gatebe, C., and Taylor, S. (2020). Autonomous aerial vehicles (AAVs) as a tool for improving the spatial resolution of snow albedo measurements in mountainous regions. Hydrology 7 (3), 41. doi:10.3390/hydrology7030041
Stamnes, K., Tsay, S.-C., Wiscombe, W., and Laszlo, I. (2000). DISORT, a general-purpose fortran program for discrete-ordinate-method radiative transfer in scattering and emitting layered media: Documentation of methodology.
Teillet, P., Fedosejevs, G., Gauthier, R., O'neill, N., Thome, K. J., Biggar, S. F., et al. (2001). A generalized approach to the vicarious calibration of multiple Earth observation sensors using hyperspectral data. Remote Sens. Environ. 77 (3), 304–327. doi:10.1016/s0034-4257(01)00211-5
Warren, S. G., and Brandt, R. E. (2008). Optical constants of ice from the ultraviolet to the microwave: A revised compilation. J. Geophys. Res. 113, D14220. doi:10.1029/2007JD009744
Warren, S. G. (2019). Light-absorbing impurities in snow: A personal and historical account. Front. Earth Sci. 6, 250. doi:10.3389/feart.2018.00250
Warren, S. G. (1982). Optical properties of snow. Rev. Geophys. Space Phys. 20 (1), 67–89. doi:10.1029/rg020i001p00067
Warren, S. G., and Wiscombe, W. J. (1980). A model for the spectral albedo of snow, II, Snow containing atmospheric aerosols. J. Atmos. Sci. 37 (12), 2734–2745. doi:10.1175/1520-0469(1980)037<2734:amftsa>2.0.co;2
Webster, C., and Jonas, T. (2018). Influence of canopy shading and snow coverage on effective albedo in a snow-dominated evergreen needleleaf forest. Remote Sens. Environ. 214, 48–58. doi:10.1016/j.rse.2018.05.023
Keywords: snow grain size, snow albedo, hyperspectral imaging, UAV, Landsat
Citation: Skiles SM, Donahue CP, Hunsaker AG and Jacobs JM (2023) UAV hyperspectral imaging for multiscale assessment of Landsat 9 snow grain size and albedo. Front. Remote Sens. 3:1038287. doi: 10.3389/frsen.2022.1038287
Received: 06 September 2022; Accepted: 19 December 2022;
Published: 12 January 2023.
Edited by:
David Richard Green, University of Aberdeen, United KingdomReviewed by:
Jonathan Ryan, University of Oregon, United StatesAlexander Kokhanovsky, German Research Centre for Geosciences, Germany
Copyright © 2023 Skiles, Donahue, Hunsaker and Jacobs. This is an open-access article distributed under the terms of the Creative Commons Attribution License (CC BY). The use, distribution or reproduction in other forums is permitted, provided the original author(s) and the copyright owner(s) are credited and that the original publication in this journal is cited, in accordance with accepted academic practice. No use, distribution or reproduction is permitted which does not comply with these terms.
*Correspondence: S. McKenzie Skiles, bS5za2lsZXNAdXRhaC5lZHU=; Christopher P. Donahue, Y2hyaXN0b3BoZXIuZG9uYWh1ZUB1bmJjLmNh
†These authors have contributed equally to this work and share first authorship