 Nasir Farid
 Muhammad Farhan Ul Moazzam
 Sajid Rashid Ahmad1
- 1College of Earth and Environmental Sciences, University of the Punjab, Lahore, Pakistan
- 2Department of Civil Engineering, College of Ocean Science, Jeju National University, Jeju, South Korea
- 3Institute of Methodologies for Environmental Analysis, Italian National Research Council, Tito Scalo, Italy
The present study focused on rapid urbanization due to the change in the existing landforms which has caused substantial adverse impacts on Urban Thermal Environment. In the present study, we have acquired the Landsat data (TM and OLI) for the years 1990, 2000, 2010, and 2020 to observe the land use changes (vegetation cover, built up land, barren land, and water) in Lahore using the supervised image classification method. Later, the impact of urbanization has been examined with Land Surface Temperature (LST) and eventually the Surface Urban Heat Island (SUHI) has been calculated. Accuracy of the classified images revealed an overall accuracy (Kappa co-efficient) of 95.3% (0.929%), 92.05% (0.870%), 89.7% (0.891%), and 85.8% (0.915%) for the years 1990, 2000, 2010, and 2020, respectively. It was found that vegetation cover decreased from 60.5% in 1990 to 47.7% in 2020 at the cost of urbanization. The overall built-up land increased by 23.52% from 1990 to 2020. Urbanization has influenced the LST, and it was examined that maximum LST consistently increased with increase in built-up land. The difference between urban and rural buffer reveals that SUHI has also been increasing over the years. SUHI has been raised from 1.72 C in 1990 to 2.41 C in 2020, and about 0.69 C relative change has been observed. It has also been observed that the Normalized Difference Vegetation Index (NDVI) and LST have an inverse relationship. The research outcomes of this study are useful for urban climatologists, urban planners, architects, and policymakers to devise climate resilient policies, structure, and decisions to balance the urban green spaces for a healthy urban environment.
Introduction
Global population is increasing at a rapid pace and people are migrating to urban areas (Mitchell and Moss, 2012), which leads to extensive urbanization (Buhaug and Urdal, 2013). Fifty percent of the world’s population are urban residents, which is expected to increase by 70% (2.5 billion) between 2010 and 2050 with 90% contribution from Asia and Africa (Hosseini et al., 2016), and it is projected that more than 50% of world population will live in Asian cities (Un-Habitat, 2018). Cities serve as a significant source of economic growth and contribute about 60% of global GDP. But, they use more than 60% of energy and humans produce almost 70% of greenhouse gases (GHGs) (Un-Habitat, 2018). Therefore, the process of urbanization is affecting the natural environment, which influences the effects of GHGs, leading to global warming and climate change which is one of the major issues in the current situation (Mathew et al., 2018; Mohammad et al., 2022). Increasing population in cities expands the boundary and exerts pressure on rural areas and replaces natural resources (i.e., agriculture, vegetation, forest). Thus, urbanization is a major reason to alter the changes in Land Use Land Cover (LULC) and also a primary source of predictor to identify the LULC change which imbalances the surface energy and takes a way to higher surface temperature (Matthews et al., 2015). In the past few decades, urban green spaces significantly reduced in the world regardless of its significance to balance the LST in the urban environment (Choudhury et al., 2019). The loss of vegetation at the cost of urbanization causes extensive changes in UTE (Xiong et al., 2012), which increases the LST in urban buffer as compared to rural buffer, leading to SUHI phenomena (Mathew et al., 2018) and bring different environmental issues, that is, land degradation, ecosystem problem, heat waves, urban flash floods, increasing precipitation, and temperature in urban buffers (Santamouris, 2014; Fu and Weng, 2018; Mohammad and Goswami, 2019; Estoque et al., 2017; Malik et al., 2020; Moazzam et al., 2018). Roughness and surface reflectance properties of different LULC vary from each other and contribute differently to LST because of the uniqueness in the absorption and radiation energy of LULC classes (Bokaie et al., 2016; Solaimani et al., 2010). Increase in urbanization at the cost of vegetation loss has been experienced by many regions around the globe (Dilawar et al., 2021; Mumtaz et al., 2020; Singh et al., 2017; Solaimani et al., 2010; Srivanit et al., 2012; Chakraborty and Lee, 2019).
Urban climatology was first studied and observed by Luke Howard in 1833 (Howard, 1833). The phenomena of UHI or SUHI indicate the positive difference between temperature of rural and urban land due to the results of urbanization (Souch and Grimmond, 2006; Manoli et al., 2019). Usually, it is calculated with the difference of air temperature of urban met-station to air temperature of rural met-station, although due to scarcity of meteorological stations in developing countries, it is very challenging to accurately estimate the UHI. Therefore, advancements in remote sensing (RS) technology have overcome this problem, allowing us to calculate the SUHI with surface temperature difference between urban buffer and rural buffer (Rao, 1972). Now, researchers are carrying out research to quantify the impact of urbanization on LST and effects of UHI on UTE at the regional and global scale (Chakraborty and Lee, 2019; Mathew et al., 2018; Mumtaz et al., 2020; Hassan et al., 2021; Fu and Weng, 2018; Peng et al., 2012; Cui et al., 2021; Waleed and Sajjad, 2022). Chakraborty and Lee (2019) studied the effects of UHI at the global scale by developing a simplified urban extent (SUE) algorithm using the MODIS dataset. The author revealed the UHI intensity of 0.85 and 0.55°C for day and nighttime, respectively, worldwide. The same author also found a strong influence of vegetation cover over SUHI. Peng et al. (2012) have calculated the UHI for 419 big cities globally and found that daytime SUHI is higher than nighttime; however, no such correlation has been found between both time scales. Recently Waleed and Sajjad, (2022) conducted a study for the province of Pakistan to compute the impact of urbanization on LST. They noticed 8.5% of annual increase in the built-up area from 1990 to 2020, which led to 1.4 C rise in annual maximum LST. Mathew et al. (2018) conducted a study on SUHI for two Indian mega cities using the MODIS dataset and found that both cities have a strong influence on SUHI at nighttime as compared to daytime. Mumtaz et al. (2020) performed a study on two mega cities of Pakistan (Peshawar and Lahore) for the present using Landsat data from 1998 to 2018. The author found that in Peshawar, both vegetation cover and built-up land increased; however, in Lahore, only built-up land increased while vegetation cover decreased. Therefore, a consistent decrease and increase in temperature have been found for Peshawar and Lahore, respectively. Dilawar et al. (2021) studied six major cities of the Punjab province of Pakistan to evaluate the impact of urbanization on SUHI. The results reflected a consistent decrease in vegetation at the cost of urbanization in all cities which influenced the higher SUHI over the time. Hassan et al. (2021) studied the major cities of South Asian countries. The author found that vegetation cover is decreasing at the cost of rapid urbanization in the mega centers of South Asian countries. The author noticed 1–2°C temperature difference between urban and rural buffers.
Advancement in remote sensing (RS) with multitemporal, multispectral, and real-time data helps extract useful information to understand and monitor the process and pattern of different land cover types (Raza et al., 2012). RS technology offers the opportunity to observe the LULC changes and study the influence of urbanization on LST with high, moderate, and low spatial and temporal resolution satellite images. In this study, we have utilized the moderate spatial and temporal resolution satellite (Landsat) which was first launched 50 years ago to provide free-of-cost data to study various applications, that is, land monitoring. The long available dataset can offer a better insight of the past and present and predict future changes on land. To evaluate the LULC change using satellite data, there are various models, that is, supervised and unsupervised image classification, machine learning algorithms, object-based image classification algorithm (OBIA), and many more. In this study, we have used the supervised image classification method assisted with the maximum likelihood classifier algorithm which has been successfully used in many studies before in Lahore/Pakistan (Imran and Mehmood, 2020), Ahmedabad and Jaipur/India (Mathew et al., 2018), Guangzhou/China (Xiong et al., 2012), Bangkok/Thailand (Srivanit et al., 2012), and Alborz/Iran (Solaimani et al., 2010). All aforementioned studies prove the usefulness of the research related to LULC changes with reference to regional climate change in terms of UTE, LST, and SUHI. In the last few years, urban area in Lahore expanded exceptionally and many housing societies were formed which has resulted in a loss of vegetation cover substantially; ultimately, it has changed the urban environment (Nespak, 2004; Shah and Ghauri, 2015), and this brings lots of health issues for the local residents, that is, discomfort, difficulties in respiration, and heat stroke (Kotharkar et al., 2018; Zuhra et al., 2019). As mentioned above that Asian cities will have 50% of world population; therefore, it is necessary to study the impact of rapid urbanization on LST and SUHI and assess how cities are performing to influence the climate change, and it is also necessary to highlight the significance of sustainable cities and communities and contribute to UN sustainable development goals. The purpose of this study is to 1) evaluate the LULC change for the years 1990, 2000, 2010, and 2020; 2) examine the impact of urbanization on LST; and 3) analyze the surface urban heat island intensity (SUHI).
Materials and Methods
Study Area
Lahore is one of the megacities of Pakistan located in the province of Punjab. Geographically, the city lies between 74°16′40″E longitude and 31°25′52″ N latitude (Figure 1). Lahore is the capital city of Punjab. Lahore is located at the ledge of Ravi river (Figure 1), covering a total area of 1800 km2 (Gull and Gul, 2017) with a population of 11.13 million (PBS, 2017). Lahore held the 56th position in 1975 in the world, but in 2007, it jumped to 38th, while it is expected that by 2025, the city will take the 24th position. Therefore, due to rapid urbanization, the city is left with only 3% of green spaces and according to the world standard, it is less than the minimum range (25–30%) (PBS, 2017). Inconsistent government policies and poor land use planning have caused immense land use change (Shirazi and Kazmi, 2016). Mean annual rainfall of Lahore is approximately 600 mm with the highest amount of rainfall occurring in monsoon while 24 C is the average annual temperature (Qureshi et al., 2012). The winter season extends from November to March with coldest months of December and January, while the hottest months are May and June during the summer season (April–September) (Fahad et al., 2021; Qureshi et al., 2012). Lahore canal and part of river Ravi flow through the city which makes the land fertile for various kinds of crops (Riaz et al., 2014).
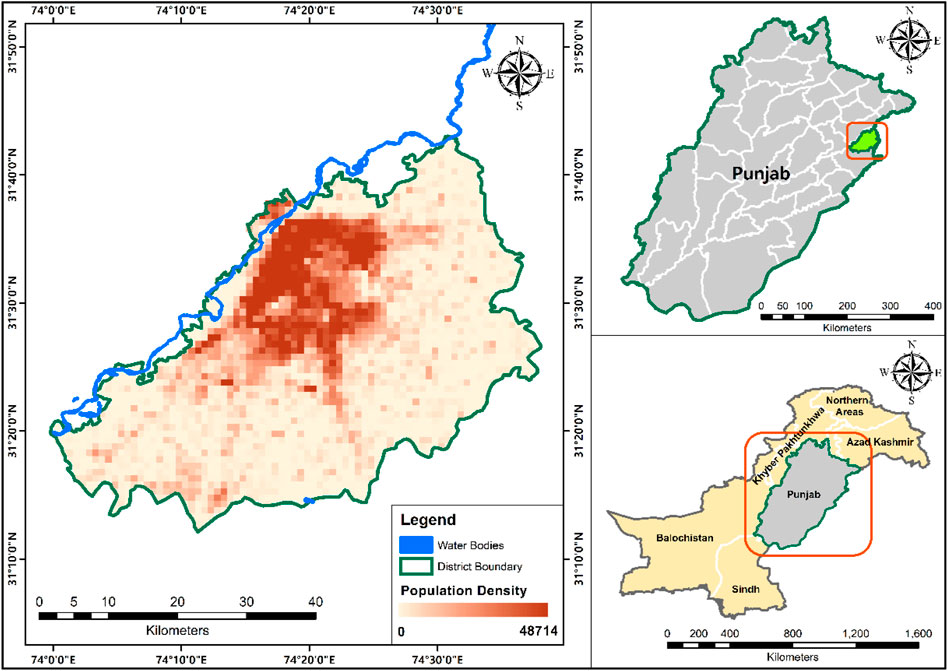
FIGURE 1. Location map of the study area.
Data Acquisition and Processing
We have investigated the land use land cover (LULC) and land surface temperature (LST) of Lahore and acquired four Landsat satellite images for the years 1990, 2000, 2010 (Landsat 5, Thematic Mapper), and 2020 (Landsat 8 Operational Land Imager). The Landsat images of Lahore with path/rows of 149/38 were downloaded from United States of Geological Survey-Center for Earth Resources Observation and Science (USGS-EROS) (https://earthexplorer.usgs.gov/), with less than 10% cloud cover for the month of March (Table 1) because usually winter season (fog) and summer season (heavy clouds due to monsoon) are a big hindrance to accurately classify the images. We have used almost cloud-free images in this study, and details of the images are given below in Table 1. Landsat data are freely and easily available to classify the LULC and calculate LST and SUHI (Tariq and Shu, 2020). The Landsat satellite image has 30 m spatial resolution and completes the revolution of the earth in 16 days on average. Before using the Landsat satellite images for LULC classification, the images underwent radiometric, atmospheric, and topographic correction in the semi-automatic classification (SCA) plugin tool in QGIS software to avoid the erroneous classification of the land. Later, the Landsat bands were stacked together with necessary band combination, that is, red, green blue, near infrared, and short-wave infrared. The thermal band was used for the estimation of LST and SUHI. The administrative boundary of Lahore was obtained from Nature Earth website.
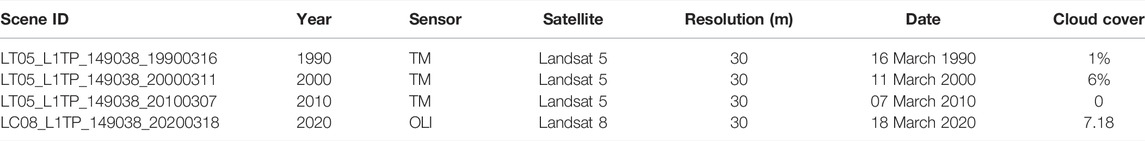
TABLE 1. Detail of satellite images.
Supervised Image Classification and Accuracy Assessment
LULC information can be obtained from multiband satellite images using image classification techniques (Alam et al., 2020). There are various methods to classify the image, that is, machine learning, object-based image classification algorithm (OBIA), and supervised and unsupervised classification. In this study, we have used the supervised classification method with the maximum likelihood classifier algorithm which require training sites from the user (Zubair Iqbal and Iqbal, 2018). Thus, we have trained the classifier with enclosed polygon training sites to capture the spectral signature for each LULC class. Using training sites, the maximum likelihood classifier algorithm was run to classify the image into four different classes: built up land, water, barren land, and vegetation cover. LULC maps were obtained for the years 1990, 2000, 2010, and 2020 from Landsat 5 TM and Landsat 8 OLI using the maximum likelihood classifier algorithm. The advantageous property of maximum likelihood classifier is parameter interpretation based on prior knowledge of the expert. This method is very easy to use and implement (Cheng et al.).
Accuracy of the LULC classification is one of the significant parts which can be determined by user and producer accuracy, overall accuracy, and kappa co-efficient in confusion matrix (Congalton, 1991; Van Oort, 2007). If the errors are uninvestigated, the LULC map will lose its reliability for decision making (Shao and Wu, 2008). Producer and user accuracy are the number of accurately classified pixels over the total number of pixels in a particular class, while the number of correctly classified pixels divided by the total number of reference pixels is known as overall accuracy. A total of 200 random points were taken using a random point tool in ArcGIS, with 50 points in each class to assess classified images with high-resolution Google Earth image.
Land Surface Temperature Calculation
LST has been calculated from the thermal band of Landsat 5 TM (1990, 2000, and 2010) and Landsat 8 OLI (2020). Landsat 8 has two thermal bands (band 10 and 11), while Landsat 5 has only one thermal band (band 6), though we have used band 6 and band 10 of Landsat 5 and 8, respectively, in this study. Band 11 of Landsat 8 was avoided due to the substantial calibration issues identified by USGS (Avdan and Jovanovska, 2016). The month of March is a good fit to calculate the LST of the study area as we have observed very less intervention of clouds and fog.
Digital Number to Spectral Radiance (Lλ)
Landsat 5 and 8 thermal bands are in the form of digital numbers (DNs); therefore, we have converted the digital number (DN) of the thermal band to spectral radiance (Lλ) using Eq. 1 and Eq. 2. The spectral radiance is expressed in watts/(m2 × ster × µm).
where Lλ is spectral radiance, LMAXλ is maximum radiance (15.60), LMINλ is minimum radiance (1.23), QCALMAX is quantized maximum (255), QCALMIN is quantized minimum (1), and QCAL is thermal band 6 of Landsat 5 TM. All these values can be obtained from the metadata file of the satellite image. The Rozenstein et al. (2014) method has been followed in this study to convert the DN value to Lλ for Landsat 8 thermal band using Eq. 2 below.
Multiplicative rescaling (ML = 0.0003342), digital number (QCAL = band 10), and additive rescaling band 10 (AL = 0.1).
Spectral Radiance Conversion to Satellite Brightness Temperature
We have followed Eq. 3 for the conversion of the spectral radiance to satellite brightness temperature.
T is the satellite brightness temperature in degree Celsius (oC), and the value of Lλ has been obtained in the previous step. K1 and K2 are the constant values that depend on the type of sensor. K1 and K2 values for Landsat 5 TM are 607.76 and 1,260.56, respectively, while for Landsat 8, the values are 774.89 and 1,321.08, respectively (Ihlen, 2019).
Surface Urban Heat Island
The influence of surface UHI has been calculated using the SUE algorithm recently developed and tested by Chakraborty and Lee (2019) at a global scale. We have followed the same methodology explained by Chakraborty and Lee (2019) also shown in Figure 2. The LULC data were split into two subsets urban buffer and other LULC classes except water class because it contains high capacity of heat; consequently, it can over and underestimate the SUHI at day and nighttime (Chakraborty and Lee, 2019). LST calculated for both urban and rural buffer to eventually calculate the SUHI (Figure 2).
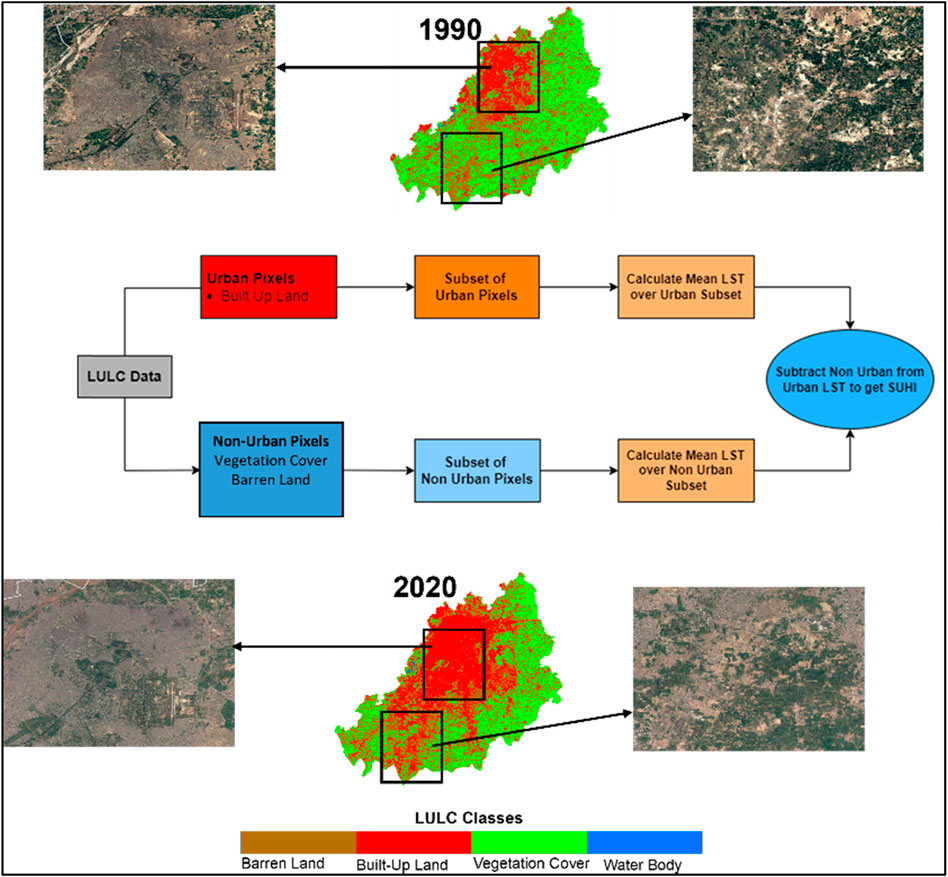
FIGURE 2. Steps followed using Chakraborty and Lee (2019) methodology for calculation of SUHI.
Normalized Difference Vegetation Index
The NDVI index is used to calculate the photosynthetic activity using red (R) and near infrared (NIR) bands conditioned by the presence of chlorophyll. The NDVI value ranges between -1 and +1. As the vegetation increases, the NDVI values also increase positively (Spisni et al., 2012; Spadoni et al., 2020). Band 4 (5) and Band 3 (4) of Landsat 5 (8) used for NIR and R, respectively.
Statistical Analysis of LST and NDVI
We have taken 5,000 random points to calculate the relationship between LST and NDVI. The random points were generated using the random points tool in ArcGIS. We have used the multi values to point tool in ArcGIS to extract the values from the layers of LST and NDVI for the years 1990, 2000, 2010, and 2020. Consequently, we have plotted NDVI values against LST using scatterplot.
Results
Accuracy Assessment of Classified Images
The remote sensing classified image error depends on various factors, including expertise of the person (Shao and Wu, 2008). Therefore, it was necessary to investigate the accuracy of classified images. Commission error of less than 15% is acceptable (Foody, 2002), while kappa co-efficient should not be less than 0.85% for environmental observation studies (Cleve et al., 2008). The details of the accuracies achieved in this study can be seen in Table 2. The overall classification accuracies of the classified satellite images for the years 1990, 2000, 2010, and 2020 are 95.3%, 92.05% 89.7%, and 85.8%, respectively. In addition, Kappa statistics for the classified map for the years 1990, 2000, 2010, and 2020 are 0.929, 0.870, 0.891, and 0.915, respectively.
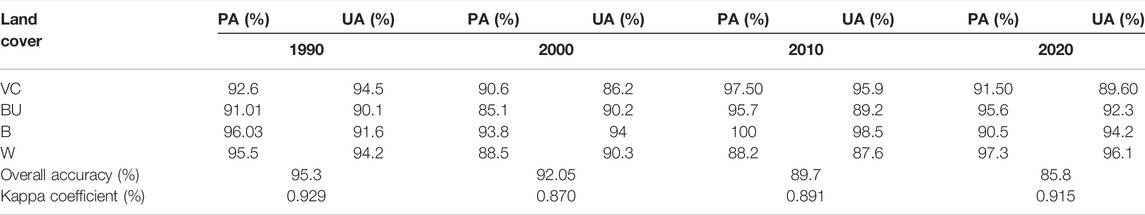
TABLE 2. Summary of classification accuracy.
Spatial Distribution of LULC
Landsat images were classified into four classes including vegetation cover (VC), built up land (BL), barren land (B), and water body (W) for Lahore. The spatial distribution of LULC classes in Lahore is illustrated in Figure 3 below and other details, that is, area, percentage of each LULC coverage, and relative change from 1990 to 2020 can be seen in Table 3. It was observed that built-up land is extensively increased in the study period. Built-up land has 22.9% portion in 1990, and it was increased to 33.2% in 2000, 34.2% in 2010, and 46.4% in 2020. The highest relative change from 1990 to 2020 has been found for built-up land (23.52%) at the cost of 12.82% loss in vegetation cover and 10.26% barren land (Table 3). Fahad et al. (2021) and Imran and Mehmood (2020) (Imran and Mehmood, 2020) have also found that urbanization has shrunk the barren land and vegetation cover which is also observed in this study. Shirazi and Kazmi (2016) (Shirazi and Kazmi, 2016) have also observed the replacement of vegetation cover with urban development. On average, built-up land has gained 0.78% land/year in the studied period from the total area (Fahad et al., 2021). The highest changes have been observed during 1990–2000 and 2010-2020 for vegetation cover, barren land, and built-up land (Table 3; Figure 4).
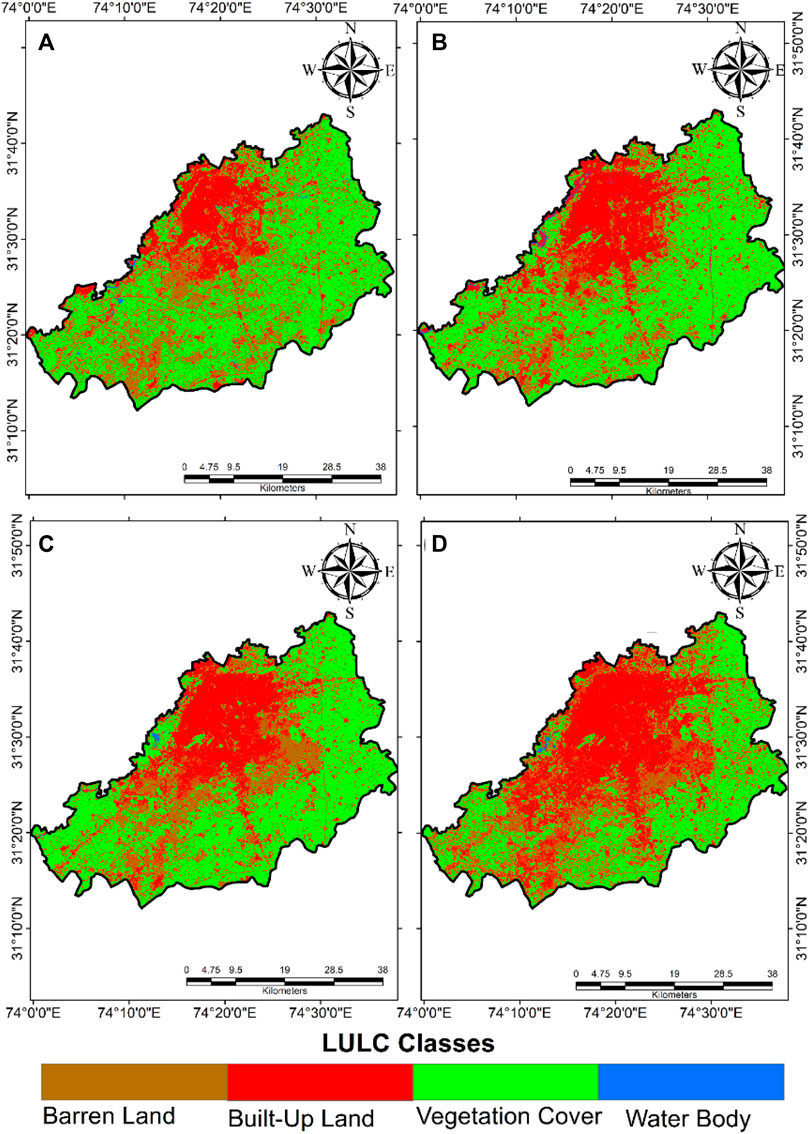
FIGURE 3. Spatial distribution of LULC of Lahore for the years (A) 1990, (B) 2000, (C) 2010, and (D) 2020
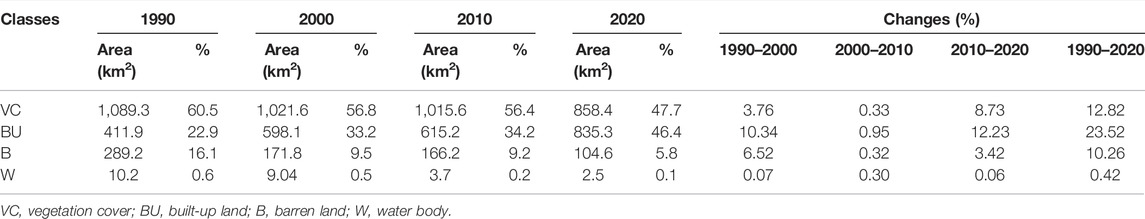
TABLE 3. Statistics of LULC of Lahore for the years 1990, 2000, 2010, and 2020.
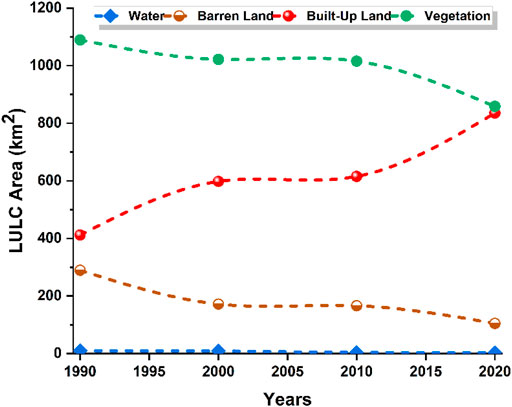
FIGURE 4. Graphical presentation of LULC change.
Land Surface Temperature Variations From 1990 to 2020
The land surface temperature (LST) pattern of Lahore was calculated for the month of March from 1990 to 2020. The results of LST are presented in Figure 5 below. The results revealed that maximum temperature constantly increased, although there was only 3.2 C change from 1990 to 2020. Figure 5 also shows indicating that in 1990 the highest surface temperature was in the central part of Lahore, but in 2010 and 2020, the maximum LST was spatially spread to the south part of the city as well.
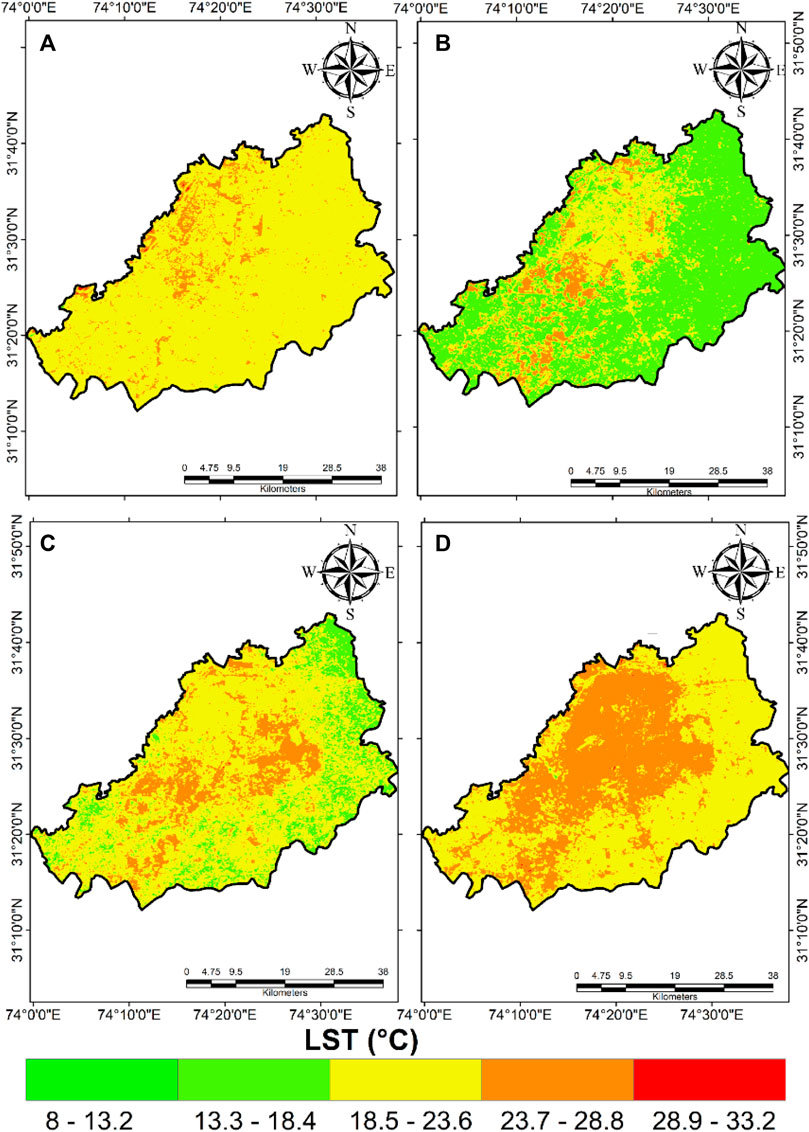
FIGURE 5. Land surface temperature for the years (A) 1990, (B) 2000, (C) 2010, and (D) 2020.
The LST and built-up area increased parallel to each other from 1990 to 2020 (Figure 3 and Figure 5). Due to the urbanization process, the impervious surface absorbs the heat rapidly but the emission process is very slow which is the reason of high surface temperature apparent in this study (Javid et al., 2021). Built-up land contribute majorly in rise of LST (Bokaie et al., 2016) since it is observed that in 1990 when built-up land has 22.9% of total area, the mean LST of Lahore was 21.42 ± 1.36°C which is increased to 22.1 ± 1.9°C (2000), 22.7 ± 2.1°C (2010), and 23.05 ± 1.6°C (2020) when urban area increased to 33.2%, 34.2%, and 46.4% in 2000, 2010, and 2020, respectively. These results confirm the direct relationship of urban land and LST (Ullah et al., 2019) which is in line with a study conducted by Xiong et al. (2012). The environmental protection agency has also reported that surroundings of the city center will have 1–3°C less temperature to urban land due to high absorption of solar radiation by impervious surfaces (Mathew et al., 2018).
Consistent rise in LST with urban area leads to higher surface temperature than other LULC classes which exhibit the impact of urban heat island (UHI). A consistent increase has been observed for surface UHI intensity. Changes in LST with constant changes in thermal environment imply the impact of UHI (Srivanit et al., 2012) which has been observed in this study. SUHI has been calculated for Lahore using the LST difference of urban and rural pixels as presented in Table 4. An increasing trend of SUHI has been observed in Lahore. The urban temperature in 1990 was 1.72 C high as compared to the rural area which increased to 1.91°C, 2.22°C, and 2.41°C in 2000, 2010, and 2020, respectively (Table 4). Urbanization is considered a main source of increase in LST which ultimately causes SUHI (Hassan et al., 2021). Therefore, it is necessary to increase the plantation and green space in urban environment because it can significantly decrease the temperature and impact of SUHI.
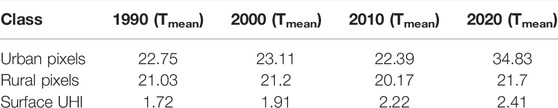
TABLE 4. Surface urban heat island intensity of Lahore.
Relationship Between NDVI and LST
NDVI and LST have an inverse relationship, that is, as the vegetation increases the temperature decreases and vice versa. The correlation trend line is also indicating the strong inverse relationship between two variables (Figure 6). The correlation co-efficient (R2) values are shown in Figure 6 below for the years 1990, 2000, 2010, and 2020. The relationship of NDVI and LST represents the impact of non-vegetated surfaces (barren land; built up land) on LST. As the value of NDVI increases, the LST starts decreasing which is also found by Srivanit et al. (2012).
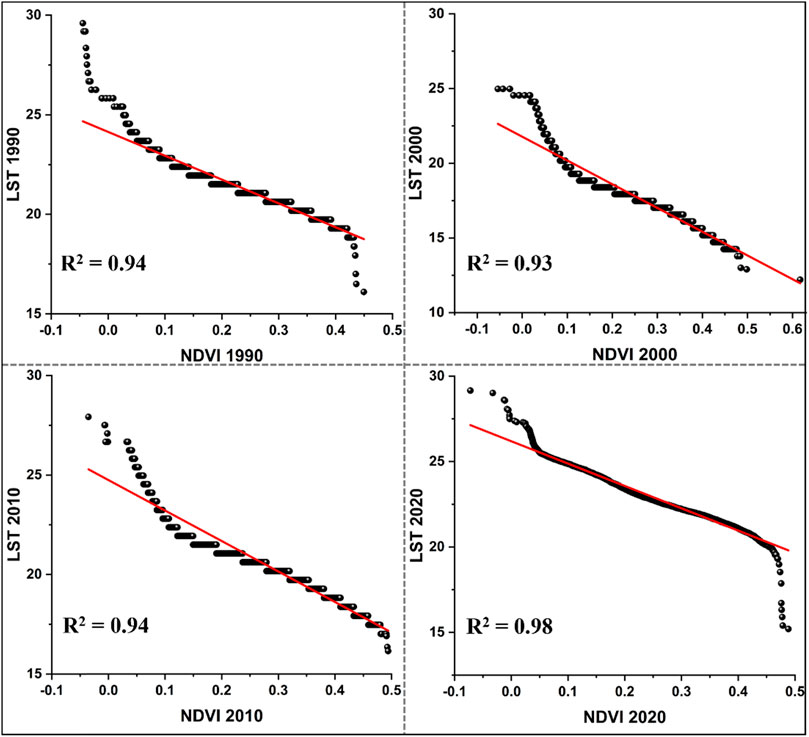
FIGURE 6. Correlation between LST and NDVI for the years 1990, 2000, 2010, and 2020.
Discussion
This study was carried out to observe the LULC changes in Lahore from 1990–2020 using the supervised classification method assisted with the maximum likelihood classifier algorithm which provided an acceptable level of accuracy. Figure 3 presents the pattern of LULC for Lahore for the years 1990, 2000, 2010, and 2020, which indicate the area covered by built-up land, vegetation cover, water body, and barren land. Except for built-up land, other land cover classes decrease from 1990 to 2020, which led to the effect of surface UHI. An overall negative change has been observed for vegetation cover, water body, and barren land with 12.82%, 0.42%, and 10.26%, respectively, while built-up land has gained 23.52% area at the cost of vegetation cover and barren land from 1990 to 2020, leading to rise in LST and trend in surface UHI, which can clearly shows its cause and impact. Transformation of vegetation cover and barren land was due to illegal development, housing schemes, and commercial buildings by local developers and Lahore development authority (LDA) (Metro bus; orange train) (Nespak, 2004; Shah and Ghauri, 2015; Fahad et al., 2021). It also indicates the conversion of rural areas into urban area for new development and infrastructure.
Land use land cover changes have a significant impact on land surface temperature (Goksel et al., 2006) due to diverse reflectance properties of LULC (Nasar-u-Minallah, 2019). It can be observed from LST results (Figure 5) that in the last 30 years, the maximum LST continuously increased, while minimum LST had some variations. The rise in LST is also observed in previous studies conducted in Lahore and other parts of South Asia (Javid et al., 2021; Imran and Mehmood, 2020; Hassan et al., 2021; Dilawar et al., 2021), which may be because of the anthropogenic materials, that is, high-rise buildings, asphalt, and concrete for urban expansion (Bokaie et al., 2016; Xiong et al., 2012). From Figure 3 and Figure 4, we can observe that built up land increased significantly from 1990 to 2020 by the loss of vegetation cover and barren land. Transition of LULC classes from barren land, water body, and vegetation cover to built-up land can influence LST (Mumtaz et al., 2020) because roughness and surface reflectance properties depend on LULC classes (Solaimani et al., 2010; Bokaie et al., 2016). The results from Figure 3 and Figure 5 indicate that built-up land and LST increased in parallel which shows the direct relationship between them (Bokaie et al., 2016). Hassan et al. (2021) have also observed the increasing trend of LST and revealed that urban expansion has caused the rise in LST. The difference between urban and rural buffer indicates the influence of Surface UHI (Simwanda et al., 2019). Surface UHI has also been calculated with the difference between mean LST of built-up land and mean LST of the rural area. The impact of SUHI has been observed in this study due to rapid urbanization which is observed previously in other studies (Dilawar et al., 2021; Hassan et al., 2021; Chakraborty and Lee, 2019; Mathew et al., 2018; Imran and Mehmood, 2020; Javid et al., 2021; Mumtaz et al., 2020). Table 4 indicates that in 1990, the difference between urban area and rural area LST was 1.72°C which later in 2000 increased to 1.91°C, 2.22°C in 2010, and 2.41°C in 2020. Overall, 0.69°C surface UHI change has been observed in this study which is similar to a study conducted by Dilawar et al. (2021). Surface UHI can be found in mega cities because high-rise building and dense infrastructure can trap the heat, leading to rise in surface UHI which can ultimately cause adverse impact on the health of localities (Fu and Weng, 2018). The high surface UHI can cause poor ecological conditions; therefore, we have to reduce the impact of surface UHI by having more vegetation cover which can divert the solar radiation (Ng et al., 2012) using green rooftops to mitigate the effect of UHI which can reduce the temperature by 0.3–3°C (Santamouris, 2014) to achieve sustainable development in the urban areas. In this study, we have evaluated the relationship between NDVI and LST because vegetation cover plays a significant role in balance and sustainable urban development (Weng and Lo, 2001). The correlation co-efficient of NDVI and LST revealed an inverse relationship between them: when the vegetation cover decreases the LST increases, and the similar inverse relationship has been found by Mumtaz et al. (2020) and Hassan et al. (2021). From this research, we can understand that LULC changes help identify the changes in urban climate. Urbanization is a major source to alter the urban climate, but there are other factors, that is, wind direction, wind speed, population, city size, and landscape pattern that need to be incorporated to analyze the SUHI in more depth.
Conclusion
Land use land cover change (LULC) analysis has been performed for Lahore using the supervised image classification method with the maximum likelihood classifier algorithm. Landsat 5 and 8 data have been acquired for the years 1990, 2000, 2010 (Landsat 5), and 2020 (Landsat 8) to examine the changes formed by rapid urbanization. The Landsat thermal band was used to calculate the land surface temperature (LST) to examine the impact of urbanization, and consequently surface urban heat island (SUHI) has been computed using urban LST and rural LST. It was observed that built-up land increased from 22.9% in 1990 to 46.4% in 2020. In addition, vegetation cover had a decrease in its area from 60.5% (1990) to 47.7% (2020) which has caused a consistent increase in LST from 30.06°C in 1990 to 33.24 C in 2020. The difference between urban and rural buffer was 1.72°C in 1990 which increased to 1.91°C in 2000, 2.22°C in 2010, and 2.41 C in 2020. Overall, 0.69°C SUHI change has been observed from 1990 to 2020. NDVI and LST have been evaluated with each other, and it was examined that LST and NDVI have an inverse relationship. Therefore, green rooftops, balanced urban green spaces, and replacing low albedo with high-albedo surface materials can have a significant positive influence on urban thermal environment.
Data Availability Statement
The raw data supporting the conclusions of this article will be made available by the authors, without undue reservation.
Author Contributions
Conceptualization, formal analysis, software, and validation, NF and MFM; methodology, visualization, writing—original draft, NF and MFM; Supervision, writing—review and editing, ML, RC, and SRA; Funding Acquisition, ML and RC.
Conflict of Interest
The authors declare that the research was conducted in the absence of any commercial or financial relationships that could be construed as a potential conflict of interest.
Publisher’s Note
All claims expressed in this article are solely those of the authors and do not necessarily represent those of their affiliated organizations, or those of the publisher, the editors, and the reviewers. Any product that may be evaluated in this article, or claim that may be made by its manufacturer, is not guaranteed or endorsed by the publisher.
Acknowledgments
United States of Geological Survey (USGS) has been greatly acknowledged for providing the free Landsat imageries to conduct this study.
References
Alam, A., Bhat, M. S., and Maheen, M. (2020). Using Landsat Satellite Data for Assessing the Land Use and Land Cover Change in Kashmir Valley. GeoJournal 85, 1529–1543. doi:10.1007/s10708-019-10037-x
Avdan, U., and Jovanovska, G. (20162016). Algorithm for Automated Mapping of Land Surface Temperature Using LANDSAT 8 Satellite Data. J. Sensors, 1480307. doi:10.1155/2016/1480307
Bokaie, M., Zarkesh, M. K., Arasteh, P. D., and Hosseini, A. (2016). Assessment of Urban Heat Island Based on the Relationship between Land Surface Temperature and Land Use/Land Cover in Tehran. Sustain. Cities Soc. 23, 94–104. doi:10.1016/j.scs.2016.03.009
Buhaug, H., and Urdal, H. (2013). An Urbanization Bomb? Population Growth and Social Disorder in Cities. Glob. Environ. Change 23, 1–10. doi:10.1016/j.gloenvcha.2012.10.016
Chakraborty, T., and Lee, X. (2019). A Simplified Urban-Extent Algorithm to Characterize Surface Urban Heat Islands on a Global Scale and Examine Vegetation Control on Their Spatiotemporal Variability. Int. J. Appl. Earth Observation Geoinformation 74, 269–280. doi:10.1016/j.jag.2018.09.015
Cheng, L. Y., Meng, X. Y., and Da, X. M. (2018). Simulation of Efficient Classification for Image Characteristics of Fruit in Fruit Pest. Comput. Simul. 35 (02), 425–428.
Choudhury, D., Das, K., and Das, A. (2019). Assessment of Land Use Land Cover Changes and its Impact on Variations of Land Surface Temperature in Asansol-Durgapur Development Region. Egypt. J. Remote Sens. Space Sci. 22, 203–218. doi:10.1016/j.ejrs.2018.05.004
Cleve, C., Kelly, M., Kearns, F. R., and Moritz, M. (2008). Classification of the Wildland-Urban Interface: A Comparison of Pixel- and Object-Based Classifications Using High-Resolution Aerial Photography. Comput. Environ. Urban Syst. 32, 317–326. doi:10.1016/j.compenvurbsys.2007.10.001
Congalton, R. G. (1991). A Review of Assessing the Accuracy of Classifications of Remotely Sensed Data. Remote Sens. Environ. 37, 35–46. doi:10.1016/0034-4257(91)90048-b
Cui, F., Hamdi, R., Yuan, X., He, H., Yang, T., Kuang, W., et al. (2021). Quantifying the Response of Surface Urban Heat Island to Urban Greening in Global North Megacities. Sci. Total Environ. 801, 149553. doi:10.1016/j.scitotenv.2021.149553
Dilawar, A., Chen, B., Trisurat, Y., Tuankrua, V., Arshad, A., Hussain, Y., et al. (2021). Spatiotemporal Shifts in Thermal Climate in Responses to Urban Cover Changes: A-Case Analysis of Major Cities in Punjab, Pakistan. Geomatics, Nat. Hazards Risk 12, 763–793. doi:10.1080/19475705.2021.1890235
Estoque, R. C., Murayama, Y., and Myint, S. W. (2017). Effects of Landscape Composition and Pattern on Land Surface Temperature: An Urban Heat Island Study in the Megacities of Southeast Asia. Sci. Total Environ. 577, 349–359. doi:10.1016/j.scitotenv.2016.10.195
Fahad, S., Li, W., Lashari, A. H., Islam, A., Khattak, L. H., and Rasool, U. (2021). Evaluation of Land Use and Land Cover Spatio-Temporal Change during Rapid Urban Sprawl from Lahore, Pakistan. Urban Clim. 39, 100931. doi:10.1016/j.uclim.2021.100931
Foody, G. M. (2002). Status of Land Cover Classification Accuracy Assessment. Remote Sens. Environ. 80, 185–201. doi:10.1016/s0034-4257(01)00295-4
Fu, P., and Weng, Q. (2018). Variability in Annual Temperature Cycle in the Urban Areas of the United States as Revealed by MODIS Imagery. ISPRS J. Photogrammetry Remote Sens. 146, 65–73. doi:10.1016/j.isprsjprs.2018.09.003
Goksel, Ç., Musaoglu, N., Gurel, M., Ulugtekin, N., Tanik, A., and Seker, D. (2006). Determination of Land-Use Change in an Urbanized District of Istanbul via Remote Sensing Analysis. Fresenius Environ. Bull. 15, 798–805.
Gull, R., and Gul, R. (2017). In the Surge of Healing-The Case of Indus Basin. Malmo, Sweden: Malmö högskola/Kultur och samhälle.
Hassan, T., Zhang, J., Prodhan, F. A., Pangali Sharma, T. P., and Bashir, B. (2021). Surface Urban Heat Islands Dynamics in Response to LULC and Vegetation across South Asia (2000-2019). Remote Sens. 13, 3177. doi:10.3390/rs13163177
Hosseini, A., Pourahmad, A., and Pajoohan, M. (2016). Assessment of Institutions in Sustainable Urban-Management Effects on Sustainable Development of Tehran: Learning from a Developing Country. J. Urban Plann. Dev. 142, 05015009. doi:10.1061/(asce)up.1943-5444.0000301
Howard, L. (1833). in The Climate of London: Deduced from Meteorological Observations Made in the Metropolis and at Various Places Around it. Editors H. J. Darton, A. Arch, Longman, S. Hatchard, R. H. Highleyet al.
Imran, M., and Mehmood, A. (2020). Analysis and Mapping of Present and Future Drivers of Local Urban Climate Using Remote Sensing: a Case of Lahore, Pakistan. Arabian J. Geosciences 13, 1–14. doi:10.1007/s12517-020-5214-2
Javid, K., Nawaz Akram, M. A., Pervaiz, S., Siddiqui, R., and Mazhar, N. (2021). Index-based Approach in Relation to Built-Up and LST Dynamics; A Study of Lahore, Pakistan. Int. J. Econ. Environ. Geol. 12, 32–40. doi:10.46660/ijeeg.vol12.iss1.2021.559
Kotharkar, R., Ramesh, A., and Bagade, A. (2018). Urban Heat Island Studies in South Asia: A Critical Review. Urban Clim. 24, 1011–1026. doi:10.1016/j.uclim.2017.12.006
Malik, S., Pal, S. C., Sattar, A., Singh, S. K., Das, B., Chakrabortty, R., et al. (2020). Trend of Extreme Rainfall Events Using Suitable Global Circulation Model to Combat the Water Logging Condition in Kolkata Metropolitan Area. Urban Clim. 32, 100599. doi:10.1016/j.uclim.2020.100599
Manoli, G., Fatichi, S., Schläpfer, M., Yu, K., Crowther, T. W., Meili, N., et al. (2019). Magnitude of Urban Heat Islands Largely Explained by Climate and Population. Nature 573, 55–60. doi:10.1038/s41586-019-1512-9
Mathew, A., Khandelwal, S., and Kaul, N. (2018). Analysis of Diurnal Surface Temperature Variations for the Assessment of Surface Urban Heat Island Effect over Indian Cities. Energy Build. 159, 271–295. doi:10.1016/j.enbuild.2017.10.062
Matthews, T., Lo, A. Y., and Byrne, J. A. (2015). Reconceptualizing Green Infrastructure for Climate Change Adaptation: Barriers to Adoption and Drivers for Uptake by Spatial Planners. Landsc. urban Plan. 138, 155–163. doi:10.1016/j.landurbplan.2015.02.010
Mitchell, L., and Moss, N. (2012). Urban Mobility in the 1st Century. New York, NY: NYU Rudin Center for Transportation Policy.
Moazzam, M. F. U., Vansarochana, A., and Rahman, A. U. (2018). Analysis of Flood Susceptibility and Zonation for Risk Management Using Frequency Ratio Model in District Charsadda, Pakistan. Int. J. Environ. Geoinformatics 5, 140–153. doi:10.30897/ijegeo.407260
Mohammad, P., Goswami, A., Chauhan, S., and Nayak, S. (2022). Machine Learning Algorithm Based Prediction of Land Use Land Cover and Land Surface Temperature Changes to Characterize the Surface Urban Heat Island Phenomena over Ahmedabad City, India. Urban Clim. 42, 101116. doi:10.1016/j.uclim.2022.101116
Mohammad, P., and Goswami, A. (2019). Temperature and Precipitation Trend over 139 Major Indian Cities: An Assessment over a Century. Model. Earth Syst. Environ. 5, 1481–1493. doi:10.1007/s40808-019-00642-7
Mumtaz, F., Tao, Y., De Leeuw, G., Zhao, L., Fan, C., Elnashar, A., et al. (2020). Modeling Spatio-Temporal Land Transformation and its Associated Impacts on Land Surface Temperature (LST). Remote Sens. 12, 2987. doi:10.3390/rs12182987
Nasar-u-Minallah, M. (2019). Retrieval of Land Surface Temperature of Lahore through Landsat-8 TIRS Data. Int. J. Econ. Environ. Geol. 10, 70–77. doi:10.46660/ojs.v10i1.220
Nespak, L. (2004). Integrated Master Plan for Lahore-2021. Lahore, Pakistan: Lahore Development Authority.
Ng, E., Chen, L., Wang, Y., and Yuan, C. (2012). A Study on the Cooling Effects of Greening in a High-Density City: An Experience from Hong Kong. Build. Environ. 47, 256–271. doi:10.1016/j.buildenv.2011.07.014
PBS (2017). “2017 Census of Pakistan,” in Pakistan Bureau of Statistics. Editor P. B. O. STATISTICS Pakistan.
Peng, S., Piao, S., Ciais, P., Friedlingstein, P., Ottle, C., Bréon, F.-M., et al. (2012). Surface Urban Heat Island across 419 Global Big Cities. Environ. Sci. Technol. 46, 696–703. doi:10.1021/es2030438
Qureshi, J., Mahmood, S. A., Almas, A. S., Rafique, H. M., and Irshad, R. (2012). Monitoring Spatiotemporal and Micro-level Climatic Variations in Lahore and Subrubs Using Satellite Imagery and Multi-Source Data. J. Fac. Eng. Technol. 19, 51–65.
Rao, P. K. (1972). Remote Sensing of Urban" Heat Islands" from an Environmental Satellite. Bull. Am. meteorological Soc. 53, 647–648.
Raza, A., Raja, I. A., and Raza, S. (2012). Land-use Change Analysis of District Abbottabad, Pakistan: Taking Advantage of GIS and Remote Sensing Analysis. Sci. Vis. 18, 43–49.
Riaz, O., Ghaffar, A., and Butt, I. (2014). Modelling Land Use Patterns of Lahore (Pakistan) Using Remote Sensing and GIS. Glob. J. Sci. Front. Res. 14, 24–30.
Rozenstein, O., Qin, Z., Derimian, Y., and Karnieli, A. (2014). Derivation of Land Surface Temperature for Landsat-8 TIRS Using a Split Window Algorithm. Sensors 14 (4), 5768–5780.
Santamouris, M. (2014). Cooling the Cities - A Review of Reflective and Green Roof Mitigation Technologies to Fight Heat Island and Improve Comfort in Urban Environments. Sol. Energy 103, 682–703. doi:10.1016/j.solener.2012.07.003
Shah, B., and Ghauri, B. (2015). Mapping Urban Heat Island Effect in Comparison with the Land Use, Land Cover of Lahore District. Pak. J. Meteorology 11, 37–48.
Shao, G., and Wu, J. (2008). On the Accuracy of Landscape Pattern Analysis Using Remote Sensing Data. Landsc. Ecol. 23, 505–511. doi:10.1007/s10980-008-9215-x
Shirazi, S. A., and Kazmi, J. H. (2016). Analysis of Socio-Environmental Impacts of the Loss of Urban Trees and Vegetation in Lahore, Pakistan: a Review of Public Perception. Ecol. Process. 5, 1–12. doi:10.1186/s13717-016-0050-8
Simwanda, M., Ranagalage, M., Estoque, R. C., and Murayama, Y. (2019). Spatial Analysis of Surface Urban Heat Islands in Four Rapidly Growing African Cities. Remote Sens. 11, 1645. doi:10.3390/rs11141645
Singh, P., Kikon, N., and Verma, P. (2017). Impact of Land Use Change and Urbanization on Urban Heat Island in Lucknow City, Central India. A Remote Sensing Based Estimate. Sustain. cities Soc. 32, 100–114. doi:10.1016/j.scs.2017.02.018
Solaimani, K., Arekhi, M., Tamartash, R., and Miryaghobzadeh, M. (2010). Land Use/cover Change Detection Based on Remote Sensing Data (A Case Study; Neka Basin). Agric. Biol. J. N. Am. 1, 1148–1157. doi:10.5251/abjna.2010.1.6.1148.1157
Souch, C., and Grimmond, S. (2006). Applied Climatology: Urban Climate. Prog. Phys. Geogr. Earth Environ. 30, 270–279. doi:10.1191/0309133306pp484pr
Spadoni, G. L., Cavalli, A., Congedo, L., and Munafò, M. (2020). Analysis of Normalized Difference Vegetation Index (NDVI) Multi-Temporal Series for the Production of Forest Cartography. Remote Sens. Appl. Soc. Environ. 20, 100419. doi:10.1016/j.rsase.2020.100419
Spisni, A., Marletto, V., and Botarelli, L. (2012). Indici vegetazionali da satellite per il monitoraggio in continuo del territorio. Italian J. Agrometeorology 3, 49–55.
Srivanit, M., Hokao, K., and Phonekeo, V. (2012). Assessing the Impact of Urbanization on Urban Thermal Environment: A Case Study of Bangkok Metropolitan. Int. J. Appl. 2, 243–256.
Tariq, A., and Shu, H. (2020). CA-markov Chain Analysis of Seasonal Land Surface Temperature and Land Use Land Cover Change Using Optical Multi-Temporal Satellite Data of Faisalabad, Pakistan. Remote Sens. 12, 3402. doi:10.3390/rs12203402
Ullah, S., Ahmad, K., Sajjad, R. U., Abbasi, A. M., Nazeer, A., and Tahir, A. A. (2019). Analysis and Simulation of Land Cover Changes and Their Impacts on Land Surface Temperature in a Lower Himalayan Region. J. Environ. Manag. 245, 348–357. doi:10.1016/j.jenvman.2019.05.063
UN-Habitat (2018). Working for a Better Urban Future: Annual Progress Report 2018. Nairobi, Kenya: UN-Habitat.
Van Oort, P. A. J. (2007). Interpreting the Change Detection Error Matrix. Remote Sens. Environ. 108, 1–8. doi:10.1016/j.rse.2006.10.012
Waleed, M., and Sajjad, M. (2022). Leveraging Cloud-Based Computing and Spatial Modeling Approaches for Land Surface Temperature Disparities in Response to Land Cover Change: Evidence from Pakistan. Remote Sens. Appl. Soc. Environ. 25, 100665. doi:10.1016/j.rsase.2021.100665
Weng, Q., and Lo, C. P. (2001). Spatial Analysis of Urban Growth Impacts on Vegetative Greenness with Landsat TM Data. Geocarto Int. 16, 19–28. doi:10.1080/10106040108542211
Xiong, Y., Huang, S., Chen, F., Ye, H., Wang, C., and Zhu, C. (2012). The Impacts of Rapid Urbanization on the Thermal Environment: A Remote Sensing Study of Guangzhou, South China. Remote Sens. 4, 2033–2056. doi:10.3390/rs4072033
Zubair Iqbal, M., and Iqbal, M. J. (2018). Land Use Detection Using Remote Sensing and Gis (A Case Study of Rawalpindi Division). Am. J. Remote Sens. 6, 39–51. doi:10.11648/j.ajrs.20180601.17
Keywords: landsat, image classification, error matrix, urbanization, LST, SUHI
Citation: Farid N, Moazzam MFU, Ahmad SR, Coluzzi R and Lanfredi M (2022) Monitoring the Impact of Rapid Urbanization on Land Surface Temperature and Assessment of Surface Urban Heat Island Using Landsat in Megacity (Lahore) of Pakistan. Front. Remote Sens. 3:897397. doi: 10.3389/frsen.2022.897397
Received: 16 March 2022; Accepted: 12 April 2022;
Published: 17 May 2022.
Edited by:
Aqil Tariq, Wuhan University, ChinaCopyright © 2022 Farid, Moazzam, Ahmad, Coluzzi and Lanfredi. This is an open-access article distributed under the terms of the Creative Commons Attribution License (CC BY). The use, distribution or reproduction in other forums is permitted, provided the original author(s) and the copyright owner(s) are credited and that the original publication in this journal is cited, in accordance with accepted academic practice. No use, distribution or reproduction is permitted which does not comply with these terms.
*Correspondence: Muhammad Farhan Ul Moazzam, ZmFyaGFuLm1vYXp6YW1AZ21haWwuY29t
†These authors have contributed equally to this work