 Bing Lin1*
 Matthew Walker Mclinden2
 Gerald M. Heymsfield2
 Yongxiang Hu1Nikki Privé3,2Lihua Li2Steven Harrah1Kevin Horgan2Xia Cai4Jim Carswell5
- 1NASA Langley Research Center, Hampton, VA, United States
- 2NASA Goddard Space Flight Center, Greenbelt, MD, United States
- 3The division of research and economic development, Morgan State University, Baltimore, MD, United States
- 4Science Systems & Applications Inc., Hampton, VA, United States
- 5Tomorrow.IO, Bourne, MA, United States
This study simulates V-band sea surface reflectance and normalized radar cross-section (NRCS) for sea surface air pressure barometry using a differential absorption radar operating at three spectrally even spaced close frequency bands (65.5, 67.75 and 70.0 GHz) with ± 15° cross-track scanning angle. The reflectance ratios of two neighboring frequency pairs and the ratio of the two ratios or three-channel approach are the focus of this study. Impacts of major sea surface geophysical variables such as sea surface temperature, wind, salinity, whitecap, and incidence angle on these reflection properties are analyzed. The reflection simulation is essentially based on geometric optics of rough sea surface. Simulation shows that NRCS values are sufficiently strong within the scanning angle and sea surface salinity would only introduce minimal variations in the surface reflection. The impact of sea surface reflection variations with sea surface temperature, wind, and whitecaps on sea surface barometry are mitigated when the ratios of frequency-paired radar signals are used. Furthermore, the ratios of a three-channel approach are very close to unity and calibration or compensation for the reflectance ratios may not be needed for sea level pressure retrievals. These results improve our understanding of sea surface reflection variations and would help the system design and development.
1 Introduction
Global observational data of meteorological state are essential in initialization, adjustment, assimilation, and validation of modern numerical weather prediction (NWP) models. Many key variables of the state such as temperature, humidity and winds can be relatively well observed by both in situ and remote techniques from surface, suborbital and orbital platforms. However, surface air pressure cannot be well-sampled by existing remote sensing techniques. There is no operational remote sensing method available for the crucial climate and weather variable.
Surface air pressure is determined by the column total mass of the atmosphere and can have sharp gradients and subtle features. These pressure and pressure gradient fields are the primary driving force for atmospheric motions that transport mass, moisture and momentum (Holton, 1979). NWP models are critically dependent on accurate analyses of the pressure field. Surface pressure observations have essentially become the backbone of modern weather forecasts. They can provide important information about three-dimensional (3D) atmospheric structures and lead impacts on all other model variables throughout the atmospheric volume in assimilation systems (Mass and Madaus, 2014). Studies found that even with limited global and regional surface pressure observations, a highly realistic twentieth-century reanalysis and synoptic-scale upper-air patterns over western North America and the eastern Pacific, respectively, could be produced (Whitaker et al., 2004; Dirren et al., 2007). Without thousands of surface meteorological stations the 5–10 days weather forecasts relied upon daily by the public and commerce would be considerably compromised (Radnoti et al., 2012; Ingelby and Isaksen, 2018). Unfortunately, the pressure over oceans is mainly observed by sparse buoys and ships. These observations have very limited coverage, especially away from shipping lanes or coasts (Prive et al., 2022). More than 70% of the global ocean is greater than 150 km away from nearest in situ surface pressure observations, with 25% even more than 500 km away. Approximately half of the buoys do not report surface pressures, and funding for the drifting buoys is limited (Centurion et al., 2017).
Lack of global sea surface pressure observations is a significant gap for current global Earth observing systems. Filling this gap provides a great potential in weather forecast improvements. For example, tropical storms have a very low sea level air pressure center and its associated strong surface pressure gradient fields, which dominantly determines hurricane ambient flows and steering winds and regulates hurricane movements (Camargo et al., 2007; Radnoti et al., 2012). Previous studies have demonstrated that proper knowledge on surface-level pressure can substantially improve hurricane forecasts (Barker et al., 2003; Barker et al., 2004; Xiao et al., 2000; Xiao et al., 2009; Min et al., 2015a; Min et al., 2015b).
For hurricane and other severe weather forecasts, global/regional pressure observations are urgently needed, which may only be achieved through remote sensing techniques. Recent studies in airborne remote sensing technologies of the Differential Absorption Radar (DAR) provide a great potential to fill the sea level pressure observational gap of Earth observing systems (Lin and Hu, 2005; Lawrence et al., 2011; Lawrence et al., 2012; Millan et al., 2014; Lin and Min, 2017; Lin et al., 2021; Prive et al., 2022).
The DAR systems previously studied will operate at the oxygen (or O2) absorption bands for column O2 mass amount measurements. The DAR frequencies are chosen to be closely-spaced such that atmospheric attenuation other than O2 and surface reflection are similar, but the difference in O2 absorption is substantial. Thus, when DAR sea surface returns are measured, the effects of the attenuation and reflection are significantly reduced and the differential loss due to atmospheric O2 is dominant and can be measured by the ratio of frequency-paired DAR signals. Since oxygen is well mixed in the atmosphere, the column total air mass can be obtained from the measured O2 amounts, i.e., the sea level pressure (SLP) can be retrieved.
Although the effects of sea surface reflection on differential absorption could be significantly reduced for the O2 DAR approach, previous studies did not provide quantitative estimates on sea surface reflection or the reflectance ratio of paired DAR wavelengths due to lack of sea surface reflectance measurements and modeling efforts at the studied O2 frequencies. Those studies assumed that sea surface reflection or normalized radar cross-section (NRCS, σo) could be well calibrated and the impact of sea surface reflection could be removed from the ratio of the paired reflectance with the calibration. These assumptions are reasonable because of closely spaced wavelengths of studied DAR systems. However, quantitative sea surface reflection estimates are important in DAR design, particularly for instrument dynamic range and power determination. With the increased needs in global SLP observations and development of DAR barometry, this study, thus, numerically simulates sea surface reflection at the considered O2 absorption band and evaluates its impact on SLP retrievals and DAR measurement calibration requirements.
Microwave sea surface reflection has been studied for decades and has broad applications, particularly sea states, for both active and passive sensors (e.g., Apel, 1994; Elfouhaily et al., 1997 and references therein). Measured and modeled NRCS values are critical for sea surface wind retrievals using scatterometers at various microwave wavelengths such as C, X, Ku, and Ka (e.g., Masuko et al., 1986; Donelan and Pierson, 1987; Stiles and Yueh, 2002; Contreras and Plant, 2006; Karaev et al., 2015). The Global Precipitation Mission (GPM) with a Ku- and Ka-band radar has also examined NRCS (e.g., Hossan and Jones, 2021). Additionally, airborne measurements have been made at these frequencies. Airborne and spaceborne measurements have even been made at W-band (Li et al., 2005; Tanelli et al., 2008). Furthermore, sea surface reflectance is directly linked to sea surface emissivity (Meissner and Wentz, 2004), which, along with sea surface temperature (SST), decides surface emission, a key microwave radiation source. For passive microwave measurements with instruments like Special Sensor Microwave Imager, this emissivity is a fundamental parameter for marine geophysical variable retrievals (e.g., Lin and Rossow, 1994; Lin and Rossow, 1997; Lin et al., 1998a; Lin et al., 1998b). Furthermore, observations of sea surface states using bistatic spaceborne and airborne reflectometry sensors like those for Global Positioning System (GPS) constellations at L band are essentially dependent on modelled or measured sea surface reflectance values (Lin et al., 1999; Foti et al., 2015). Unfortunately, these previous sea surface reflection studies were not on current V-band for SLP barometry to avoid weakened sea surface microwave signals caused by O2 absorption and attenuation. This effort explores basic characteristics of sea surface reflection at the O2 absorption V-band that has not been studied previously. Fundamental sea surface roughness and reflection models are used in our numerical simulations. Its applications will not be limited to only SLP barometry but also extended to sea state, air-sea interaction, climate variation, etc., observations using DAR channels with minimal O2 absorption as a byproduct of studied instruments.
Section 2 describes the general approach of sea surface reflection simulation. Basic information on wavelengths selected and the instrument is provided. In Section 3, simulation results for the surface reflection and NRCS are presented. Potential errors in the modelled reflectance and NRCS values and their related sensitivities impacting pressure retrievals are analyzed in Section 4. Finally, Section 5 summarizes the findings of this study and outlets future directions.
2 Simulation approach
This simulation study aims to understand major aspects that influence sea surface reflectance and NRCS at V-band wavelengths. These aspects include, but not limited to, operation frequency and polarization, incidence angle, reflection and scanning angles, sea surface roughness, and seawater complex dielectric constant. Other related crucial factors such as sea surface wind speed and direction (vector wind), ocean whitecap and foam areal coverage, sea surface temperature, and sea surface salinity (SSS) are considered.
2.1 Basic barometry instrumentation and concept
As discussed in previous work (e.g., Lin and Hu, 2005; Prive et al., 2022), multiple wavelengths and frequency pairs would be used in DAR systems. Instead of using frequencies at lower sideband of the 50–75 GHz O2-absorption complex in the original work (e.g., Lin and Hu, 2005; Lawrence et al., 2011), the three upper sideband frequencies (65.5, 67.75, 70.0 GHz in the order of decreased O2 absorption) are considered to eliminate potentials of active DAR instruments interfering passive microwave sensors such as Advanced Microwave Sounding Unit operating at the same lower sideband for vertical profiling of atmospheric temperature. Because of near linear variations of moisture absorption and sea surface reflection with frequency at the sideband, spectrally evenly spaced close frequencies are selected to remove potential impacts of these variations on retrievals. With these three frequencies (also called channels), two ratios of DAR sea surface returns, one for the pair at frequencies 65.5 & 67.75 GHz and another at 67.75 & 70.0 GHz, can be measured. Here high frequency returns divided by low frequency ones are used. Additionally, a third value, the ratio of the two ratios, is obtained. This is called three-channel approach. These measured ratios are used to estimate differential absorption losses caused by atmospheric O2. That is, atmospheric column O2 amount or atmospheric column air mass and SLP can be retrieved from the measurements. The advantage of three-channel approach is that small residuals of differential absorption introduced by atmospheric water vapor and cloud water in the ratios of the two frequency pairs can be significantly reduced from this approach. At DAR V-band spectra, the absorption losses of water vapor and clouds basically linearly increase with frequency. With the spectrally even spaced close frequencies selected for our DAR system, the difference in differential absorption of water vapor and clouds would be further reduced to a negligible level. The three-channel approach essentially captures this effect (Prive et al., 2022). Later, it can be seen that this approach also has great advantages in effectively reducing the impacts of potential uncertainties in seawater dielectric constant, sea surface wind (SSW), SST, SSS, etc. The system calibration work could also be significantly reduced because of these three-channel approach advantages.
Both airborne and spaceborne DAR systems are considered here as previous studies (e.g., Lin and Hu, 2005; Prive et al., 2022). The flight altitudes can be as high as about 21 km for a suborbital system when onboard ER-2 aircraft, and about 705 km for A-train like low Earth orbital platforms. The transmitted powers for suborbital and orbital systems are to be 20 to 30 dBm and 40 to 50 dBm, respectively. The antenna diameters are envisioned to be 0.3 m and 1.5 m with beam widths of 1.0° and 0.2° for suborbital and orbital systems, respectively. To maintain sufficient return signal power and signal-to-noise ratio (SNR) for accurate SLP retrieval, DAR instruments are designed to have cross-track scans with ±15° scanning angle to avoid excessive power losses of sea surface scattering at large incidence angles. For airborne systems, this 15° scanning angle is very close to incidence angle, while for spaceborne sensors at low Earth orbits, the incidence angle, depending on altitude, is only slightly larger than radar beam off nadir pointing angle due to surface curvature and generally the difference is within 2°.
Horizontally polarized signals are chosen for our DAR systems so that radar signal E-field direction will not change along with cross-track scanning angle, and mostly discussed here. This horizontal polarization is commonly used in meteorological radars. When the surface is flat, specular surface reflectance of horizontal (and vertical) polarization at an incidence angle can be calculated from the complex dielectric constant of seawater based on Fresnel equations. Seawater complex dielectric constant dominantly depends on frequency, seawater temperature and sea salinity. Klein and Swift. (1977) had built a relatively broad microwave spectral model for the dielectric constant based on the single Debye relaxation law and experiment data. This model has been used in many microwave remote sensing and radiative transfer applications (e.g., Lin and Rossow, 1994; Ellison et al., 1998; Lin et al., 1998b; and references therein). Recently, an advanced model for the dielectric constant has been developed based on double Debye relaxation approach and newly available satellite observational data (Meissner and Wentz, 2004). Generally, the two models provide similar results, especially for frequencies lower than about 40 GHz (see Figure 10 of Meissner and Wentz. (2004)). At our considered wavelengths, some small differences in specular reflectance calculated from these models exist, which may cause non-negligible bias errors in SLP retrievals if reflectance values, especially for the ratios of the two frequency pairs, are not calibrated. For this study, double Debye relaxation approach is used because it has better matches with experimental and observational data. The single Debye relaxation model is used only in assessing potential model errors in a comparison with the double Debye relaxation approach.
2.2 Simulation principles in sea surface reflection
This simulation is built upon the pioneering work of Cox and Munk. (1954); Cox and Munk. (1955) and Cox and Munk. (1956); hereafter CM, CM54, etc.) about sea surface glitter experiments and their related sea surface slop distributions. Essentially, the ocean surface can be seen as a composition of many small tilt flat facets that act as perfectly smooth planes for electromagnetic wave reflection. These facets are mainly produced by ocean surface waves that are critically dependent on sea surface vector winds. Slight differences in the distributions of facet slopes at crosswind and upwind directions over sea surface are observed. Based on the glitter photometry data, the slope probability density function (PDF) of these facets was found to be close to a 2-D Gaussian distribution on the crosswind and upwind directions with some deviations as described by the Gram-Charlier series (CM54). The mean square slope (σ2, a quantified value for sea surface roughness) components at crosswind and upwind directions under windspeed, WS, for the PDF obtained are:
where subscripts c and u are for crosswind and upwind, respectively. The ±values provide the standard deviations of the observed mean square slopes. For many applications, only windspeeds are needed or available. In this case, the slope PDF could be considered as a Gaussian distribution (CM55). The mean square slope of this PDF is:
Since the landmark CM work, there have been continual efforts to better determine the sea surface roughness, especially its relations with sea surface winds. Many observations agree well with CM results (e.g., Hughes et al., 1977), while other studies have different results (e.g., Tang and Shemdin, 1983; Tatarskii, 2003). Shaw and Churnside (1997) found that their results and other previous measurements of the sea slopes were generally consistent with those of CM when air-sea interface stability had been taken into account. The more stable the air-sea interface, the smoother the sea surface (or the smaller the mean square slope). Since CM data were taken primarily under neutral stability and unstable sea surface conditions would be mostly related to air-sea turbulence and less influence on prominent horizontal winds for sea waves, CM slope values should be applicable to general open oceans. Recent studies with broad open ocean measurements such as satellite MODIS and ASTER observations support CM work (e.g., Zhang and Wang, 2010; Zhang et al., 2018). An analysis of coincident measurements of ocean vector winds (speed and direction) and sea surface reflectance from NASA NSCAT scatterometer and POLDER multi-directional radiometer onboard the ADEOS-1 satellite found that CM mean square slope was in near perfect agreement with that derived from the satellite data (Breon and Henriot, 2006). Unlike CM’s linear assumption, the skewness of the slope PDF described in the Gram-Charlier series for modifying the Gaussian distribution was found to be non-linearly related to wind speed by the analysis. Based on these results, Ryabkova et al. (2019) even set the CM mean square slope model as one of criteria in ocean wave spectrum model development.
Additional consideration on sea surface roughness is its impact on microwave reflection. Most of previous mentioned studies in measuring sea surface slope were made in visible or near infrared wavelengths, much shorter than microwave wavelengths. Small sea surface roughness and ocean waves could appear smoother to microwaves due to their much longer wavelengths. Certain reduction in the roughness may be needed for microwave signals with very long wavelengths (Wilheit, 1979; Lin et al., 1999). However, current frequencies at V-band are high enough for mechanically generated sea surface roughness and no reduction is needed. That is, previous discussed CM results can be directly applied to current study.
With these sea surface roughness and smooth facet considerations, sea surface reflection, R, at the V-band O2 absorption frequencies can be expressed as:
where θ is the incidence angle, which is very close to the scanning angle θo. γ is the seawater specular reflectance determined from Fresnel equations. Sc and Su are the local sea surface slopes at crosswind and upwind directions, respectively. The integration domain, Ω, of Sc and Su is for all local surface planes (or facets) with slopes of Sc and Su that would produce reflected microwave waves toward the instrument antenna. p is the sea surface slope PDF and needs to be integrated over the Ω domain determined from the viewing geometry. For the DAR backscatter case, the geometry is very close to the requirement of all normal vectors of the facets pointing to the antenna. Thus, the integration in Eq. 2 could be considered as a product of the specular reflectance γ at 0° incidence angle and the integrated probability P of the slope PDF over Ω domain. The parameter W in Eq. 2 is the areal fractional coverage of oceanic surface whitecaps and foams. The coverage is strongly affected by sea surface winds, and usually small (<1%) when the windspeeds are less than 10 m/s and could be large (>∼ 10%) for winds exceeding ∼20 m/s. As our previous work (Lin et al., 1999), this study assumes whitecaps and foams do not reflect electromagnetic waves and calculates this coverage using the formula of Monahan and Lu (1990). Increasing whitecap and foam coverage with winds would reduce sea surface reflection area and, thus, sea surface reflected power at all V-band frequencies. However, the reduction fraction for reflection areas would be the same for all frequencies, which would maintain the relative reflectivities unchanged for different whitecap and foam coverages. Additionally, the impacts of whitecaps and foams on the total reflected radar powers would be small under most climatological conditions due to their small coverages.
2.3 Modeling approach
This study simulates sea surface reflection and NRCS values at the selected three O2-absorption V-band frequencies. The basic approach in this simulation is similar to that of sea surface reflectometry for sea surface state using bistatic GPS signals (Lin et al., 1999) except much simplified due to directly backscattered radar returns and their associated simple incidence angles and signal pathways. The key part of the simulation, sea surface slope probabilities of required pointing, is calculated from the integration of sea surface slope PDF over the viewing geometry domain as shown in Eq. 2. The impacts of sea surface roughness caused by sea surface winds (or ocean wind-driven waves) on the slope probability, complex dielectric constant variations with SST and SSS on specular reflectance, and ocean whitecaps and foams on the effective coverage of oceanic reflection area are all considered.
This study emphasizes on reflectance ratios that are important for radar SLP retrievals though V-band radar reflectance and NRCS values are discussed. Since oxygen differential absorption techniques are used in the radar SLP barometry, radar return ratios from neighboring frequency channels become the primary measurements in radar SLP retrievals (Lin and Hu, 2005). As an important factor affecting radar return ratios, reflectance ratios would be crucial for SLP retrievals. Their uncertainties could potentially introduce errors in the measured O2 differential absorption optical depth and retrieval of column air mass and SLP (Lin and Hu, 2005). Minimizing the uncertainties and retrieval errors is desired. Besides the ratios of the two frequency pairs, as mentioned previously, the ratios of those two paired ratios are stressed too in this study. Certain advantages of the three-channel approach are highlighted.
3 Simulated results
This study numerically simulates V-band sea surface reflectance and NRCS values to gain critical knowledges in the radar sea surface reflection and to understand the impacts of major sea surface geophysical variables on the reflection because of lack of experimental and observational V-band reflectance data. The simulation of sea surface reflection is based on Eq. 2, which consists of two core terms: specular reflectance and slope probability. The former is determined by incidence angle and complex dielectric constant of seawater based on Fresnel equations, while the latter can be estimated from the recent progress in CM model (Breon and Henriot, 2006), particularly with the modifications in Gram-Charlier series (hereafter as BH06). Though another term, the whitecap and foam areal coverage, has considerable impacts on radar reflection and power returns, it is cancelled out in the return power ratios (or reflectance ratios) during differential absorption SLP retrievals. Thus, most of reflection and NRCS discussions are on the two core terms.
Figure 1 shows simulated horizontally polarized (hereafter as H-pol) seawater specular reflectance at the three V-band frequencies as a function of incidence angle (θ), sea surface water temperature (i.e., SST), and sea surface water salinity (SSS). The ranges of θ, SST, and SSS variations are from 0° to 30°, −5°C–35°C and 33 ppt–38 ppt, respectively. These ranges could cover current observation needs and general climate conditions for the ocean. At 15°C SST and 35 ppt SSS, the reflectance increases from about 0.42 to 0.47 for 0°–30° incidence angles (Figure 1A). Before 10° incidence angle, the variation is small. As expected, the values from the three frequencies are very close in the entire θ range. For 0° θ and 35 ppt SSS, the reflectance has a relatively larger change with SST (Figure 1B) compared to those with θ. The change may be near-linear, especially when SST is cooler than 20°C. While we have only plotted 15°C SST and 0° θ, very little variability of the reflectance with SSS is typical at high frequency microwave bands such as V band (Figure 1C). The closeness of the specular reflectance values at studied three frequencies on incidence angle also can be found in their dependences on seawater temperature and salinity, which is one of reasons using differential techniques in active SLP sensing (Lin and Hu, 2005).
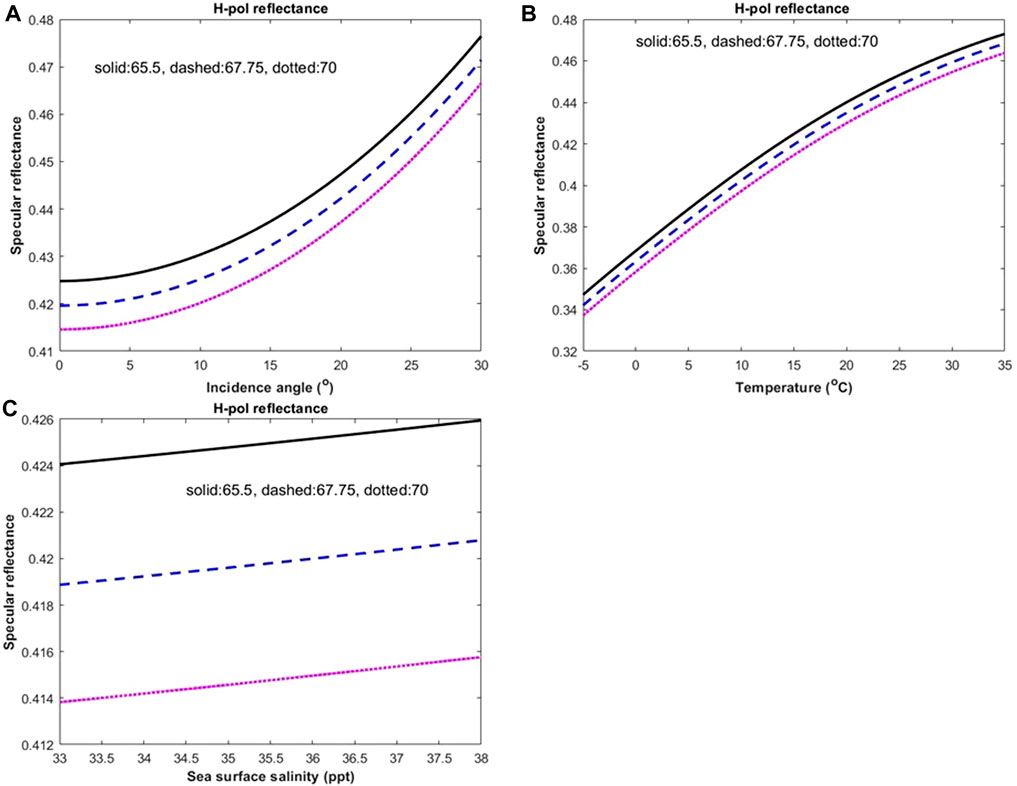
FIGURE 1. Variations of simulated horizontally polarized (H-pol) specular reflectance values of seawater at 65.5 (black solid curve), 67.75 (blue dashed curve), and 70.0 GHz (magenta dotted curve) V-band frequencies with (A) incidence angle, θ, (B) sea surface temperature, SST, and (C) sea surface salinity, SSS. If not mentioned, the basic environmental condition of 0° θ, 15°C SST and 35 ppt SSS is assumed as discussed in the text.
With the simulation of entire Eq. 2 including specular reflectance discussed above, H-pol reflectance ratios used in DAR and SLP retrievals are obtained. Sea surface windspeed range and its basic condition are set to be 1–15 m/s and 7 m/s, respectively. The upwind direction is assumed to be the same as the DAR scanning direction. Note that hereafter, the basic environmental condition of 0° θ, 15°C SST, 35 ppt SSS, and 7 m/s and 0° SSW is assumed in following discussions if not specifically mentioned. The reflectance ratios of the two frequency pairs at the basic windspeed condition are both about 98.8%–99% for full incidence angle range (Figure 2A). It is emphasized that the incidence angle here is the angle between the opposite vector of the radar wave propagation ray and the normal of entire sea surface, not the incidence angles of radar waves interacting with individual small sea surface facets for geometric reflection. For received radar returns, the incidence angles for those facets are required to be almost 0° because the incidence waves must be directly reflected back towards the instrument antenna. Thus, the sea surface reflectance dependence on incidence angle is dominantly decided by sea surface slopes with their normal towards the antenna. The probability of these sea surface slopes, then, could be calculated from the sea surface slope PDF of BH06. The ratio of the higher frequency pair (black solid curve) is marginally (<1‰) higher than that of the lower frequency pair (blue dashed curve), which makes the ratio for the three-channel approach slightly higher than 100% (magenta dotted curve). When SLP retrieval accuracy is targeted at 1 mb as in situ measurements, these reflection ratios need to be compensated (or calibrated) to unity to avoid potential bias errors although these ratios are very close to 1. Similar magnitude in the variability of the ratios on SST can be found (Figure 2B). As seen previously, individual ratios almost maintain constant in the considered SSS range (Figure 2C). Because of these, no additional discussions of sea surface reflection and NRCS on SSS are made in the following analysis.
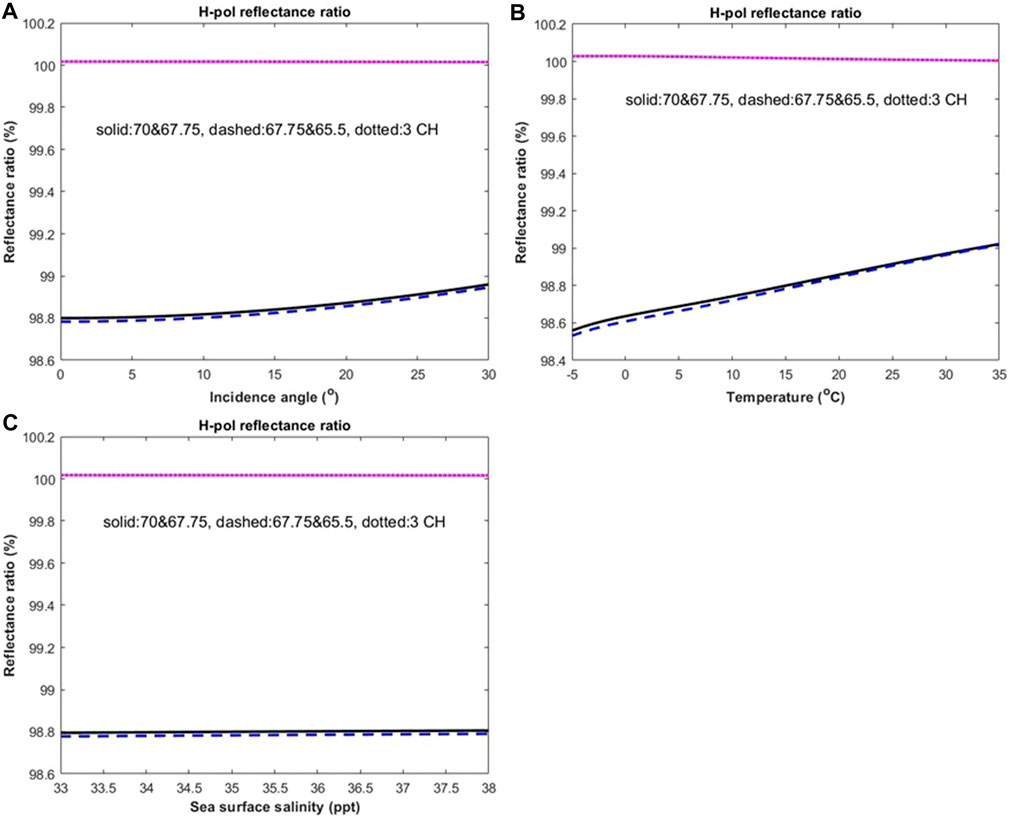
FIGURE 2. Similar as Figure 1, except for sea surface reflectance ratios of neighboring 70.0 and 67.75 GHz (black solid curve) and 67.75 and 65.5 GHz (blue dashed curve) pairs. Parts (A-C) are for incidence angle, sea surface temperature, and sea surface salinity, respectively. The magenta dotted curve is for the ratios of the two ratios of paired frequencies or the three-channel approach. Additional basic environmental condition assumed is 7 m/s and 0° azimuth angle direction for sea surface winds.
Sea surface reflectance variations with sea surface windspeed are shown in Figure 3. Basically, the wavelength dependence of the NRCS at the V-band frequencies (Figure 3A) is very small due to very close wavelengths and specular reflectance values and same effects of sea surface slope PDF on the reflection at the studied frequencies (ref. Figure 1 and previous discussions). The simulated NRCS drops rapidly at weak wind conditions and is still about 8 dB high when sea surface windspeed reaches as high as 15 m/s. The little effects of the slope PDF on sea surface reflection can especially be seen in reflectance ratios (Figure 3B). As previous cases (Figure 2), the ratios from the two frequency pairs are only about 1% away from unity, while the ratios of the three-channel approach have insignificant difference from 1. Thus, for SLP retrievals using DAR techniques, slight compensation may be only needed for reflectance ratios of the two frequency pairs.
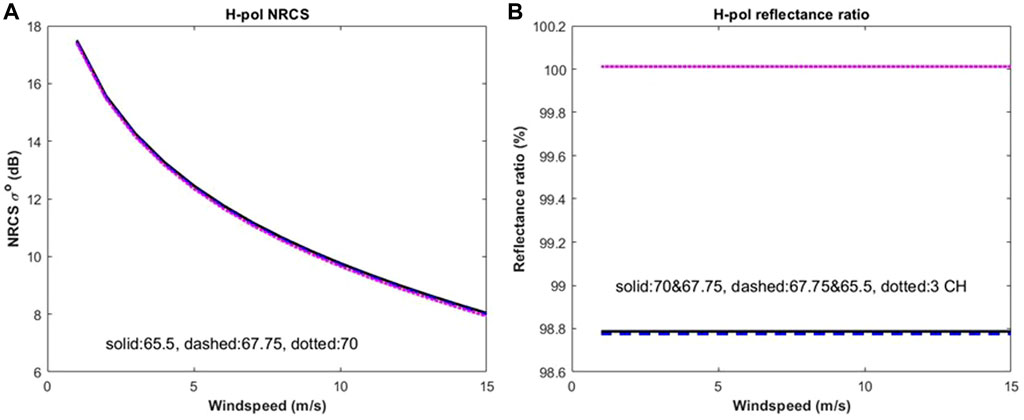
FIGURE 3. Variations of simulated H-pol NRCS (A) and reflectance ratio (B) with sea surface windspeed. The curve style/color code is the same as those in Figures 1, 2. Note that the differences among the NRCS values at the three V-band frequencies are very small so that the three curves in (A) and the two paired frequency curves in (B) could overlap each other.
NRCS values at the DAR three frequencies are calculated for all geophysical variable conditions mentioned above. These NRCS values are very important in radar system designs, especially for DAR development due to their impacts on radar return powers and signal-to-noise ratios. Because of this reason and very close reflectance values of the three frequencies, NRCS at 70.0 GHz could be used as a representative in DAR system designs due to its lowest reflection among the three channels. Figure 4 plots NRCS under different sea surface windspeeds as a function of (a) incidence angle and of (b) azimuth angle of wind direction at 15° incidence angle. At 0° incidence angle, NRCS is about 10–13 dB with weaker winds corresponding stronger radar reflections (Figure 4A). For small incidence angles, the mirror effect of smooth sea surface plays a main role in the surface reflection. Increasing incidence angle, NRCS with weak winds drops down quickly due to lack of sea surface roughness (or facets toward incidence ray), while those with stronger winds show larger values. Around 15° or higher incidence angle, NRCS could reduce to below 0 dB depending on windspeed. Assuming about 10 dB decreasing in sea surface power returns (or 0 dB NRCS) were tolerated in system designs for SLP DAR measurements, 15° scanning angle could be a reasonable choice for the considered instrument. Further increasing incidence angles, NRCS could be very small, even below −20 dB. Although these low NRCS values may not provide sufficient return powers for DAR SLP retrievals, they could be still high enough for other radar systems such as those for sea state observations.
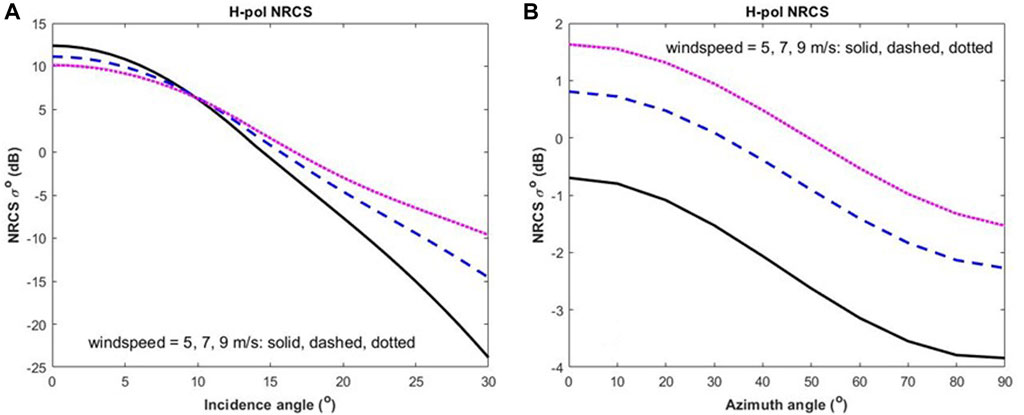
FIGURE 4. Similar to Figure 3, except for NRCS variations at 70 GHz channel with (A) incidence angle and (B) azimuth angle of wind direction at 15° incidence angle. The windspeeds in the simulation are 5 m/s (black solid curve), 7 m/s (blue dashed curve), and 9 m/s (magenta dotted curve).
For a nadir view (or 0° incidence angle), the wind direction has no effects on NRCS because whatever azimuth angle is, all horizontal facets (or zero-degree slopes) have the same normal towards viewing instruments. However, increasing incidence angle would gradually lead certain NRCS dependence on the azimuth angle of sea surface winds. For common wind conditions, smaller azimuth angles (or more along with upwind directions) would have slightly stronger sea surface reflection than the larger ones due to sea surface roughness asymmetry along the upwind and crosswind directions and the skewness of the slope PDFs or ocean waves (see CM54 and BH06). The NRCS changes with the azimuth at 15° incidence angle, which is potentially the largest incidence angle for current DAR system design, are plotted in Figure 4B. Because of up-down wind and crosswind directions of sea surface, modelled NRCS would have a 180° azimuthal period. Thus, this plot only shows NRCS variations within 90° due to the symmetry at 90°. Generally, the NRCS azimuthal asymmetry is within about 3 decibels for most sea surface winds, which may not introduce significant impacts on system designs. However, when incidence angles are large (e.g., >40°), the NRCS azimuthal asymmetry could be as big as about 8–10 dB (Contreras and Plant, 2006). Furthermore, this NRCS azimuthal asymmetry would not affect DAR SLP retrievals since it, and generally the slope probability P, is cancelled out in reflectance ratios of the two frequency pairs (ref. previous discussions on Eq. 2).
The simulated NRCS results with sea surface windspeed shown in Figures 3, 4 are comparable with the simulated Ka-band values obtained from sea wave spectral techniques (Contreras and Plant, 2006). The simulated NRCS dependence on sea surface wind direction with an incidence angle within 15° is generally small and its variability should be within 3dB, which is essentially consistent with the results previously reported for other microwave bands (Contreras and Plant, 2006; Ryabkova et al., 2019). Since active V-band remote sensing is relatively young, future field experiments and observations are likely needed to validate current simulated NRCS and reflectance ratio results and to advance V-band rough surface reflection research.
4 Uncertainty assessment
One of the goals of this effort is to understand the impacts of major sea surface geophysical variables on DAR reflections. To reach this goal, three crucial aspects of potential uncertainties directly related to sea surface reflection modeling and measuring need to be thoroughly assessed. They are 1) potential errors in the specular reflectance caused by the uncertainties in the modeling of seawater complex dielectric constants; 2) dependences of sea surface reflectance errors on the uncertainties of sea surface geophysical variables such as incidence angle, sea surface temperature and salinity; and 3) statistical fluctuations of the reflectance caused by the sea surface slope variations. For the first aspect, simulated specular reflectance results obtained from the advanced double Debye relaxation approach are compared with those obtained from a classic single Debye relaxation model. Their differences may reflect potential simulating uncertainties. The impacts of these uncertainties on sea surface reflectance ratios and SLP retrievals are evaluated. Reflection sensitivities on the geophysical variables are tested in the second aspect’s assessment, and the potential range of reflectance variations or expected errors introduced by the uncertainties originally found by CM and others for sea surface roughness in the slope PDFs are estimated for the third aspect.
4.1 Sea surface reflectance and dielectric constant
To calculate specular reflectance from Fresnel equations, commonly used single Debye relaxation model (Klein and Swift, 1977) and the double Debye relaxation approach obtained from newly available observational data (Meissner and Wentz, 2004) are used in our assessment.
Sea surface H-pol specular reflectance differences between the double and single Debye models under the basic environmental condition for the studied radar frequencies as a function of sea surface temperature and incidence angle are shown in the left panels of Figure 5. Generally, the simulated specular reflectance from double Debye relaxation approach is slightly less than that from single Debye relaxation model. The results from the two models are very similar at cold temperatures and gradually separated to a magnitude of about 0.035 (or relatively 8%) in warm seawater conditions. Under the basic condition, the absolute difference deceases slightly with increasing incidence angle from 0.0272 to 0.0258 with a range <0.001 for individual frequencies. These 5%–10% differences between specular reflectance values of the two models could introduce significant errors in passive microwave retrievals and were one of the reasons in development of the advanced double Debye model as pointed out by Meissner and Wentz. (2004). However, when the reflectance ratios are used in SLP retrievals, the differences (right panels of Figure 5) are much smaller, especially for the three-channel approach case, because of the similar trend, near-linearity and/or small variability of the reflectance values with SST and θ in the considered ranges of frequency, SST, incidence angle, etc. in both models. The very low difference level (<< 1‰) of three-channel approach indicates different models may not lead significant differences in reflectance ratios for various sea surface conditions and potential errors introduced by models may be tolerable for retrievals. For the two frequency pairs, the ratio on temperature may need to be adjusted lightly and calibrated to unity.
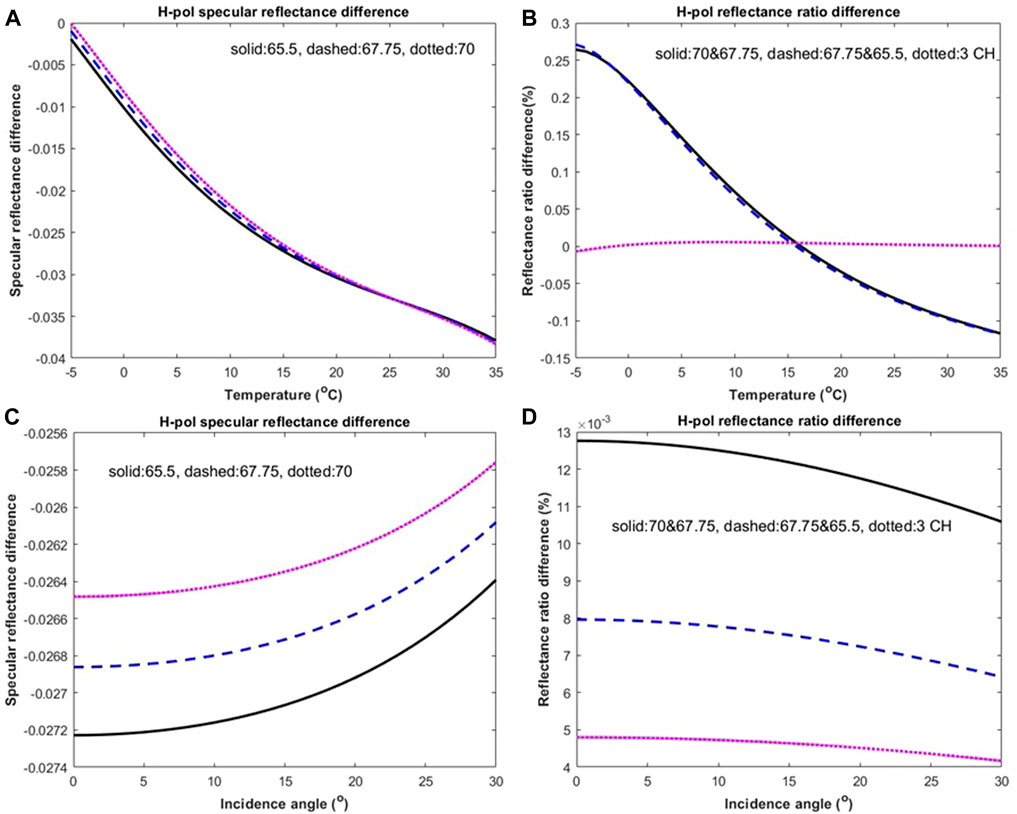
FIGURE 5. Similar to Figures 1, 2, except for the variations of (A, C) seawater specular reflectance differences and (B, D) sea surface reflectance ratio differences between double and single Debye relaxation model results on (A, B) SST and (C, D) incidence angle.
4.2 Sensitivity test
Besides model errors, the simulated sea surface reflectance errors could be caused by uncertainties in model inputs such as seawater temperature and incidence angle. To understand the potential errors from these uncertainties, a test on the reflection ratios is made. The test assumes either 1°C sea surface water temperature or 1° incidence angle error. The H-pol results are shown in Figure 6. Relatively, the errors are much less than 1‰ for both temperature (Figure 6A) and incidence angle (Figure 6B) even for the two frequency pairs. Clearly, the tiny changes in the ratios with those geophysical variables as seen in Figure 2 are the key reason for the insensitivity obtained here. Practically, the uncertainties in these geophysical variables as model inputs could be smaller, may be only half or less of the assumed values. Thus, these input uncertainties may not be major factors affecting SLP retrievals.
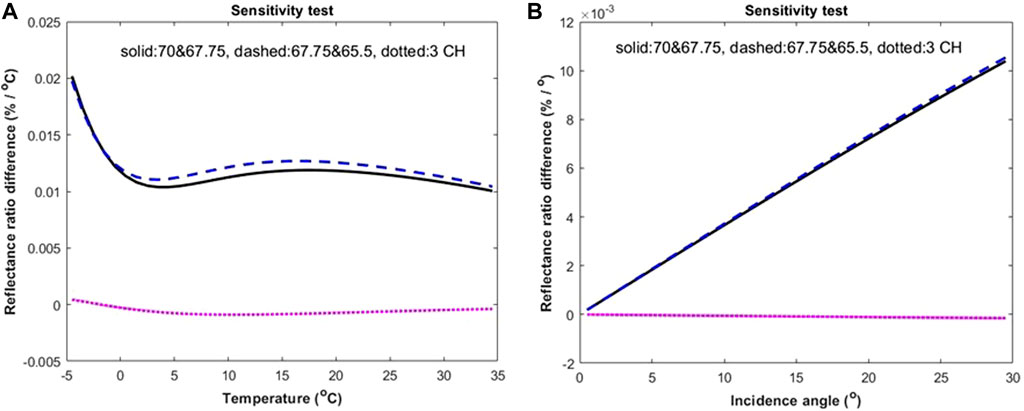
FIGURE 6. Similar to previous figures, except for sensitivity tests on (A) SST with 1°C error and (B) incidence angle with 1° error for sea surface reflectance ratios of the two frequency-pairs and three-channel approach.
4.3 Slope PDF variability
From previous discussions, particularly for Eq. 2, variations or errors in sea surface slope PDFs would produce significant changes or errors in sea surface reflectance, thus, causing potential uncertainties in radar return powers. The statistical variability (or error) of sea surface slope PDF can be quantitatively assessed by the statistical errors of sea surface upwind and crosswind roughness of the slop PDF as shown by many previous efforts (e.g., CM54; CM55; BH06). The statistical errors of sea surface roughness from those previous studies could be resulted from measurement errors or sea surface natural variability or both. This study does not differentiate these error sources and only practically recognize the potential slope PDF errors from the mean square slopes and assess their impacts on sea surface reflectance estimates. Since the Gaussian part of the slope PDF dominates sea surface reflectance and for many applications only windspeeds are needed or available, the 2D Gaussian form of sea surface slope PDF (CM55) is discussed here. It is expressed as:
where Sx and Sy are the sea surface slopes along x and y directions, respectively. σ2 is the mean square slope, regardless of direction, as described in Eq. 1c. The errors in the slope PDF caused by σ2 errors, thus, can be derived as:
or the relative errors are:
The potential expected absolute relative errors, then, would be:
since σ2 in the slope PDF is the mean square slope (CM55), where the symbol <> represents statistical expectation.
As shown in Eq. 1c the standard error of this mean square slope σ2 from CM is 0.004. It appears that recent observations, especially BH06, have smaller mean square slope errors than historic CM measurements. This study uses the CM value to represent the errors in the slope PDF for conservative estimations. For a climatological sea surface wind speed 7 m/s, σ2 value would be about 0.0388 (ref. Eq. 1c). So, the expected relative error of the slope PDF would be about 20%. In certain practical applications such as DAR measurements, large fluctuations in individual square slope, Sx2 + Sy2, values around the mean square slope should exist statistically. These square slopes could be much higher than the mean square slope σ2 and reach 3 times or more of the mean. In this case, the relative error in the slope PDF could be doubled or even higher compared to the expected value.
From Eq. 4a windspeed errors on the errors of calculated reflectance values could further be estimated. Space microwave radiometer observations could have about 0.3 m/s standard errors in sea surface windspeed retrievals (Mears et al., 2015), which would introduce certain errors in calculated sea surface slope probability and simulated sea surface reflectance. To evaluate these potential calculation errors, the expected absolute relative errors of the PDF in sea surface windspeed could be derived from Eq. 4c and Eq. 1c as:
For climatological sea surface windspeed of 7 m/s and with 0.3 m/s windspeed error, the expected absolute relative PDF error would be about 8%. This error could propagate to reflectance calculations and may affect estimated sea surface NRCS values in observations. However, for SLP retrievals, only reflectance ratios would be used, this windspeed error would not have impacts on the ratios as discussed previously.
Reducing the slope PDF error/variability or the reflectance error/variability and their introduced return power noise is one of the crucial aspects in DAR measurements. Certain averaging of multiple return samples is indispensable. This study may provide an additional theoretical view on the sea surface slope PDF variability in radar data processing. Note that because the slope PDF variability or the slope variations would affect the integrated slope probability over slopes with required reflection directions in a same way for all three DAR channels, the ratios of paired frequency returns would be maintained unchanged. That is, this slope probability issue only produces return power fluctuations and may not lead bias errors in SLP retrievals using DAR techniques.
5 Summary
This study simulates and investigates V-band sea surface reflectance for sea surface air pressure remote sensing with a differential absorption radar. The radar would operate at three O2-absorption V-band spectrally even spaced close frequencies. Besides sea surface reflectance and NRCS, this analysis also focuses on the reflectance ratios of paired frequencies and the ratio of these ratios because differential absorption techniques for the radar returns would be used in sea level pressure retrievals. The simulation foundations are 1) geometric optics for rough sea surface reflection; 2) specular reflectance calculations with Fresnel equations using seawater complex dielectric constant models obtained from both recent satellite observations and previous experiments for geometric optics; 3) sea surface slope probability derived from the slope PDFs of CM54 and BH06 for the rough surface; and 4) whitecap and foam areal coverage for non-reflection sea surface areas. Within these four items, the combination of the specular reflectance and sea surface slope probability (or items 2 and 3) is crucial in sea surface reflectance and NRCS calculations.
This study found that as previously reported for other microwave bands, the recent double Debye relaxation approach and previous classic single Debye relaxation model of seawater dielectric constant produce basically consistent sea surface specular reflectance results at studied V-band frequencies. Although there are significant changes of sea surface reflectance and NRCS with the geophysical variables such as SST, wind and incidence angle, the ratios of frequency pairs have much smaller variability (∼1%) with geophysical variables, which supports previous DAR studies that using radar return ratios to reduce or remove sea surface influences on SLP retrieval when slight compensation or calibration is applied (Lin and Hu, 2005). Based on current study, the ratios of the three-channel approach are very close to unity and calibration or compensation for the reflectance ratios may even not be needed. These results would significantly reduce calibration burdens for instrument development and SLP retrievals.
For near nadir incidence angles, NRCS drops rapidly at weak wind conditions and may still have reasonably high values (∼8 dB) when sea surface windspeed reaches as high as 15 m/s. NCRS generally is above 0 dB until the incidence angle increases to about 15°, the largest angle of instrument scanning. Sea surface wind direction or azimuth angle has some impacts on radar returns, but generally within about 3 dB.
Error analysis shows that the errors in sea surface slope PDFs could introduce considerable impacts on sea surface reflectance and NRCS estimates. With the uncertainties of sea surface roughness (or mean square slope) reported previously, the errors in sea surface slope PDF and probability are expected to be about 20% though for individual cases the errors could be much higher. Sea surface wind speed errors introduced by satellite observations could lead about 10% or more slope PDF errors in the reflectance and NRCS calculations. However, these PDF errors may not produce significant errors in SLP retrievals because of the cancellation in the ratios of radar returns (or in the reflectance ratios of frequency pairs). These results are basically consistent with our expectations. Compared to previous studies, this study, however, has quantified the influence of sea surface reflection variations on SLP retrievals besides providing an effective tool in sea surface reflection analysis for V-band DAR applications.
In summary, the impact of sea surface reflection variations with sea surface temperature, wind, and salinity on SLP retrievals are mitigated when the ratios of frequency-paired DAR signals, especially the ratios of three-channel approach, are used. Also, reasonably strong radar power can be obtained to maintain sufficient SNR when the radar scanning angle is controlled within about ± 15° relative to nadir.
Future studies will extend current simulations to more extreme geophysical conditions such as extreme winds with considerable sea sprays and rain cases. Besides these simulations, future field experiments and sea surface reflectance measurements are needed to obtain V-band data in various environmental conditions and validate present results. These efforts will further advance current understanding of the sea surface reflectance on its related geophysical variables.
Data availability statement
The original contributions presented in the study are included in the article/Supplementary Material, further inquiries can be directed to the corresponding author.
Author contributions
BL conceptualized the study and established the modeling framework. YH and XC helped the modelling effort. MM proposed current V-band differential absorption radar with the support from LL, SH, and JC for system design and engineering development. GH and NP initialized the potential of airborne and spaceborne science applications. KH contributed for sea surface properties.
Funding
All efforts of this study were supported by NASA Earth Science Instrument Incubator Program for the Microwave Barometric Radar and Sounder (MBARS) project.
Acknowledgments
The authors would like to thank the Instrument Incubator Program of the NASA Earth Science Technology Office for its financial support on this study. The management of NASA Langley Research Center and Goddard Space Flight Center provides valuable manpower for this research.
Conflict of interest
Author XC was employed by the company Science Systems & Applications, Inc. Author JC was employed by the company Tomorrow.IO.
The remaining authors declare that the research was conducted in the absence of any commercial or financial relationships that could be construed as a potential conflict of interest.
Publisher’s note
All claims expressed in this article are solely those of the authors and do not necessarily represent those of their affiliated organizations, or those of the publisher, the editors and the reviewers. Any product that may be evaluated in this article, or claim that may be made by its manufacturer, is not guaranteed or endorsed by the publisher.
References
Apel, J. (1994). An improved model of the ocean surface wave vector spectrum and its effects on radar backscatter. J. Geophys. Res. 99 (16), 16269. doi:10.1029/94JC00846
Barker, D., Huang, W., Guo, Y. R., Bourgeois, A., and Xiao, Q. (2004). A three-dimensional variational data assimilation system for MM5: Implementation and initial results. Mon. Weather Rev. 132, 897–914. doi:10.1175/1520-0493(2004)132<0897:atvdas>2.0.co;2
Barker, D. M., Huang, W., Guo, Y. R., and Bourgeois, A. (2003). “A three-dimensional variational (3DVAR) data assimilation system for use with MM5,” in NCAR tech. Note (Boulder, CO, USA: NCAR/TN-453+STR), 68.
Breon, F., and Henriot, N. (2006). Spaceborne observations of ocean glint reflectance and modeling of wave slope distributions. J. Geophys. Res. 111, C06005. doi:10.1029/2005JC003343
Camargo, S., Robertson, A., Gaffney, S., Smyth, P., and Ghil, M. (2007). Cluster analysis of typhoon tracks. Part II: Large-scale circulation and ENSO. J. Clim. 20, 3654–3676. doi:10.1175/jcli4203.1
Centurion, L., Horányi, A., Cardinali, C., Charpentier, E., and Lumpkin, R. (2017). A global ocean observing system for measuring sea level atmospheric pressure: Effects and impacts on numerical weather prediction. Bull. Amer. Met. Soc. 98, 231–238. doi:10.1175/BAMS-D-15-00080.1
Contreras, R. F., and Plant, W. J. (2006). Surface effect of rain on microwave backscatter from the ocean: Measurements and modeling. J. Geophys. Res. 111, C08019. doi:10.1029/2005JC003356
Cox, C., and Munk, W. (1956). Slopes of the sea surface deducted from photographs of sun glitter. Bull. Scripps Insti. Oceanogr. 6, 401–488.
Cox, C., and Munk, W. (1954). Statistics of the sea surface derived from sun glitter. J. Mar. Res. 13, 198–227.
Dirren, S., Torn, R., and Hakim, G. (2007). A data assimilation case study using a limited-area ensemble Kalman filter. Mon. Wea. Rev. 135, 1455–1473. doi:10.1175/MWR3358.1
Donelan, M. A., and Pierson, W. (1987). Radar scattering and equilibrium ranges in wind-generated waves with application to scatterometry. J. Geophys. Res. 92, 4971–5029. doi:10.1029/JC092ic05p04971
Elfouhaily, T., Chapron, B., Katsaros, K., and Vandemark, D. (1997). A unified directional spectrum for long and short wind-driven waves. J. Geophys. Res. 102 (15781–15), 15781–15796. doi:10.1029/97JC00467
Ellison, W., Balana, A., Delbos, G., lamkaaouchi, K., Eymard, L., Guillou, C., et al. (1998). New permittivity measurements of seawater. Radio Sci. 33, 639–648. doi:10.1029/97rs02223
Foti, G., Gommenginger, C., Jales, P., Unwin, M., Shaw, A., Robertson, C., et al. (2015). Spaceborne GNSS reflectometry for ocean winds: First results from the UK Tech Demo Sat-1 mission. Geophys. Res. Lett. 42, 5435–5441. doi:10.1002/2015GL064204
Holton, J. R. (1979). An introduction to dynamic meteorology. Second Edition. New York: Academic Press, 416.
Hossan, A., and Jones, W. L. (2021). Ku- and ka-band ocean surface radar backscatter model functions at low-incidence angles using full-swath GPM DPR data. Remote Sens. 13, 1569. doi:10.3390/rs13081569
Hughes, B., Grant, H., and Chappell, R. (1977). A fast response surface-wave slope meter and measured wind-wave moments. Deep-Sea Res. 24, 1211–1223. doi:10.1016/0146-6291(77)90524-0
Ingleby, B., and Isaksen, L. (2018). Drifting buoy pressures: Impact on NWP. Atmos. Sci. Lett. 19, e822. doi:10.1002/asl.822
Karaev, V., Panfilova, M., Titchenko, Y., Meshkov, E., Balandina, G., Kuznetsov, Y., et al. (2015). Russian scatterometer: Discussion of the concept and the numerical simulation of wind field retrieval. Intern. J. Rem. Sens. 36, 6056–6084. doi:10.1080/01431161.2015.1110637
Klein, L., and Swift, C. (1977). An improved model for the dielectric constant of sea water at microwave frequencies. IEEE J. Ocean. Eng. 2, 104–111. doi:10.1109/tap.1977.1141539
Lawrence, R., Lin, B., Harrah, S., Hu, Y., Hunt, P., and Lipp, C. (2011). Initial flight test results of differential absorption barometric radar for remote sensing of sea surface air pressure. J. Quantitative Spectrosc. Radiat. Transf. 112, 247–253. doi:10.1016/j.jqsrt.2010.06.001
Lawrence, R., Lin, B., Harrah, S., and Min, Q. (2012). “Differential absorption microwave radar measurements for remote sensing of barometric pressure,” in Remote sensing - advanced techniques and platforms”. Editor B. Escalante (InTech). Available at: http://www.intechopen.com/books/remote-sensing-advanced-techniques-and-platforms/differential-absorptionmicrowave-radar-measurements-for-remote-sensing-of-barometric-pressure.
Li, L., Heymsfield, G. M., Tian, L., and Racette, P. E. (2005). Measurements of ocean surface backscattering using an airborne 94-GHz cloud radar—implication for calibration of airborne and spaceborne W-band radars. J. Atmos. Ocean. Tech. 22, 1033–1045. doi:10.1175/jtech1722.1
Lin, B., Hu, Y., and Min, Q. (2021). Assessing surface air pressure sensing using high frequency O2-absorption radar system. JQSRT 261, 107425. doi:10.1016/j.jqsrt.2020.107425
Lin, B., and Hu, Y. (2005). Numerical simulations of radar surface air pressure measurements at O2 bands. Geosci. Rem. Sens. Lett. 2, 324–328.
Lin, B., and Min, Q. (2017). Optimal frequency selection of multi-channel O2-band differential absorption barometric radar for air pressure measurements. JQSRT 188, 188–191. doi:10.1016/j.jqsrt.2016.06.019
Lin, B., Minnis, P., Wielicki, B., Doelling, D. R., Palikonda, R., Young, D., et al. (1998b). Estimation of water cloud properties from satellite microwave, infrared and visible measurements in oceanic environments: 2. Results. J. Geophys. Res. 103, 3887–3905. doi:10.1029/97jd02817
Lin, B., and Rossow, W. B. (1994). Observations of cloud liquid water path over oceans: Optical and microwave remote sensing methods. J. Geophys. Res. 99, 20907–20927. doi:10.1029/94jd01831
Lin, B., and Rossow, W. B. (1997). Precipitation water path and rainfall rate estimates over oceans using special sensor microwave imager and International Satellite Cloud Climatology Project data. J. Geophys. Res. 102, 9359–9374. doi:10.1029/96jd03987
Lin, B., Wielicki, B., Minnis, P., and Rossow, W. B. (1998a). Estimation of water cloud properties from satellite microwave, infrared and visible measurements in oceanic environments: 1. Microwave brightness temperature simulations. J. Geophys. Res. 103, 3873–3886. doi:10.1029/97jd02816
Lin, B., Katzberg, S., Garrison, J., and Wielicki, B. (1999). The relationship between the GPS signals reflected from sea surfaces and the surface winds: Modeling results and comparisons with aircraft measurements. J. Geophys. Res. 104, 20713–20727.
Mass, C., and Madaus, L. (2014). Surface pressure observations from smartphones: A potential revolution for high-resolution weather prediction? Bull. Am. Meteorol. Soc. 95, 1343–1349. doi:10.1175/BAMS-D-13-00188.1
Masuko, H., Okamoto, K., Shimada, M., and Niwa, S. (1986). Measurement of microwave backscattering signatures of the ocean surface usingXband andK<sub>a</sub>band airborne scatterometers. J. Geophys. Res. 91 (13), 13065. doi:10.1029/JC091ic11p13065
Mears, C. A., Smith, D. K., and Wentz, F. J. (2015). Estimated errors in retrievals of ocean parameters from SSMIS. J. Geophys. Res. 120, 5816–5830. doi:10.1002/2014JD023049
Meissner, T., and Wentz, F. (2004). The complex dielectric constant of pure and sea water from microwave satellite observations. IEEE Trans. Geosci. Rem. Sens. 42, 1836–1849. doi:10.1109/tgrs.2004.831888
Millan, L., Lebsock, M., Livesey, N., Tanelli, S., and Stephens, G. (2014). Differential absorption radar techniques: Surface pressure. Atmos. Meas. Tech. 7, 3959–3970. doi:10.5194/amt-7-3959-2014
Min, Q., Gong, W., Lin, B., and Hu, Y. (2015a). Application of surface pressure measurements of O2-band differential absorption radar system in three-dimensional data assimilation on hurricane: Part I — an observing system simulation experiments study. JQSRT 150, 148–165. doi:10.1016/j.jqsrt.2014.08.027
Min, Q., Gong, W., Lin, B., and Hu, Y. (2015b). Application of surface pressure measurements of O2-band differential absorption radar system in three-dimensional data assimilation on hurricane: Part II — a study using the observational data. JQSRT 150, 166–174. doi:10.1016/j.jqsrt.2014.08.026
Monahan, E., and Lu, M. (1990). Acoustically relevant bubble assemblages and their dependence on meteorological parameters. IEEE J. Ocean. Eng. 15, 340–349. doi:10.1109/48.103530
Prive, N., Mclinden, M., Lin, B., Moradi, I., Sienkiewicz, M., Heymsfield, G., et al. (2022). Impacts of marine surface pressure observations from a spaceborne Microwave Barometric Radar and Sounder investigated with an observing system simulation experiment. J. Atmos. Ocean. Tech. 119, 10232–10246. doi:10.1002/2014JD021890
Radnóti, G., Bauer, P., McNally, A., and Horányi, A. (2012). ECMWF study to quantify the interaction between terrestrial and space-based observing systems on numerical weather prediction skill. Tech. Rep. ECMWF Tech. Memo. 679, 7. doi:10.21957/yvf1ceq7i
Ryabkova, M., Karaev, V., Guo, J., and Titchenko, Y. (2019). A review of wave spectrum models as applied to the problem of radar probing of the sea surface. J. Geophys. Res. 124, 7104–7134. doi:10.1029/2018JC014804
Shaw, J. A., and Churnside, J. H. (1997). Scanning-laser glint measurements of sea-surface slope statistics. Appl. Opt. 36, 4202–4213. doi:10.1364/ao.36.004202
Stiles, B. W., and Yueh, S. H. (2002). Impact of rain on spaceborne Ku-band wind scatterometer data. IEEE Trans. Geosci. Remote Sens. 40, 1973–1983. doi:10.1109/tgrs.2002.803846
Tanelli, S., Durden, S. L., Im, E., Pak, K. S., Reinke, D. G., Partain, P., et al. (2008). CloudSat's cloud profiling radar after two years in orbit: Performance, calibration, and processing. IEEE Trans. Geosci. Remote Sens. 46, 3560–3573. doi:10.1109/TGRS.2008.2002030
Tang, S., and Shemdin, O. (1983). Measurement of high frequency waves using a wave follower. J. Geophys. Res. 88, 9832–9840. doi:10.1029/jc088ic14p09832
Tatarskii, V. (2003). Multi-Gaussian representation of the cox–munk distribution for slopes of wind-driven waves. J. Atmos. Ocean. Tech. 20, 1697–1705. doi:10.1175/1520-0426(2003)020<1697:mrotcd>2.0.co;2
Whitaker, J., Compo, G., Wei, X., and Hamill, T. (2004). Reanalysis without radiosondes using ensemble data assimilation. Mon. Wea. Rev. 132, 1190–1200. doi:10.1175/1520-0493(2004)1322.0.CO2
Wilheit, T. (1979). A model for the microwave emissivity of the Ocean’s surface as a function of wind speed. IEEE Trans. Geosci. Electron. 17, 244–249. doi:10.1109/tge.1979.294653
Xiao, Q., Chen, L., and Zhang, X. (2009). Evaluations of BDA scheme using the Advanced Research WRF (ARW) model. J. Appl. Meteor. Clim. 48, 680–689. doi:10.1175/2008jamc1994.1
Xiao, Q., Zou, X., and Wang, B. (2000). Initialization and simulation of a landfalling hurricane using a variational bogus data assimilation scheme. Mon. Weather Rev. 128, 2252–2269. doi:10.1175/1520-0493(2000)128<2252:iasoal>2.0.co;2
Zhang, H., and Wang, M. (2010). Evaluation of sun glint models using MODIS measurements. JQSRT 111, 492–506. doi:10.1016/j.jqsrt.2009.10.001
Keywords: sea surface roughness, sea surface wind, reflection ratio, V-band differential absorption radar, modelling of sea surface reflection
Citation: Lin B, Mclinden MW, Heymsfield GM, Hu Y, Privé N, Li L, Harrah S, Horgan K, Cai X and Carswell J (2023) Simulations of sea surface reflection for V-band O2 differential absorption radar barometry. Front. Remote Sens. 4:1105627. doi: 10.3389/frsen.2023.1105627
Received: 22 November 2022; Accepted: 30 January 2023;
Published: 13 February 2023.
Edited by:
Amen Al-Yaari, Université Paris-Sorbonne, FranceReviewed by:
Xiaolong Dong, National Space Science Center (CAS), ChinaHaiyun Xia, University of Science and Technology of China, China
Copyright © 2023 Lin, Mclinden, Heymsfield, Hu, Privé, Li, Harrah, Horgan, Cai and Carswell. This is an open-access article distributed under the terms of the Creative Commons Attribution License (CC BY). The use, distribution or reproduction in other forums is permitted, provided the original author(s) and the copyright owner(s) are credited and that the original publication in this journal is cited, in accordance with accepted academic practice. No use, distribution or reproduction is permitted which does not comply with these terms.
*Correspondence: Bing Lin, YmluZy5saW5AbmFzYS5nb3Y=