 Juzer Noman
 Willian Ney Cassol
 Sylvie Daniel
 Damien Pham Van Bang
- 1Département des Sciences Géomatiques, Université Laval, Québec, QC, Canada
- 2Centre Eau Terre Environnement, Institut National de La Recherche Scientifique (INRS), Québec, QC, Canada
The identification of bedforms has an important role in the study of seafloor morphology. The presence of these dynamic structures on the seafloor represents a hazard for navigation. They also influence the hydrodynamic simulation models used in the context, for example, of coastal flooding. Generally, MultiBeam EchoSounders (MBES) are used to survey these bedforms. Unfortunately, the coverage of the MBES is limited to small areas per survey. Therefore, the analysis of large areas of interest (like navigation channels) requires the integration of different datasets acquired over overlapping areas at different times. The presence of spatial and temporal inconsistencies between these datasets may significantly affect the study of bedforms, which are subject to many natural processes (e.g., Tides; flow). This paper proposes a novel approach to integrate multisource bathymetric datasets to study bedforms. The proposed approach is based on consolidating multisource datasets and applying the Empirical Bayesian Kriging interpolation for the creation of a multisource Digital Bathymetric Model (DBM). It has been designed to be adapted for estuarine areas with a high dynamism of the seafloor, characteristic of the fluvio-marine regime of the Estuary of the Saint-Lawrence River. This area is distinguished by a high tidal cycle and the presence of fields of dunes. The study involves MBES data that was acquired daily over a field of dunes in this area over the span of 4 days for the purpose of monitoring the morphology and migration of dunes. The proposed approach performs well with a resulting surface with a reduced error relative to the original data compared to existing approaches and the conservation of the dune shape through the integration of the data sets despite the highly dynamic fluvio-marine environments.
1 Introduction
Bathymetric data acquired by MultiBeam EchoSounder (MBES) can be used for multiple applications, the primary purpose being to produce nautical charts. These datasets with high-resolution and accuracy can also be used to study the seafloor morphology, to inspect underwater engineering structures, and for the maintenance in navigation channels by dredging operations (Debese et al., 2016). In this context, the identification of the underwater sedimentary structures and their dynamics from a DBM (Digital Bathymetric Model) is crucial to ensure safe navigation. Underwater dunes have shown to be hazardous bedforms due to their significant dimensions and their mobility on the seafloor. Hence, they represent a risk to safe navigation since shipping routes necessarily pass over dune fields and sand banks, especially nearshore to access harbors and in navigation channels (Ogor, 2018). The study of underwater dunes frequently involves a large area of interest for which a single bathymetric dataset is not sufficient. Indeed, the swath of the MBES is relatively narrow and the speed of the vessel relatively low (e.g., Five knots) which limits the covered surface per survey day. In addition, the depth variations over an area of interest may require various data acquisitions with a variety of vessels and sensors. This is particularly the case in shallow waters. Therefore, the study of these bedforms in large areas of interest requires the integration of multi-survey bathymetric datasets to produce a general DBM, particularly when studying the formation and migration of bedforms. These complex processes involve not only the bedforms themselves but the surrounding area. In such context, specific areas within a general DBM may require frequent updates in zones that are highly dynamic (e.g., field of dunes). This can be achieved by substituting the most up to date dataset within the general DBM to accurately represent the surface of the highly dynamic zones within the general DBM.
The integration of different bathymetric datasets to generate a generic seafloor surface is a complex issue. Indeed, such integration can be an intricate task, particularly in shallow waters for which bathymetric data are scarcer, acquisitions can be hazardous (Hogrefe et al., 2008) and there is a high dynamism related to the sedimentary structures present on the seafloor (Gesch and Wilson, 2001; van Dijk et al., 2012; Lefebvre et al., 2016). An additional issue is the absence of consistent vertical reference surfaces between disparate data sources, which stems from varying orthometric and tidally referenced datum. These issues are compounded by numerous technical challenges when merging heterogeneous bathymetric data collected with different types of survey instruments, varying sounding densities over a single large region and uneven sounding uncertainties. Data gaps at the coastal zone, or variations in horizontal and vertical reference systems are also problematic (Quadros, et al., 2008; Eakins and Grothe, 2014). Previous studies (e.g., Yin et al., 2008) have shown the integration process can significantly degrade the vertical and horizontal accuracy of the seafloor surface compared to the original source data and can result in artifacts caused by misclassification of feature types, reducing the usefulness of the generated surface for cartographic and geomorphologic applications. Thus, there is a need for methods to seamlessly integrate multisource, bathymetric datasets that overcome the stated challenges and problems while resulting in a surface with accuracy and uncertainty consistent with the intended uses, and without coverage gaps. Such a surface would be beneficial for a multitude of applications such as the study the hydrodynamics of water bodies, sedimentary structures, marine habitats and to provide additional information to engineering activities in marine context.
Multisource bathymetric integration has been studied extensively, mostly in the context of building navigation charts (CHS, 2012). Although they are carefully built, these charts have inherent concerns regarding their quality, especially because they are built from a jigsaw of bathymetric data within the region of interest. As such, approaches to integrate and represent in a surface the multisource soundings are highly regulated by IHO standards (CHS, 2012). While there are many such approaches, they are often site specific and do not apply for all areas. For instance, the approach proposed by the National Oceanic and Atmospheric Administration (NOAA, 2007) for coastal mapping involves a large resolution mapping greater than 5 m and is adapted to tidal environments. On the contrary, the approach proposed by Falcão et al. (2016) is highly suitable for smaller, non-fluvial rivers. It has shown inherent success for particular use cases but failed in representing detail information and at the same time minimizing the noise in bathymetric data (Buttner, 2007). One of the key steps in the continuous integration of bathymetric data is interpolation. The use of kriging has shown to be a reliable statistical tool in the interpolation of multisource datasets (Zhang et al., 2015). The authors showed that non-predictive dynamic kriging methods produce results that are better suited than other traditional interpolation methods for the study of the seafloor when it has sedimentary structures and microtopography. Still, multisource data sets have inherent differences and may produce unsatisfactory results even with the use of non-predictive kriging methods. As such, Danielson et al. (2016) proposed a new methodology in which bathymetry data is combined using non-predictive kriging methods to produce a combined bathymetry model. However, the proposed approach did not consider spatial and temporal differences from varying multisource data sets. Therefore, to our knowledge, there are currently no multisource bathymetric data integration methods in the literature that are adapted to the fluvio-marine context of the Saint-Lawrence River and that allow the production of adequate seafloor surfaces for dune migration monitoring. In this paper, we propose a new approach to fill this gap. It reconciles the uneven sounding density, resolution and uncertainty over the datasets. In addition, it relies on an adapted kriging method in order to obtain a seamless surface with a reduced error relative to the original data compared to existing methods. This approach is applied using historical bathymetric datasets to produce a seamless surface of the overall studied area within which dune fields are integrated using bathymetric time-series collected during a dedicated campaign. Furthermore the proposed results demonstrate the suitability of our solution for the extraction of underwater dunes, both small and large, in a highly dynamic environment and without artefacts in the continuity of the data boundaries. In addition, they confirm the conservation of the dune shape through the integration of the data sets, thus providing informative morphological descriptors on the environment.
The paper is organized in three sections. The first section is a description of the study area as well as the data which outlines the importance of the study of the seafloor morphology for the Saint-Lawrence River and its challenges particularly within the region of Quebec City. In the second section, a methodology is proposed to integrate and interpolate multisource MBES data for the study and analysis of bedforms. The third section presents the results of the integration and interpolation of this multisource data as well as the segmentation and characterization of underwater dunes. Furthermore the quantitative and qualitative analysis of the performance of the approach is discussed as well as its application to analyze the bedforms present in the study area. The last section presents some conclusions and perspective about further studies along the Saint-Lawrence River as well as other fluvial environments.
2 Data and methods
2.1 Study area
The Saint-Lawrence River is the river with the second largest discharge in North America with an average annual flow of 12.600 m3/s and a watershed of more than one million square kilometers (Hudon and Carignan, 2008). The estuary of the Saint-Lawrence River is a highly dynamic environment with a length of 400 km with the width ranging from a few kilometers near Quebec City to a width of over 25 km 70 km downstream (i.e., Île aux Coudres). The seafloor depth ranges down to 60 m but includes large shallow regions of depths less than 10 m. The dimensions are such that the conditions prevailing upstream (i.e., near Quebec City) are typically estuarine and those downstream are typically marine. The study area is located on the estuary of the Saint-Lawrence River, specifically within the CMQ (Communauté Métropolitaine de Québec, Eastern Canada). This area is characterized by a fluvio-marine regime with the salinity intrusion in the Saint-Lawrence with significant turbidity at zones of transition (i.e., mouths of different rivers, such as Saint-Charles and Chaudière). This region of the river is characterized by a complex seafloor topography with different physical agents being responsible for the high dynamism, such as tide, waves, wind, ship waves, and ice (Drapeau, 1992). The huge convergence effect of estuary in our study site amplifies tidal signal and increase its asymmetry with ebb tide longer than flood tide. The study area also involves significant variation in the bed surface morphology from fine sand less than 2 μm to large rocks greater than 1 m with a distribution of aquatic plants (Matte et al., 2018). The studied area spans over 80 km and can be observed in Figure 1.
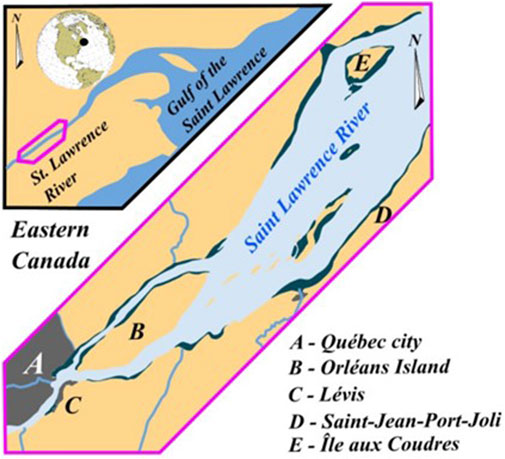
FIGURE 1. Studied area of the Saint Lawrence River estuary between Quebec City and Île aux Coudres.
Flooding is a major concern on the Saint-Lawrence River with potential for significant risks to public safety as well as a negative economic and social impact. This project is part of a research consortium called OSIRISQ, funded by the Réseau Québec Maritime and working with the CMQ, to help define flooding zones along the Saint-Lawrence River. To map and assess flooding risks, a hydrodynamic model has been devised. To develop a reliable hydrodynamic model, a detailed representation of the terrain and channel morphology is a critical component. Due to the complex nature of the topography of the Saint-Lawrence and its strong effect on the hydrodynamics of the river, it is necessary to have a reliable and computationally efficient (with regard to the hydrodynamic model) digital elevation model of the bed of the river from the available data.
The existing models of the Saint-Lawrence River have evolved through the availability of bathymetric data. However, the DBM of the Saint-Lawrence River remains highly understudied. Although there is not a significant amount of research published specifically in the development of the DBM on the Saint-Lawrence River, there have been some hydrodynamic models that have been developed with the most recent by Matte et al. (2018). Most of these models have been limited to bathymetric data at a very coarse resolution. Therefore, in order to build a detailed representation of the terrain and channel morphology for the hydrodynamic model, a compilation of bathymetric data over the whole study area was completed. Principally Canadian Hydrographic Service Non-Navigational (NONNA) Bathymetric Data data (https://data.chs-shc.ca/dashboard/map), which is a compilation of all the data sources made available by the Canadian Hydrographic Service (CHS), has been used for this purpose. It represents the largest source of openly available bathymetric data in Canada. Within the study area from Quebec City to Île aux Coudres the NONNA data set includes 1,344 multibeam and single beam bathymetry records from 1990 to 2022. This compilation is distributed as a 10 m × 10 m grid in which each cell proposes the most recent and the shallowest bathymetric data point selected from the entire database.
A recent study has shed light on the high impact of the bedforms on hydrodynamic modelling (Danielson et al., 2016). To study such impact of the bedforms on the seafloor surface, dedicated MBES data is usually necessary to produce a high resolution DBM. This is why we conducted a MBES bathymetric campaign in July 2022 to generate a high resolution DBM of bedforms in the studied area. The primary purpose was to enhance the hydrodynamic model for the use in the prediction of flooding risks of the Saint-Lawrence River within the region of the Community Metropolitan of Quebec (CMQ). As such, one particular zone in the region of Quebec City was selected for the presence of highly dynamic field of dunes. The secondary purpose of the campaign was to observe and characterize the temporal evolution of the dunes.
The data was acquired from 10th July to 21 July 2022 with a hydrographic system consisting of a Kongsberg EM2040 MBES, an Applanix POS-MV320 and two GNSS antennas (Trimble GA830 and 540AP) embedded in the Louis-Edmond-Hamelin vessel. The region of interest is shown in Figure 2. In this region, the seafloor was surveyed repeatedly once a day between 9:00 a.m. and 12:00p.m. over a period of four consecutive days. Data from the NONNA database used for the hydrodynamic model was integrated into the Summer 2022 surveys in order to improve the final DBM, notably by filling in data gaps and completing the surface in the areas surrounding the survey.
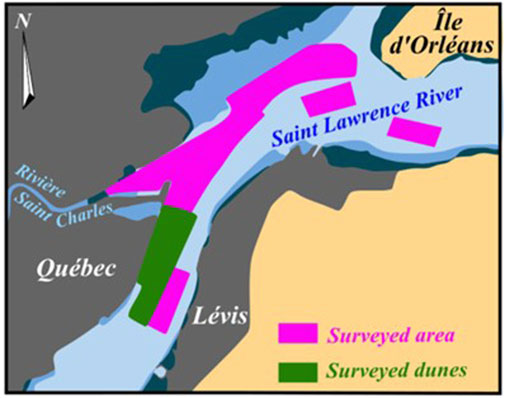
FIGURE 2. Surface covered on the data acquisition in Summer of 2022 on the fluvial estuary of the Saint-Lawrence River.
2.2 Multisource bathymetric data integration proposed approach
This approach notably considered the different times of acquisition, in addition to the varying density of the datasets. The devised integration approach overcomes this heterogeneity of the bathymetric point clouds and provides a combined interpolated surface suitable for the study of bedforms. The main steps involved in the proposed integration approach are presented in Figure 3.

FIGURE 3. Main steps of the proposed integration approach of multisource bathymetric data.
The first step was dedicated to the dataset preparation. It aimed to select the soundings from different datasets according to a pre-defined criteria and to transform the selected data into a uniform horizontal and vertical reference system. The second step was dedicated to the DBM creation and the integration of the soundings into the surface while considering the overlap between datasets. The third and last step concerned the development of a seamless surface that preserved the information about the bedforms and the microtopography present on the seafloor. The accuracy of the multisource DBM was also addressed in this third step. The following sections provide more details about the three steps of the proposed approach. Following which the underwater dune extraction from the multisource DBM is described in Section 2.3.
2.2.1 Dataset preparation
The data preparation was completed by two independent processes. The first process consisted of the selection of the soundings from data that was acquired at different times over the same area. The selection criteria relied on the data uncertainty, the period of the survey or the density of the dataset (Danielson et al., 2016). Eakins and Grothe (2014) proposed that the most recent and the highest resolution soundings may be chosen. This criterion was considered in our approach to maintain the details of the bedforms, which could be misrepresented due to temporal changes between datasets. To create a coherent DBM using multisource data, the overlap among data sets was evaluated, as well as situations where the soundings of one dataset may supersede another. Preference was given to a more recent collection or a collection with a more advanced sensor since it may represent the surface more accurately than a combination of points from both datasets. Generally, recent data is more accurate resulting in a better representation of the seafloor surface. To accomplish this, a GIS database index was created of all the available data indicating their spatial extents. Information such as the date of the survey and the type of equipment used in addition to the global error of each dataset was integrated into the GIS index. With these parameters integrated into the index of each individual data source, the most recent and most accurate data sources were prioritized in overlapping areas.
The second process aims to standardize the horizontal and vertical reference system of the datasets. Although this issue is well studied, the vertical reference remains a great source of error in the creation of multisource DBM (Eakins and Grothe, 2014). Even though the CHS establishes the relationship between tidal and orthometric datums by surveying benchmarks at tide gauge stations, there are discrepancies between surveys due to various errors inherent to the bathymetric survey process. As such to correct this discrepancy in vertical references, all the data was first reprojected in the same horizontal and vertical datum, namely, UTM19 NAD83 (CSRS), CGVD28 (HT2.0) for the study area. Then, the vertical reference was adjusted to a uniform surface. The method proposed by Gesch and Wilson (2001) is used for this purpose. It involves the use of tidal separation surfaces, a solution developed by the CHS specifically for the conversion of elevation data from one tidal datum to another (Milbert and Hess, 2001). Such transformation ensures that individual datasets do not introduce vertical reference errors that may cause artefacts in the surface misrepresenting the bedforms.
2.2.2 Bathymetric data integration
The second step of the proposed approach started with the grid selection for the surface representation. It addressed the determination of the grid structure, the cell size and the mechanism to select the points contributing to each cell. The grid design has a great impact on the DBM. The seafloor surface generated from the same MBES data considering either a structured grid or a non-structured grid may be drastically different. A structured grid usually has a uniform grid cell with a rectangular shape. The depth value is attached to the nodes (i.e., corners) or at the center of each cell. On the contrary, an unstructured grid, such as a Triangulated Irregular Network (TIN), has grid cells with a triangular shape. In these structures, the depth values are attached to each node of the triangles. In the proposed approach, a structured grid, namely, a raster surface, was used. Indeed, a TIN is commonly used for bathymetric studies due to the flexible structure and size (Danielson et al., 2016). However, TIN surfaces can be a source of artefacts which is a strong drawback for the underwater environment as it is very difficult to validate the origin of artefacts in the MBES point clouds. Structured surfaces (i.e., raster) are therefore used to avoid these artefacts. The cell resolution needs to be well estimated in the generation of a structured grid to ensure that sufficient detail is represented in areas with an irregular topography (i.e., shoreline, dunes) and in areas of uniform depth (Eakins and Grothe, 2014). Furthermore, the cell size of the grid needs to consider the density of the bathymetric data and its uncertainty value (CHS, 2012). In addition, the size of the bedform being mapped must also be considered to ensure that the grid size is smaller than the feature. This can be particularly challenging as this may vary throughout the surface. A multiresolution surface is a potential option, but this type of surface can create significant problems for statistical analysis as the sample size density would not remain uniform throughout the area and would become more challenging. Therefore, a regular gridded surface is the most relevant choice for the representation of DBM since this surface is complete and coherent for the entire study area (Danielson et al., 2016). In our approach, the grid resolution considered was 1 m since the acquired datasets are significantly dense with a minimum density of 1 point/m2.
Once the grid was created, the differences in characteristics among the multisource datasets (i.e., density, resolution, uncertainty) needed to be addressed and harmonized. Such differences may stem from the data acquisition methods or temporal changes in the seafloor surface (e.g., Seasonal changes, evolution of the seafloor surface). Different approaches are proposed in the literature for combining multiple data sets into a single, continuous surface (Gesch and Wilson, 2001; Danielson et al., 2016). These include stitching (Gallant and Austin, 2009), the least cost method (Melles et al., 2011) and many others that provide results that would be suitable for the purpose of the study (Danielson et al., 2016). In the framework of the proposed approach, we chose the feathering method (Steed and Rankin, 2003), whose principle is described in Figure 4. This method was well suited for the study of bedforms as it maintained the integrity of the form in individual surfaces when integrating surfaces with different resolution. It provided a smooth transition between multiresolution and multitemporal datasets that is common in areas with highly fluctuating terrain and highly dynamic areas. In this method, each dataset was delimited on the grid to produce a buffer with its size proportional to the extent of the data. This buffer was then used to select the survey lines encompassed within overlapping regions. The overlapping survey lines were then used to extract alternating lines from abutting datasets to produce a combined dataset.
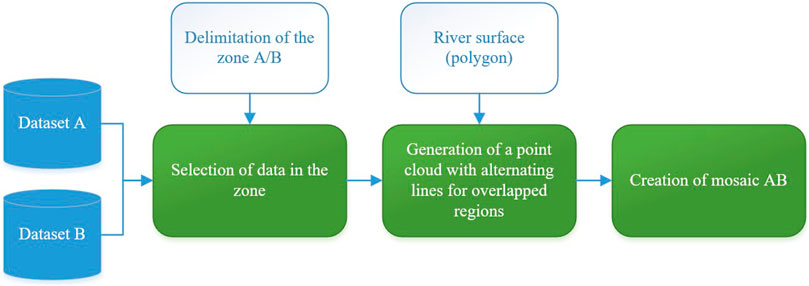
FIGURE 4. Main steps involved in the feathering method to combine heterogeneous datasets.
2.2.3 Bathymetric data interpolation
The third step of the proposed approach concerns the data interpolation. The selection of an appropriate method was important to obtain a smooth surface, without artifacts and misrepresented features. There are many interpolation techniques for gridding elevation data, including spline, inverse distance weighting (IDW), natural neighbors, triangulation, and kriging, all of which create significantly different surfaces when built from the same data source (Eakins and Grothe, 2014; Maune and Nayegandhi, 2019). The interpolation method provides consistent results when the data characteristics (e.g., density, uncertainty) are uniform. On the contrary, if the data characteristics are uneven the interpolation method is key to ensure that each dataset is best represented in the DBM. In the proposed approach, the multisource bathymetric data was interpolated using an Empirical Bayesian Kriging (EBK) method (Zhang et al., 2015). The EBK method was an excellent choice in interpolating between varying bathymetric data sets for the following reasons: It uses an intrinsic random function, which is useful in rectifying spatial trends in the input data inherently present in temporal changes between datasets. In addition, the EBK method is a non-stationary kriging method, which predicts the semivariogram (i.e., a function computing the differences between soundings at varying distances) based on the local data. The EBK method achieves this by estimating the error in the underlying semivariogram through repeated simulations. As such, the kriging value estimated for each cell was best suited for representing the soundings related to the cell. In this work, we used the same approach as Danielson et al. (2016) to implement the EBK method.
2.2.4 Estimating the error of the multisource digital bathymetric model
The estimation of the error of multisource DBM is highly unexplored. Although the errors associated with each individual dataset is representative of the error in the data source, they are not representative of the error of the DBM that is produced through the integration of these data sources. The spatial distribution of the error in the integration of the multisource bathymetric data is very challenging to determine. As such, assessments of the accuracy of DBM tend to result in a single measure of how closely the DBM depth values represent the real depth. Different statistics associated to the accuracy can be considered, such as Root Mean Square Error (RMSE) and standard deviation of the error (Carlisle, 2002). Although these values summarise elevation errors in a DBM as a single value and are highly useful in determining the overall accuracy of the DBM, there is an interest in defining this error spatially across the DBM through an error surface (Canters et al., 2002). The representation of the spatial distribution of the errors of the DBM through an error surface may be a critical factor in the interpretation of the results. This is the reason why we have included the elaboration of this error surface as the last step of our approach.
One way to assess the accuracy of the DBM is to use the cross-validation technique. This is a geostatistical approach aiming at comparing predicted values in the model to actual observed values. The comparison is done by removing one data location at a time and predicting the associated data value (Danielson et al., 2016). The predicted and actual values at the location of the omitted point are compared, and this process is repeated for all points in the dataset. Cross-validation error is typically represented as RMSE and can be an excellent representation of a global uncertainty of the DBM (Gesch and Wilson, 2001). However, to interpret the spatial variability of the surface, the error must be modelled across the entire surface. Cross-validation provides error estimation only in some locations. The predictive uncertainty that is computed with the EBK method can be considered as the error associated with the uncertainty of the surface as pioneered in Burrough and McDonnell (1998). As such, the error of the DBM resulting from the proposed approach was represented by the error surface of the residuals of the EBK associated to the modelled surface.
2.3 Underwater dunes extraction from a DBM
The presence of underwater dunes in the Estuary of the Saint-Lawrence River is intimately related to the fluvio-marine context of this area. Once the bathymetric data was processed and the DBM was properly generated, the underwater dunes were extracted from this surface using different approaches (e.g., Debese et al., 2016; Di Stefano and Mayer, 2018; Ogor, 2018). Cassol et al. (2021; Cassol et al., 2022a) proposed an automated segmentation and characterization approach for underwater dunes in the fluvio-marine context of the Saint-Lawrence River. This approach considers only the bathymetric information of the seafloor. Multi-modal approaches considering grain-size, current and tide as well as acoustic backscatter information may be further discussed in the paper. Unlike existing approaches, the latter does not involve any manual intervention to delineate bedforms, which limits subjectivity, cumbersomeness and sources of error in the analysis of the surface. The approach segments and characterizes the underwater dunes using OBIA (Object-Based Image Analysis), image processing and landform ontologies from a regular gridded DBM. The main steps of this approach are presented in Figure 5.
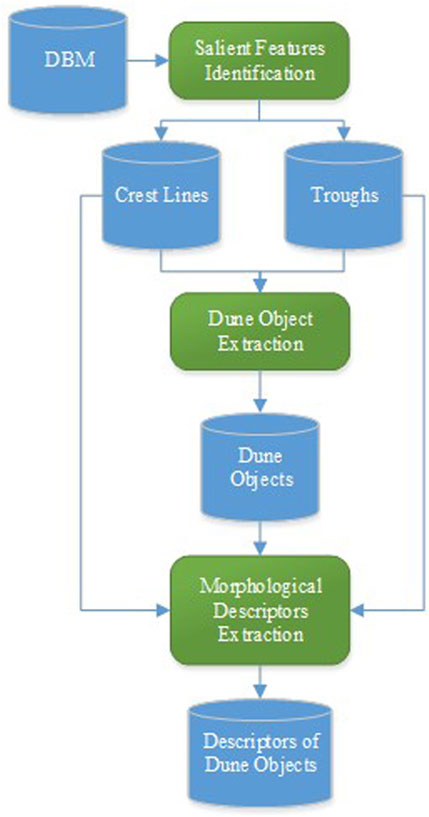
FIGURE 5. Approach for the automatic segmentation and characterization of dune objects from a DBM. Adapted from Cassol et al. (2022b). Reproduced under CC-BY-4.0.
The segmentation and characterization approach considered that the underwater dunes could be identified on the seafloor by three salient features, namely, the crest line, the stoss trough and the lee trough. The crest line is the linear feature located in the higher zone of the dune. This feature is the upper bound of both sloping sides of the dune (i.e., Stoss and lee sides). The stoss and lee troughs represent the boundary of the dune objects, being also represented by linear features. These troughs bound the stoss and lee sides, respectively. A morphometric analysis of the seafloor was first carried out using the Geomorphon algorithm (Jasiewicz and Stepinski, 2012) to identify the three salient features. Then, the troughs were matched with their corresponding crest lines. This matching was done by searching the troughs nearest to the crest lines. The search is conducted in the orthogonal direction of the crest line orientation with a predefined range distance limit. Afterwards, the dune object was created by aggregating the pixels located in the area between the crest line and the troughs. Mathematical morphology and image processing are used to extract and better delineate the dune object. The result is the dune object identified by the same label as its crest line. Once the dunes had been segmented from the DBM, a characterization of these objects could be done calculating a series of morphological descriptors. These descriptors consider the dune object segmented itself as well as its salient features. The main descriptors considered in the characterization were the dune orientation, depth, width, height, stoss, and lee angles, stoss and lee widths and the symmetry index of the dunes. More details about the segmentation approach and the estimation of the morphological descriptors can be found in, respectively, Cassol et al. (2021) and Cassol et al. (2022b). Figure 6 schematizes the segmentation and characterization approach from a DBM.
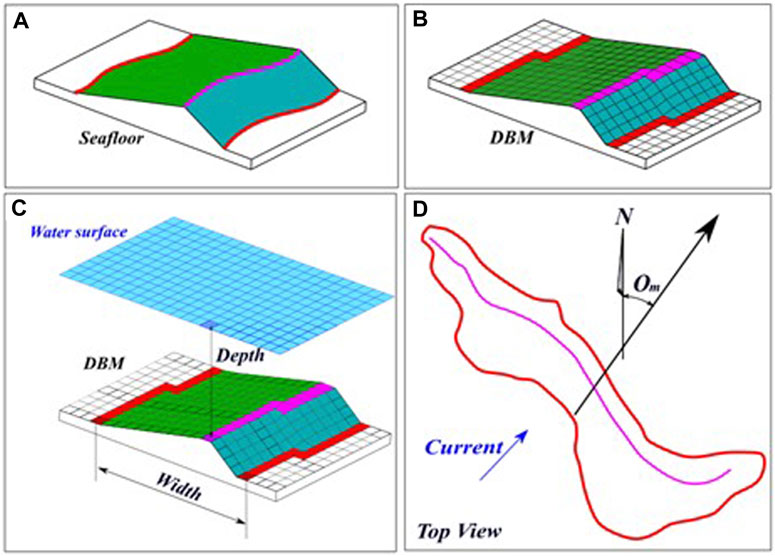
FIGURE 6. The dune object segmented and characterized. In (A), the dune object on the seafloor with its salient features, crest line (magenta) and troughs (red). In (B), the dune object is identified on the DBM grid and segmented considering the salient features. (C,D) schematize the extraction of morphological descriptors with the depth and width of the dune object [cf. (C)] and the orientation of the underwater dune measured from the north [cf. (D)]. Adapted from Cassol et al. (2022b). Reproduced under CC-BY-4.0.
3 Results and discussion
This section presents the results and a discussion of the application of our proposed approach to generate a multisource DBM. This surface is generated considering the acquired data mentioned in the previous section as well as the existing historical NONNA data of the study area. The evaluation of the approach is completed using both qualitative and quantitative methods. The qualitative methods are consisting of creating cross sections and comparing the bedforms as well as investigating the presence of artefacts from the combined data sets. While as the quantitative analysis is based on the mean error and standard deviation of the residuals, i.e., RMSE of the combined surfaces. Since the analysis is based on evaluating the performance of the integration of the datasets and not the error of the individual datasets, the RMSE is a good quantitative indicator for the performance of the approach. This indicator is then used to compare with other existing approaches found in the literature for combining multisource bathymetric data. The discussion is based on evaluating the performance of the proposed approach in two ways. The first consists in a comparison between existing approaches and ours, while the second consists of a spatiotemporal analysis of the seafloor with the segmentation and characterization of underwater dunes. Furthermore, the discussion demonstrates that the extraction of these bedforms from the combined surface provided by our approach allows the interpretation and analysis of the seafloor morphology over time.
3.1 Multisource DBM and quantitative performance analysis
To assess the performance of our approach, we compared it with two approaches in the literature dedicated to multisource DBM creation. The first approach proposed by Falcão et al. (2016) was devised for rivers. The second approach proposed by the NOAA (2007) was devised for coastal areas. We included an additional comparison involving our approach but without the integration step (i.e., feathering) prior to the interpolation of the bathymetric data. This step permits to tackle spatial and temporal differences among datasets. This is the major and significant difference between our methodology and the one proposed by Danielson et al. (2016), which only considers spatial differences.
The comparison among the four approaches concerned the error surface produced after the integration of the historical data from NONNA and the July 2022 datasets. As we do not have any ground truthing data, given the dynamism of the environment, the goal was not to determine the approach that offers a minimal error with respect to the seafloor. Rather, it was to estimate the approach that proposed the most coherent integration between the different sources. In this context, the use of the error surface was relevant. Indeed, the error surface is representative of the deviations (i.e., Variations) between the soundings and the DBM surface. It is therefore a tangible indicator of the representativeness of the surface produced with respect to the datasets that participated in its construction.
Figure 7 synthesizes the results of the comparison. The performance of the combined multisource DBM was evaluated for two different contexts: Shallow water (i.e., depths below 20 m), and deep water (i.e., Deep water representing above 20 m). The differentiation of these two contexts is justified by the fact that the hydrodynamics of the Saint-Lawrence River is significantly different at varying depths specifically below and above 20 m (Drapeau, 1992; Matte et al., 2018).
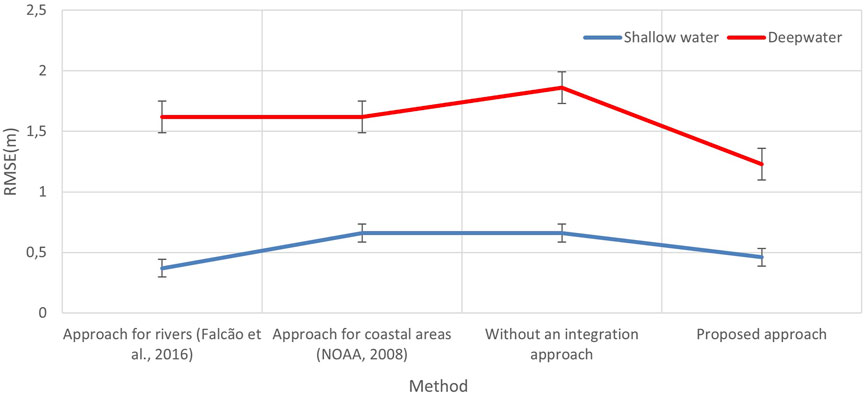
FIGURE 7. Root Mean Square Error (RMSE) between measured and predicted values in the DBM surfaces using four multisource approaches: the first one dedicated to rivers (Falcão et al., 2016); the second one dedicated to coastal areas (NOAA, 2008); the third being our approach without the integration step; the fourth one being our proposed approach.
In Figure 7, it can be observed that there is a significant reduction in the mean error in the deep-water context using the proposed methodology. This represents an improvement of about 25% compared to the average error of the approaches dedicated to rivers and coastal areas respectively. In shallow waters, the approach proposed by Falcão et al. (2016) produced the best mean error followed by our approach. Thus, overall, our proposed approach can be considered the most successful in reconciling the variations between the different data sets, involving a depth diversity like in the estuary of the Saint-Lawrence River. In terms of standard deviation of the mean error, we again observe that, in shallow waters, the approach proposed by Falcão et al. (2016) is the best followed by our approach. However, the latter shows an increase of the standard deviation in the deep-water context. This could be related to the greater dune migration in the deeper zone, as will be illustrated later. As such, it can be inferred that the selection and integration criteria of the proposed approach, involving the most recent soundings, yield a larger standard deviation of the mean error of the multisource DBM. However, the resulting DBM surface is more representative of current state of the dunes on the seafloor as a result of such criteria.
When comparing the proposed approach with and without the use of grid selection as well as feathering, the contribution of this integration step in the process is obvious. The mean error has been significantly improved in shallow water and even more in deep water (about 34%). Likewise, the standard deviation of the mean error has decreased with a fair margin (40%). This integration step allows the temporal differences between datasets to be consolidated prior to the interpolation of soundings. This step also ensures that overlapping area between datasets are integrated maintaining the morphological form of bedforms. In addition, it minimizes artefacts introduced by the interpolation and the presence of seam lines in the multisource DBM which will be illustrated in the next section.
3.2 Spatial and temporal differences in acquired bathymetric data
The multisource DBM generated with our approach, considering the 4 days of acquisition, can be observed in Figure 8A. No apparent artefacts along the seam lines of the individual datasets can be observed. A cross section profile has been selected through a field of dunes, shown in Figure 8B. In this profile, the characteristic shape of the dunes and their sequence along the profile are observed. The integrity of the form and position of the dunes is preserved.
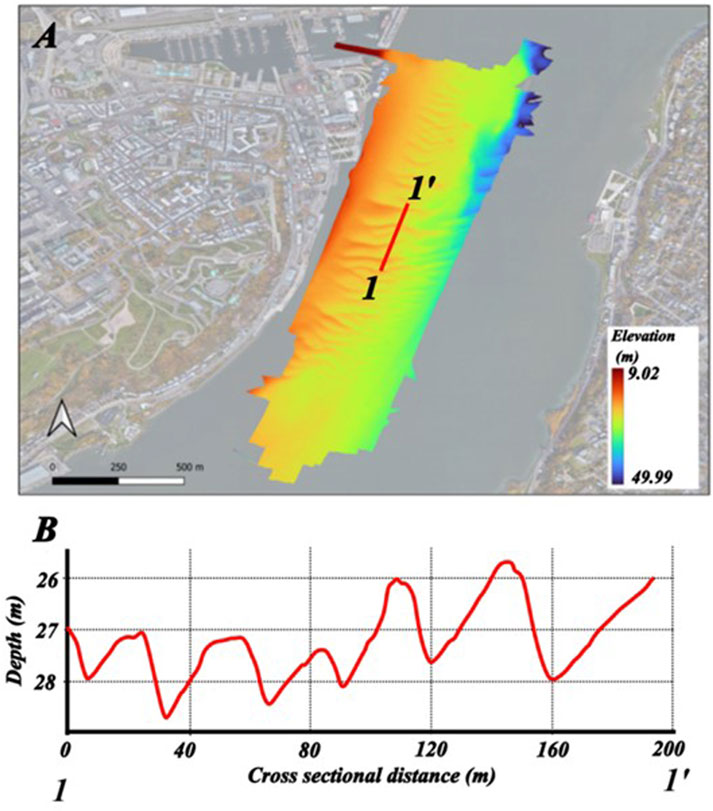
FIGURE 8. Combined multisource DBM generated with our proposed approach considering the four datasets [cf. (Panel A)] and cross section profile through the field of dunes [cf. (Panel B)].
In order to analyze, in more detail, the integration of the spatiotemporal differences, we have studied their range and significance. Figure 9 shows the differences between the individual data sets (i.e., 11th, 12th, 13th, 14th July respectively). More specifically, the surface was computed by subtracting the individual DBM of the first (i.e., 11th July) and last day (i.e., 14th July) of the survey campaign. The elevation difference highlighted in the figure for three areas involving diverse fields of dunes is intimately related to the high dynamism of the Estuary of the Saint-Lawrence River. The datasets exemplified in the July 2022 campaign are representative of the spatial and temporal changes occurring in the study area (Matte et al., 2018).
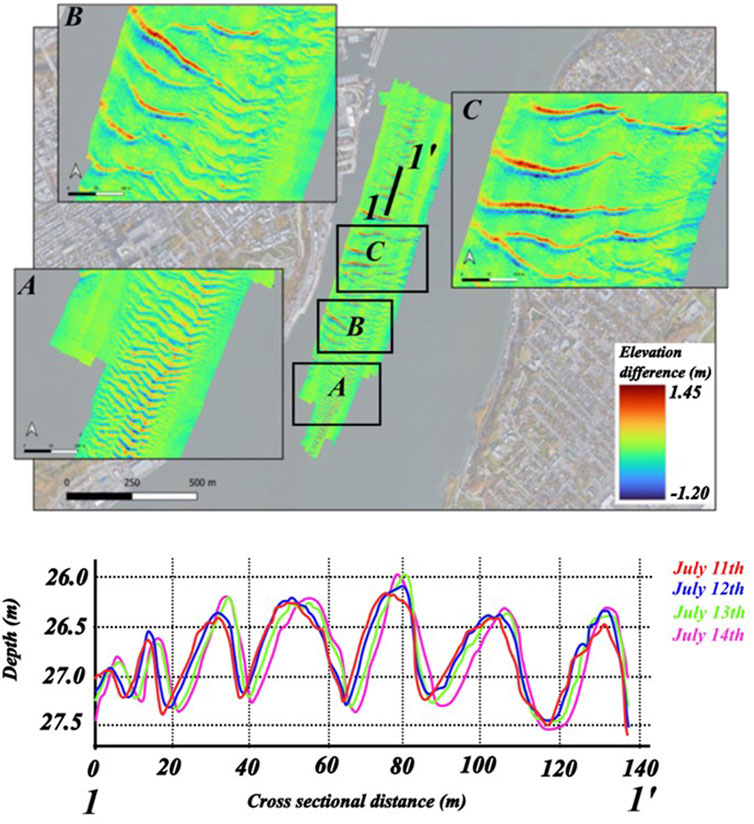
FIGURE 9. Differences in depth between the first and fourth day of the July 2022 with close-ups in (A–C) campaign and a cross sectional profile through the field of dunes showing their displacement throughout the 4 days.
We can observe that there are differences between the first day of acquisition (i.e., 11th July) and the last day (i.e., 14th July) as presented in the cross-section profile of Figure 9. Such spatial and temporal differences are attributed to the migration of the dunes. A migration rate of these dune objects up to a meter has been observed in different zones of the DBM. These spatiotemporal differences highlight the significant challenge in producing a multisource DBM that is representative of the area and furthermore an analysis of the underwater dunes. To further illustrate the multitemporal capability of our approach, we computed the DBM considering only the historical data from NONNA. This was compared to the DBM combining the historical data from NONNA and the July 2022 datasets. Figure 10A shows the combined DBM and three cross sectional profiles all extracted from the two respective DBM (cf. Figures 10B–D).
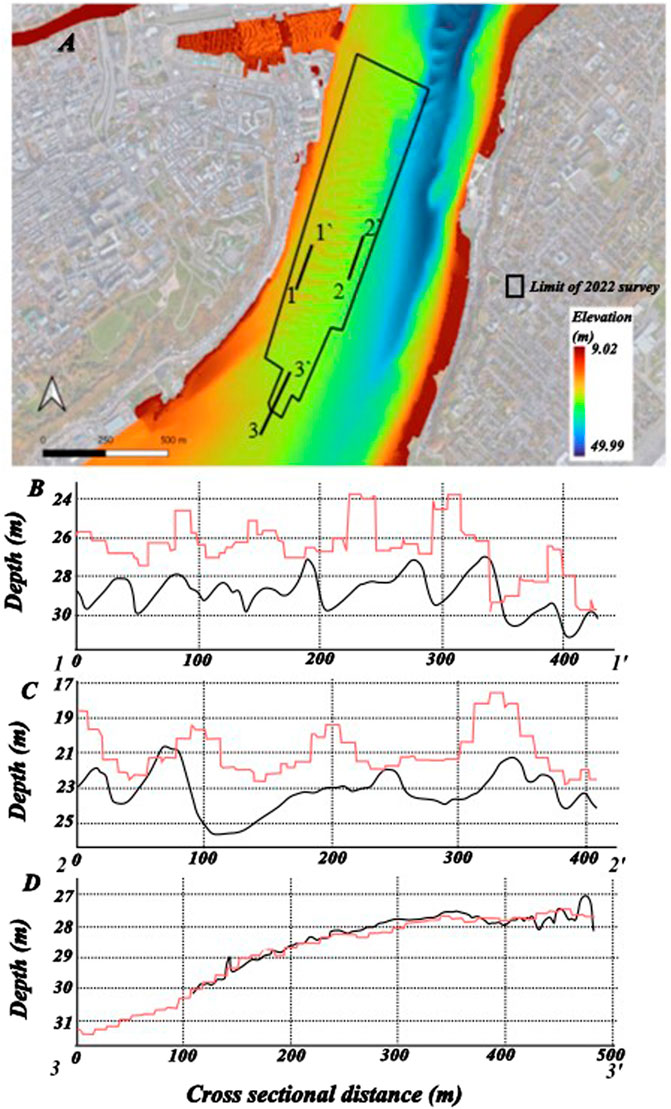
FIGURE 10. In (A), the combined multisource DBM generated with historical and July 2022 datasets. In (B–D) the cross-sectional profiles of the combined DBM with NONNA data in red and the July 2022 data display the significant differences in the existing and historical dataset while maintaining a continuity between the data boundaries.
As expected, the cross-section profiles in Figures 10B, C display significant depth gaps between the two DBM given the high dynamism of this area. However, with our integration approach, we managed resolve these gaps at the interface between the historical data and the July 2022 data. In addition, Figures 10B, C show that the detailed form of the underwater dunes, are maintained in the combined surface. Such achievement comes from the higher resolution of the July 2022 datasets compared to the historical data. Thus, our approach permits to incrementally update an existing DBM, emphasizing the most recent soundings while maintaining a continuity between existing and new data (cf. Figure 10D).
3.3 Segmentation and characterization of dunes from a multisource DBM
The dunes in the multisource DBM (cf. Figures 9, 10) were segmented and characterized with the approach previously described. The result of this segmentation is illustrated in Figure 11 for some regions of interest. In total, 164 dunes were extracted from the multisource DBM.
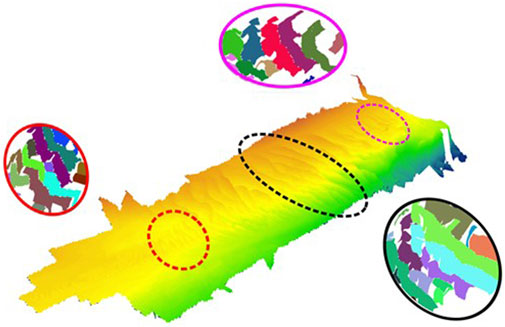
FIGURE 11. Illustration of dune objects segmented from the multisource DBM. The individual dune objects are identified by a unique random color in the ellipses which indicate their location on the seafloor surface.
In Figure 11, it is possible to observe larger dunes segmented in the center of the DBM (cf. Black ellipse area) while small dunes are observed in the north and south zones (cf. Magenta and red ellipses). The segmentation and characterization approach used to extract dunes form the multisource DBM consider the salient features of these objects. These features are identified on the seafloor from a morphometric analysis. Therefore, the performance of the segmentation approach is intimately related to the DBM grid resolution and the capacity of identification of the salient features. To analyze the performance of the segmentation and characterization of the dunes, a ground truth was built manually segmenting dunes from the multisource DBM. Therefore, three measures were computed to assess the performance, namely, the true positive, false positive and false negative rate. A true positive is considered when a minimum of 50% of the segmented dune coincides with its area in the ground truth. A false positive is considered when the area of the segmented dune coincides less than 50% in the ground truth or this structure does not have a related dune in the ground truth. A false negative is when the segmentation approach fails to segment a dune existing in the ground truth (adapted from Nguyen et al., 2020). From the multisource DBM, 87.2% of the dunes were well segmented and characterized with 12.2% of false positive and 0.6% of false negative. The false positive is essentially associated to the presence of residual salient features without the presence of a dune object. This results from the combination of different bathymetric datasets to generate the multisource DBM, which tends to neglect smaller dunes (cf. Figure 12). Only one dune was not identified (i.e., false negative) since it was partially surveyed over the 4 days of acquisition. Consequently, with more than 87% of the dunes well segmented and characterized, the multisource DBM has preserved these underwater structures and their morphological descriptors.
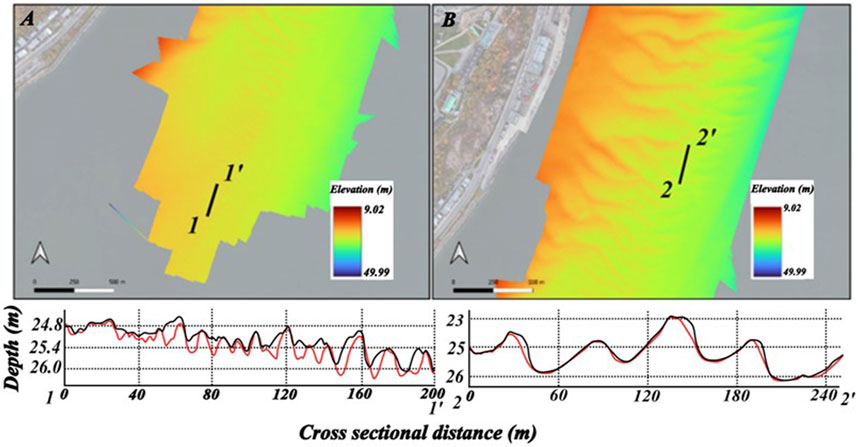
FIGURE 12. Cross-section profile through the dune fields. On the left, [cf. (A)], a profile extracted through the small dunes in the south of the study area (1-1′). On the right, [cf. (B)], a profile extracted through the larger dunes in the center of the study area (2-2′). In black, the profile of the multisource DBM and in red the profile considering only the data acquired on July 14th.
In Figure 12A, the cross-section profile shows the small dunes are merged in the multisource DBM. Consequently, the segmentation approach failed to extract dunes in this area, since the salient features are less crisp than in the single source DBM of 14th July. This segmentation failure is not seen for the larger dunes located in the center of our study area (cf. Figure 12B). Indeed, they have prominent salient features well delineate in both DBM, namely, the multisource and single source (i.e., 14th July). In addition, the dynamic of these larger structures differs from the smaller dunes of the study zone. They have an erosion-deposition regime without traction in the seafloor. Thus, there is no significant displacement observed from 1 day of acquisition to the next, favoring the maintenance of their salient features during the integration of multitemporal data. These dunes have been characterized using morphological descriptors. Their values are displayed as histograms in Figure 13.
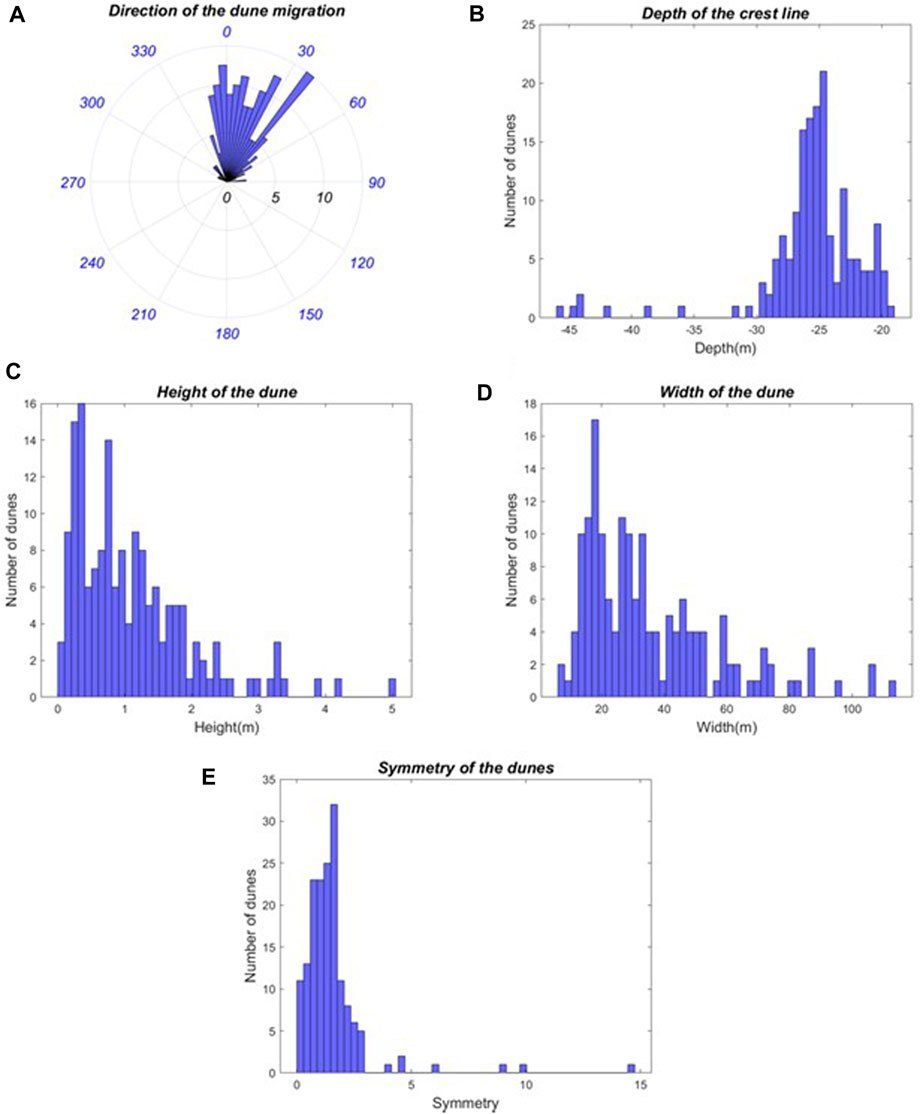
FIGURE 13. Histograms of morphological descriptors values [cf. (A–E)].
According to the orientation of the dunes (cf. Figure 13A), their migration direction can be assessed as being approximatively 36.5 (i.e., Median value), which is coincident with the main current of the Saint-Lawrence River. The dunes have a depth ranging from 19.3 m to 45.7 m (cf. Figure 13B), with a median depth value of 25.2 m. The height of dunes ranges from 7 cm to 5 m (cf. Figure 13C), with a median value of 0.86 m. They have a width varying from 6.9 m up to 100 m (cf. Figure 13D) with a median value of 29 m. As for the asymmetry index of the dunes (i.e., comparison between lee and stoss sides of the dune), the median value is 1.37 (cf. In Figure 13E). Considering these values for the morphological descriptors, the dunes of the study area are preponderantly medium and large dunes, as suggested by the dunes classification in Ashley (1990).
The quality of the DBM has an essential role when analyzing bedforms, especially in highly dynamic zones such as the fluvial estuary of the Saint-Lawrence. Based on a quantitative and qualitative analysis performed in this section, our proposed approach to generate a multisource DBM has proven to be adequate to analyze the bedforms present in the seafloor surface, even in highly dynamic zones. As mentioned above the morphological description of the larger dunes (cf. Figure 10, Figure 11B) in the DBM generated have been preserved, but to study small and medium dunes, the resolution of the considered surface must be adjusted. Although the resolution of 1 m has proven to be adequate to preserve the presence of these structures in the multisource DBM as well as to segment and characterize them. However, this resolution is intimately related to the uncertainty of the data acquisition (CHS, 2012). As such when studying small and medium dunes in highly dynamic areas, the individual daily surfaces may be considered. Therefore, to study different classes of dunes, a multisource DBM generated through a multiresolution approach may be considered. A multi-modal approach can also be considered to improve the segmentation and characterization of bedforms. Such an approach may consider the acoustic backscatter data (Masetti et al., 2018), current velocity, tidal information, and grain size. This information can be related to the hydrodynamic and environmental factors, as suggested by Le Bot (2001) and Kenyon (1970), to better model the seafloor surface and its dynamism.
4 Conclusion
The data and furthermore the DBM in this study was produced for hydrodynamic modelling and for flooding studies as well as an analysis of the dunes present in the study area. As such, the aim of the study was to develop an approach that would produce a DBM using multisource data sets that would be suitable for these applications. A visual analysis of the results shows that the approach is successful in producing a multisource DBM that represents the area and does not introduce artefacts due to spatial and temporal differences. This is further successfully tested by using this DBM to conduct an analysis of the bedforms present in the study area. In addition, a comparative analysis of the existing approaches for river and coastal environments through the variation of produced DBMs shows that this approach is the most suitable for the estuary of the Saint-Lawrence River. As such this study shows that this approach not only allows users to analyse the seafloor (i.e., morphology, topography) but in addition allows temporal studies to be conducted by integrating historical and existing data sets. Our proposed approach to generate a multisource DBM can be extended to other sections of the Saint Lawrence River. In addition, it can also be extended beyond the study of bedforms. A multisource DBM is directly related to the production of digital twins of the global seafloor as a part of the Seabed 2030 project of the Nippon foundation. As such our approach can be used to help generate digital twins that best represent the seafloor in highly dynamic zones across the globe.
Data availability statement
The raw data supporting the conclusion of this article will be made available by the authors upon reasonable request.
Author contributions
Conceptualization JN; Methodology JN and WC; Validation JN, WC, SD, and DP; Investigation JN and SD; Resources SD and DP; Data curation JN and WC; Writing—Original draft preparation JN and WC; Writing—Review and editing JN, WC, SD, and DP; Visualization JN and WC; Supervision SD and DP; Project administration SD and DP; Funding acquisition SD and DP. All authors contributed to manuscript revision, read, and approved the submitted version.
Funding
This research project was funded by Réseau Québec Maritime, Odyssée Saint-Laurent program, Grant No. 2017-2022-39557.
Acknowledgments
The authors would like to thank Université Laval and INRS for providing access to equipment and laboratories to conduct this research. In addition, they would like to thank Réseau Québec Maritime for their financial support. We must thank QPS for their help with post-processing of bathymetric data and Qimera license. We must thank Réseau Québec Maritime and REFORMAR for the financing and organization of the MBES campaign in July 2022.
Conflict of interest
The authors declare that the research was conducted in the absence of any commercial or financial relationships that could be construed as a potential conflict of interest.
Publisher’s note
All claims expressed in this article are solely those of the authors and do not necessarily represent those of their affiliated organizations, or those of the publisher, the editors and the reviewers. Any product that may be evaluated in this article, or claim that may be made by its manufacturer, is not guaranteed or endorsed by the publisher.
References
Ashley, G. M. (1990). Classification of large-scale subaqueous bedforms: A new look to an old problem. J. Sediment. Pet. 60, 160–172. doi:10.2110/jsr.60.160
Burrough, P. A., and McDonnell, R. A. (1998). Principles of geographical information systems. Oxford: Oxford University Press.
Buttner, O. (2007). The influence of topographic and mesh resolution in 2D hydrodynamic modelling for floodplains and urban areas. Geophys. Res. Abstr. 9, 08232.
Canadian Hydrographic Service (2012). Traitement et analyse de données bathymétriques de CUBE, 7. Canada: Pêches et Océans Canada.
Canters, F., Genst, W. D., and Dufourmont, H. (2002). Assessing effects of input uncertainty in structural landscape classification. Int. J. Geogr. Inf. Sci. 16 (2), 129–149. doi:10.1080/13658810110099143
Carlisle, B. H. (2002). Digital elevation model quality and uncertainty in DEM-based spatial modelling. London, United Kingdom: Unpublished Ph.D. Dissertation, University of Greenwich.
Cassol, W. N., Daniel, S., and Guilbert, É. (2021). A segmentation approach to identify underwater dunes from digital bathymetric models. Geosciences 11, 361. doi:10.3390/geosciences11090361
Cassol, W. N., Daniel, S., and Guilbert, É. (2022b). An approach for the automatic characterization of underwater dunes in fluviomarine context. Geosciences 12, 89. doi:10.3390/geosciences12020089
Cassol, W. N., Daniel, S., Guilbert, É., and Debese, N. (2022a). An empirical study of the influence of seafloor morphology on the uncertainty of bathymetric data. Mar. Geod. 45, 496–518. doi:10.1080/01490419.2022.2075499
Danielson, J. J., Poppenga, S. K., Brock, J. C., Evans, G. A., Tyler, D. J., Gesch, D. B., et al. (2016). Topobathymetric elevation model development using a new methodology: Coastal national elevation database. J. Coast. Res. 76, 75–89. doi:10.2112/SI76-008
Debese, N., Jacq, J. J., and Garlan, T. (2016). Extraction of sandy bedforms features through geodesic morphometry. Geomorphology 267, 82–97. doi:10.1016/j.geomorph.2016.05.013
Di Stefano, M., and Mayer, L. A. (2018). An automatic procedure for the quantitative characterization of submarine bedforms. Geosciences 8, 28. doi:10.3390/geosciences8010028
Drapeau, G. (1992). Dynamique sédimentaire des littoraux de l’estuaire du Saint Laurent. Géogr. Phys. Quat. 46, 233–242. doi:10.7202/032907ar
Eakins, B. W., and Grothe, P. R. (2014). Challenges in building coastal digital elevation models. J. Coast. Res. 30 (5), 942–953. doi:10.2112/jcoastres-d-13-00192.1
Falcão, A. P., Matias, M. P., Pestana, R., Gonçalves, A. B., and Heleno, S. (2016). Methodology to combine topography and bathymetry data sets for hydrodynamic simulations: Case of tagus river. J. Surv. Eng. 142 (4), 05016005. doi:10.1061/(ASCE)SU.1943-5428.0000192
Gallant, J., and Austin, J. (2009). “Stitching fine resolution DEMs,” in 18th world IMACS congress and MODSIM09 international congress on modelling and simulation, 2486–2492.
Gesch, D., and Wilson, R. (2001). Development of a seamless multisource topographic/bathymetric elevation model of Tampa Bay. Mar. Technol. Soc. J. 35 (4), 58–64. doi:10.4031/002533201788058062
Hogrefe, K. R., Wright, D. J., and Hochberg, E. J. (2008). Derivation and integration of shallow-water bathymetry: Implications for coastal terrain modeling and subsequent analyses. Mar. Geod. 31, 299–317. doi:10.1080/01490410802466710
Hudon, C., and Carignan, R. (2008). Cumulative impacts of hydrology and human activities on water quality in the St. Lawrence River (Lake Saint-Pierre, Quebec, Canada). Can. J. Fish. aquatic Sci. 65, 1165–1180. doi:10.1139/f08-069
Jasiewicz, J., and Stepinski, T. F. (2012). Geomorphons — A pattern recognition approach to classification and mapping of landforms. Geomorphology 182, 147–156. doi:10.1016/j.geomorph.2012.11.005
Kenyon, N. H., 1970. Sand ribbons of European tidal seas. Mar. Geol., 9, 25–39. doi:10.1016/0025-3227(70)90078-2
Le Bot, S. (2001). Morphodynamique de Dunes Sous-Marines Sous Influence des Marées et des Tempêtes. Processus Hydro-Sédimentaires et Enregistrement. Exemple du Pas-de-Calais (France: Université de Lille I, Villeneuve-d’Ascq). Ph.D. Thesis.
Lefebvre, A., Paarlberg, A. J., and Winter, C. (2016). Characterising natural bedform morphology and its influence on flow. Geo-Mar. Lett. 36, 379–393. doi:10.1007/s00367-016-0455-5
Masetti, G., Mayer, L. A., and Ward, L. G. (2018). A bathymetry- and reflectivity-based approach for seafloor segmentation. Geosciences 8, 14. doi:10.3390/geosciences8010014
Matte, P., Secretan, Y., and Morin, J. (2018). Erratum for “hydrodynamic modeling of the st. lawrence fluvial estuary. i: Model setup, calibration, and validation” by pascal matte, yves secretan, and jean morin. J. Waterw. Port, Coast. Ocean Eng. 144 (6), 08218001. doi:10.1061/(ASCE)WW.1943-5460.0000477
Maune, D., and Nayegandhi, A. (2019). Digital elevation model technologies and applications: The DEM user s manual. Baton Rouge, Louisiana: American Society for Photogrammetry and Remote Sensing (ASPRS).
Melles, S. J., Jones, N. E., Schmidt, B., and Rayfield, B. (2011). A least-cost path approach to stream delineation using lakes as patches and a digital elevation model as the cost surface. Procedia Environ. Sci. 7, 240–245. doi:10.1016/j.proenv.2011.07.042
Milbert, D. G., and Hess, K. W. (2001). “Combination of topography and bathymetry through application of calibrated vertical datum transformations in the Tampa Bay region,” in Proceedings, coastal GeoTools ’01. Charleston, South Carolina, January 8-11(CD-ROM).
National Oceanic and Atmospheric Administration (Noaa), (2007). Topographic and bathymetric data considerations:datums, datum conversion techniques, and data integration Part II of A roadmap to a seamless topobathy surface. Charleston, South Carolina: NOAA Coastal Services Center. Technical Report, NOAA/CSC/20114-CD.
Nguyen, T. H., Daniel, S., Guériot, D., Sintès, C., and Le Caillec, J. M. (2020). Super-resolution-based snake model—An unsupervised method for large-scale building extraction using airborne LiDAR data and optical image. Remote Sens. 12, 1702. doi:10.3390/rs12111702
Ogor, J. (2018). Design of algorithms for the automatic characterization of marine dune morphology and dynamics. Ocean, atmosphere. Brest, France: ENSTA-Bretagne. Ph.D. Thesis
Quadros, N. D., Collier, P. A., and Fraser, C. S. (2008). Integration of bathymetric and topographic lidar: A preliminary investigation. Int. Archives Photogrammetry, Remote Sens. Spatial Inf. XXXVII, 1299–1304. Part B8 (Beijing, China).
Steed, C. A., and Rankin, W. E. (2003). OAML feathering algorithm overview. Naval Research Lab Stennis Space Center MS Marine Geosciences Div. doi:10.21236/ada413681
van Dijk, T. A. G. P., van Dalfsen, J. A., Van Lancker, V., van Overmeeren, R. A., van Heteren, S., and Doornenbal, P. J. (2012). “13—benthic habitat variations over tidal ridges, north sea, The Netherlands,” in Seafloor geomorphology as benthic habitat (Amsterdam, The Netherlands: Elsevier), 241–249. doi:10.1016/B978-0-12-385140-6.00013-X
Yin, X. D., Hu, J. S., Zhang, L. H., Wu, L. D., and Chen, Y. (2008). Seamless 3D combination for bathymetric/topographic data. J. Dalian Marit. Univ. 34 (2), 19–23.
Keywords: bathymetric data integration, multibeam echosounder data, seafloor dynamics, seafloor morphology, fluvio-marine hydrodynamics, underwater dunes, dunes extraction
Citation: Noman J, Cassol WN, Daniel S and Pham Van Bang D (2023) Bathymetric data integration approach to study bedforms in the estuary of the Saint-Lawrence River. Front. Remote Sens. 4:1125898. doi: 10.3389/frsen.2023.1125898
Received: 16 December 2022; Accepted: 24 March 2023;
Published: 06 April 2023.
Edited by:
Craig John Brown, Dalhousie University, CanadaReviewed by:
Alex Cardoso Bastos, Federal University of Espirito Santo, BrazilGiuseppe Masetti, University of New Hampshire, United States
Copyright © 2023 Noman, Cassol, Daniel and Pham Van Bang. This is an open-access article distributed under the terms of the Creative Commons Attribution License (CC BY). The use, distribution or reproduction in other forums is permitted, provided the original author(s) and the copyright owner(s) are credited and that the original publication in this journal is cited, in accordance with accepted academic practice. No use, distribution or reproduction is permitted which does not comply with these terms.
*Correspondence: Juzer Noman, anV6ZXIubm9tYW4uMUB1bGF2YWwuY2E=