 Rennan de Freitas Bezerra Marujo
1*
Rennan de Freitas Bezerra Marujo
1* Felipe Menino Carlos1,2Raphael Willian da Costa1Jeferson de Souza Arcanjo1José Guilherme Fronza1,3Anderson Reis Soares1,4Gilberto Ribeiro de Queiroz1
 Karine Reis Ferreira
1
Karine Reis Ferreira
1
- 1 National Institute for Space Research (INPE), São Paulo, Brazil
- 2 Group on Earth Observation (GEO), Reston, VA, United States
- 3 The Nature Conservancy, Florianópolis, Brazil
- 4 Cognizant Technology Solutions Corporation, São Paulo, Brazil
Clouds and cloud shadows significantly impact optical remote sensing. Combining images from different sources can help to obtain more frequent time series of the Earth’s surface. Nevertheless, sensor differences must be accounted for and treated before combining images from multiple sensors. Even after geometric correction, inter-calibration, and bandpass, disparities in image measurements can persist. One potential factor contributing to this phenomenon is directional effects. Bidirectional reflectance distribution function (BRDF) corrections have emerged as an optional processing method to soften differences in surface reflectance (SR) measurements, where the c-factor is one of the available options for this task. The c-factor efficiency is well-proven for medium spatial resolution products. However, its use should be restricted to images from sensors with a narrow view since it causes subtle changes in the processed images. There are currently a limited number of open tools for users to independently process their images. Here, we implemented the required tools to generate a Nadir BRDF-Adjusted Surface Reflectance (NBAR) product through the c-factor approach, and we evaluated them for a study area using Landsat-8 and Sentinel-2 images. Several comparisons were conducted to verify the SR and NBAR differences. Initially, a single-sensor approach was adopted and later a multi-source approach. Notably, NBAR products exhibit fewer disparities compared to SR products (prior to BRDF corrections). The results reinforce that the c-factor can be used to improve time series compatibility and, most importantly, provide the tools to allow users to generate the NBAR products themselves.
1 Introduction
Analysis Ready Data (ARD) has been a prevailing trend in the last decade, enabling researchers to focus on analyzing data rather than processing it. The Committee on Earth Observation Satellites (CEOS) even started the CEOS Analysis Ready Data (CEOS-ARD) to coordinate minimum requirements for land imaging applications users (Siqueira et al., 2019). In this context, several initiatives also emerged, producing the so-called data cubes, which are solutions to prepare and organize EO data in space and time Giuliani et al. (2017).
The Brazil Data Cube (BDC) (Ferreira et al., 2020) is producing data cubes for the Brazilian territory. Its data cubes are equally spaced in time products, which is done by using a best pixel approach. BDC products use optical medium spatial resolution satellite images and are processed from single constellation products, e.g., Sentinel-2 data cubes, Landsat-8 data cubes, and CBERS-4.
Beyond the Big Data Challenges of generating and managing data for entire countries, in Remote Sensing, new image processing approaches, such as using multiple sensor images alongside, are emerging, like virtual constellations. These methods are promising as an option to increase the evaluated number of points in a time period, thereby providing denser time series (Wulder et al., 2015; Claverie et al., 2018).
Nevertheless, differences from multiple sensors must be accounted for when combining their images (Zhang et al., 2018; Kabir et al., 2020). The availability of methods capable of harmonizing optical data can allow new types of products to be generated, for instance, multi-source data cubes. In this context, different methods were developed to deal with these aspects (Gao et al., 2006; Roy et al., 2016; Frantz, 2019; Saunier et al., 2019; Hernández-López et al., 2021). Still, there are radiometric, geometric, and spectral response function differences that can affect measurements obtained by the satellite sensors.
The bidirectional reflectance distribution function (BRDF) describes how electromagnetic energy is reflected under different viewing positions Schaepman-Strub et al. (2006). Although BRDF effects exert a lesser influence on medium and narrow view sensors, such as Landsat-8/OLI (15°) and Sentinel-2/MSI (20.6°), compared to wide view sensors (Roy et al., 2016), for instance CBERS-4/WFI (28.63°) and TERRA/MODIS (49.5°), these corrections are not always accounted for (Gao et al., 2014; Zhang and Roy, 2016). These BRDF sensor viewing effects are more notable at forward scattering and backscattering reflectance differences and could affect vegetation indices trends and variability (Roy et al., 2016).
The c-factor approach (Roy et al., 2016) is an option for providing view angle corrections; it does not require any pseudo-invariant targets or previous knowledge of the land cover. This approach uses global parameters extracted from MODIS BRDF products to estimate normalized observed reflectance to nadir, also called Nadir BRDF-Adjusted Reflectance (NBAR). It can be used for a scene-based approach and has been successfully used to correct BRDF effects on images from the sensors onboard Landsat and Sentinel-2, increasing compatibility among them (Flood, 2013; Roy et al., 2016; 2017; Claverie et al., 2018; Poortinga et al., 2019; Nguyen et al., 2020) and even improving land cover change detection (Guan et al., 2020). However, the method considers the uniformity of the volumetric scattering and geometric-optical model kernels, thereby constraining its applicability for sensors with medium or narrow view angles. Also, since subtle changes are performed in the image, this procedure may affect target detection (Roy et al., 2016).
Regarding the tools required to generate the NBAR products, which include the c-factor, angle calculation, validation, and other steps, only a few works have used or shared at least part of their source code (Pahlevan et al., 2017; Frantz, 2019; Poortinga et al., 2019; Nguyen et al., 2020). Even with these advances, there is a crisis of consolidating code-sharing practices, which acts as a barrier to scientific reproducibility and replicability (Stoddart, 2016). Considering scientific research that uses computational techniques, reproducibility and replicability can be achieved by sharing the entire environments required to obtain their original results; this includes code sharing, documentation, and data organization (Peng, 2011; Nüst and Pebesma, 2020). Considering that nowadays there are many tools that allow scientists to create notebooks containing code, data, mathematical equations, and plots (Piccolo and Frampton, 2016), they should be used and encouraged.
For this research, a set of free and open-source Python libraries and scripts were created to process and evaluate Landsat-8 and Sentinel-2 NBAR products. These products were generated through the c-factor approach (Roy et al., 2016). We implemented a Python package that executes the c-factor approach and several other auxiliary packages and tools. Good open data practices were adopted to allow full reproducibility and replicability (Peng, 2011; Lowndes et al., 2017).
Alongside the paper, a minimal example of the research was prepared. This example contains a sample of the used satellite data, all the libraries, and the code required to process and analyze the results as well as containerized environments to allow transparency by running the code under the same conditions as performed on the complete data set. The data analysis was performed by comparing most affected regions with forward and backscattering effects, in this case regions close to the image borders in which several images overlap. Level-2 (Surface Reflectance) Landsat-8 Collection 2 data and Level-1C (Top of Atmosphere) Sentinel-2 products were acquired. Sentinel-2/MSI images were processed to surface reflectance through Land Surface Reflectance Code (LaSRC) or Sen2cor. Surface Reflectance Data from both were compared as single and multisensor data. After that, the Surface Reflectance images were processed to the NBAR level, and the same comparisons were made but using the NBAR products. The analysis results show that NBAR corrections improved data similarity of close-in-time images (Roy et al., 2016; Claverie et al., 2018).
2 Materials and methods
2.1 BRDF correction
Remote sensing observations are influenced by the Sun-Sensor Geometry Effects, which are described by the BRDF. The surface reflectance measured by an orbital sensor is influenced by changes in the Sun-Sensor geometry due to differences in azimuth and zenith angles. Scattering models can be used to estimate Bidirectional Reflectance Factors (BRFs) as if they were observed in a specific view and Sun zenith angles. Nadir BRDF-Adjusted Reflectance (NBAR) products are surface reflectance estimated through a scattering model at nadir (0° view zenith) and a specified solar zenith angle.
Recently, global coefficients were used to correct BRDF effects through the c-factor approach for each spectral band (Roy et al., 2016). It has been evaluated for Landsat Time Series (4–8) (Roy et al., 2016; Qiu et al., 2019; Guan et al., 2020) and Sentinel-2/MSI (Mandanici and Bitelli, 2016; Roy et al., 2017; Kremezi and Karathanassi, 2019; Nguyen et al., 2020), and it is also being used to generate the Harmonized Landsat Sentinel (HLS) products (Claverie et al., 2018). The method generates adjusted reflectance calculated using the original reflectance and a c-factor (Eq. 1), which is calculated as the ratio between normalized and sensor BRFs (Eq. 2).
The c-factor BRF is based on the Ross-Thick/Li-Sparse-Reciprocal (RTLSR) model (Eq. 3), which defines reflectance in terms of three basic scattering types: isotropic, volumetric, and geometric. The isotropic scattering describes Lambertian reflectance assumed to be an intrinsic property of an observed target, independent of Sun and observation geometry (Wagner et al., 2015).
RTLSR is calculated as a weighted sum of the isotropic, volumetric and geometric scattering terms, f iso , f vol , f geo , respectively, and the volumetric and geometric scattering kernels, K vol and K geo , respectively, as can be seen in Eq. 3. f iso , f vol , f geo are spectrally dependent BRDF model parameters (Schaaf et al., 2002; 2011), with fixed values for each spectral band (Roy et al., 2016) as can be seen in Table 1.
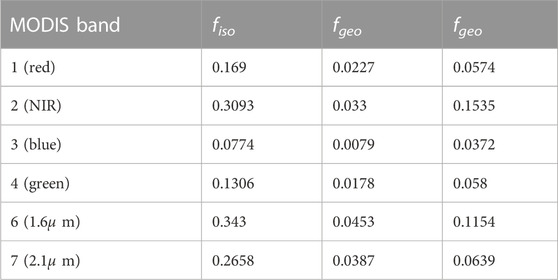
TABLE 1. BRDF coefficients used for the c-factor technique (Roy et al., 2016). Source: (Claverie et al., 2018).
The K vol is calculated using the Ross-Thick from the radiative transfer model (Ross, 1981) through Eqs 4, 5.
The K geo is calculated using the Li-Sparce-Reciprocal from surface scattering and geometric shadow casting theory (Li and Strahler, 1992) through Eqs 6–12.
2.2 Study area
Landsat-8 can revisit the same location in at least 16 days, with an overlap between adjacent Landsat-8 orbits that acquire images with 7–9 days of difference. This characteristic also happens for Sentinel-2/MSI images, with a 5-day revisit rate (considering both Sentinel-2A and Sentinel-2B), also presenting more frequent revisits for adjacent orbits overlap areas. This effect is beneficial to this study since the border between the images is more affected by view angle variation. However, there are a few regions where the Landsat overlapping orbit areas overlap with the sentinel-2 overlap areas. One of these areas occurs at Rio Grande do Sul in the south of Brazil, as can be seen in Figure 1, in the WRS2 path rows 223081 and 223082 and at MGRS Granule 22JBM.
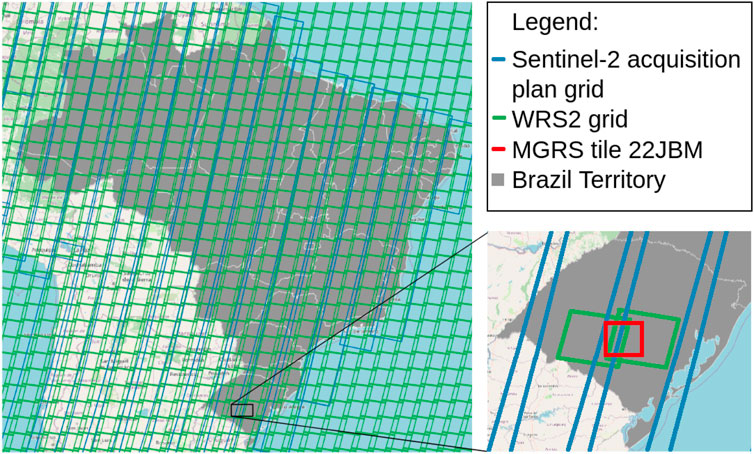
FIGURE 1. Landsat-8/OLI WRS2 Grid (Green), Sentinel-2 acquisition plan Grid (2018) and overlapping orbit area in the south of Brazil, Rio Grande do Sul State, at WRS2 path rows 223081 and 223082 and at MGRS Granule 22JBM.
2.3 Experiment
For this study, we have selected images ranging from 2017 to 2020 from both Sentinel-2 and Landsat-8. Figure 2 illustrates the experiment processing diagram. It shows that Landsat-8/OLI Collection 2 images were acquired already processed as SR, Level 2, while Sentinel-2 images were processed to SR by Sen2cor or LaSRC through docker containers prepared for each processor. Once with the SR products, the angle bands were generated. Another docker containing the USGS Landsat Angles Creation Tool was used to generate the angle bands for the Landsat-8 data, while the s2angs Python package was used to generate the angle bands for the Sentinel-2 data. After that, the c-factor could be calculated and used to generate NBAR products. The sensor-harm Python package is capable of calculating and applying the c-factor on images from the sensors on board the Landsat satellites, while for Sentinel-2 data it also applies a bandpass coefficient, as performed by (Claverie et al., 2018). Then, it considers only pixels that were not masked as cloud, cloud shadows, or snow pixels, by each sensor’s cloud mask. Table 2 demonstrates the comparison performed to evaluate the differences between the used surface reflectance products.
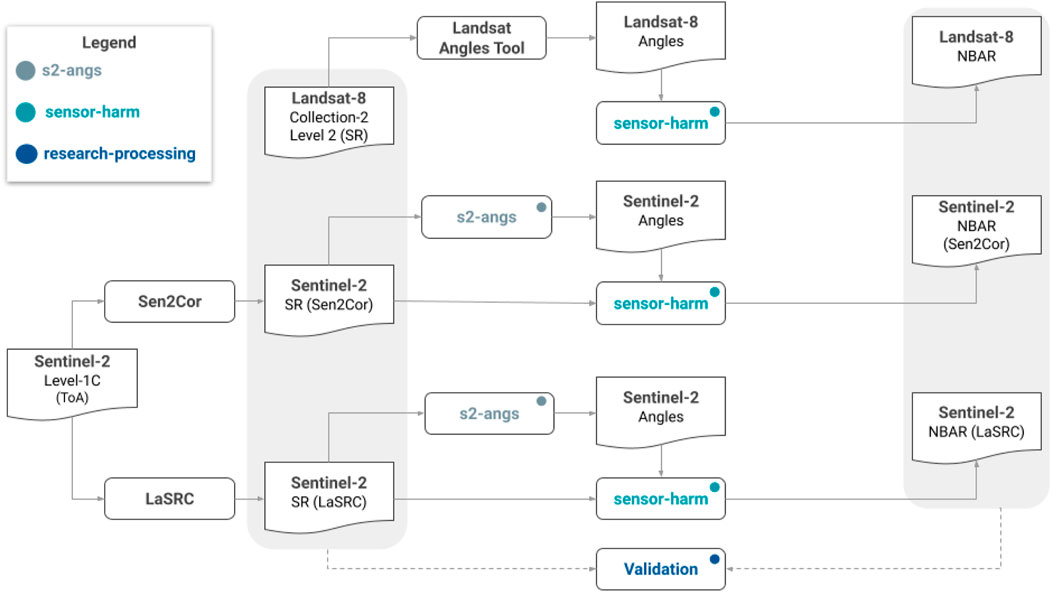
FIGURE 2. Experiment diagram.
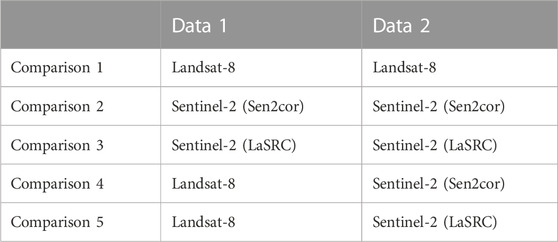
TABLE 2. Comparison datasets used for calculating surface reflectance differences.
These comparisons were performed using the Mean Absolute Difference
Note that several works have already compared the Surface Reflectance products from Landsat and Sentinel products (Claverie et al., 2018) and obtained feasible results using images acquired on the same day. Since our objective consists of analyzing these images as a series, we adopted a close-in-time period to perform the comparison. Considering that adjacent Landsat images can be acquired with 7–9 days of difference, Landsat-8 x Landsat-8 pairs were acquired considering images with fewer than 10 days of difference. For Sentinel-2, considering that it has a higher revisit rate, this difference was adopted considering a maximum distance of 5 days, which was also adopted when comparing Landsat-8 images to Sentinel-2 images. This approach was used to obtain close-in-time images. The assumption here is that each pair of values being compared should be almost equal, ignoring differences from atmospheric conditions and changes on the imaging point, e.g., vegetation growth.
After the SR products comparison, all these products were processed to NBAR through the c-factor approach and all comparisons were repeated using this level of processing, as demonstrated in Table 3.
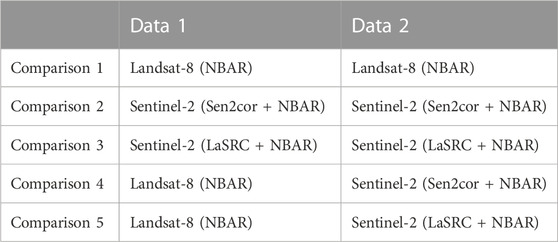
TABLE 3. Comparisons datasets used for calculating NBAR differences.
2.4 Software, reproducibility, and replicability
Since a few terminology differences can be found in the literature regarding the terms Replicability and Reproducibility, here we followed the Claerbout/Donoho/Peng terminology convention as presented by (Barba, 2018).
• Reproducible research: authors provide all the necessary data and the computer code to run the analysis again, re-creating the results.
• Replication: a study that arrives at the same scientific findings as another study, collecting new data (possibly with different methods) and completing new analyses.
To organize all the input data, code, processed data, and extracted information, the repository was organized as a Research Compendium (Gentleman and Temple Lang, 2007). A Research Compendium is a centralized unit that contains all objects of the research, which includes code, examples, and other research components that are controlled by a software system. This Research Compendium organizes the files in a structure that facilitates file sharing between different tools, maintaining a clear separation of which of these files are methods, input data (read-only), or output data (disposable) and specifies which software, considering its versioning, was originally used (Marwick et al., 2018). This Research Compedium is provided on the repository https://github.com/brazil-data-cube/compendium-harmonization.
Even though a software compilation can be in many times very straight forward, users may not be familiar with this process and can encounter difficulties performing it. In this context, Docker containers are a valid option to encapsulate software by providing virtualization, allowing code to be executed on environments with similar conditions to when it was initially created, facilitating reproducibility. Considering that this paper implemented the harmonization of Landsat and Sentinel-2 images through the c-factor approach, which has been described in Section 2.1 and requires other auxiliary methods to be executed, e.g., angle bands creation tool, containerization is a valid option to execute the same processing on different images and to allow the research workflow to be repeated by other users on the same or different data. Based on that, several docker images were created to process the data.
• Sen2cor Atmosphere Correction
• LaSRC Atmosphere Correction
• Landsat Angle Creation Tool
• Sensor Harmonization
2.5 Workflow
To easily control the execution of all the processes, trying to avoid the necessity of human intervention to run the workflow, the Research Compendium provides two workflow tools to orchestrate the execution of the research, a Jupyter Notebook and a dagster application. Both tools can be executed using docker containers in order to achieve reproduction and replicability. These workflow environments handle all details from the processing of the input data to the final results.
The Jupyter Notebook is commonly used in Python and R communities. It allows users to run blocks of code and text notations, providing a controlled flux of the processes. The main advantage of the Jupyter Notebooks is that it allows the combination of code executions with text explanations, equations, and figures that can help in the comprehension of the performing task. The dagster application presents the workflow in a visual interface of the processes and can be used to rerun the processing, execute the tasks concurrently, and even distribute them among multiple processing machines.
Considering that image processing can generate big data volumes and that this study alone generated over a Terabyte for a single study area, within this research repository, a minimal example is provided to allow reproduction. This example consists of four images: a pair from Landsat-8 and a pair from Sentinel-2. The results of the workflow using the minimal examples are presented in Appendix 3.2, while the results using the complete set of data are described in Section 3. Also, the workflow input data can be changed, allowing replication to different study areas or dates.
3 Results
In this section, the developed tools and the comparison results, described in Section 2.3, are presented. As mentioned in Section 2.4, alongside all the required code, to confirm the results obtained by this research, a minimum set is provided. The results for this minimum set follow the same structure of this section and are presented in the Appendix.
3.1 Processors
Sen2cor is the default atmosphere processor used to correct Sentinel-2 Level-1C (L1C) images (Main-Knorn et al., 2017). For processing the images of this research, we created a docker image, which is accessible through the repository at https://github.com/brazil-data-cube/sen2cor-docker. This image facilitates the installation and execution of Sen2cor for atmospheric correction of Sentinel-2 L1C images.
Regarding the LaSRC processor (Vermote et al., 2018), we created a docker image, which can be accessed through the repository at https://github.com/brazil-data-cube/lasrc-docker. This image facilitates the installation and execution of LaSRC. Notably, this image is capable of correcting Landsat-8 Collection-1 Level-1 images and Sentinel-2 L1C images. However, since this study acquired Landsat-8 Collection-2 images, already Level-2, we exclusively employed the LaSRC image to process the Sentinel-2 images.
USGS provides a tool to generate angle bands using auxiliary metadata. The installation of this software requires it to be compiled. To generate View Azimuth, View Zenith, Solar Azimuth, and Solar Zenith angle bands for each Landsat scene, the software uses a ANG.txt file provided with each Landsat scene. We created a docker image that installed the Landsat Angle Creation Tool and given a ANG.txt generates the angle bands. The Docker image is available on the repository https://github.com/brazil-data-cube/landsat-angles-docker.
Concerning Sentinel-2 data, it is important to note that angle bands are not included in the provided data. Instead, several 23 × 23 matrices can be found within image metadata and can be used to estimate the sensor angle bands in a 5000-m spatial resolution (Pahlevan et al., 2017). have developed a code to estimate per-pixel angles. It is worth mentioning that their code was made using Python 2, a deprecated version of Python. To harness the existing code effectively, we undertook the task of adapting it, incorporating novel features as required. This development resulted in a new Python Package. It allows users to extract per-pixel angle bands from Sentinel-2 data, and this package is maintained in https://github.com/brazil-data-cube/s2-angs.
The harmonization procedure was implemented as a Python package in the GitHub repository https://github.com/brazil-data-cube/sensor-harm. This library supports harmonizing images from Landsat four to eight and Sentinel-2 images, even though in this study, Landsat four to seven were not used. It implements the c-factor method (Roy et al., 2016) and bandpass, as used in (Claverie et al., 2018), and, for doing so, it requires per-pixel angle bands, as described in 2.1.
3.2 Quantification of the differences in surface reflectance and NBAR products
Tables 4, 5, 6 present, using the same metrics as in (Roy et al., 2017), the mean absolute reflectance
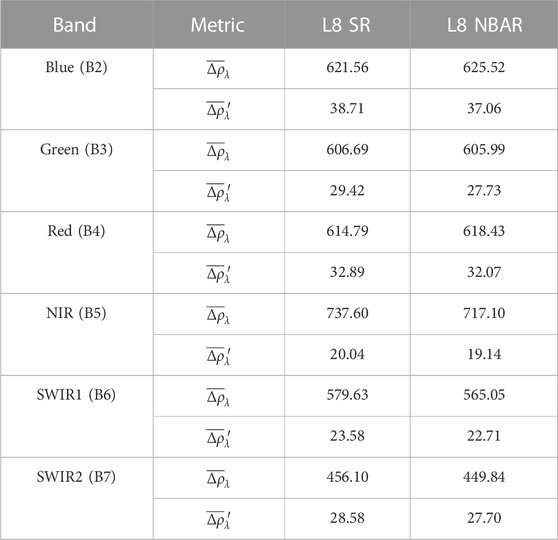
TABLE 4. Mean absolute reflectance differences
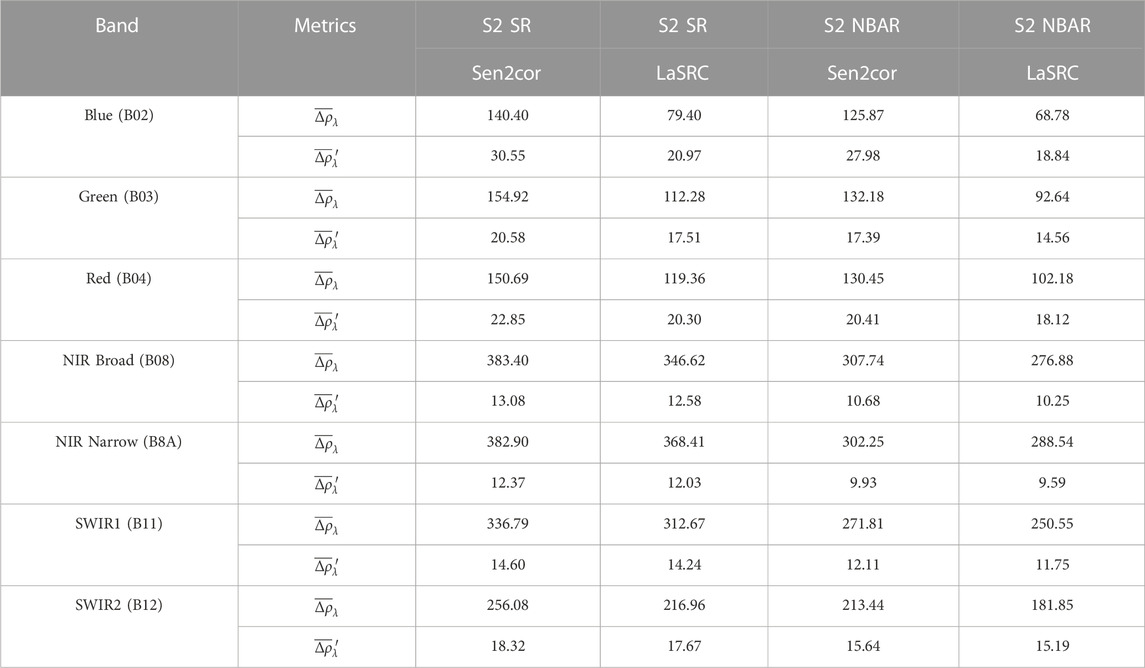
TABLE 5. Mean absolute reflectance differences
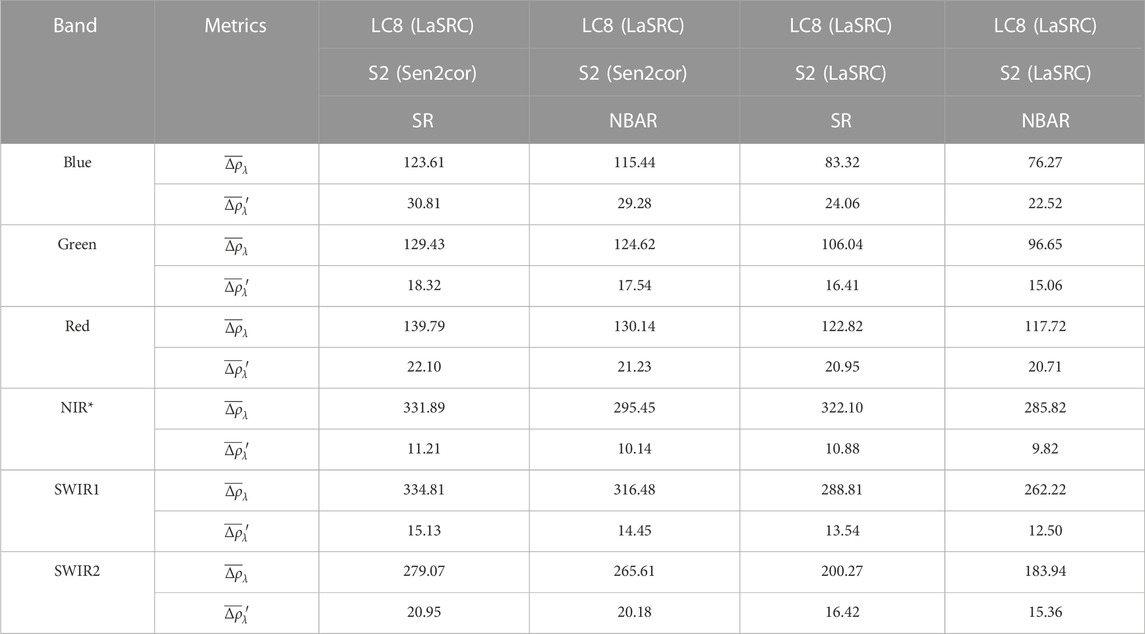
TABLE 6. Mean absolute reflectance differences
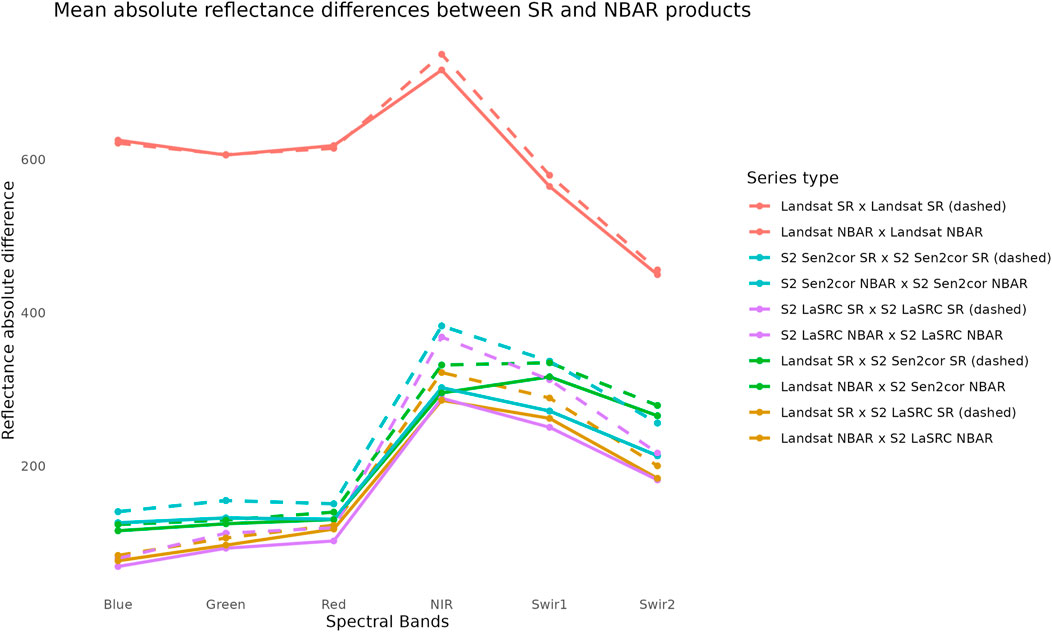
FIGURE 3. Mean absolute reflectance differences
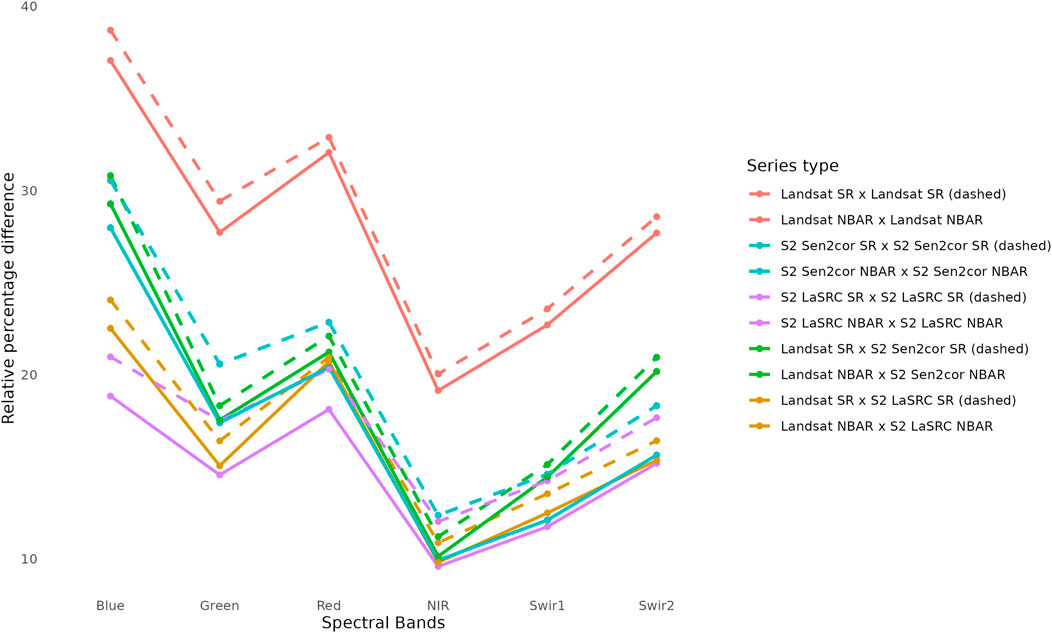
FIGURE 4. Mean absolute relative reflectance percentage differences
Although NBAR products also represent surface reflectance measurements (adjusted), here we will address by SR the products without the BRDF corrections while NBAR the products containing the c-factor correction. The results show that SR products are more heterogeneous than NBAR products, since for all sensor combinations, all bands of the NBAR products presented less difference than the Surface Reflectance products when considering mean absolute relative percentage. This corroborates the feasibility of the c-factor approach (Roy et al., 2016) to standardize Landsat-8 and Sentinel-2 measurements and the results obtained by (Roy et al., 2016; 2017; Claverie et al., 2018; Poortinga et al., 2019; Guan et al., 2020; Nguyen et al., 2020).
Analyzing the results on Tables 4, Table 5 we can observe that Landsat-8 is less affected by the BRDF effects than Sentinel-2 data, as, when considering the single sensor approach, Landsat-8 NBAR is more similar to Landsat-8 SR than Sentinel-2 NBAR is to Sentinel-2 SR. This was expected since the Sentinel-2 swath is wider than Landsat-8’s.
Table 6 illustrates a noteworthy observation: Landsat-8/OLI images, subjected to surface reflectance correction via LaSRC, exhibit a closer resemblance to Sentinel-2/MSI images that have undergone LaSRC correction, as opposed to those that have been processed with Sen2cor. This alignment in results was anticipated, a pattern also identified by (Marujo et al., 2021). Such consistency is to be expected given that LaSRC and Sen2cor employ distinct models for atmospheric correction. Consequently, these differences manifest in the surface reflectance (SR) products.
It is crucial to note, however, that this observation does not imply a superiority of one atmospheric correction method over the other. Rather, it indicates to use the same atmosphere correction algorithm to correct all images on the analyzed series to avoid differences in data due to differences in the atmosphere correction modeling.
It is expected that this effect occurs in other areas, as have also been observed by (Roy et al., 2016; 2017; Claverie et al., 2018; Poortinga et al., 2019; Guan et al., 2020; Nguyen et al., 2020). Based on that, to be able to quantify the SR and NBAR differences, it is recommended to replicate this study on different areas, a task that can be performed using the free and open-source code developed and provided alongside this research.
For this study area, we could observe that NBAR images were more similar to themselves than the SR products, reducing the mean absolute relative percentage differences. This can be noted in Figures 3, 4 as the dashed lines (SR) are mainly above the continuous lines (NBAR) for each experiment pair comparison (same color).
From Figure 3 we can also note that NIR and SWIR bands presented for Sentinel-2, higher differences when considering absolute values, which we can see from Figure 4 only occurred due to the high surface reflectance values measurements, probably caused by vegetated samples.
Still from Figures 3, 4 one can note that the pattern observed for each SR comparison is the same obtained for the NBAR comparison, though the NBAR pattern is smaller. This reinforces that the NBAR product is reducing the differences between the compared products even for the most affected pixels in a scene, the ones near the image border that are most affected from greater angle variation.
3.3 Reproducibility minimum example
Considering that the reproduction of our experiment would be a time-consuming task, we prepared a minimum example that uses few images. More specifically two Landsat-8 and two Sentinel-2 images, as bellow.
• LC08_L2SP_222081_20171120_20200902_02_T1
• LC08_L2SP_223081_20171111_20200902_02_T1
• S2B_MSIL1C_20171119T133209_N0206_R081_T22JBM_20171120T175608.SAFE
• S2B_MSIL1C_20171122T134159_N0206_R124_T22JBM_20171122T200800.SAFE
Our entire methodology can be reproduced using the compendium repository. Even the input images are being stored in it. As a result, we obtained similar results in comparison to the experiment using the entire image dataset. The mean absolute reflectance
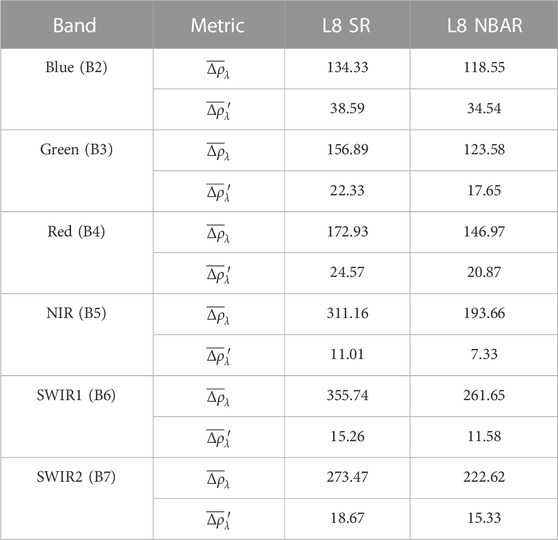
TABLE 7. Minimal example mean absolute reflectance differences
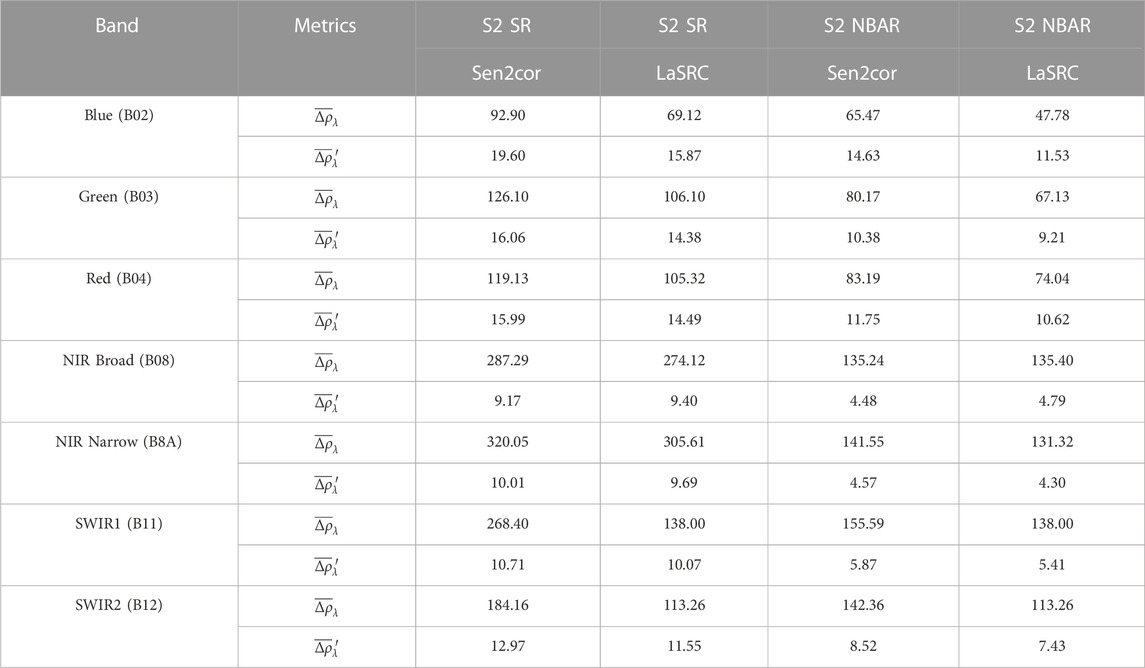
TABLE 8. Minimal example mean absolute reflectance differences
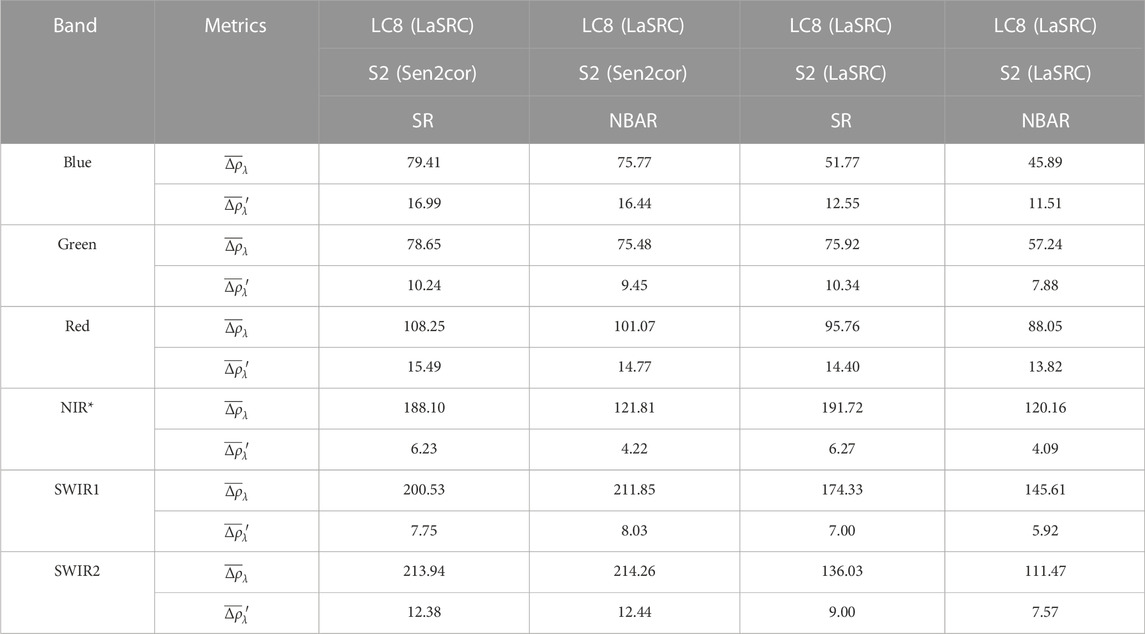
TABLE 9. Minimal example mean absolute reflectance differences
4 Discussion
A total of 67 Landsat-8, and 144 Sentinel-2 images were used to evaluate the differences between SR and NBAR products. Previous research has concluded that the c-factor method (Roy et al., 2016) offers a pertinent approach for correcting data from narrow-view sensors through the use of global parameters. This approach has proven valuable for achieving spectral harmonization between images from Landsat-8/OLI and Sentinel-2/MSI sensors (Claverie et al., 2015). However, due to the quantity of computations and the absence of open-source tools, it is difficult to reproduce, replicate, and improve the existing method.
Although there are initiatives to allow users to process their own data and generate harmonized datasets, e.g., Sen2like (Saunier et al., 2019) and F.O.R.C.E (Frantz, 2019), and even ready-to-use products, such as HLS (Claverie et al., 2018), we must continue to strengthen open science and provide to users the tools and products for their research. The contributions of this research are threefold. Firstly, it corroborates existing studies concerning the efficacy of the c-factor approach in harmonizing Landsat-8 and Sentinel-2 data. Secondly, it brings forth an open-source package containing an implementation of the method in a language commonly used by researchers who are not computer programming experts, in this case, Python. Lastly, it provides a Research Compendium containing detailed information regarding data organization and code documentation to allow users to reproduce this work through embed environments and be capable of replicating it if desired.
We observed that NBAR images were more similar than the images prior to the harmonization. It is, however, important to acknowledge that various sources of uncertainty were not considered during these comparisons, including factors such as geometric distortions and cloud mask failures. We were able to adopt this approach since the same validation pairs were used to perform the comparisons pre- and post-harmonization. Consequently, comparable uncertainties were uniformly present in both scenarios. Given that the primary aim of this research was to provide users with an open-source tool so they can process their images at will and not to reaffirm the method’s robustness, we accepted these conditions and corroborated improvements when using the NBAR.
The method implemented here is the same used by NASA’s HLS first version (Claverie et al., 2015). Even though recently the HLS version 2 was released, it also lacks an open-source code, as did its first version. To not provide tools allowing users to process images areas themselves is to restrain the users to already processed areas, limiting the research they can perform. When HLS version 1 was launched, Brazil was provided with fewer than 30 MGRS (Military Grid Reference System) tiles. Since Brazil overlaps a total of 1045 MGRS, it is necessary to create the tools that allow researchers to process their intended study areas. With this work, we hope to improve the habits of code sharing, not only for this area of remote sensing but for research in general.
As for future works, we intend to replicate this study on different study areas, test the implemented method on multiple decades time series and apply the c-factor approach on other less commonly used sensors, as well as implement, as a free and open-source code, different NBAR methods, including the more recent versions of existing methods. We also intend to implement methods suitable for correcting wide view angle satellite sensors, e.g., CBERS-4A/WFI and Amazonia/WFI, since the c-factor has limitations regarding the viewing amplitude.
Data availability statement
The datasets presented in this study can be found in online repositories. The names of the repository/repositories and accession number(s) can be found below: https://github.com/brazil-data-cube/compendium-harmonization, https://github.com/brazil-data-cube/sensor-harm, https://github.com/brazil-data-cube/sen2cor-docker, https://github.com/brazil-data-cube/lasrc-docker, https://github.com/brazil-data-cube/s2-angs, https://github.com/brazil-data-cube/landsat-angles-docker.
Author contributions
RM: Conceptualization, Data curation, Formal Analysis, Investigation, Methodology, Software, Validation, Writing–original draft, Writing–review and editing. FC: Methodology, Software, Validation, Writing–original draft. RC: Methodology, Software, Writing–original draft. JA: Software, Writing–review and editing. JF: Conceptualization, Methodology, Validation, Writing–review and editing. AS: Conceptualization, Methodology, Writing–review and editing. GQ: Funding acquisition, Resources, Software, Supervision, Writing–review and editing. KF: Funding acquisition, Resources, Supervision, Writing–review and editing.
Funding
This research was supported by the Amazon Fund through the financial collaboration of the Brazilian Development Bank (BNDES) and the Foundation for Science, Technology and Space Applications (FUNCATE), process 17.2.0536.1.
Conflict of interest
AS was employed by Cognizant Technology Solutions Corporation.
The authors declare that the research was conducted in the absence of any commercial or financial relationships that could be construed as a potential conflict of interest.
Publisher’s note
All claims expressed in this article are solely those of the authors and do not necessarily represent those of their affiliated organizations, or those of the publisher, the editors and the reviewers. Any product that may be evaluated in this article, or claim that may be made by its manufacturer, is not guaranteed or endorsed by the publisher.
References
Barba, L. A. (2018). Terminologies for reproducible research. Available at: https://arxiv.org/abs/1802.03311.
Claverie, M., Ju, J., Masek, J. G., Dungan, J. L., Vermote, E. F., Roger, J. C., et al. (2018). The Harmonized Landsat and Sentinel-2 surface reflectance data set. Remote Sens. Environ. 219, 145–161. doi:10.1016/j.rse.2018.09.002
Claverie, M., Vermote, E., Franch, B., He, T., Hagolle, O., Kadiri, M., et al. (2015). Evaluation of medium spatial resolution BRDF-adjustment techniques using multi-angular SPOT4 (Take5) acquisitions. Remote Sens. 7, 12057–12075. doi:10.3390/rs70912057
Ferreira, K. R., Queiroz, G. R., Vinhas, L., Marujo, R. F. B., Simoes, R. E. O., Picoli, M. C. A., et al. (2020). Earth observation data cubes for Brazil: requirements, methodology and products. Remote Sens. 12, 4033. doi:10.3390/rs12244033
Flood, N. (2013). Testing the local applicability of MODIS BRDF parameters for correcting Landsat TM imagery. Remote Sens. Lett. 4, 793–802. doi:10.1080/2150704X.2013.798709
Frantz, D. (2019). Force—Landsat + sentinel-2 analysis ready data and beyond. Remote Sens. 11, 1124. doi:10.3390/rs11091124
Gao, F., He, T., Masek, J. G., Shuai, Y., Schaaf, C. B., and Wang, Z. (2014). Angular effects and correction for medium resolution sensors to support crop monitoring. IEEE J. Sel. Top. Appl. Earth Observations Remote Sens. 7, 4480–4489. doi:10.1109/JSTARS.2014.2343592
Gao, F., Masek, J., Schwaller, M., and Hall, F. (2006). On the blending of the landsat and MODIS surface reflectance: predicting daily landsat surface reflectance. IEEE Trans. Geoscience Remote Sens. 44, 2207–2218. doi:10.1109/TGRS.2006.872081
Gentleman, R., and Temple Lang, D. (2007). Statistical analyses and reproducible research. J. Comput. Graph. Statistics 16, 1–23. doi:10.1198/106186007X178663
Giuliani, G., Chatenoux, B., De Bono, A., Rodila, D., Richard, J.-P., Allenbach, K., et al. (2017). Building an earth observations data cube: lessons learned from the swiss data cube (sdc) on generating analysis ready data (ard). Big Earth Data 1, 100–117. doi:10.1080/20964471.2017.1398903
Guan, Y., Zhou, Y., He, B., Liu, X., Zhang, H., and Feng, S. (2020). Improving land cover change detection and classification with BRDF correction and spatial feature extraction using landsat time series: A case of urbanization in tianjin, China. IEEE J. Sel. Top. Appl. Earth Observations Remote Sens. 13, 4166–4177. doi:10.1109/JSTARS.2020.3007562
Hernández-López, D., Piedelobo, L., Moreno, M. A., Chakhar, A., Ortega-Terol, D., and González-Aguilera, D. (2021). Design of a local nested Grid for the optimal combined use of landsat 8 and sentinel 2 data. Remote Sens. 13, 1546. doi:10.3390/rs13081546
Kabir, S., Leigh, L., and Helder, D. (2020). Vicarious methodologies to assess and improve the quality of the optical remote sensing images: A critical review. Remote Sens. 12, 4029. doi:10.3390/rs12244029
Kremezi, M., and Karathanassi, V. (2019). “Correcting the BRDF effects on Sentinel-2 ocean images,” in Proceedings of the IGARSS 2019 - 2019 IEEE International Geoscience and Remote Sensing Symposium, Yokohama, Japan, August 2019. doi:10.1117/12.2533653
Li, X., and Strahler, A. (1992). Geometric-optical bidirectional reflectance modeling of the discrete crown vegetation canopy: effect of crown shape and mutual shadowing. IEEE Trans. Geoscience Remote Sens. 30, 276–292. doi:10.1109/36.134078
Lowndes, J. S., Best, B. D., Scarborough, C., Afflerbach, J. C., Frazier, M. R., O’Hara, C. C., et al. (2017). Our path to better science in less time using open data science tools. Nat. Ecol. Evol. 1, 0160. doi:10.1038/s41559-017-0160
Main-Knorn, M., Pflug, B., Louis, J., Debaecker, V., Müller-Wilm, U., and Gascon, F. (2017). “Sen2Cor for sentinel-2,” in Proceedings of the Image and Signal Processing for Remote Sensing, Bellingham, Washington USA, October 2017. doi:10.1117/12.2278218
Mandanici, E., and Bitelli, G. (2016). Preliminary comparison of sentinel-2 and landsat 8 imagery for a combined use. Remote Sens. 8, 1014. doi:10.3390/rs8121014
Marujo, R. F. B., Fronza, J. G., Soares, A. R., Queiroz, G. R., and Ferreira, K. R. (2021). Evaluating the impact of lasrc and sen2cor atmospheric correction algorithms on landsat-8/oli abd sentinel-2/msi data over aeronet stations in brazilian territory. ISPRS Ann. Photogrammetry, Remote Sens. Spatial Inf. Sci. V- 3-2021, 271–277. doi:10.5194/isprs-annals-v-3-2021-271-2021
Marwick, B., Boettiger, C., and Mullen, L. (2018). Packaging data analytical work reproducibly using R (and friends). Am. Statistician 72, 80–88. doi:10.1080/00031305.2017.1375986
Nguyen, M., Baez-Villanueva, O., Bui, D., Nguyen, P., and Ribbe, L. (2020). Harmonization of landsat and sentinel 2 for crop monitoring in drought prone areas: case studies of ninh thuan (vietnam) and bekaa (Lebanon). Remote Sens. 12, 281. doi:10.3390/rs12020281
Nüst, D., and Pebesma, E. (2020). Practical reproducibility in geography and geosciences. Ann. Am. Assoc. Geogr. 111, 1300–1310. doi:10.1080/24694452.2020.1806028
Pahlevan, N., Sarkar, S., Franz, B. A., Balasubramanian, S. V., and He, J. (2017). Sentinel-2 MultiSpectral Instrument (MSI) data processing for aquatic science applications: demonstrations and validations. Remote Sens. Environ. 201, 47–56. doi:10.1016/j.rse.2017.08.033
Peng, R. D. (2011). Reproducible research in computational science. Science 334, 1226–1227. doi:10.1126/science.1213847
Piccolo, S. R., and Frampton, M. B. (2016). Tools and techniques for computational reproducibility. GigaScience 5, 30–13. doi:10.1186/s13742-016-0135-4
Poortinga, A., Tenneson, K., Shapiro, A., Nquyen, Q., Aung, K. S., Chishtie, F., et al. (2019). Mapping plantations in Myanmar by fusing Landsat-8, Sentinel-2 and Sentinel-1 data along with systematic error quantification. Remote Sens. 11. doi:10.3390/rs11070831
Qiu, S., Lin, Y., Shang, R., Zhang, J., Ma, L., and Zhu, Z. (2019). Making landsat time series consistent: evaluating and improving landsat analysis ready data. Remote Sens. 11, 51. doi:10.3390/rs11010051
Ross, J. (1981). The radiation regime and architecture of plant stands. Dordrecht: Springer Netherlands. doi:10.1007/978-94-009-8647-3
Roy, D. P., Li, J., Zhang, H. K., Yan, L., Huang, H., and Li, Z. (2017). Examination of Sentinel-2A multi-spectral instrument (MSI) reflectance anisotropy and the suitability of a general method to normalize MSI reflectance to nadir BRDF adjusted reflectance. Remote Sens. Environ. 199, 25–38. doi:10.1016/j.rse.2017.06.019
Roy, D. P., Zhang, H. K., Ju, J., Gomez-Dans, J. L., Lewis, P. E., Schaaf, C. B., et al. (2016). A general method to normalize Landsat reflectance data to nadir BRDF adjusted reflectance. Remote Sens. Environ. 176, 255–271. doi:10.1016/j.rse.2016.01.023
Saunier, S., Louis, J., Debaecker, V., Beaton, T., Cadau, E. G., Boccia, V., et al. (2019). “Sen2like, a tool to generate sentinel-2 harmonised surface reflectance products - first results with landsat-8,” in Proceedings of the IGARSS 2019 - 2019 IEEE International Geoscience and Remote Sensing Symposium, Yokohama, Japan, August 2019, 5650–5653. doi:10.1109/IGARSS.2019.8899213
Schaaf, C. B., Gao, F., Strahler, A. H., Lucht, W., Li, X., Tsang, T., et al. (2002). First operational BRDF, albedo nadir reflectance products from MODIS. Remote Sens. Environ. 83, 135–148. doi:10.1016/S0034-4257(02)00091-3
Schaaf, C. B., Liu, J., Gao, F., and Strahler, A. H. (2011). Land remote Sensing and global environmental change, vol. 11 of remote Sensing and digital image processing. New York, NY: Springer. doi:10.1007/978-1-4419-6749-7
Schaepman-Strub, G., Schaepman, M., Painter, T., Dangel, S., and Martonchik, J. (2006). Reflectance quantities in optical remote sensing—Definitions and case studies. Remote Sens. Environ. 103, 27–42. doi:10.1016/j.rse.2006.03.002
Siqueira, A., Tadono, T., Rosenqvist, A., Lacey, J., Lewis, A., Thankappan, M., et al. (2019). “CEOS analysis ready data for land – an overview on the current and future work,” in Proceedings of the IGARSS 2019 - 2019 IEEE International Geoscience and Remote Sensing Symposium, Yokohama, Japan, August 2019 (IEEE), 5536–5537. doi:10.1109/IGARSS.2019.8899846
Stoddart, C. (2016). Is there a reproducibility crisis in science? Nature 3. doi:10.1038/d41586-019-00067-3
Vermote, E., Roger, J. C., Franch, B., and Skakun, S. (2018). “LASRC (land surface reflectance code): overview, application and validation using MODIS, VIIRS, LANDSAT and sentinel 2 data’s,” in Proceedings of the International Geoscience and Remote Sensing Symposium (IGARSS), Valencia, Spain, 2018-July, 8173–8176. doi:10.1109/IGARSS.2018.8517622
Wagner, F. H., Brede, B., Verbesselt, J., and Aragão, L. E. O. C. (2015). Correction of sun-sensor geometry effects from MODIS MCD43A1 product for tropical forest applications. An. XVII Simpósio Bras. Sensoriamento Remoto - SBSR 17, 1097–1104.
Wulder, M. A., Hilker, T., White, J. C., Coops, N. C., Masek, J. G., Pflugmacher, D., et al. (2015). Virtual constellations for global terrestrial monitoring. Remote Sens. Environ. 170, 62–76. doi:10.1016/j.rse.2015.09.001
Zhang, H. K., and Roy, D. P. (2016). Landsat 5 Thematic Mapper reflectance and NDVI 27-year time series inconsistencies due to satellite orbit change. Remote Sens. Environ. 186, 217–233. doi:10.1016/j.rse.2016.08.022
Keywords: bidirectional reflectance distribution function (BRDF), landsat, sentinel, NBAR, reproducibility Frontiers
Citation: Marujo RdFB, Carlos FM, Costa RWd, Arcanjo JdS, Fronza JG, Soares AR, Queiroz GRd and Ferreira KR (2023) A reproducible and replicable approach for harmonizing Landsat-8 and Sentinel-2 images. Front. Remote Sens. 4:1254242. doi: 10.3389/frsen.2023.1254242
Received: 06 July 2023; Accepted: 22 August 2023;
Published: 13 September 2023.
Edited by:
Tongwen Li, Sun Yat-sen University, ChinaReviewed by:
Peter A. Strobl, European Commission, ItalyHenning Buddenbaum, University of Trier, Germany
Copyright © 2023 Marujo, Carlos, Costa, Arcanjo, Fronza, Soares, Queiroz and Ferreira. This is an open-access article distributed under the terms of the Creative Commons Attribution License (CC BY). The use, distribution or reproduction in other forums is permitted, provided the original author(s) and the copyright owner(s) are credited and that the original publication in this journal is cited, in accordance with accepted academic practice. No use, distribution or reproduction is permitted which does not comply with these terms.
*Correspondence: Rennan de Freitas Bezerra Marujo, cmVubmFuLm1hcnVqb0BpbnBlLmJy